Davanagere City Bus Service - Directorate of Urban …urbantransport.kar.gov.in/Davanagere city bus...
42
Davanagere City Bus Service Evaluation Report August, 2013 Directorate of Urban Land Transport
Transcript of Davanagere City Bus Service - Directorate of Urban …urbantransport.kar.gov.in/Davanagere city bus...
Davanagere City Bus Service
Evaluation Report
August, 2013
Directorate of Urban Land Transport

Contents
1 INTRODUCTION 1
1.1 Background 1
1.2 Davanagere City at a Glance 2
1.3 Demographics of Davanagere City 3
1.4 Financing of City Bus Services in Davanagere 3
1.5 Davanagere City Transport Service 4
2 PERFORMANCE EVALUATION METHODOLOGY 6
2.1 Performance Review Methodology 6
2.1.1 Evaluation based on Service Level Benchmarks (As specified by the MoUD) 6
2.1.2 Evaluation based on various perspectives 7
3 PERFORMANCE EVALUATION 8
3.1 Performance Evaluation of Public Transportation System for a Medium sized city 8
3.1.1 City Perspective 9
3.1.1.1 Level of Service-City perspective 12
3.1.2 User perspective 14
3.1.2.1 Level of Service chart- User perspective 17
3.1.3 Operators perspective 20
3.1.3.1 Level of service chart- Operators perspective 24
4 BUS OPERATION IMPACTS 28
4.1 Passenger Convenience 28
4.2 Impact on the user 28
5 CONCLUSION 29
List of Table
Table 1-1: Demographic Details ............................................................................................................... 3
Table 1-2: Details of Bus Route ................................................................................................................ 4
Table 1-3: Route Details ........................................................................................................................... 5
Table 3-1: Level of service- City perspective .......................................................................................... 13
Table 3-2: Level of service- Commuters perspective ............................................................................. 19
Table 3-3: Performance Indicators ........................................................................................................ 22
Table 3-4: Operators perspective .......................................................................................................... 25
List of Figure
Figure 1-1: Davanagere Map .................................................................................................................... 2
Figure 1-2: Passengers Carried................................................................................................................. 4
Figure 3-1: Mode share before and after the introduction of City Service ........................................... 11
Figure 3-2: Mode Wise Trip Length........................................................................................................ 12
Figure 3-3: Photographs of passenger opinion survey .......................................................................... 15
Figure 3-4: Comparison of Various parameters ..................................................................................... 27
Davanagere City Bus Service Evaluation Report 2013
1 | P a g e
1 Introduction
1.1 Background
Effective operation of urban bus system is vital for the development of any city. There is a
widespread reliance on public transport, providing mobility within urban areas throughout
the world. However, public prefer to use private vehicles due to the inefficient operation of
city bus service in most of the Indian cities. The private vehicles vying for limited road space
along with buses has resulted in congestion, accidents and vehicular pollution in most of the
Indian cities. The problem of pollution, safety and inefficiency have reached an alarming
level in most of the major cities in India due to the unabated growth of population - both
people and motor vehicles. Thus, there is an immediate need to improve the performance of
bus system to retain the passengers and discourage the use of private vehicles.
Buses can operate over existing roadway facilities with minimum construction cost, offer
transit services at a much lower cost per passenger. Furthermore, buses provide the greatest
flexibility in service routes to meet the current transport demand. Thus, improved
performance of urban bus service could essentially contribute to improved environmental
conditions in medium sized cities by shifting mobility from private modes towards more
efficient environmental-friendly and safer travel modes. However, improvement in City bus
system is not an easy task due to the fact that city bus systems are affected by socio-
economic, financial, environmental, and political factors along with technological factors and
physical problems. Performance of a bus system is affected by several criteria, such as
increase in the number of buses, bus stops, and passengers, and changes along roadways
and in land uses. Therefore, the various issues causing inefficient operation of bus services
needs to be identified and also appropriate techniques/measures should be formulated to
resolve these issues.
The Government of Karnataka created the Directorate of Urban Land Transport (DULT) under
the Urban Development Department to integrate and coordinate all land transport matter in
the State. Directorate of Urban Land Transport (DULT), Government of Karnataka, took up
the initiative of supporting the introduction of city bus services in Tier II cities. In this regard,

Davanagere City Bus Service Evaluation Report 2013
2 | P a g e
Performance evaluation was conducted for the newly introduced City Bus Services partly
funded from State Urban Transport Fund through DULT for Davanagere City.
In the above context, this study identifies some of the important issues related with the
performance of newly introduced bus system in Davanagere city and also suggests some
solutions for improvement in the performance of the City bus system. Rapidly rising
operating cost in the City bus services have placed increasing emphasis on improved
management and better utilization of existing facilities. It is required to evaluate how well
the existing city bus system is providing services to the public. Therefore, new techniques to
assist the evaluation of performance of City bus services are needed. Thus, this study also
presents some indicators which can be used to evaluate efficiency and effectiveness of urban
bus service. It is expected that this study will be useful to improve the efficiency and
effectiveness of bus system in urban area.
1.2 Davanagere City at a Glance
Davanagere is considered to be the "Heart of
Karnataka". The city is 265 km away from Bangalore city.
Davanagere District is surrounded by Chitradurga,
Bellary, Shimoga, Chikmagalur and Haveri districts.
Davanagere city is the administrative headquarters of
Davanagere district and the Bangalore-Pune national
highway (NH4) which is the part of the Golden
Quadrilateral network passes through Davangere.
Davanagere became a separate district in 1997
separating from the district of Chitradurga for
Administration conveniences. This city is also famous for
tourist places like Kunduvada kere, Batti Gudda, Eshwara
temple at Anekonda, Soole Kere etc.
Figure 1-1: Davanagere Map

Davanagere City Bus Service Evaluation Report 2013
3 | P a g e
1.3 Demographics of Davanagere City
Population growth in Davanagere City during 2001 to 2011 is about 19.61% as compared to
15.67% for Karnataka State. The registered vehicular population as per RTO office till May
2012 in the Davangere taluk is 1,45,726 of which 1,22,665 came from motorcycles alone.
Private buses and other Para-transits (auto-rickshaws) were the key mode of travel available
in Davangere city in the absence of the public transport. The Demographic details are as
shown in Table 1.1.
Table 1-1: Demographic Details
Sl. No. Year Davanagere District Davanagere City
Population Growth (%) Population Growth (%)
1 1981 1,266,938 32.44% 1,96,481 62.23%
2 1991 1,559,222 23.07% 2,66,082 35.42%
3 2001 1,790,952 14.86% 3,64,528 36.97%
4 2011 1,946,905 8.71% 4,35,128 19.61%
(Source: Census of India)
1.4 Financing of City Bus Services in Davanagere
The city faces certain key challenges with urban mobility especially with the lack of an
effective public transport which is hindering the smooth urban function. As a consequence,
the residents rely on personalized modes and Para-transits. With an unregulated Para-transit
the commuter ends up paying a high price for commute.
In this regard, a proposal for the induction of 20 buses in Davanagere was proposed by
Karnataka State Road Transport Corporation (KSRTC) in September 2010 and sent to
Government of Karnataka (GoK) seeking financial assistance. Considering the need and
demand of the city for a dedicated city service to cater the need of the sprawling urban
population in Davanagere, it was proposed to fund 50% of the sought amount for the rolling
stock. The remaining 50% of the amount was borne by KSRTC. Hence, the funding was done
for the augmentation of the rolling stock through Directorate of Urban Land Transport
(DULT), UDD, Gok, as per the “Scheme of utilisation of State Urban Transport Fund”.
Davanagere City Bus Service Evaluation Report 2013
4 | P a g e
1.5 Davanagere City Transport Service
Davanagere City transport service was initiated on January 2012. Services on three routes
were started at first and gradually increased to four routes by May 2012. Presently, the
number of buses used for operation has increased to 22 from 21 in number due to the
addition of one new route. However, the interference of the Private bus operators and IPT is
a reason for less ridership in the city services.
The bus routes were selected by KSRTC considering the spatial configuration of city along the
key transportation networks and the key nodes of commuter transit. The origin and
destination of the bus routes operating inside the city are as shown in Table 1.2.
Table 1-2: Details of Bus Route
No. Routes Length (km)
1 Sriramnagar – Karur 13
2 Shamanur – University 16
3 Davangere – Harihara 14
4 Vidyanagara – Davangere University 16
(Source: Davangere KSRTC divisional office)
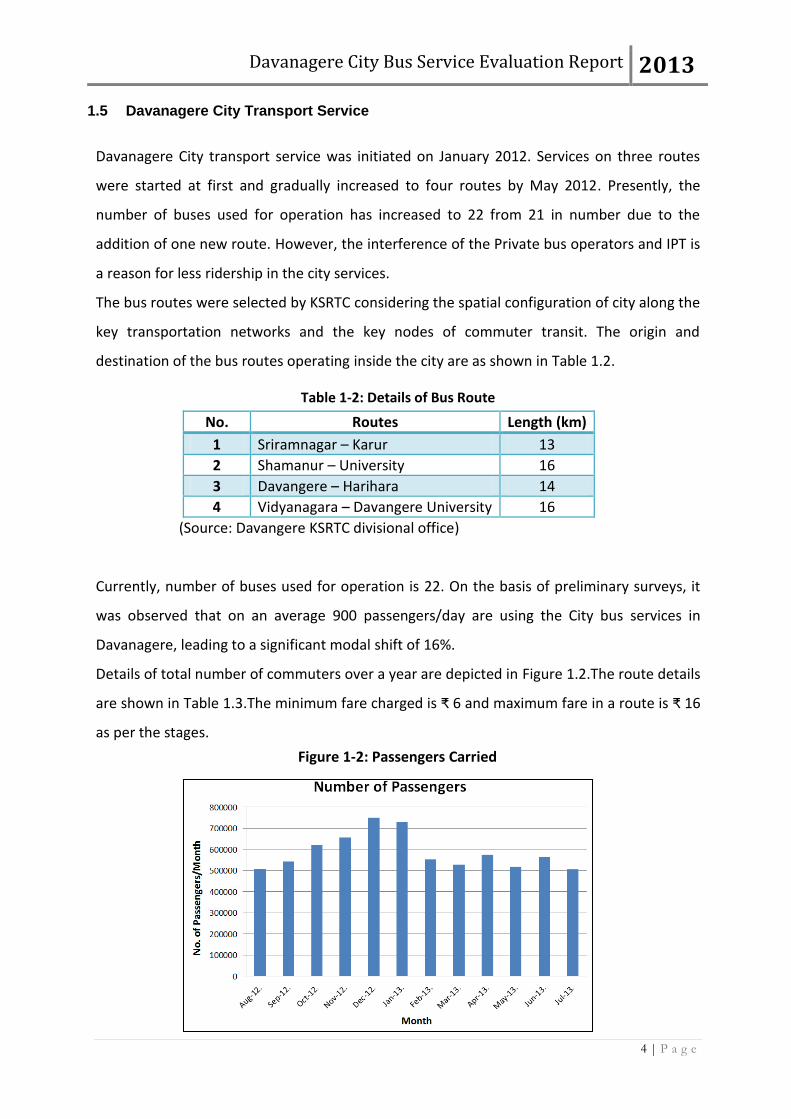
Currently, number of buses used for operation is 22. On the basis of preliminary surveys, it
was observed that on an average 900 passengers/day are using the City bus services in
Davanagere, leading to a significant modal shift of 16%.
Details of total number of commuters over a year are depicted in Figure 1.2.The route details
are shown in Table 1.3.The minimum fare charged is ₹ 6 and maximum fare in a route is ₹ 16
as per the stages.
Figure 1-2: Passengers Carried

Davanagere City Bus Service Evaluation Report 2013
5 | P a g e
The details like kilometers operated, number of stages and fare of the 4 operating routes in
Davanagere had been collected from the divisional office.
Table 1-3: Route Details
No Routes Length
(km)
Bus Trips/
Day
No of
Buses
Fare
(Rs.)
Headway
(min)
Peak hour
(min)
1 Sriramnagar – Karur 13 124 9 8 10 – 15 7 – 8
2 Shamanur – University 16 100 / 83 7 / 6 9 10 – 15 7 – 8
3 Davanagere – Harihara 14 32 2 8 30 – 40 25 – 30
4 Vidyanagara –
Davanagere University 16 66 5 9 20 – 30 15 – 20
(Source: Davanagere KSRTC divisional office)
Davanagere City Bus Service Evaluation Report 2013
6
2 Performance Evaluation Methodology
2.1 Performance Review Methodology
The evaluation assessment was initially done through a standard set of performance
benchmarks named as Service level benchmarks (SLB’s) framed by Ministry of Urban
Development (MoUD), Government of India, which in turn facilitates the development of
Performance improvement plans using information generated by the benchmarking and
ensures a long term sustainability of the Public transport. However, it is seen that the
parameters defined are on a generalized basis and quantifying them on a common scale is not
appropriate. Hence a methodology was proposed to classify the parameters under separate
categories and defining them separately to a Level of Service scale so as to identify the issues
related to each separately. The main benefits of an evaluation framework include:
1. Potential to improve the quality of investment and policy decisions.
2. Help the ‘value for money’ arguments for PT projects.
3. Identify affected groups and impacts.
4. Introduction of new routes and induction of new buses in phased manner.
In addition to this, a Performance Evaluation methodology for the tier II cities Bus Service has
been developed with respect to the city, the operator’s perspective and finally the end users
perspective towards the service.
2.1.1 Evaluation based on Service Level Benchmarks (As specified by the MoUD)
The growing challenges of the urban sector in India requires a sytem which can measure the
performance of urban transport activities and also address the performance monitoring for
internal decision making. With this perspective, Ministry of Urban Development (MoUD)
framed a standard set of performance benchmarks which can help Urban Local Bodies (ULBs)
and other agencies in identifying performance gaps and suggesting improvements through
the sharing of information and best practices, ultimately resulting in better services to the
people.Accordingly all JNNURM mission cities are advised to undertake the process of service
level benchmarking.
Davanagere City Bus Service Evaluation Report 2013
7 | P a g e
Service level performance indicators have been identified for various areas like Quality and
financial sustainability of public transport, Pedestrian / NMT safety and infrastructure
facilities, ITS facilities in a city to name a few, by the Ministry of Urban Development (MoUD).
The service level benchmarks for the Public transport consists of two categories:
1. Public transport facilities.
2. Sustainability of Public transport.
1. Public transport facilities
i. Presence of organized public transport system in urban area (%).
ii. Extent of supply availability of public transport.
iii. Service coverage of public transport in the city.
iv. Level of comfort in public transport.
v. % of fleet as per urban bus specification.
vi. Average waiting time for public transport users (mins).
2. Financial Sustainability of public transport
i. Extent of Non-fare Revenue (%).
ii. Staff /bus ratio.
iii. Operating Ratio.
2.1.2 Evaluation based on various perspectives
A methodology was proposed to classify the parameters under separate categories and defining
them separately to a Level of Service scale so as to identify the issues related to each separately.
With this perspective, a performance evaluation for the Bus service had been conducted by
Directorate of Urban Land Transport (DULT) to improve the performance standards of the service.
The evaluation criterion was divided into three perspectives i.e., the User, Commuter and the
City. The proposed methodology identifies the key parameters under defined perspectives and
evaluates the contribution of each to the overall performance of the service, such that it can act
as a handy tool by all public transport operators to improve the service.
Davanagere City Bus Service Evaluation Report 2013
8 | P a g e
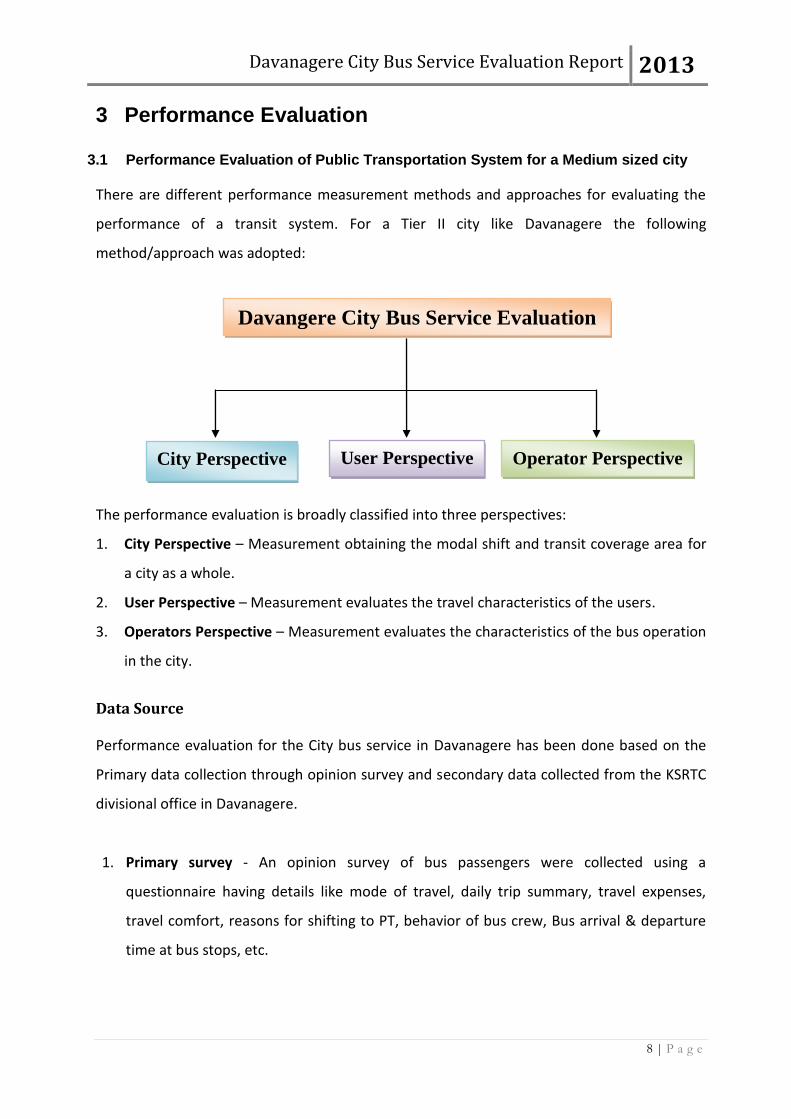
3 Performance Evaluation
3.1 Performance Evaluation of Public Transportation System for a Medium sized city
There are different performance measurement methods and approaches for evaluating the
performance of a transit system. For a Tier II city like Davanagere the following
method/approach was adopted:
The performance evaluation is broadly classified into three perspectives:
1. City Perspective – Measurement obtaining the modal shift and transit coverage area for
a city as a whole.
2. User Perspective – Measurement evaluates the travel characteristics of the users.
3. Operators Perspective – Measurement evaluates the characteristics of the bus operation
in the city.
Data Source
Performance evaluation for the City bus service in Davanagere has been done based on the
Primary data collection through opinion survey and secondary data collected from the KSRTC
divisional office in Davanagere.
1. Primary survey - An opinion survey of bus passengers were collected using a
questionnaire having details like mode of travel, daily trip summary, travel expenses,
travel comfort, reasons for shifting to PT, behavior of bus crew, Bus arrival & departure
time at bus stops, etc.
Davangere City Bus Service Evaluation
City Perspective User Perspective Operator Perspective

Davanagere City Bus Service Evaluation Report 2013
9 | P a g e
2. Secondary data collection- A detailed secondary data collection of operational
characteristics of city buses from KSRTC divisional office in Davanagere in a prescribed
format prepared by DULT.
3.1.1 City Perspective
Service level performance indicators have been identified for various areas like Quality and
financial sustainability of public transport, Pedestrian / NMT safety and infrastructure
facilities, ITS facilities in a city to name a few, by the Ministry of Urban Development (MoUD).
The Service level benchmarks (as per MoUD) for public transport system indicate the city
wide LOS provided by public transport system during peak hours. This would require
indicators such as presence of organized public transport system; bus route coverage, service
frequency, and percentage fleet as per urban bus specifications as far as the city perspective
is concerned. Therefore the parameters in context to the City perspective were identified
from the MoUD guidelines to assess the service initially.
1. Presence of organized public transport system in urban area (%)
Currently 22 buses are operated by Karnataka State Road Transport Corporation in
Davanagere.
A = Total Number of Buses in the City = 22 buses.
B = Total Number of Buses under the ownership of STU/SPV = 22
buses.
Presence of Public Transport System in Urban Area (%)
= (B/A)*100
=100%, Therefore LOS 1 = 1
LOS 1 Presence of
Organized PT
1 >= 60
2 40 - 60
3 20 - 40
4 < 20

Davanagere City Bus Service Evaluation Report 2013
10 | P a g e
2. Extent of supply availability of public transport
The Population of Davanagere and harihara city is 5,12,128 Lakh.
A = Total Number of Buses in the City = 22 buses.
B = Total Population of the city (Davanagere + Harihara, as per
2011 Census) = 5,12,128 Lakh.
Availability of Public Transport / 1000 Population
= A/ (B/1000) = 0.04,
Therefore, LOS 2 = 4.
3. Service coverage of public transport in the city
A = Total Route length of the corridors on which the PT systems
ply in the city = 59 (in Road Kilometers).
B = Area of the Urban Limits of the City (Davanagere+
Harihara) = (68.63+7.84) = 76.47 (in Square Kilometers).
Service Coverage = (A/B) = 0.77
Therefore , LOS 3 = 2.
4. % of fleet as per Urban bus specification
A = Total Number of Buses in the City =22 buses.
B = Total number of buses as per the Urban Bus specifications in
the city = 22 buses.
% of fleet = (B/A)*100 = (22/22)*100 = 100%.
Therefore, LOS 4 = 1
LOS 2 Extent of supply
availability of
public transport
1 >= 0.6
2 0.4 – 0.6
3 0.2 – 0.4
4 < 0.2
LOS 3 Service
coverage of
public transport
1 >= 1
2 0.7 - 1.0
3 0.3 – 0.7
4 < 0.3
LOS 4
% of fleet as
per urban bus
specification
1 75 - 100
2 50 - 74
3 25 - 49
4 <=25
The computation clearly demands an increase in the fleet strength thereby creating an
opportunity to capture more commuters into the system by expanding the services even further.
As per the Urban Bus Toolkit the number of buses required typically lies between 0.5 and 1.2
/1,000 population.
Davanagere City Bus Service Evaluation Report 2013
11 | P a g e
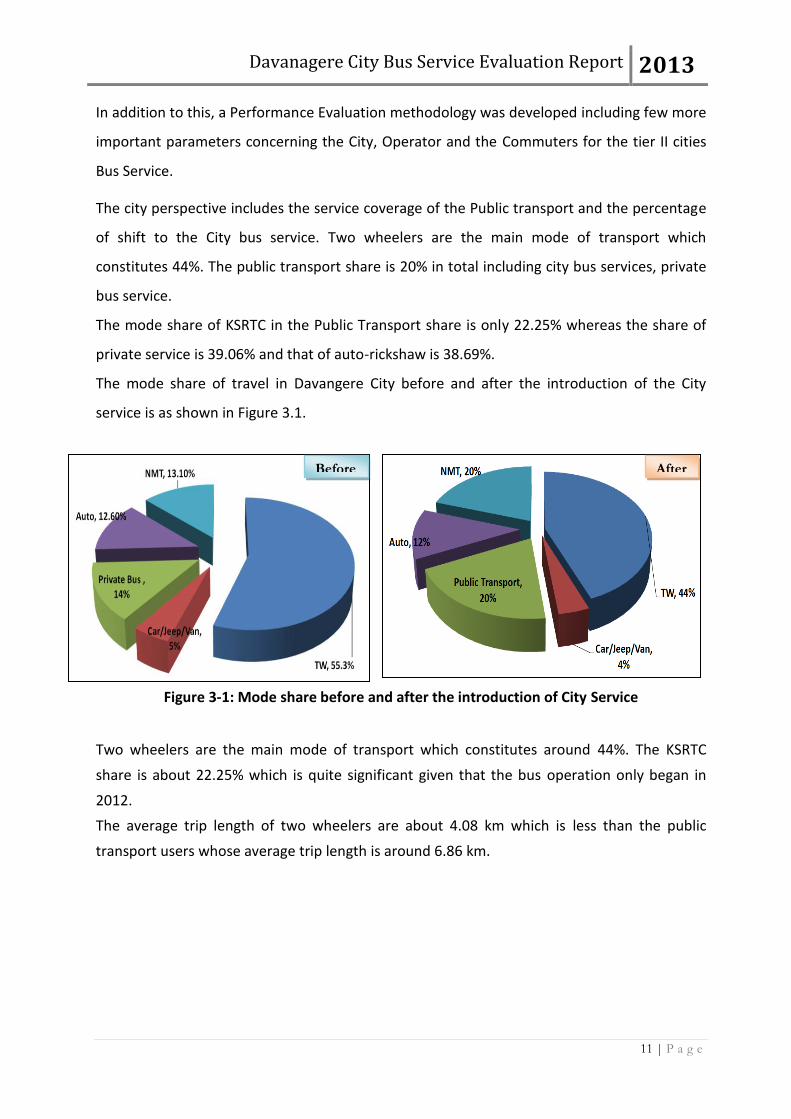
In addition to this, a Performance Evaluation methodology was developed including few more
important parameters concerning the City, Operator and the Commuters for the tier II cities
Bus Service.
The city perspective includes the service coverage of the Public transport and the percentage
of shift to the City bus service. Two wheelers are the main mode of transport which
constitutes 44%. The public transport share is 20% in total including city bus services, private
bus service.
The mode share of KSRTC in the Public Transport share is only 22.25% whereas the share of
private service is 39.06% and that of auto-rickshaw is 38.69%.
The mode share of travel in Davangere City before and after the introduction of the City
service is as shown in Figure 3.1.
Figure 3-1: Mode share before and after the introduction of City Service
Two wheelers are the main mode of transport which constitutes around 44%. The KSRTC
share is about 22.25% which is quite significant given that the bus operation only began in
2012.
The average trip length of two wheelers are about 4.08 km which is less than the public
transport users whose average trip length is around 6.86 km.
After Before

Davanagere City Bus Service Evaluation Report 2013
12 | P a g e
(Source:- Household survey- CMP Davanagere 2011)
This graph indicates that shorter trips are made by two wheelers where comfort is not a
major concern whereas public transport and cars are preferred over longer trips indicating
preference for comfort.
3.1.1.1 Level of Service-City perspective
The performance of any system depends on a set of factors, thus it becomes necessary to
study all the parameters in detail and arrive to a set of indicators that are of prime
importance to the users, operators as well as the city. In order to arrive at a performance
benchmarks that can be commonly understood and used by all stakeholders, a methodology
was proposed to classify the parameters under separate categories and defining them
separately to a Level of Service scale so as to identify the issues related to each separately.
In the proposed Level of Service chart, the parameters related to the City, Users and
operators are categorized and evaluated separately and the measures required to improve
the quality and efficiency of the Bus service are recommended. The Level of Service chart
developed is on a generalized conception and the parameters were carefully selected with
reference to their importance to the Operators, transit planners as well as the commuters.
The sole purpose of the developed chart is to rank the various indicators to a scale which can
be easily understood and evaluated so as to identify the parameters which needs more
attention. This type of chart helps the Operator to identify the problem in specific and solve
them.
Figure 3-2: Mode Wise Trip Length
0
2
4
6
8
Wal
k
Cycle
Tw
o
Wheel
er
Car
Tax
i
KS
RT
C
Auto
Ric
ksh
aw
Trip
Len
gth
(k
m)
Mode of travel
Davanagere City Bus Service Evaluation Report 2013
13 | P a g e
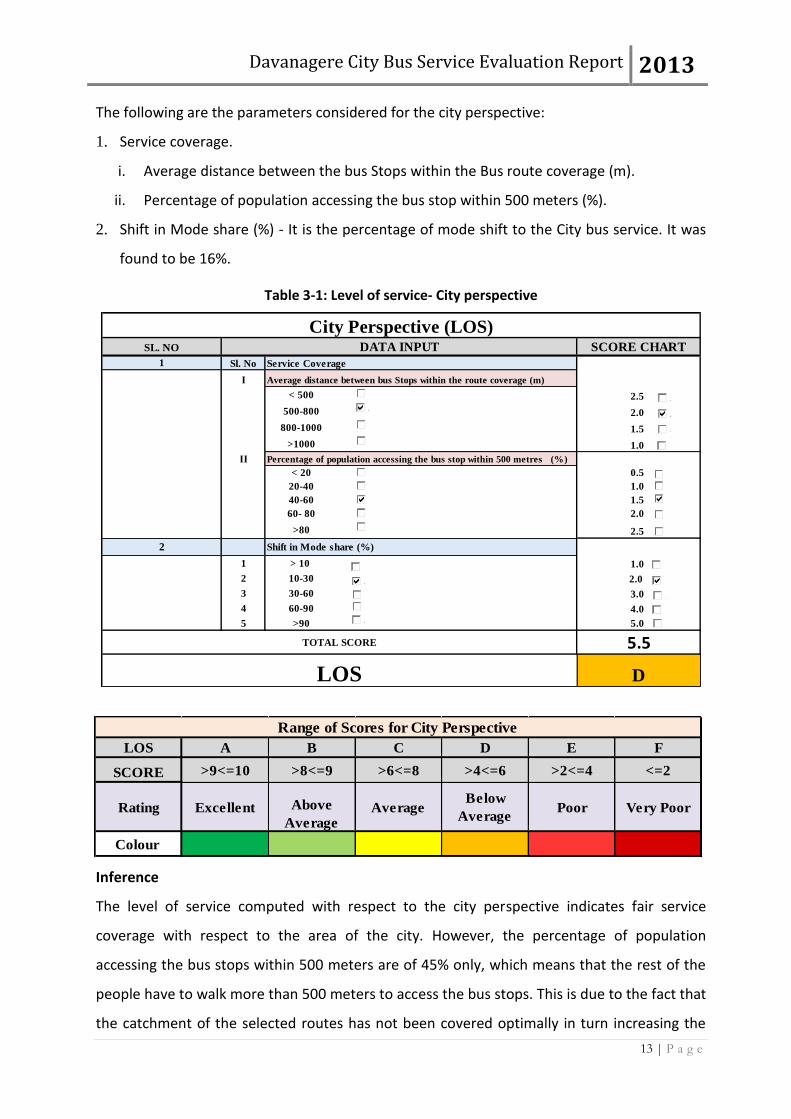
The following are the parameters considered for the city perspective:
1. Service coverage.
i. Average distance between the bus Stops within the Bus route coverage (m).
ii. Percentage of population accessing the bus stop within 500 meters (%).
2. Shift in Mode share (%) - It is the percentage of mode shift to the City bus service. It was
found to be 16%.
Table 3-1: Level of service- City perspective
Sl. No Service Coverage
I
< 500 2.5
500-800 2.0
800-1000 1.5
>1000 1.0
II
< 20 0.5
20-40 1.0
40-60 1.5
60- 80 2.0
>80 2.5
1 > 10 1.0
2 10-30 2.0
3 30-60 3.0
4 60-90 4.0
5 >90 5.0
Average distance between bus Stops within the route coverage (m)
Percentage of population accessing the bus stop within 500 metres (%)
2 Shift in Mode share (%)
TOTAL SCORE 5.5
LOS D
City Perspective (LOS)SL. NO DATA INPUT SCORE CHART
1
C
C
CC
C
C
C
C
C
C
C
C
C
C
CC
CCCCC
CCC
C
C
C
C
Inference
The level of service computed with respect to the city perspective indicates fair service
coverage with respect to the area of the city. However, the percentage of population
accessing the bus stops within 500 meters are of 45% only, which means that the rest of the
people have to walk more than 500 meters to access the bus stops. This is due to the fact that
the catchment of the selected routes has not been covered optimally in turn increasing the
LOS A B C D E F
SCORE >9<=10 >8<=9 >6<=8 >4<=6 >2<=4 <=2
Colour
Range of Scores for City Perspective
Rating Excellent Above
AverageAverage
Below
AveragePoor Very Poor

Davanagere City Bus Service Evaluation Report 2013
14 | P a g e
walking distance for the people. And this is one of the reasons for bringing down the level of
service to D. Hence, if the spacing of the bus stops on some routes could be reduced to a
maximum spacing of 600 m between each bus stops, more people would be attracted
towards the bus service, specially aged over 45 years, many of who suffer with health
problems with reduced physical stamina and such commuter would rather prefer to travel by
bus if the quality of the service is good. Additionally, the only solution to increase the mode
share of public transport in Davanagere city is safe and convenient city bus service.
3.1.2 User perspective
The User Perspective included the Passenger opinion data base collected through primary
survey (200 samples) conducted on all the local bus stops targeting passengers using public
transport as their mode of travel. A Passenger Opinion survey format was prepared including
the details about trip purpose, earlier mode of travel, travel expenses, average income,
vehicle ownership details, trip details in a day, travel information etc. ( As shown in Annexure
I).
The survey reveals that the percentage of population accessing the city Bus
service in Davanagere within 500 meters is only 45% indicating that less than
half of the Public transport users have to walk more than 500 m to access the
service. Hence, the spacing of the bus stops should be within 500 m to a
maximum distance of 800 m to increase the patronage of the service.
Davanagere City Bus Service Evaluation Report 2013
15 | P a g e
Work &
Business
50%
Education
33%
Shopping
9%
Others
8%
Comfor
t
31%
Safety
34%
Cost
Saving
13%
Time
Saving
7%
Directness of
Service
15%
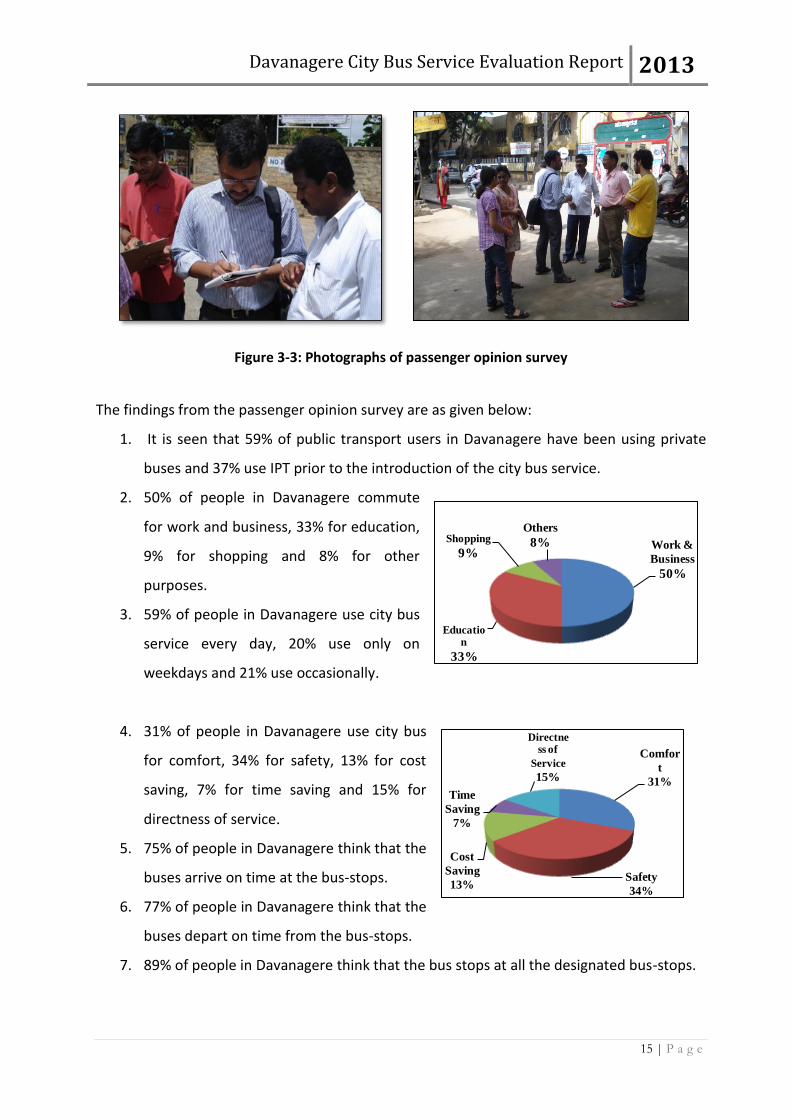
Figure 3-3: Photographs of passenger opinion survey
The findings from the passenger opinion survey are as given below:
1. It is seen that 59% of public transport users in Davanagere have been using private
buses and 37% use IPT prior to the introduction of the city bus service.
2. 50% of people in Davanagere commute
for work and business, 33% for education,
9% for shopping and 8% for other
purposes.
3. 59% of people in Davanagere use city bus
service every day, 20% use only on
weekdays and 21% use occasionally.
4. 31% of people in Davanagere use city bus
for comfort, 34% for safety, 13% for cost
saving, 7% for time saving and 15% for
directness of service.
5. 75% of people in Davanagere think that the
buses arrive on time at the bus-stops.
6. 77% of people in Davanagere think that the
buses depart on time from the bus-stops.
7. 89% of people in Davanagere think that the bus stops at all the designated bus-stops.
Davanagere City Bus Service Evaluation Report 2013
16 | P a g e
< 5 min
24%
5-10 min
57%
10-15
min
14%
15-30
min
5%
8. 65% of people in Davanagere think that the behaviour of bus conductor and driver is
good, 30% believes the behaviour is normal, 4% think the behaviour is very good and
1% think the behaviour is bad.
9. To increase the patronage of City Bus Service, 53% of people in Davanagere feel that
there must be a increase in the fleet strength, 31% feel that the frequency of buses
must be increased, 6% feel that bus fare has to be reduced and 10% feel that
maintaining proper time schedule will increase the patronage of City bus service.
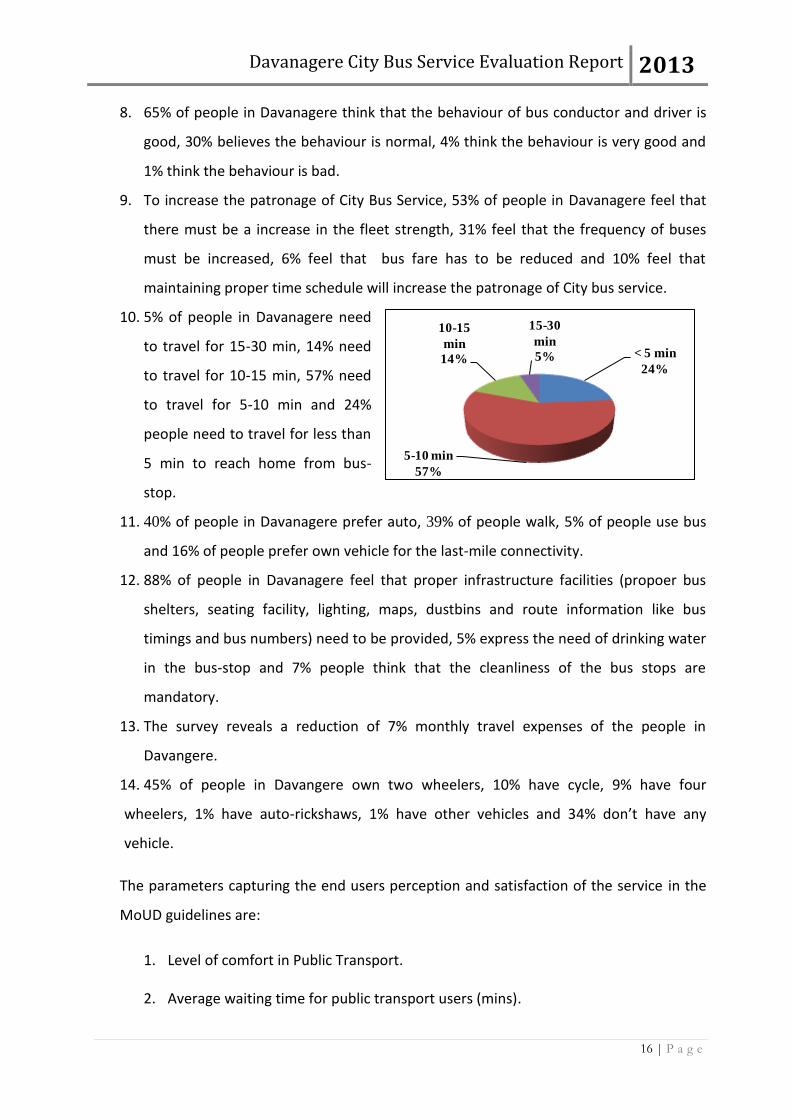
10. 5% of people in Davanagere need
to travel for 15-30 min, 14% need
to travel for 10-15 min, 57% need
to travel for 5-10 min and 24%
people need to travel for less than
5 min to reach home from bus-
stop.
11. 40% of people in Davanagere prefer auto, 39% of people walk, 5% of people use bus
and 16% of people prefer own vehicle for the last-mile connectivity.
12. 88% of people in Davanagere feel that proper infrastructure facilities (propoer bus
shelters, seating facility, lighting, maps, dustbins and route information like bus
timings and bus numbers) need to be provided, 5% express the need of drinking water
in the bus-stop and 7% people think that the cleanliness of the bus stops are
mandatory.
13. The survey reveals a reduction of 7% monthly travel expenses of the people in
Davangere.
14. 45% of people in Davangere own two wheelers, 10% have cycle, 9% have four
wheelers, 1% have auto-rickshaws, 1% have other vehicles and 34% don’t have any
vehicle.
The parameters capturing the end users perception and satisfaction of the service in the
MoUD guidelines are:
1. Level of comfort in Public Transport.
2. Average waiting time for public transport users (mins).
Davanagere City Bus Service Evaluation Report 2013
17 | P a g e
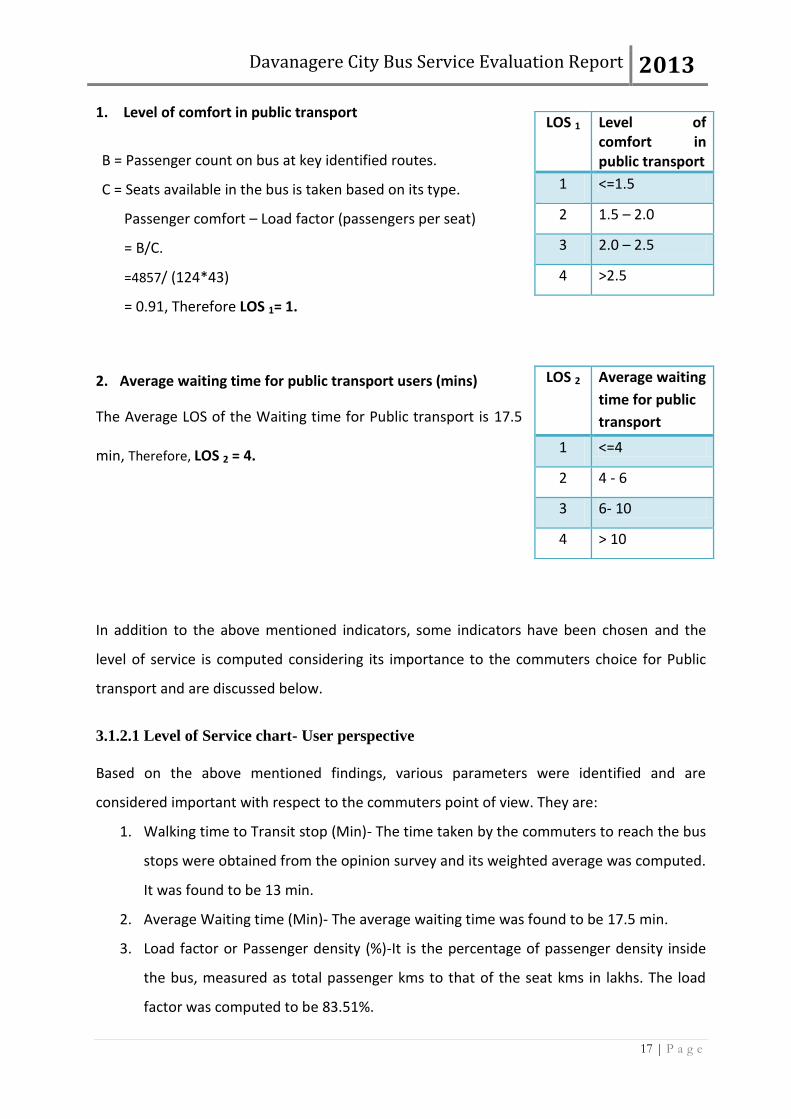
1. Level of comfort in public transport
B = Passenger count on bus at key identified routes.
C = Seats available in the bus is taken based on its type.
Passenger comfort – Load factor (passengers per seat)
= B/C.
=4857/ (124*43)
= 0.91, Therefore LOS 1= 1.
2. Average waiting time for public transport users (mins)
The Average LOS of the Waiting time for Public transport is 17.5
min, Therefore, LOS 2 = 4.
In addition to the above mentioned indicators, some indicators have been chosen and the
level of service is computed considering its importance to the commuters choice for Public
transport and are discussed below.
3.1.2.1 Level of Service chart- User perspective
Based on the above mentioned findings, various parameters were identified and are
considered important with respect to the commuters point of view. They are:
1. Walking time to Transit stop (Min)- The time taken by the commuters to reach the bus
stops were obtained from the opinion survey and its weighted average was computed.
It was found to be 13 min.
2. Average Waiting time (Min)- The average waiting time was found to be 17.5 min.
3. Load factor or Passenger density (%)-It is the percentage of passenger density inside
the bus, measured as total passenger kms to that of the seat kms in lakhs. The load
factor was computed to be 83.51%.
LOS 1 Level of comfort in public transport
1 <=1.5
2 1.5 – 2.0
3 2.0 – 2.5
4 >2.5
LOS 2 Average waiting
time for public
transport
1 <=4
2 4 - 6
3 6- 10
4 > 10
Davanagere City Bus Service Evaluation Report 2013
18 | P a g e
4. Travel Cost ratio (KSRTC Bus to Private bus)- A comparison of the travel cost was made
for the fare of City bus to that of the Private bus, as they are found to be the next
competing mode in the city. It was found that there is significant difference in fare for
a longer distance travelled in KSRTC bus to that of a Private bus, which is one of the
reason to which people opt for the Private buses within the city.
5. Infrastructural facilities.
i. Bus shelters, seating facility.
ii. Lighting.
iii. Footpath connectivity to the bus stop.
iv. Route information (Bus timings, numbers)
Davanagere City Bus Service Evaluation Report 2013
19 | P a g e
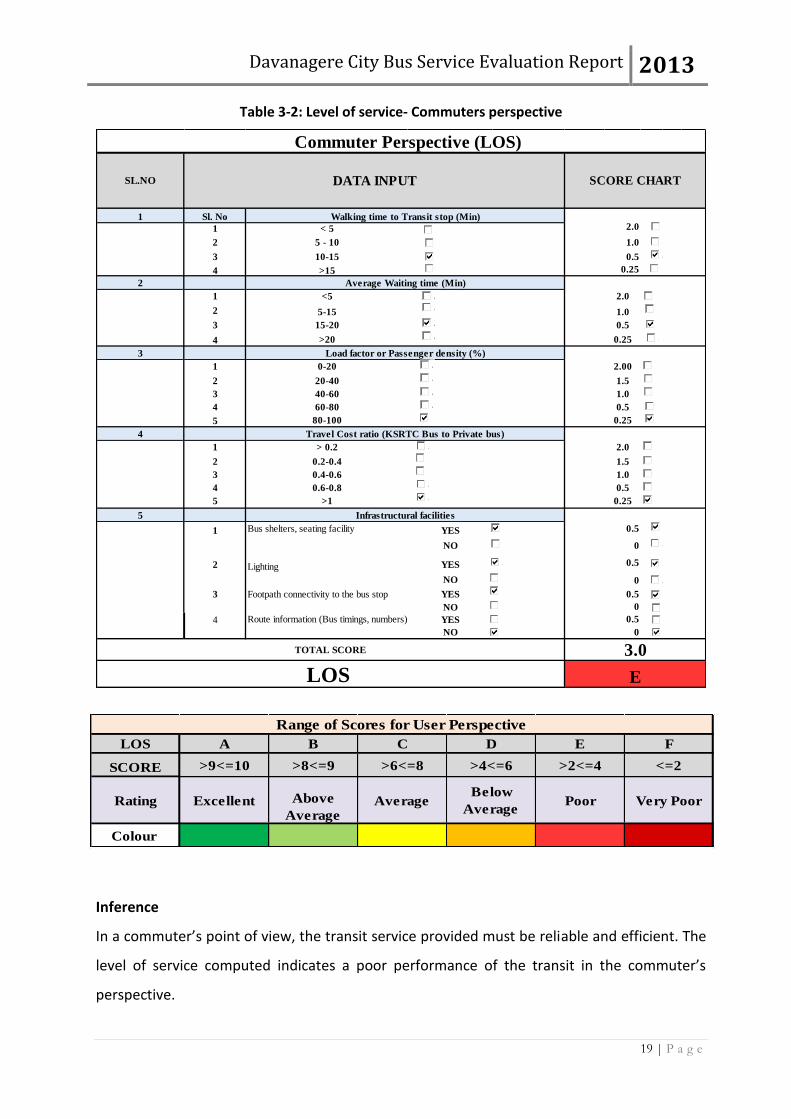
Table 3-2: Level of service- Commuters perspective
1 Sl. No
1 < 5 2.0
2 5 - 10 1.0
3 10-15 0.5
4 >15 0.25
2
1 <5 2.0
2 5-15 1.0
3 15-20 0.5
4 >20 0.25
3
1 0-20 2.00
2 20-40 1.5
3 40-60 1.0
4 60-80 0.5
5 80-100 0.25
4
1 > 0.2 2.0
2 0.2-0.4 1.5
3 0.4-0.6 1.0
4 0.6-0.8 0.5
5 >1 0.25
5
1 Bus shelters, seating facility YES 0.5
NO 0
2 Lighting YES 0.5
NO 0
3 Footpath connectivity to the bus stop YES 0.5
NO 0
4 Route information (Bus timings, numbers) YES 0.5
NO 0
E
Load factor or Passenger density (%)
Average Waiting time (Min)
Commuter Perspective (LOS)
SL.NO DATA INPUT SCORE CHART
Walking time to Transit stop (Min)
Infrastructural facilities
Travel Cost ratio (KSRTC Bus to Private bus)
3.0TOTAL SCORE
LOS
C
CC
C
C
CC
CC
C
CC
CCC
C
C
C
C
C
C
C
C
C
C
C
CC
CCCCC
C
CCCC
C
C
C
C
CC
C
CC
C
C
CCCC
Inference
In a commuter’s point of view, the transit service provided must be reliable and efficient. The
level of service computed indicates a poor performance of the transit in the commuter’s
perspective.
LOS A B C D E F
SCORE >9<=10 >8<=9 >6<=8 >4<=6 >2<=4 <=2
Colour
Range of Scores for User Perspective
Rating Excellent Above
AverageAverage
Below
AveragePoor Very Poor
Davanagere City Bus Service Evaluation Report 2013
20 | P a g e
It is a common tendency of the commuters to expect the transit service the moment they
arrive at the stop. And the average waiting time is found to be 17.5 min during the peak
hours, indicating a long waiting time. Thus there is a need to introduce more number of buses
along the following routes as there is an additional demand along these routes:
1. Bhagath singh nagar to Market.
2. KSRTC Bus stand to Davanagere University.
3. Anjaneya Badavane to University.
4. RTO to KSRTC new Bus Stand.
5. Aralimare Yele Bethur Road to Bapuji Institute of Technology College.
6. Aralimare Yele Bethur Road to University (Via KSRTC new Bus stand).
7. KR Market to KSRTC bus stand.
An effective management of the fleet strength during peak and off peak hours can satisfy the
passenger need to a great extent.
Additionally, the city needs an improvement in the infrastructural facilities like bus shelters,
Route information etc.
3.1.3 Operators perspective
A detailed secondary data collection of operational characteristics of city bus was obtained in
a prescribed format from KSRTC (Karnataka State Road Transport Corporation) divisional
office, which served as the database for Operators perspective. A performance monitoring
format was prepared by DULT to carry out the evaluation process on a monthly basis with a
view to monitor the Operators efficiency of the cities.
The survey reveals that there is a simultaneous increase in the ridership for
bus from the day of the implementation of the bus service in Davanagere
City. However, the main concern raised by the commuters was the long
waiting time to board a bus indicating a poor reliability.
Additionally, the infrastructural facilities like provision of bus shelters,
lighting and the passenger information system at the bus stops are almost
absent. An improvement in the facility could encourage more passengers.
Davanagere City Bus Service Evaluation Report 2013
21 | P a g e
The major aspects involved in are physical requirement, daily bus utilisation, staff position of
the operator, fuel performance, accidents and financial revenue returns. All these aspects are
finalised through a set of indicators like Quality of services, Economy & Profitability and
Operation Performance. The qualtiy of service depends upon accidents, breakdowns, percent
of buses departed and arrived in time, waiting time, condition of the vehicle, scheduled trips,
capacity of bus station, crew behaviour, subsidies given etc. Economy depends upon the
revenue cost, net profit, working expenses, turn over, passenger earning, vehicle kms, tyre
kilometer etc. The operation performance depends upon fleet utilization, vehicle utilization,
scheduled kilometers, operated kilometers, fleet age, fleet strength, routes operated etc.
Presently there are 22 buses in operation on four routes with a a load factor of 83.51%
earning a revenue of 27.40 lakhs in July 2013 at Rs 24.83/Km.
Vehicle utilization can be measured as the mileage of each bus or as the percentage of fleet
being operated. The vehicle utilization (in Km) is low as of July 2013 when compared to
Bangalore Metropolitan Transport Corporation (BMTC) where the vehicle utilization per day is
225 kms.
Although the congestion is much higher in Bangalore the vehicle utilization attained is high
hence there is a scope to improve the vehicle utilization in Davanagere City service also by 10-
20%, which in turn has the potential to improve the revenue with the current rolling stock.
The passenger density is found to be high during the peak hour indicating a large number of
commuters depending on the transit service. However, the operators cannot assure a seat for
each of the passengers especially during the peak hours. A study of the passenger arrival
pattern will help analyze the number of commuters using the service so as to calculate the
required fleet strength.

Davanagere City Bus Service Evaluation Report 2013
22 | P a g e
Performance indicators and Monitoring thereof (up to July-13)
From the secondary data collected, the following parameters were analysed and computed
which are of the prime concern with respect to the Operators point of view. The computation
formulas are shown in Annexure II.
Table 3-3: Performance Indicators
Types of Indicators Jan 2012 to July 2013
1.Breakdowns/1000000 vkm 0
2. Accidents/ 1000000 vkm 0
3. Percent buses departed in time (%) 92
4. Percent buses arrived in time (%) 95
Minor
1. Average Passenger Waiting time 17.5 min
2. Condition of vehicle/time good
3. No. of buses on route/day 22
4. No. of Scheduled trips cancelled 3742
5. Fatal accidents/100000 vkms 0
Supplementary
1. No. of bus station provided Nil
Economy & profitability
1. Total cost/vkm ₹ 24.83
2. Revenue/cost ratio 0.78
3. Net profit/km -5.45
4. Working expenses/vkm 28.40
Minor
1. Turnover/Capital Ratio 1.20
2. Working Expenses/ capital 0.24
3. Earning/ vkm ratio 24.83
4. Average gross earning/bus ₹ 4062
5. Passenger earning/vkm 19.07
Supplementary
1. Vehicle kms performed litre of fuel 4.37
2. vkm performed/bus/crew 43
3. Average tyre kilometer 1.20 lakh
Operation Performance
1. Fleet utilization 100%
2. vehicle utilization (effective) 169.0
3. vehicle utilization (Gross) 179.1
4. Average passenger kms/bus/day -
Minor
1. Scheduled kms/day (Avg) 4108.0
2. Operated kms/day (Avg) 3718.7
Davanagere City Bus Service Evaluation Report 2013
23 | P a g e
3. Operated kms/scheduled kms ratio 0.03
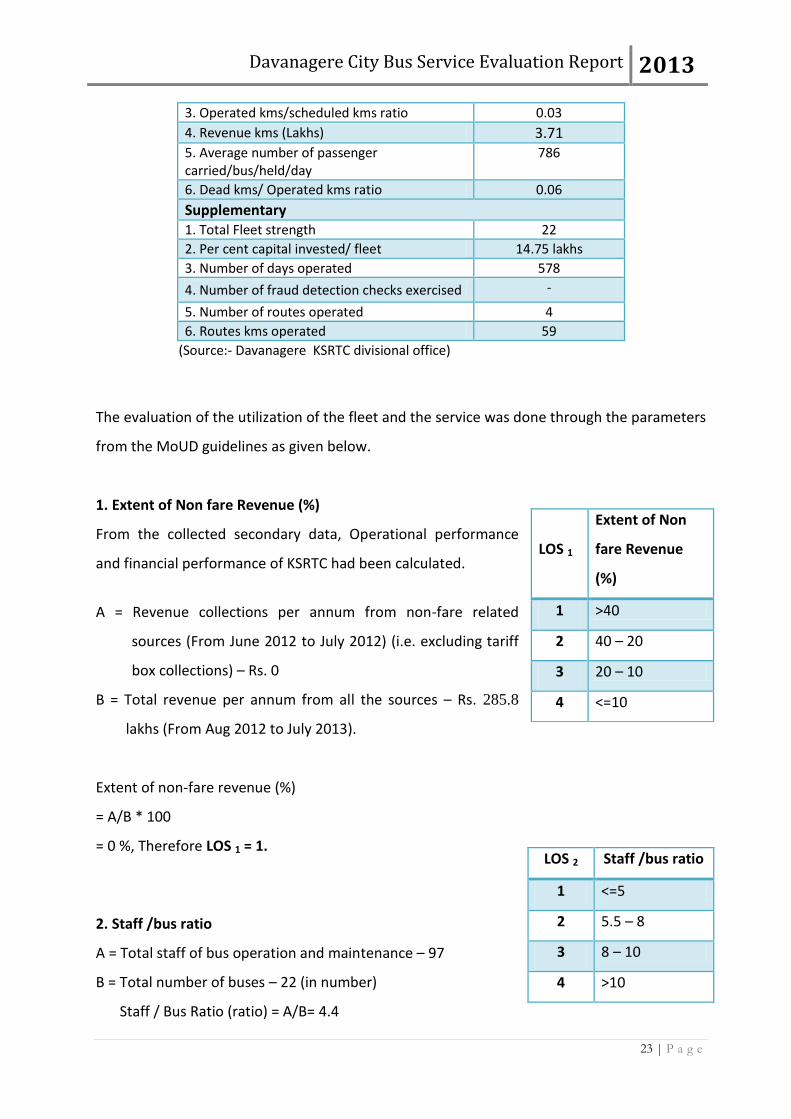
4. Revenue kms (Lakhs) 3.71
5. Average number of passenger carried/bus/held/day
786
6. Dead kms/ Operated kms ratio 0.06
Supplementary
1. Total Fleet strength 22
2. Per cent capital invested/ fleet 14.75 lakhs
3. Number of days operated 578
4. Number of fraud detection checks exercised -
5. Number of routes operated 4
6. Routes kms operated 59
(Source:- Davanagere KSRTC divisional office)
The evaluation of the utilization of the fleet and the service was done through the parameters
from the MoUD guidelines as given below.
1. Extent of Non fare Revenue (%)
From the collected secondary data, Operational performance
and financial performance of KSRTC had been calculated.
A = Revenue collections per annum from non-fare related
sources (From June 2012 to July 2012) (i.e. excluding tariff
box collections) – Rs. 0
B = Total revenue per annum from all the sources – Rs. 285.8
lakhs (From Aug 2012 to July 2013).
Extent of non-fare revenue (%)
= A/B * 100
= 0 %, Therefore LOS 1 = 1.
2. Staff /bus ratio
A = Total staff of bus operation and maintenance – 97
B = Total number of buses – 22 (in number)
Staff / Bus Ratio (ratio) = A/B= 4.4
LOS 1
Extent of Non
fare Revenue
(%)
1 >40
2 40 – 20
3 20 – 10
4 <=10
LOS 2 Staff /bus ratio
1 <=5
2 5.5 – 8
3 8 – 10
4 >10
Davanagere City Bus Service Evaluation Report 2013
24 | P a g e
Therefore, LOS 2 = 1.
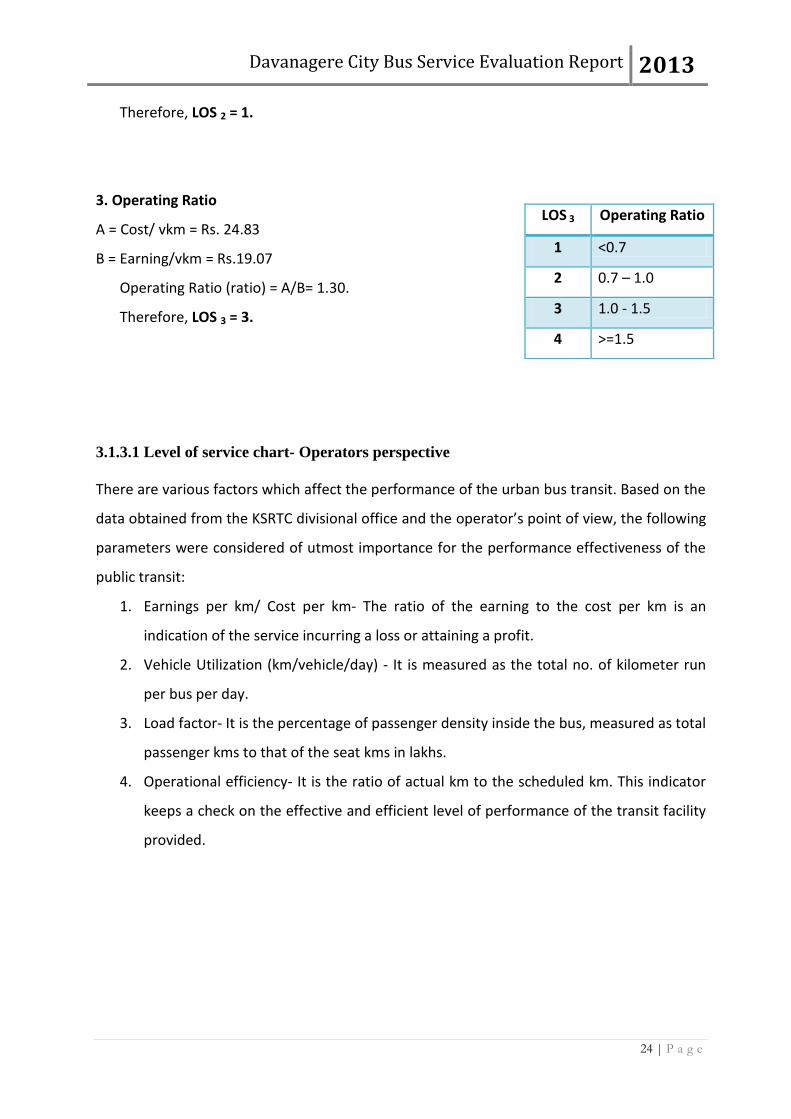
3. Operating Ratio
A = Cost/ vkm = Rs. 24.83
B = Earning/vkm = Rs.19.07
Operating Ratio (ratio) = A/B= 1.30.
Therefore, LOS 3 = 3.
3.1.3.1 Level of service chart- Operators perspective
There are various factors which affect the performance of the urban bus transit. Based on the
data obtained from the KSRTC divisional office and the operator’s point of view, the following
parameters were considered of utmost importance for the performance effectiveness of the
public transit:
1. Earnings per km/ Cost per km- The ratio of the earning to the cost per km is an
indication of the service incurring a loss or attaining a profit.
2. Vehicle Utilization (km/vehicle/day) - It is measured as the total no. of kilometer run
per bus per day.
3. Load factor- It is the percentage of passenger density inside the bus, measured as total
passenger kms to that of the seat kms in lakhs.
4. Operational efficiency- It is the ratio of actual km to the scheduled km. This indicator
keeps a check on the effective and efficient level of performance of the transit facility
provided.
LOS 3 Operating Ratio
1 <0.7
2 0.7 – 1.0
3 1.0 - 1.5
4 >=1.5
Davanagere City Bus Service Evaluation Report 2013
25 | P a g e
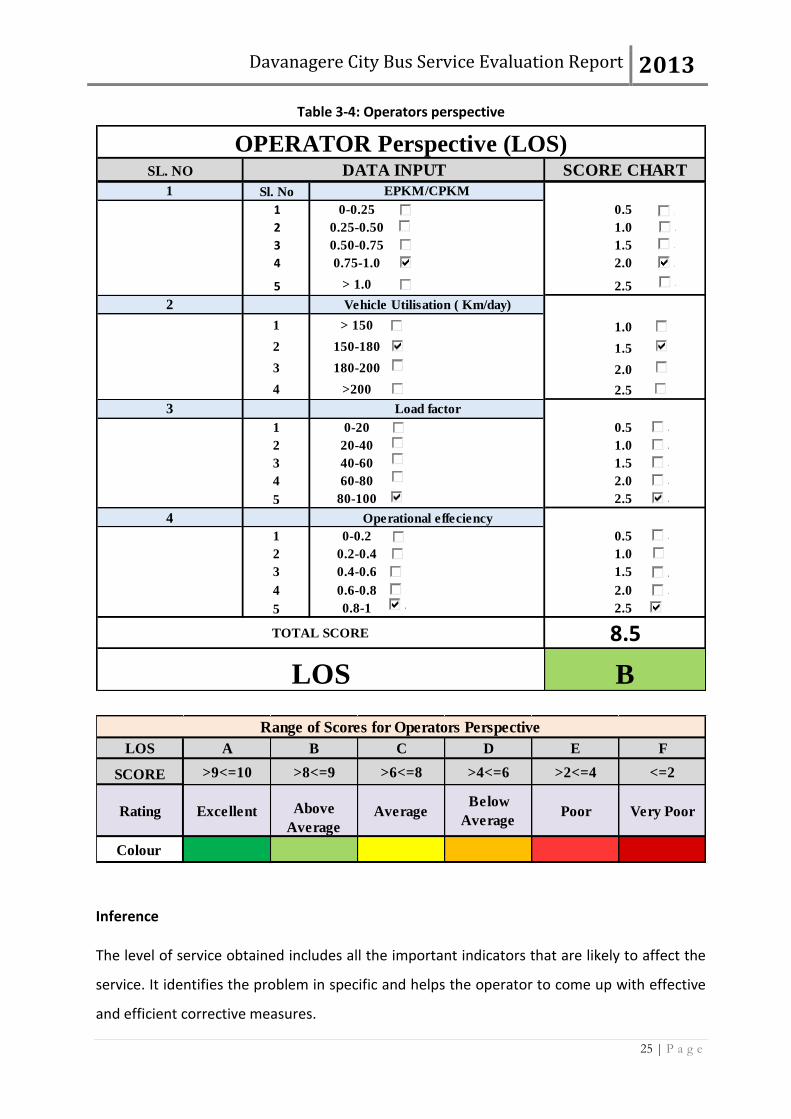
Table 3-4: Operators perspective
Sl. No
1 0-0.25 0.5
2 0.25-0.50 1.0
3 0.50-0.75 1.5
4 0.75-1.0 2.0
5 > 1.0 2.5
1 > 150 1.0
2 150-180 1.5
3 180-200 2.0
4 >200 2.5
1 0-20 0.5
2 20-40 1.0
3 40-60 1.5
4 60-80 2.0
5 80-100 2.5
1 0-0.2 0.5
2 0.2-0.4 1.0
3 0.4-0.6 1.5
4 0.6-0.8 2.0
5 0.8-1 2.5
3 Load factor
OPERATOR Perspective (LOS)SL. NO DATA INPUT SCORE CHART
1 EPKM/CPKM
2 Vehicle Utilisation ( Km/day)
4 Operational effeciency
TOTAL SCORE 8.5
LOS B
C
C
C
C
C
C
C
CC
CC
C
CC
C
CCC
CCC
CCC
CCCC
C
CCCCC
C
C
C
C
Inference
The level of service obtained includes all the important indicators that are likely to affect the
service. It identifies the problem in specific and helps the operator to come up with effective
and efficient corrective measures.
LOS A B C D E F
SCORE >9<=10 >8<=9 >6<=8 >4<=6 >2<=4 <=2
Colour
Range of Scores for Operators Perspective
Rating Excellent Above
AverageAverage
Below
AveragePoor Very Poor

Davanagere City Bus Service Evaluation Report 2013
26 | P a g e
The most important factor affecting the operator is earnings per Km (EPKM) and cost per km
(CPKM). In operator’s perspective, the EPKM must be higher than the CPKM which saves
them from incurring a loss. However, it is always not possible to make a profit unless effective
vehicle utilization is done.
In order to evaluate the operational performance of the service, it has been compared to the
city bus services running under NWKRTC (Hubli-Dharwad), NEKRTC (Gulbarga), KSRTC
(Hassan) jurisdictions as shown in the Figure 3.5.
Davanagere City Bus Service Evaluation Report 2013
27 | P a g e
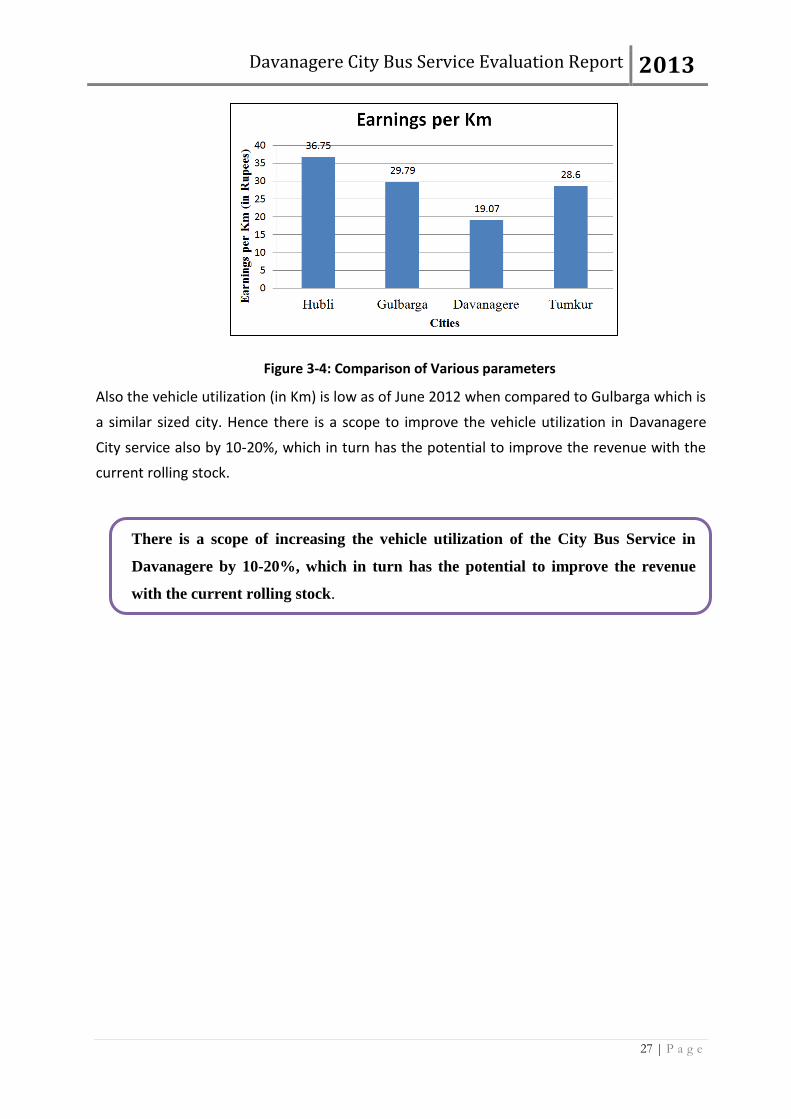
Also the vehicle utilization (in Km) is low as of June 2012 when compared to Gulbarga which is
a similar sized city. Hence there is a scope to improve the vehicle utilization in Davanagere
City service also by 10-20%, which in turn has the potential to improve the revenue with the
current rolling stock.
There is a scope of increasing the vehicle utilization of the City Bus Service in
Davanagere by 10-20%, which in turn has the potential to improve the revenue
with the current rolling stock.
Figure 3-4: Comparison of Various parameters
Davanagere City Bus Service Evaluation Report 2013
28 | P a g e
4 Bus Operation Impacts
4.1 Passenger Convenience
By introducing city bus service the people in Davanagere who have been using
IPT/Private bus service now has another service for their travel. Although there is cost
saving, people tend to use which-ever service comes first reducing the waiting time at
the bus-stop.
4.2 Impact on the user
1. The monthly travel expenses of people have been reduced by 12% by shifting to city bus
service thus increasing their personal savings.
2. The total savings in fuel due to the shift, ( assuming a two wheeler will give 40 Kmpl)
works out to be 2500 litres per day, which is very significant saving given that the bus
operation use only about 1000 litres/day of HSD.
Davanagere City Bus Service Evaluation Report 2013
29 | P a g e
5 Conclusion
1. There is a requirement of increasing the Vehicle utilization of the Davanagere City service
also by 10-20%, which in turn has the potential to improve the revenue with the current
rolling stock.
2. City bus service is convenient, cheaper and safer mode of travel where the travel cost of
people has been reduced by 12%.
3. KSRTC needs to provide proper infrastructure facilities in each bus-stop which include bus
timings and bus numbers to help the people using city bus service.
4. The load factor of city bus service is 83.51% which shows that the buses are operating
with good capacity.
5. KSRTC should increase the fleet strength to increase the patronage of existing city bus
services.
6. The maximum spacing of the bus stops should be within 800 m which in turn will
encourage people to use City service on a larger scale.
7. There should be an efficient management of the fleet operation during peak and off peak
hours.
8. Fare box structure should be re-calculated based on Private Bus fare as it is the main
competing mode to the Public Transport system in Davanagere city.
Davanagere City Bus Service Evaluation Report 2013
30 | P a g e
ANNEXURE I
5.1.1 EVALUATION OF CITY BUS SERVICE - DAVANAGERE:
PASSENGER OPINION SURVEY: Questionnaire for users (ಬಳಕದಾರರಗ ಪರಶ): 1. Name (ಹಸರು):.......................................................... 2. Age (ವಯಸುು):...................... 3. Location ( ):................................................................................................................ 4. Gender (ಲಂಗ): Male (ಪುರುಷ) : Female (ಸತರೀ): 5. Origin ( ಸಥಳ): ………………………………Destination ( ಸಥಳ): …………...………
6. Travel distance from Origin to Destination ( ): ……………………………………………………………………………………….
7. Do city Buses Arrive on scheduled time? (ಈ )?
Yes No If late, approximately by how many minutes? ……….
8. Do city Buses Depart on scheduled time? (ಈ )?
Yes No If late, approximately by how many minutes? ……….
9. Is there a proper Bus Stop? ( )? Yes No
10. If yes, do Buses stop on them? ( , )?
Yes No
11. Behaviour of Bus Conductor / Driver: (ಬಸ ಕಂಡಕಟರ / ಚಾಲಕ ನಡವಳಕ): Ranking Very good
( ) Good
) Normal
( ) Bad
) Very bad
)
12. How often do you use Public Transport ?( ,
)? Every day (ಪರತದನ) Only on weekdays (ವಾರದ ದನಗಳು ಮಾತರ) Occasionally ( )
13. Would you like any Routes to be added to the existing system? ( )?
………………………………………………………………………………………………………
14. What is the purpose of your travel? (ನಮಮ ಪರಯಾಣದ ಉದದೀಶ )?
Work (ಕಲಸ) Education (ಶಕಷಣ) Shopping (ಶಾಪಂಗ) others (ಇತರ)
15. Earlier Mode of travel of the person: (ವಯಕತಯ ಪರವಾಸ ಮೊದಲನ ಕರಮ) …………………………….
16. Earlier Cost of Travel of the person: (ವಯಕತಯ ಪರಯಾಣ ಮೊದಲನ ವಚಚ): ……………………….
17. Do you use private buses/IPT for commuting within the city? Why? ( / ? )? .............................................................................
Davanagere City Bus Service Evaluation Report 2013
31 | P a g e
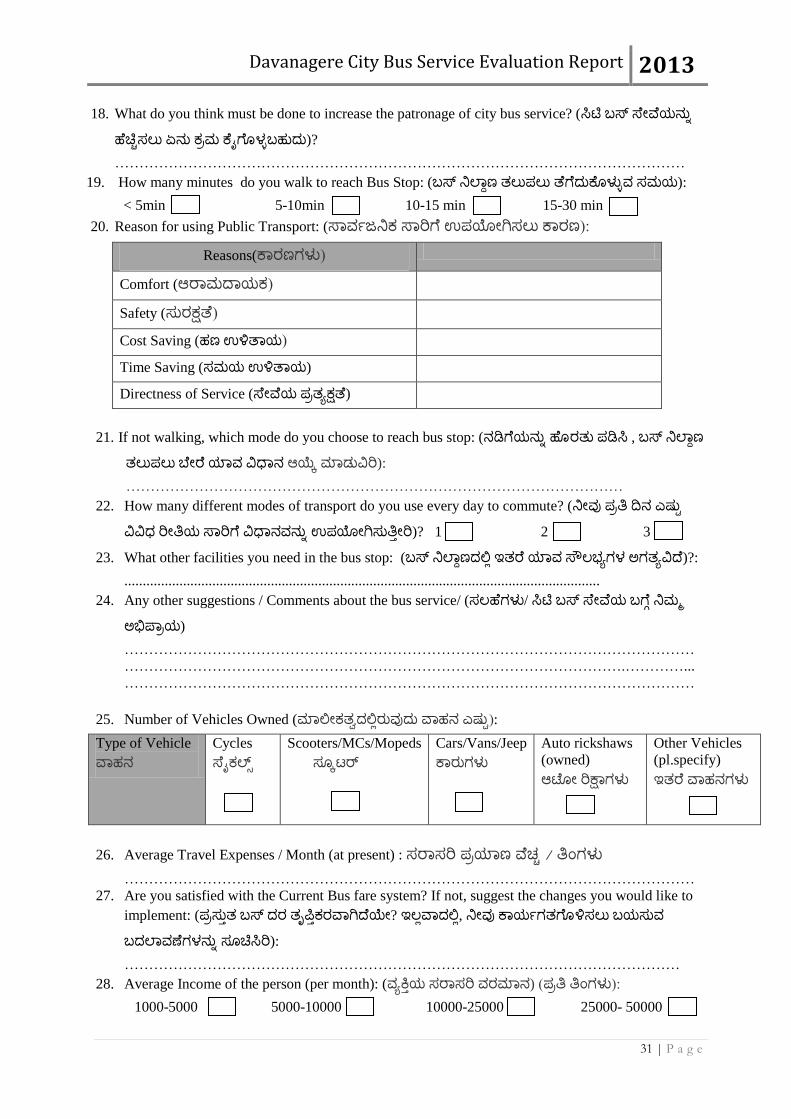
18. What do you think must be done to increase the patronage of city bus service? ( )?
………………………………………………………………………………………………………
19. How many minutes do you walk to reach Bus Stop: ( ):
< 5min 5-10min 10-15 min 15-30 min
20. Reason for using Public Transport: (ಸಾವವಜನಕ ಸಾರಗ ಉಪಯೀಗಸಲು ಕಾರಣ):
Reasons(ಕಾರಣಗಳು)
Comfort (ಆರಾಮದಾಯಕ)
Safety (ಸುರಕಷತ)
Cost Saving ( )
Time Saving ( )
Directness of Service ( )
21. If not walking, which mode do you choose to reach bus stop: ( ,
ಆಯಕ ): …………………………………………………………………………………………
22. How many different modes of transport do you use every day to commute? ( )? 1 2 3
23. What other facilities you need in the bus stop: ( )?:
..................................................................................................................................
24. Any other suggestions / Comments about the bus service/ ( / )
………………………………………………………………………………………………………
………………………………………………………………………………………….…………...
………………………………………………………………………………………………………
25. Number of Vehicles Owned (ಮಾಲೀಕತವದಲರುವುದು ವಾಹನ ಎಷುಟ): Type of Vehicle
ವಾಹನ
Cycles
ಸೖಕಲಸು
Scooters/MCs/Mopeds
ಸಕಟರ
Cars/Vans/Jeep
ಕಾರುಗಳು Auto rickshaws
(owned)
ಆಟಕೀ ರಕಷಾಗಳು
Other Vehicles
(pl.specify)
ಇತರ ವಾಹನಗಳು
26. Average Travel Expenses / Month (at present) : ಸರಾಸರ ಪರಯಾಣ ವಚಚ / ತಂಗಳು ………………………………………………………………………………………………………
27. Are you satisfied with the Current Bus fare system? If not, suggest the changes you would like to
implement: ( ? ,
): ……………………………………………………………………………………………………
28. Average Income of the person (per month): (ವಯಕತಯ ಸರಾಸರ ವರಮಾನ) (ಪರತ ತಂಗಳು): 1000-5000 5000-10000 10000-25000 25000- 50000

Davanagere City Bus Service Evaluation Report 2013
32 | P a g e
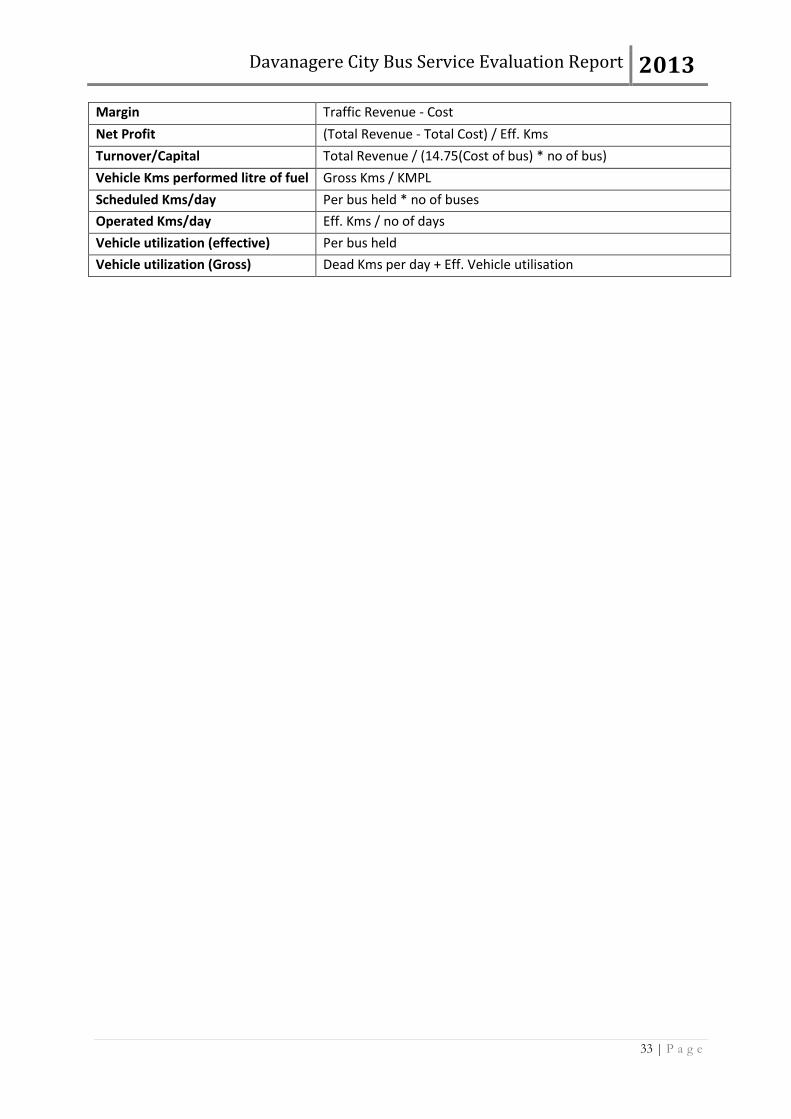
ANNEXURE II
Total Eff. Kms Per bus held * no. of buses held * no of days
% Fleet Utilisation (Average no. of buses on-road / Average no. of buses held) * 100
Pass. Kms. (Lakhs) Traffic Revenue(in Lakhs) / .85
Seat Kms. (Lakhs) 42(no of seat) * Total Eff. Kms.(in Lakhs)
% Load Factor (Pass. Kms. (Lakhs) / Seat Kms. (Lakhs)) * 100
Pass. Carried/bus on road/day Passanger Carried / no of bus on road / no of days
Gross Kms.(Lakhs) Total Eff. Kms + Total Dead Kms
Staff on Workshop & Maintenance 0.9 * Average no. of buses held
Staff on Administration & Accounts
0.1 * Average no. of buses held
Staff per bus on-road Total Staff / Average no. of buses on-road
Eff.kms per staff per day Total Eff. Kms.(in Lakhs) * 100000 / no of days / Total Staff
Passenger Tax(in Lakhs) Traffic Revenue(in Lakhs) * 0.056
Total Revenue Traffic Revenue + Other Revenue
(paise/km) (Total Revenue (in Lakhs) / Total Eff. Kms.(in Lakhs)) * 101
% Cancel Kms (Cancel Kms / Schedule Kms) * 100
EPKM Traffic Revenue / Eff. Kms
Passenger per bus Total passengers / Schedule
Load Factor EPKM / 42(no of seat) / 0.85 * 100
Operational effeciency Eff. Kms / Schedule
KMPL Gross Kms / Hour Schedule per day(HSD)
CPKM Cost / Eff. Kms
Total Cost per Vehicle Kms CPKM / no. of vehicles
HSD Cost HSD * 45.7
Spare 0.28 * Eff. Kms
Tyres and Tubes 0.70 * Eff. Kms
Lubricants 0.10 * Eff. Kms
Others 0.06 * Eff. Kms
Dep on vehicle 2.81 * Eff. Kms
MV Tax Traffic Revenue * 0.056
Recondition 0.05 * Eff. Kms
Staff 1900 * Operation schedule
Dep / other assests 0.15 *Eff. Kms
Central overhead 0.50 * Eff. Kms
Interest 0.23 * Eff. Kms
Mact 0.10 * Eff. Kms
Miscellaneous 1.45 * Eff. Kms
Cost HSD Cost + Spare + Tyres and Tubes + Lubricants + Others + Dep on vehicle + MV Tax + Recondition + Staff + (Dep/other assests) + Central overhead + Interest + Mact + Miscellaneous
Davanagere City Bus Service Evaluation Report 2013
33 | P a g e
Margin Traffic Revenue - Cost
Net Profit (Total Revenue - Total Cost) / Eff. Kms
Turnover/Capital Total Revenue / (14.75(Cost of bus) * no of bus)
Vehicle Kms performed litre of fuel Gross Kms / KMPL
Scheduled Kms/day Per bus held * no of buses
Operated Kms/day Eff. Kms / no of days
Vehicle utilization (effective) Per bus held
Vehicle utilization (Gross) Dead Kms per day + Eff. Vehicle utilisation
Davanagere City Bus Service Evaluation Report 2013
34 | P a g e
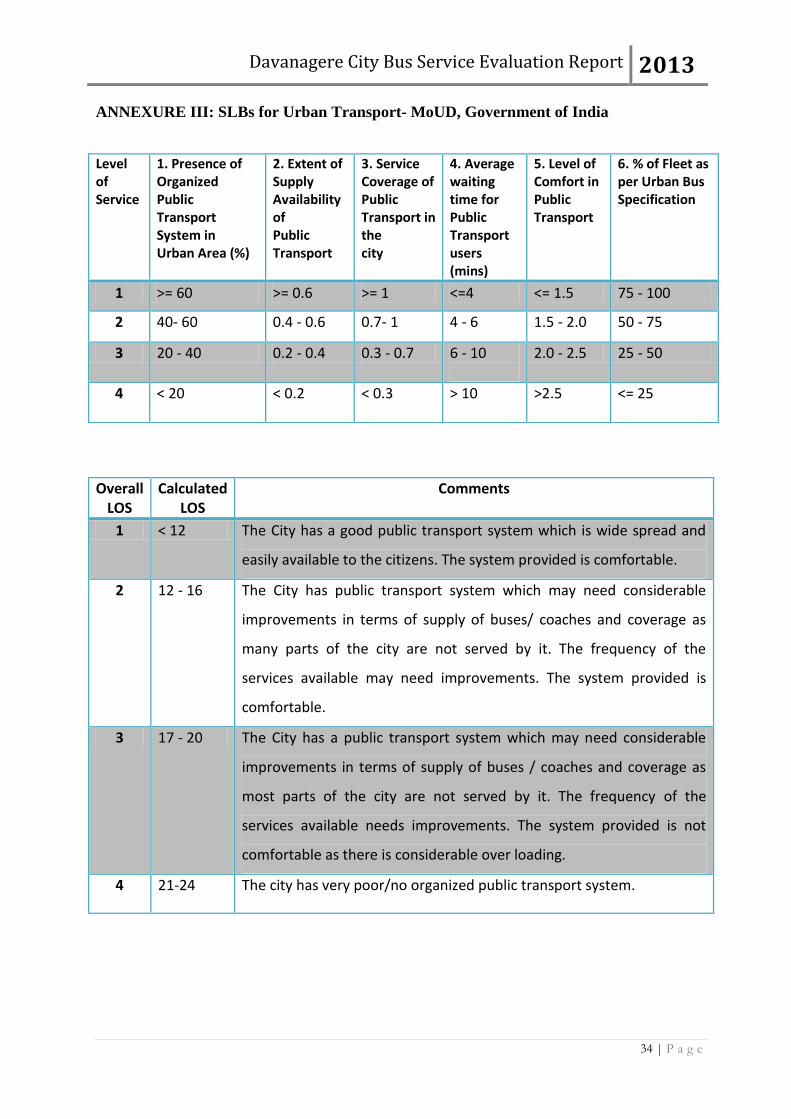
ANNEXURE III: SLBs for Urban Transport- MoUD, Government of India
Overall LOS
Calculated LOS
Comments
1 < 12 The City has a good public transport system which is wide spread and
easily available to the citizens. The system provided is comfortable.
2 12 - 16 The City has public transport system which may need considerable
improvements in terms of supply of buses/ coaches and coverage as
many parts of the city are not served by it. The frequency of the
services available may need improvements. The system provided is
comfortable.
3 17 - 20 The City has a public transport system which may need considerable
improvements in terms of supply of buses / coaches and coverage as
most parts of the city are not served by it. The frequency of the
services available needs improvements. The system provided is not
comfortable as there is considerable over loading.
4 21-24 The city has very poor/no organized public transport system.
Level of Service
1. Presence of Organized Public Transport System in Urban Area (%)
2. Extent of Supply Availability of Public Transport
3. Service Coverage of Public Transport in the city
4. Average waiting time for Public Transport users (mins)
5. Level of Comfort in Public Transport
6. % of Fleet as per Urban Bus Specification
1 >= 60 >= 0.6 >= 1 <=4 <= 1.5 75 - 100
2 40- 60 0.4 - 0.6 0.7- 1 4 - 6 1.5 - 2.0 50 - 75
3 20 - 40 0.2 - 0.4 0.3 - 0.7 6 - 10
2.0 - 2.5 25 - 50
4 < 20 < 0.2
< 0.3
> 10 >2.5 <= 25
Davanagere City Bus Service Evaluation Report 2013
35 | P a g e
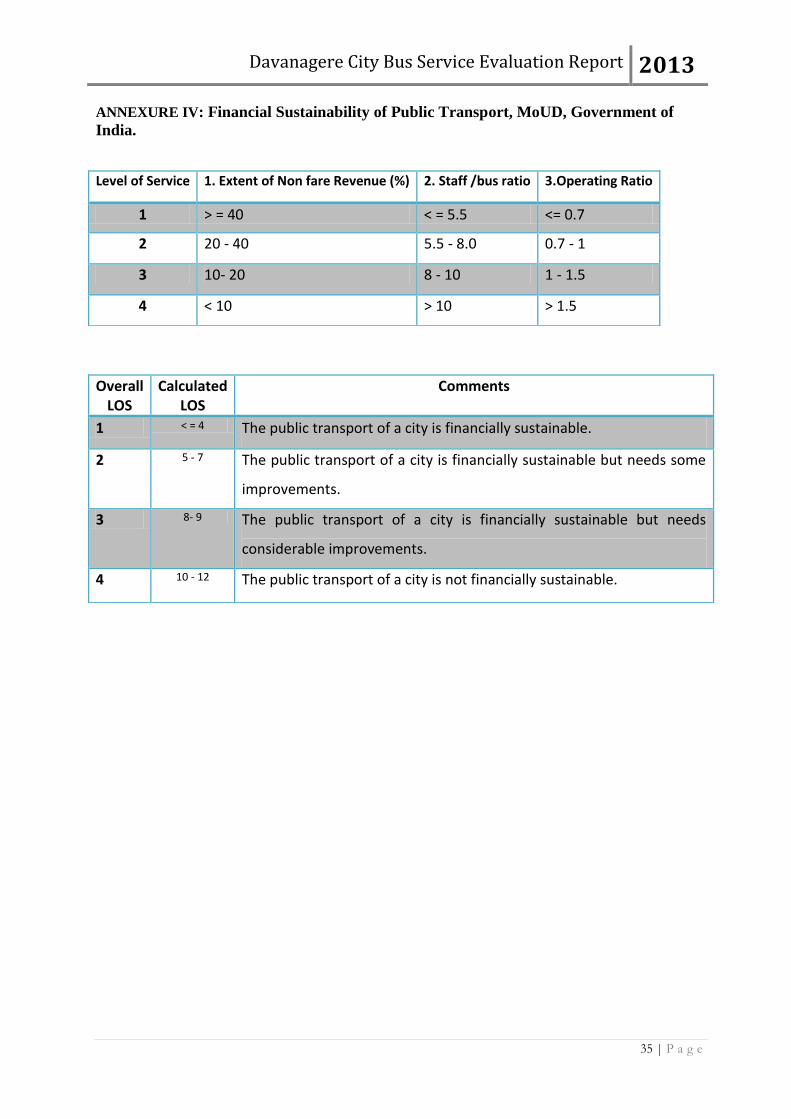
ANNEXURE IV: Financial Sustainability of Public Transport, MoUD, Government of
India.
Level of Service 1. Extent of Non fare Revenue (%) 2. Staff /bus ratio 3.Operating Ratio
1 > = 40 < = 5.5 <= 0.7
2 20 - 40 5.5 - 8.0 0.7 - 1
3 10- 20 8 - 10 1 - 1.5
4 < 10 > 10 > 1.5
Overall LOS
Calculated LOS
Comments
1 < = 4 The public transport of a city is financially sustainable.
2 5 - 7 The public transport of a city is financially sustainable but needs some
improvements.
3 8- 9 The public transport of a city is financially sustainable but needs
considerable improvements.
4 10 - 12 The public transport of a city is not financially sustainable.
Davanagere City Bus Service Evaluation Report 2013
36 | P a g e
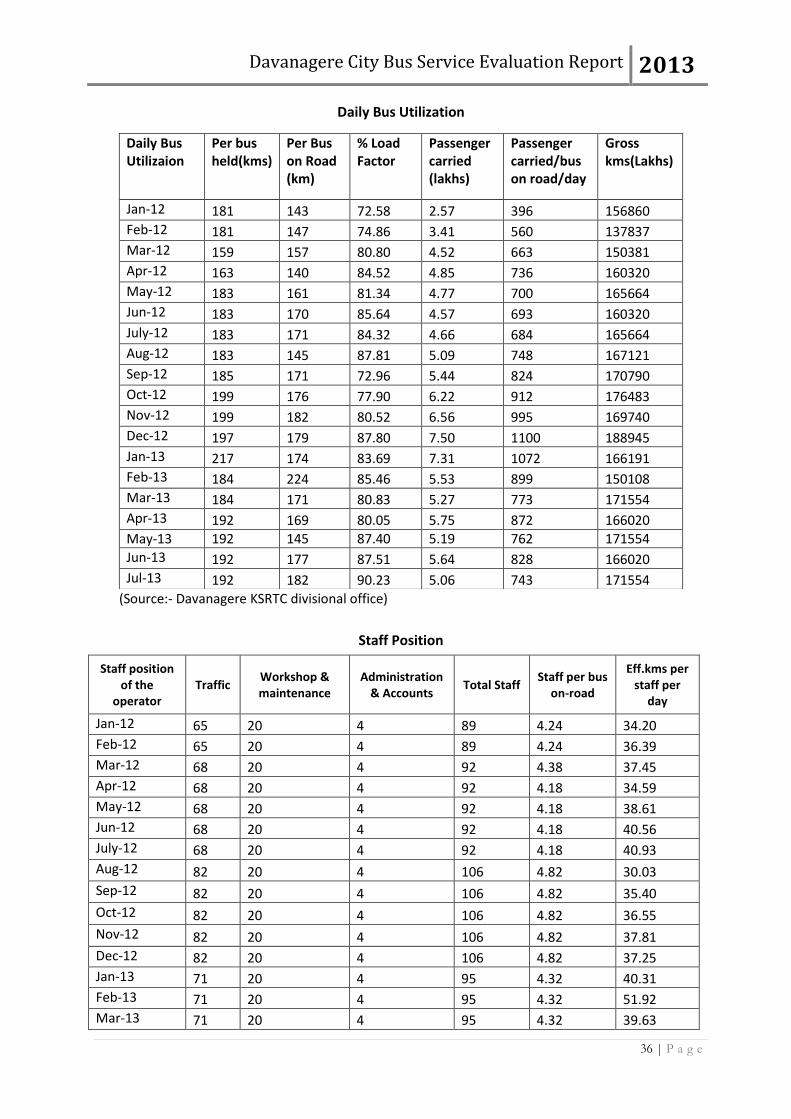
Daily Bus Utilization
(Source:- Davanagere KSRTC divisional office)
Staff Position
Staff position of the
operator Traffic
Workshop & maintenance
Administration & Accounts
Total Staff Staff per bus
on-road
Eff.kms per staff per
day
Jan-12 65 20 4 89 4.24 34.20
Feb-12 65 20 4 89 4.24 36.39
Mar-12 68 20 4 92 4.38 37.45
Apr-12 68 20 4 92 4.18 34.59
May-12 68 20 4 92 4.18 38.61
Jun-12 68 20 4 92 4.18 40.56
July-12 68 20 4 92 4.18 40.93
Aug-12 82 20 4 106 4.82 30.03
Sep-12 82 20 4 106 4.82 35.40
Oct-12 82 20 4 106 4.82 36.55
Nov-12 82 20 4 106 4.82 37.81
Dec-12 82 20 4 106 4.82 37.25
Jan-13 71 20 4 95 4.32 40.31
Feb-13 71 20 4 95 4.32 51.92
Mar-13 71 20 4 95 4.32 39.63
Daily Bus Utilizaion
Per bus held(kms)
Per Bus on Road (km)
% Load Factor
Passenger carried (lakhs)
Passenger carried/bus on road/day
Gross kms(Lakhs)
Jan-12 181 143 72.58 2.57 396 156860
Feb-12 181 147 74.86 3.41 560 137837
Mar-12 159 157 80.80 4.52 663 150381
Apr-12 163 140 84.52 4.85 736 160320
May-12 183 161 81.34 4.77 700 165664
Jun-12 183 170 85.64 4.57 693 160320
July-12 183 171 84.32 4.66 684 165664
Aug-12 183 145 87.81 5.09 748 167121
Sep-12 185 171 72.96 5.44 824 170790
Oct-12 199 176 77.90 6.22 912 176483
Nov-12 199 182 80.52 6.56 995 169740
Dec-12 197 179 87.80 7.50 1100 188945
Jan-13 217 174 83.69 7.31 1072 166191
Feb-13 184 224 85.46 5.53 899 150108
Mar-13 184 171 80.83 5.27 773 171554
Apr-13 192 169 80.05 5.75 872 166020
May-13 192 145 87.40 5.19 762 171554
Jun-13 192 177 87.51 5.64 828 166020
Jul-13 192 182 90.23 5.06 743 171554

Davanagere City Bus Service Evaluation Report 2013
37 | P a g e
Staff position of the
operator Traffic
Workshop & maintenance
Administration & Accounts
Total Staff Staff per bus
on-road
Eff.kms per staff per
day
Apr-13 71 20 4 95 4.32 37.91
May-13 71 20 4 95 4.32 33.69
Jun-13 73 20 4 97 4.41 40.14
Jul-13 73 20 4 97 4.41 41.29
(Source: Davanagere KSRTC divisional office)
Fuel Performance
(Source:- Davanagere KSRTC divisional office)
Financial aspects
Fuel performance Kms. Per litre of Diesel (KMPL)
Jan-12 4.16
Feb-12 4.16
Mar-12 4.18
Apr-12 4.24
May-12 4.29
Jun-12 4.33
July-12 4.40
Aug-12 4.42
Sep-12 4.47
Oct-12 4.57
Nov-12 4.54
Dec-12 4.59
Jan-13 4.59
Feb-13 4.75
Mar-13 4.74
Apr-13 4.74
May-13 4.75
Jun-13 4.79
Jul-13 4.65
Financial Traffic Revenue
(in Lakhs)
Passenger Tax (in Lakhs)
Other Revenue (in Lakhs)
Total Revenue (in Lakhs)
Jan-12 16.74 0 0 16.74
Feb-12 17.19 0 0 17.19
Mar-12 21.1 0 0 21.1
Apr-12 19.74 0 0 19.74

Davanagere City Bus Service Evaluation Report 2013
38 | P a g e
(Source: - Davanagere KSRTC divisional office)
May-12 21.9 0 0 21.9
Jun-12 23.45 0 0 23.45
July-12 24.07 0 0 24.07
Aug-12 21.19 0 0 21.19
Sep-12 20.09 0 0 20.09
Oct-12 22.88 0 0 22.88
Nov-12 23.68 0 0 23.68
Dec-12 26.28 0 0 26.28
Jan-13 24.29 0 0 24.29
Feb-13 28.86 0 0 28.86
Mar-13 23.07 0 0 23.07
Apr-13 21.86 0 0 21.86
May-13 21.21 0 0 21.21
Jun-13 24.99 0 0 24.99
Jul-13 27.4 0 0 27.4