Datum Conversion Issues with LIDAR Spot Elevation … · Datum Conversion Issues with LIDAR Spot...
6
Datum Conversion Issues with LIDAR Spot Elevation Data Richard C. Daniels Abstract Light Detection and Ranging (LIDAR] elevation data are gener- ally referenced to the World Geodetic System of 1984 datum. To utilize these data in a local or regional setting, it is often necessary to convert the elevation data to a traditional vertical datum such as the North American Vertical Datum of 1988. This datum conversion is done utilizing a local geoid model developed through a detailed GPS survey covering the area of interest or a model developed by the National Geodetic Survey Three techniques are described here for identifying systematic errors that may be introduced into LIDAR elevation data during this conversion process. Introduction Light Detection and Ranging (L~AR) systems have proven to be efficient, timely, and cost-effective methods for obtaining ele- vation data over large areas (Watkins and Conner, 2000).How- ever, as the precision and availability of LIDAR elevation data have improved, the need to tie the LIDAR elevations to a local geodetic control network and to identify and correct system- atic errors within the data has increased. This paper presents three methods for ground-truthing LIDAR elevation data to insure the data have been correctly converted into the desired datum and that any systematic offsets that may exist in the data are identified and removed. LIDAR systems use a laser with a known wavelength that emits a pulse of light toward a surface. The time elapsed between the emission of the pulse and the return from the sur- face is measured. The distance, or range, over which the pulse traveled is calculated based on the elapsed time and the speed of light. When combined with Global Positioning System (GPS) and inertial navigation data, the ranges stored by the onboard computer may be converted to a three-dimensional spot posi- tion-in this case expressed in International Terrestrial Refer- ence Frame (ITRF) coordinates based on the World Geodetic System of 1984 (WGS 84) datum. To utilize this data in a local or regional setting, it is often necessary to convert the WGS 84 ellipsoid heights to a vertical datum such as the North American Vertical Datum of 1988 (NAVD 88). This conversion requires the use of a geoid model, where the geoid is the equipotential surface of the gravity field of the Earth which best fits, in a least-squares sense, mean sea level. The geoid model used may be developed by conducting a GPS survey within the region of interest or by using models available in the United States from the National Geodetic Sur- vey (e.g., GEOID96 or GEoID~~). Project Background The Southwest Washington Coastal Erosion Study is investigat- ing coastal erosion processes within the Columbia River litto- ral cell (Figure I), which extends 165 km in length from Coastal Monitoring & Analysis Program, Department of Ecol- ogy, P.O. Box 47600, Olympia, WA 98504-7600 (rdan46lQecy.- wa.gov; rdan46162yahoo.com). Tillamook Head, Oregon to Point Grenville, Washington. The study is funded and coordinated by the Washington Depart- ment of Ecology (Ecology)and the U.S. Geological Survey (USGS) Coastal and Marine Geology Program (Kaminsky et al., 1998).The study is currently utilizing LIDAR spot elevation data collected by the Airborne LIDAR Assessment of Coastal Ero- sion (ALACE) Project in 1997 and 1998 to develop digital eleva- tion models (DEM) of the region. The DEMS have been used to calculate sediment volumes, identify morphologic changes, derive shorelines, and aid in the production of digital orthophotos within the littoral cell (Gelfenbaum and Kaminsky, 2000). The ALACE Project is a collaborative effort between the NOAA Coastal Services Center, the NASA Wallops Flight Facil- ity, the NOAA Aircraft Operations Center, and the USGS Coastal and Marine Geology Program (Krabill et al., 1997).The project is designed to demonstrate the capability of aircraft LIDAR map- ping to provide accurate information on coastal processes (e.g., Sallenger et a]., 1999). The ALACE Project currently uses the Airborne Topo- graphic Mapper 2 (ATM-2) LIDAR system developed by NASA's Wallops Flight Facility, Wallops Island, Virginia (Krabill et al., 1995).During beach surveys the ATM-2 laser transmitter was operated at a frequency-doubled wavelength of 523 nrn in the blue-green spectral region with a pulse rate of 5,000 Hz. The sys- tem was flown at an altitude of about 700 m and had a LDAR swath width of 350 m. During the flights the ATM-2 collected 3,000 to 5,000 spot elevations per second at a ground speed of approximately 60 meters per second (135miles per hour). Each individual spot elevation was derived from a laser footprint 0.5 to 1 m in diameter (Meredith et al., 1998;Krabill et al., 1999). Working in cooperation with the NOAA Coastal Services Center, Ecology has conducted extensive quality assurance tests on the LIDAR data gathered for southwest Washington and northwest Oregon by the ALACE Project. This paper describes three tests that users of LIDAR data may conduct to quantify the accuracy of their vertical height data and to identify systematic offsets in the data that may have been introduced during the datum conversion process. Datum Conversion The height data derived from a Lmm system is a product of the measured ranges (from the laser) and the computed aircraft tra- jectory (from the GPS). The information collected by the laser, inertial navigation system, and onboard GPS receiver are stored on-board during the mission. The data are post-processed using information from a GPS base station, and the horizontal and Photogrammetric Engineering & Remote Sensing Vol. 67, No. 6, June 2001, pp. 735-740. 0099-1112/01/6706-735$3,00/0 O 2001 American Society for Photogrammetry and Remote Sensing I PHOTOGRAMMETRIC ENGINEERING a REMOTE SENSING /one 2001 735
Transcript of Datum Conversion Issues with LIDAR Spot Elevation … · Datum Conversion Issues with LIDAR Spot...

Datum Conversion Issues with LIDAR Spot Elevation Data
Richard C. Daniels
Abstract Light Detection and Ranging (LIDAR] elevation data are gener- ally referenced to the World Geodetic System of 1984 datum. To utilize these data in a local or regional setting, it is often necessary to convert the elevation data to a traditional vertical datum such as the North American Vertical Datum of 1988. This datum conversion is done utilizing a local geoid model developed through a detailed GPS survey covering the area of interest or a model developed by the National Geodetic Survey Three techniques are described here for identifying systematic errors that may be introduced into LIDAR elevation data during this conversion process.
Introduction Light Detection and Ranging ( L ~ A R ) systems have proven to be efficient, timely, and cost-effective methods for obtaining ele- vation data over large areas (Watkins and Conner, 2000). How- ever, as the precision and availability of LIDAR elevation data have improved, the need to tie the LIDAR elevations to a local geodetic control network and to identify and correct system- atic errors within the data has increased. This paper presents three methods for ground-truthing LIDAR elevation data to insure the data have been correctly converted into the desired datum and that any systematic offsets that may exist in the data are identified and removed.
LIDAR systems use a laser with a known wavelength that emits a pulse of light toward a surface. The time elapsed between the emission of the pulse and the return from the sur- face is measured. The distance, or range, over which the pulse traveled is calculated based on the elapsed time and the speed of light. When combined with Global Positioning System (GPS) and inertial navigation data, the ranges stored by the onboard computer may be converted to a three-dimensional spot posi- tion-in this case expressed in International Terrestrial Refer- ence Frame (ITRF) coordinates based on the World Geodetic System of 1984 (WGS 84) datum.
To utilize this data in a local or regional setting, it is often necessary to convert the WGS 84 ellipsoid heights to a vertical datum such as the North American Vertical Datum of 1988 (NAVD 88). This conversion requires the use of a geoid model, where the geoid is the equipotential surface of the gravity field of the Earth which best fits, in a least-squares sense, mean sea level. The geoid model used may be developed by conducting a GPS survey within the region of interest or by using models available in the United States from the National Geodetic Sur- vey (e.g., GEOID96 or G E o I D ~ ~ ) .
Project Background The Southwest Washington Coastal Erosion Study is investigat- ing coastal erosion processes within the Columbia River litto- ral cell (Figure I), which extends 165 km in length from
Coastal Monitoring & Analysis Program, Department of Ecol- ogy, P.O. Box 47600, Olympia, WA 98504-7600 (rdan46lQecy.- wa.gov; rdan46162yahoo.com).
Tillamook Head, Oregon to Point Grenville, Washington. The study is funded and coordinated by the Washington Depart- ment of Ecology (Ecology) and the U.S. Geological Survey (USGS) Coastal and Marine Geology Program (Kaminsky et al., 1998). The study is currently utilizing LIDAR spot elevation data collected by the Airborne LIDAR Assessment of Coastal Ero- sion (ALACE) Project in 1997 and 1998 to develop digital eleva- tion models (DEM) of the region. The DEMS have been used to calculate sediment volumes, identify morphologic changes, derive shorelines, and aid in the production of digital orthophotos within the littoral cell (Gelfenbaum and Kaminsky, 2000).
The ALACE Project is a collaborative effort between the NOAA Coastal Services Center, the NASA Wallops Flight Facil- ity, the NOAA Aircraft Operations Center, and the USGS Coastal and Marine Geology Program (Krabill et al., 1997). The project is designed to demonstrate the capability of aircraft LIDAR map- ping to provide accurate information on coastal processes (e.g., Sallenger et a]., 1999).
The ALACE Project currently uses the Airborne Topo- graphic Mapper 2 (ATM-2) LIDAR system developed by NASA's Wallops Flight Facility, Wallops Island, Virginia (Krabill et al., 1995). During beach surveys the ATM-2 laser transmitter was operated at a frequency-doubled wavelength of 523 nrn in the blue-green spectral region with a pulse rate of 5,000 Hz. The sys- tem was flown at an altitude of about 700 m and had a LDAR swath width of 350 m. During the flights the ATM-2 collected 3,000 to 5,000 spot elevations per second at a ground speed of approximately 60 meters per second (135 miles per hour). Each individual spot elevation was derived from a laser footprint 0.5 to 1 m in diameter (Meredith et al., 1998; Krabill et al., 1999).
Working in cooperation with the NOAA Coastal Services Center, Ecology has conducted extensive quality assurance tests on the LIDAR data gathered for southwest Washington and northwest Oregon by the ALACE Project. This paper describes three tests that users of LIDAR data may conduct to quantify the accuracy of their vertical height data and to identify systematic offsets in the data that may have been introduced during the datum conversion process.
Datum Conversion The height data derived from a Lmm system is a product of the measured ranges (from the laser) and the computed aircraft tra- jectory (from the GPS). The information collected by the laser, inertial navigation system, and onboard GPS receiver are stored on-board during the mission. The data are post-processed using information from a GPS base station, and the horizontal and
Photogrammetric Engineering & Remote Sensing Vol. 67, No. 6, June 2001, pp. 735-740.
0099-1112/01/6706-735$3,00/0 O 2001 American Society for Photogrammetry
and Remote Sensing
I PHOTOGRAMMETRIC ENGINEERING a REMOTE SENSING /one 2001 735
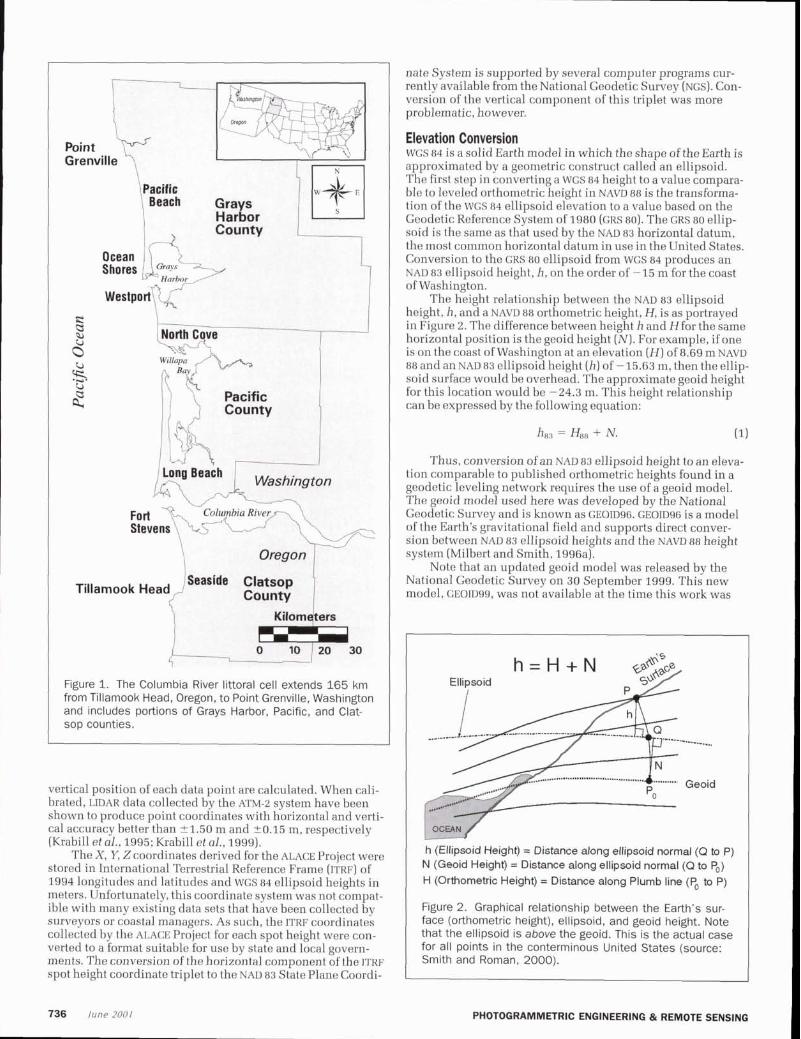
Figure 1. The Columbia River littoral cell extends 165 km from Tillamook Head, Oregon, to Point Grenville, Washington and includes portlons of Grays Harbor, Pacific, and Clat- sop counties.
vertical position of each data point are calculated. When cali- brated, LIDAR data collected by the ATM-8 system have been shown to produce point coordinates with horizontal and verti- cal accuracy better than 51.50 m and 20.15 m, respectively (Krabill et al., 1995; Krabill et al., 1999).
The X, Y, Z coordinates derived for the ALACE Project were stored in International Terrestrial Reference Frame (ITRF) of 1994 longitudes and latitudes and W G ~ 84 ellipsoid heights in meters. Unfortunately, this coordinate system was not compat- ible with many existing data sets that have been collected by surveyors or coastal managers. As such, the rrw coordinates collected by the ALACE Project for each spot height were con- verted to a format suitable for use by state and local govern- ments. The conversion of the horizontal component of the ITRF spot height coordinate triplet to the NAD 83 State Plane Coordi-
nate System is supported by several computer programs cur- rently available from the National Geodetic Survey (NGS). Con- version of the vertical component of this triplet was more problematic, however.
Elevation Conversion WGS 84 is a solid Earth model in which the shape of the Earth is approximated by a geometric construct called an ellipsoid. The first step in converting a WGS 84 height to a value compara- ble to leveled orthometric height in NAVD 88 is the transforma- tion of the W G ~ 84 ellipsoid elevation to a value based on the Geodetic Reference System of 1980 (GRS 80). The GRS 80 ellip- soid is the same as that used by the NAD 83 horizontal datum, the most common horizontal datum in use in the United States. Conversion to the GRS 80 ellipsoid from WGS 84 produces an NAD 83 ellipsoid height, h, on the order of -15 m for the coast of Washington.
The height relationship between the NAD 83 ellipsoid height, h , and a NAVD 88 orthometric height, H, is as portrayed in Figure 2. The difference between height h and Hfor the same horizontal position is the geoid height (N). For example, if one is on the coast of Washington at an elevation (H) of 8.69 m NAVD 88 and an NAD 83 ellipsoid height (h) of - 15.63 m, then the ellip- soid surface would be overhead. The approximate geoid height for this location would be -24.3 m. This height relationship can be expressed by the following equation:
Thus, conversion of an NAD 83 ellipsoid height to an eleva- tion comparable to published orthometric heights found in a geodetic leveling network requires the use of a geoid model. The geoid model used here was developed by the National Geodetic Survey and is known as GEOID96. GEOID96 is a model of the Earth's gravitational field and supports direct conver- sion between NAD 83 ellipsoid heights and the NAVD 88 height system (Milbert and Smith, 1996a).
Note that an updated geoid model was released by the National Geodetic Survey on 30 September 1999. This new model, GEOID99, was not available at the time this work was
h (Ellipsoid Height) = Distance along ellipsoid normal (Q to P) N (Geoid Height) = Distance along ellipsoid normal (Q to Po) H (Orthometric Height) = Distance along Plumb line (Po to P)
Figure 2. Graphical relationship between the Earth's sur- face (orthometric height), ellipsoid, and geoid height. Note that the ellipsoid is above the geoid. This is the actual case for all points in the conterminous United States (source: Smith and Roman, 2000).
PHOTOGRAMMETRIC ENGINEERING & REMOTE SENSING

conducted. The new geoid model improves on GEOID96 by including over 400,000 additional gravity measurements, using an updated 1-arc-second digital terrain model for the U.S. Pacific Northwest, and by fitting the model to 6,169 NAD 83 GPS heights on NAVD 88 leveled benchmarks. By utilizing addi- tional NAVD 88 benchmarks, the new model is able to more pre- cisely support the direct conversion between GPS-derived NAD 83 ellipsoid heights and NAVD 88 orthometric heights. The additional benchmarks have improved the fit of the geoid model. GEOID96 had an absolute agreement of 20.055 m (1 sigma) relative to 2,951 benchmarks while GEOID99 has an absolute agreement of f0.046 m (1 sigma) relative to 6,169 benchmarks (Reilly, 2000; Fei and Sideris, 2000).
The development of the GEOID96 model (and now ~ ~ 0 ~ 9 9 ) has allowed GPS users to interpolate a geoid height for any hori- zontal position in the United States, and to subtract this value from their GPS-derived NAD 83 ellipsoid height, h,,, to obtain an estimated NAVD 88 orthometric height, H,,. When utilizing Equation 1 to derive an estimated NAVD 88 orthometric height, "do not expect the difference of a GPS ellipsoidal height at a point and the associated GEOID96 height to exactly match the vertical datum you need" (Milbert and Smith, 1996b). The dif- ference between the leveled and estimated orthometric height for a station is partially a result of error in the geoid model and other problems with datum definition.
The GPS-derived height, H,,, for a previously surveyed benchmark may be subtracted from the published or leveled orthometric height for the same point to obtain a "local orthometric height correction factor." After the local orthomet- ric height correction factor is calculated for a given area, it may be applied to other nearby stations to obtain sub-decimeter accuracy (Milbert and Smith, 1996b). If many points over an extensive area (>lo0 km) are used to estimate the correction fac- tor, trends in the correction factor may be detected (this point illustrates why the ALACE Project stored its data in ITRFIWGS 84 coordinates rather than in one of the traditional datums, such as NAVD 88). Once the correction factor has been determined for a given region, Equation 1 may be rewritten as follows:
into Equation 2. However, because the base station was not tied into the local geodetic network, the local correction factor was unknown and L was assumed to be zero.
In order to tie the LIDAR data to the local vertical control network, a description of the base station (station ASTO) was obtained from Mr. Earl Fredrick at the NASA Wallops Flight Facility and a geodetic survey was conducted that followed current National Geodetic Survey guidelines (Zilkoski et al., 1997). The goal of the survey was to derive vertical and hori- zontal coordinates for station ASTO, the mark used by NASA during the 1997 and 1998 LIDAR flights over the Columbia River littoral cell, that would be tied to the local geodetic con- trol network.
A two-day GPS survey was carried out that obtained base- lines between station ASTO (Figure 3) and three first-order benchmarks (UU 282, SMUR, and 944 0574 A TIDAL) that were located 1.5,8.2, and 19.7 kilometers from the station. The sur- vey consisted of six 45-minute sessions carried out over two days. The geodetic survey produced six independent baselines to station ASTO. All redundant baselines in the survey agreed to better than 2 cm and were used to derive adjusted horizontal and vertical coordinates for ASTO (Daniels et al., 1999).
The NAVD 88 elevation corresponding to the ITRFIWGS 84 coordinate used by NASA for station ASTO was 2.90 m. The ele- vation obtained by the geodetic survey was 3.03 m f0.02 m NAVD 88. Thus, a +0.13 m offset from the local NAVD 88 vertical control network in the spot elevation data was identified and corrected.
Local Orthometdc Height Correction In this case, a description for the base station was available from NASA and the physical point used for their base station was recoverable in the field. This may not always be the case. In sit- uations where a station description is not available, or the sta- tion is not recoverable, one may estimate the local orthometric height correction factor based on surveyed benchmarks within the area of interest. This option is based on the assumption that it is "known" that the base station was not tied to the local ver- tical network.
where L is the local orthometric height correction factor. In the case of southwest Washington and northwest Oregon, L was estimated independently in three ways (using base station cor- rection, local orthometric height correction, and regional offset correction).
Base Station Correction The calculation of point elevations for most LIDAR systems uti- lize the kinematic GPS survey technique (Trimble, 1996) with a base station at a known location and a roving receiver collo- cated with the Lmm instrument on the aircraft. Because the LIDM data analyzed here were referenced to ITRFIWGS 84, one cannot make the assumption that the base station was tied into the national geodetic leveling network. Even if the base station were located on a surveyed benchmark, where the orthometric height correction factor would be built into the elevation cor- rection process (i.e., H,, would be known), this correction would apply only to the immediate area surrounding the base station.
The base station used during the LIDAR survey of southwest Washington and northwest Oregon was not located on a lev- eled benchmark. The X, Y, Z coordinates of the base station were calculated independently of the local network by averag- ing over 48 hours of data collected by the GPS base station. The resulting station coordinates are assumed to be accurate within their own reference frame (i.e., 94, WGS 84). If the base sta- tion had been located at a surveyed benchmark, the local orthometric height correction factor would have been absorbed
Figure 3. Trimble 4400 GPS survey system setup over station ASTO at the Astoria Airport, Oregon during the geodetic survey that was conducted to derive first-order horizontal coordinates and a f 0.02 m NAVD 88 elevation for the station.
PHOTOGRAMMETRIC ENGINEERING & REMOTE SENSING

In southwest Washington and northwest Oregon, a National Geodetic Survey approved geodetic control network had been installed and surveyed throughout the region (Daniels et al., 1999). Several of the stations observed were benchmarks with both leveled NAVD 88 elevations and GPS-derived NAD 83 ellipsoid heights. The GEOID96 elevation for each station was calculated based on the station's horizontal coordinates. By rearranging Equation 2, the local orthometric height correction factor for each second-order or higher benchmark within the survey network was calculated (Table 1).
The average of the correction factors shown in Table 1 is +0.16 m. Note that the mean correction factor is within 0.03 m of the elevation offset calculated by the geodetic survey for the base station. This value (+0.16 m) provides an estimate of the average offset that is contained in the ALACE spot elevation data for the entire 165-km long Columbia River littoral cell.
The large linear extent of the littoral cell has made it possi- ble to detect a trend in the correction factor. In the study area, the correction factor ranges from 0.13 m at station 944 0574 A TIDAL, next to the Columbia River (about 3.8 km north of sta- tion ASTO), to 0.20 m at station SOUTH near Point Grenville, Washington, located 110 km north of the Columbia River.
Rgonai Offset Correction When information is not available as to the location of the base station and it is unknown if the local orthometric height correc- tion factor has been taken into account, a third option for detecting and correcting offsets in LDAR data sets exists. This option is based on the collection of sample survey points on the ground using real-time-kinematic (RTK) or kinematic GPS meth- ods. Survey points would be collected within the area covered by the LIDAR system at locations whose elevations have remained unchanged over the time that had elapsed since the flight. Exarn- ples of such sites include roads, parking lots, and sidewalks.
A large number of these ground-based sample points are needed, because LIDAR systems collect individual data points (spot elevations), not a continuous topographic surface. In many cases, these points are processed to derive a continuous raster DEM. However, it is the original spot elevation data that needs to be compared to the sample survey data. As such, pairs of ground sample and LIDAR points need to be obtained that have horizontal coordinates within 2.5 m of each other (the horizontal accuracy of the ATM-2 system used in Washington and Oregon was r1.50 m with a laser footprint of 0.5 to 1.0 m). Note that we assume here that common data points within this footprint are on a level surface.
The sampling scheme used in our region included 800 ran- dom samples surveyed within five areas distributed through-
out the length of the littoral cell. The sample data points were entered into a GIS, and a proximity analysis was conducted to obtain a listing of LIDAR spot elevations that were within 0.50 m and 2.50 m of the GPS sample points. Of the 800 points sam- pled, 75 were found to be within 0.5 m of a LIDAR point and 524 were found to be within 2.5 m of a LIDAR point. The difference in elevation between each GPS sample point and the height obtained by the LIDAR system was calculated. When plotted, these differences were found to be normally distributed around the mean.
Table 2 shows the mean elevation difference between the LIDAR and the GPS samples for each of the two sample groups. Of the 75 (524) samples in the 0.5 m (2.5 m) radius group, only 26 percent (30 percent) fell within 20.15 m of zero, the reported accuracy of the LIDAR system. Based on the assumption of anor- ma1 error distribution, the mean error should have been near zero. The fairly large size of the sample indicated that a positive offset or datum shift was present in the data. Based on this information, we used the mean as an estimate of the local orthometric height correction factor and subtracted the mean (taken to be +0.20 m) from the ATM-2 data. When the mean was subtracted from the spot elevations in Table 2, the percentage of samples that fell within 20.15 m of zero increased to 83 per- cent (84 percent) for the 0.5-m (2.5-m) radius group.
To test if the sampling method could identify regional trends in the mean elevation difference (also known as correc- tion factors), Figure 4 was constructed with the sample pairs obtained using the 2.5 m radius group. Note that the accuracy of the RTK-GPS method used was 20.02 m. In Figure 4, the sam- ple points have been divided based on latitude (northings) into five groups, and the mean offset was calculated for each. The groupings are based on the sampling sites used in the analysis and, from south to north, are Seaside, Oregon, Fort Stevens, Oregon, Long Beach, Washington, Westport, Washington, and Pacific Beach, Washington (see Figure 1).
The average offset for the five regions is +0.15 m, with the minimum value located at Seaside, Oregon and the maximum value located near Pacific Beach, Washington. These samples have a near linear trend, with the mean offset increasing as one travels north from the Columbia River toward Point Grenville, Washington. It is interesting to note that these mean values closely approximate the trend identified in Table 1, where local orthometric height correction factors were calculated using National Geodetic Survey benchmarks.
Results The ALACE Project has been successful in providing internally accurate digital elevation data that may be used for beach mor-
TABLE 1. CALCULATION OF THE LOCAL ORTHOMETRIC HEIGHT CORRECTION FACTOR BASED ON NATIONAL GEODETIC SURVEY BENCHMARKS WITH PUBLISHED NAVD 88, NAD 83 ELLIPSOID. AND GEOID96 HEIGHTS WITHIN SOUTHWEST WASHINGTON AND NORTHWEST OREGON. STATIONS ORDERED FROM NORTH TO SOUTH (VALUES IN METERS)
NAD 83 NAVD 88 GEOID96 Correction Benchmark Name NGS PID Northing Ellipsoid Elevation Separation Factor
SOUTH SD0132 225290 -19.65 4.643 -24.09 0.20 L 443 SDO129 223556 -17.46 6.857 -24.11 0.21 R 443 SD0117 212765 8.72 32.988 -24.07 0.20 944 1102 TIDAL 2 SD0042 181306 -19.92 4.652 -24.39 0.18 GUNVILLE SD0020 176953 -19.41 4.934 -24.19 0.15 FLAG SC0916 158294 -19.67 4.095 -23.64 0.13 SOUTH BEND SC2806 153108 2.42 25.193 -22.66 0.11 MESS SD0358 144910 -19.90 4.210 -23.96 0.15 x 537 SD0323 137587 -18.54 5.763 -24.15 0.15 M 536 sc1020 127434 -15.61 7.788 -23.29 0.11 TURN RM 4 SD0287 116240 -18.91 5.358 -24.11 0.16 944 05 74 A TIDAL sD0299 110670 -19.50 4.872 -24.24 0.13 x 711 sC1033 88256 -13.71 9.742 -23.30 0.15
Mean 0.16
Note: Projection is Washington State Plane, NAD 83, meters.
PHOTOGRAMMETRIC ENGINEERING & REMOTE SENSING

TABLE 2. DIFFERENCE OF RTK-GPS SAMPLE POINTS A N 0 LIDAR SPOT ELEVATIONS OBTAINED BY THE ATM-2 LIDAR SYSTEM FOR POINTS THAT ARE WITHIN 0.5 M
AND 2.5 M OF EACH OTHER (VALUES IN METERS)
Search Minimum Elevation Mean Elevation Maximum Elevation Number of Land-Cover 'Qpe Radius Difference Difference Difference Samples
Road or Sidewalk 0.5 rn -0.02 0.21 0.51 75 Road or Sidewalk 2.5 rn -0.63 0.20 0.89 524
0.25
0.20
0.15 $ u a3
0.10
0.05
0.00 75000 125000 175000 225000
Northing
Figure 4. Bin-averaged difference of RTK-GPS sample points and ATM-2 LIDAR spot elevations for five regions within the Columbia River littoral cell (values in meters).
phology mapping and beach erosion modeling over large areas (greater than 100 km in length). These point data were origi- nally collected using ITRF 94 horizontal coordinates and wGS 84 ellipsoid heights. Transformation of these coordinate triplets to the more familiar NAD 83 and NAVD 88 reference frames with- out the inclusion of local orthometric corrections may have introduced identifiable datum offsets in the derived products.
Within the Southwest Washington Coastal Erosion Study area three different correction factors were obtained. The cor- rection factors ranged from a low of +0.13 m at the NASA base station near the Columbia River in Oregon to a high of +0.21 m, the sample mean in Table 2. A regional trend in the local orthometric height correction factor was identified in Table 1 and Figure 4. When this trend is approximated by a linear regression line, it is possible to explain the range of values obtained by the three methods tested here. This regional trend implies that the use of an orthometric height correction factor calculated for the base station alone will not correct all offsets in the data, and that the correction factor required may vary based on the location of the LIDAR instrument in relation to the base station.
Concluslons The use of L ~ A R data to derive topographic data and to generate digital elevation models has moved from the basic research phase into production in just the last few years. LIDAR is now seen as a viable alternative to photogrammetric methods when highly accurate digital elevation data needs to be collected quickly (e.g., after a Hurricane). LID--derived elevation mod- els may be used with traditional air photography or satellite data to produce orthorectified images, thus avoiding the time consuming stereo-compilation process.
This paper has demonstrated three tests (i.e., base station correction, local orthometric height correction, and regional off- set correction) that may be used to isolate potential datum off- sets in LIDAR data. Users of Lmm data who require sub- decimeter accuracy and who plan to compare Lmm data to ele- vation data derived from conventional topographic surveys should conduct similar quality assurance tests. These surveys will insure that the LIDAR data have been corrected for the local orthometric height correction factor and that any potential off- sets in the data are identified and removed.
The importance of conducting some level of quality assur- ance tests on the very large data sets produced by a Lmm sur- vey cannot be over-stated. This need has grown as the precision of available LIDAR instrumentation has increased. This point is made by the following simple example. If a 2.0-m contour line were derived from LIDAR data for a beach with a slope of 2 per- cent, and the data contained a -0.20-m offset, the resulting con- tour line would be displaced landward from its true location by 10 m (30 feet). Such a large horizontal error could mitigate one of the primary motivations for using LIDAR data for mor- phologic mapping of dynamic surfaces, such as beaches.
Acknowledgments The LIDAR data employed in this analysis were provided to the Department of Ecology by the Airborne LmAR Assessment of Coastal Erosion (ALACE) Project, a collaborative effort between the NOAA Coastal Services Center, the NASA Wallops Flight Facility, the NoAA Aircraft Operations Center, and the U.S. Geo- logical Survey, Coastal and Marine Geology Program. The con- tributions of many individuals made this collaboration possible. The following individuals are recognized for their assistance in overseeing the acquisition and processing of addi- tional LIDAR data to support the needs of the Southwest Wash- ington Coastal Erosion Study: Abby Sallenger (u~Gs), John Brock (USGS), William Krabill (NASA), Bob Swift (NASA), David Eslinger (NOM, Coastal Services Center), and David McKinnie (National Ocean Service, Pacific Coast Program), who also pro- vided additional funding and support for this collaborative effort.
This research was conducted as part of the Southwest Washington Coastal Erosion Study, under the direction of the U.S. Geological Survey, Coastal and Marine Geology Program, and the Washington State Department of Ecology (Ecology), Coastal Monitoring & Analysis Program. I thank Robert Hux- ford and Diana McCandless (Ecology) for their assistance in collecting the truly random GPS sample points and Mike Hearne (NOAA, Coastal Services Center) for the timely delivery of the ATM-2 spot elevation data to Ecology. Thanks also go to George Kaminsky (Ecology), John Brock (USGS), Abby Sallenger (usGS), William Krabill (NASA, Wallops Flight Facility), Chres- ton F. Martin (EG&G), and John Sonntag (EG&G) for their review and comments on draft versions of this manuscript.
References Daniels, R.C., P. Ruggiero, and L. Weber, 1999. Washington Coastal
Geodetic Control Network: Report and Station Index, developed in support of the Southwest Washington Coastal Erosion Study, Publication No. 99-103, Coastal Monitoring & Analysis Program, Washington Department of Ecology, Olympia, Washington, 268 p.
PHOTOGRAMMETRIC ENGINEERING 81 REMOTE SENSING

Fei, Z., and M. Sideris, 2000. A new method for computing the ellipsoi- dal correction for Stokes's formula, Journal of Geodesy, 74(2):223-231.
Gelfenbaum, G., and G. Kaminsky, 2000. Southwest Washington Coastal Erosion Study Workshop Report 1999, Open-File Report 00-439, U.S. Geological Survey, Menlo Park, California, 187 p.
Kaminsky, G., P. Ruggiero, and G. Gelfenbaum, 1998. Monitoring coastal change in southwest Washington and northwest Oregon during the 1997/98 El Nifio, Shore 6. Beach, 66:42-51.
Krabill, W., and C. Martin, 1987. Aircraft positioning using Global Positioning System carrier phase data, Journal of the Institute of Navigation, 34:l-21.
Krabill, W., R. Thomas, C. Martin, R. Swift, and E. Frederick, 1995. Accuracy of airborne laser altimetry over the Greenland Ice Sheet, International Journal of Remote Sensing, 16:1211-1222.
Krabill, W., M. Jansen, and A. Sallenger, 1997. Draft Data Access Policy Statement (ALACE), NOAA, Coastal Services Center, Charleston, South Carolina, online document URL: http://www.crs.noaa.gov/ crs/tcm.
Krabill, W., E. Fredrick, S. Manizade, C. Martin, J. S o ~ t a g , R. Swift, R. Thomas, W. Wright, and J. Yungel, 1999. Rapid thinning of parts of the southern Greenland ice sheet, Science, 283:1522-1524.
Meredith, A,, W. Krabill, J. List, T. Reiss, E. Fredrick, C. Martin, J. Brock, R. Swift, R. Holman, K. Morgan, S. Manizade, J. Sonntag, A. Sallenger Jr., M. Hearne, M. Hansen, C. Wright, and J. Yungel, 1998. An Assessment of NASA's Airborne Topographic Mapper Instrument for Beach Topographic Mapping at Duck, North Caro- lina, Coastal Services Center Technical Report CSCI9-981001, U.S. Department of Commerce, NOAA, Coastal Services Center, Charleston, South Carolina, 87 p.
Milbert, D., and D. Smith, 1996a. Converting GPS height into NAVD 88 elevations with the GEOJD96 geoid height model, Proceedings
of GISILIS'96 Annual Conference and Exposition, November, Den- ver, Colorado, American Congress of Surveying and Mapping, Washington, D.C., pp. 681-692.
, 1996b. The GEOID96 Geoid Models, NOAA, National Geodetic Survey, Information Services Branch, Silver Spring, Maryland, online document URL: http://www.ngs.noaa.gov/GEOID/ readme.txt.
Reilly, J.A., 2000. The GPS Observer: GEOID99, POB Point of Beginning, 12-13 January, pp. 12-13.
Sallenger, A.H., W. Krabill, J. Brock, R. Swift, M. Jansen, S. Manizade, B. Richmond, M. Hampton, and D. Eslinger, 1999. Airborne laser study quantifies El Nifio-induced coastal change, EOS, 7hns. Am. Geophysical Union, 80(89]:92-93.
Smith, D., and D. Roman, 2000. What Is the Geoid? NOAA, National Geodetic Survey, Information Services Branch, Silver Spring, Maryland, online document URL: http://www.ngs.noaa.gov/ GEOIDlgeoid-def. html.
lkimble Navigation Limited, 1996. GPS Surveying: General Reference, Part Number 25748-20, Trimble Navigation Limited, Survey & Mapping Division, Sunnyvale, California, 72 p.
Watkins, R., and J. Conner, 2000. Mapping America's oldest city: Air- borne scanning laser technology got the job done within budget, FOB Point of Beginning, 14-16 February, pp. 14-17.
Zilkoski, D.B., J.D.DIOnofrio, and S.J. Frakes, 1997. Guidelines for Establishing GPS-Derived Ellipsoid Heights (Standards: 2 cm and 5 cm], Version 4.3, NOAA Technical Memorandum NOS NGS-58, National Geodetic Information Center, National Geodetic Survey, National Oceanic and Atmospheric Administration, U.S. Depart- ment of Commerce, Silver Spring, Maryland, 25 p.
(Received 16 May 2000; accepted 03 August 2000; revised 05 Septem- ber 2000)
Buy SPOT Imagery at a Discount: Sales Benefit ASPRS Education Program
Any ASPRS individual member is eligible to receive a 10% discount on purchases of SPOT satellite imagery. SPOT Image will contribute two percent of all data pur- chases made by individual ASPRS members to the ASPRS Education Initiative as part of the Society's new Partners in Education Program.
The savings on satellite image purchases for ASPRS members can range from $75 to $440 per SPOT product ordered. The discount, now in effect, is for all standard Level 1 and SPOTView products that are not already covered by a larger discount, or by a contractual agreement with SPOT.
ASPRS created the Partners in Education Program to support the Society's effort to educate stu-
dents from K through 14, as well as the public, about the modern uses of remote sensing, Geographic
Information Systems (GIs), and photogrammetry. (See http://www.asprs.org for more information
about the Program.) Through the Partners in Education Program, ASPRS Sustaining Members pro-
vide direct support to the ASPRS education agenda through tax-free donations.
The global SPOT system includes multiple Earth observation satellites, 24 ground
receiving stations worldwide and more than 100 international distributors. SPOT is
an experienced provider of commercial satellite imagery and information products,
with 14 years of continuous operations and over 8 million archived images col-
lected since 1986. For more information, see http://www.spot.com/spot-us.htm.
PHOTOGRAMMETRIC ENGINEERING & REMOTE SENSING