DATA SUPPLEMENT Cost-Effectiveness of Initiating ...
26
1 DATA SUPPLEMENT Cost-Effectiveness of Initiating Pharmacological Treatment in Stage One Hypertension Based on 10-Year Cardiovascular Disease Risk: A Markov Modelling Study Margaret Constanti 1 , Christopher N. Floyd 2 , Mark Glover 3 , Rebecca Boffa 1 , Anthony S. Wierzbicki* 4 , Richard J McManus.* 5 1. National Guideline Centre (NGC), Regent’s Park, London NW1 4LE 2. Department of Clinical Pharmacology, King’s College London, St Thomas’ Hospital Campus, London SE1 7EH 3. MRC Clinician Scientist, Faculty of Medicine & Health Sciences, Queen's Medical Centre, Nottingham NG7 2UH 4. Department of Metabolic Medicine/Chemical Pathology, Guy’s & St Thomas’ Hospitals, London SE1 7EH 5. Nuffield Department of Primary Care Health Sciences, University of Oxford, Oxford OX2 6GG. *Joint senior authors Correspondence to: Margaret Constanti National Guideline Centre (NGC) 11 St Andrews Place, Regent’s Park, London NW1 4LE [email protected] +44 (0) 2037 457379 ext. 1005
Transcript of DATA SUPPLEMENT Cost-Effectiveness of Initiating ...
1
DATA SUPPLEMENT Cost-Effectiveness of Initiating Pharmacological Treatment in Stage One Hypertension Based on 10-Year Cardiovascular Disease Risk: A Markov Modelling Study
Margaret Constanti1, Christopher N. Floyd2, Mark Glover3, Rebecca Boffa1, Anthony S.
Wierzbicki*4, Richard J McManus.*5
1. National Guideline Centre (NGC), Regent’s Park, London NW1 4LE
2. Department of Clinical Pharmacology, King’s College London, St Thomas’ Hospital
Campus, London SE1 7EH
3. MRC Clinician Scientist, Faculty of Medicine & Health Sciences, Queen's Medical
Centre, Nottingham NG7 2UH
4. Department of Metabolic Medicine/Chemical Pathology, Guy’s & St Thomas’
Hospitals, London SE1 7EH
5. Nuffield Department of Primary Care Health Sciences, University of Oxford, Oxford
OX2 6GG.
*Joint senior authors
Correspondence to:
Margaret Constanti
National Guideline Centre (NGC)
11 St Andrews Place, Regent’s Park, London NW1 4LE
+44 (0) 2037 457379 ext. 1005

2
3
Table of Contents
Technical appendix ............................................................................................................... 4
Additional methodological details ........................................................................................ 5
1. Model inputs ......................................................................................................... 5
2. Cardiovascular events ............................................................................................ 5
3. CVD risk ................................................................................................................. 5
4. Adverse events ...................................................................................................... 5
5. QALY loss due to adverse events ........................................................................... 6
6. Resource use: Drug costs ....................................................................................... 6
7. Hospital costs: ....................................................................................................... 6
8. Model Validation ................................................................................................... 7
9. Sensitivity analyses: ............................................................................................... 7
Additional Results ................................................................................................................. 8
10. Sensitivity analyses further details ......................................................................... 8
Supplementary tables and figures: ....................................................................................... 9
Alternative treatment effects .............................................................................. 16
Additional results tables ...................................................................................... 18
Figures…. ............................................................................................................. 24
References ............................................................................................................................ 9

4
Technical appendix
5
Additional methodological details
1. Model inputs
Model inputs were based on clinical evidence identified in a systematic review (see chapter C, NICE 2019 hypertension guideline),1 supplemented by additional data sources as required (see Table 1 & supplemental tables S1, S2, S3, S4, S5, S7, S8, S9, S10). Model inputs were validated with clinical members of the guideline committee.
2. Cardiovascular events
The non-fatal cardiovascular events considered were: stable angina (SA); unstable angina (UA); myocardial infarction (MI); transient ischaemic attack (TIA); stroke; and heart failure (HF). Heart failure is not always included in risk calculators,2 but evidence showed that antihypertensive treatment reduces the risk of new heart failure.3
The relative distributions of first CVD events based on age and sex, other than heart failure, were directly extracted from the literature and are shown in table S1.4 The relative distribution for heart failure was calculated using the incidence of heart failure relative to the total incidence of the other CVD events for each age group and gender.5
3. CVD risk
CVD risk was determined only by the pre-defined risk subgroup in the model. In particular, the starting age and gender of the population being modelled was independent of risk. For example, if the focus was on the 10% risk subgroup: whether the starting cohort was aged 40 or 70 did not affect the level of risk, as the CVD risk being modelled was still a risk of 10%. However, the distribution of events within that 10% risk varied by age and gender.6 Age subgroups were incorporated into the model because an event avoided at a younger age would accrue benefits over a longer period of time. Additionally, non-CVD mortality varied by age and gender.
4. Adverse events
SPRINT reported injurious falls and acute kidney injury (AKI) resulting in hospitalisation (i.e. serious adverse events). These risks were applied to those aged 60 and over on treatment, reflecting the population in SPRINT.
The relative risk of AKI for those over 75 versus under 75 (in the standard treatment arm) was calculated from a SPRINT sub-study.7 and applied to the probability of AKI for those aged over 75.
6
5. QALY loss due to adverse events
Disutility associated with AKI was based on that of renal failure (0.525), taken from the Sullivan catalogue of EQ-5D utilities at an average age of 60 years (rounded up to the nearest 10) and subtracted from the general population utility for that age.8
The disutility from a fall was based on a hip fracture, and taken from a systematic review on utilities associated with Osteoporosis.9
6. Resource use: Drug costs
The most commonly prescribed drug in each class was extracted from Prescription Cost Analysis.10 No specific data for drug prescription was available for stage 1 hypertension and so general population prescriptions were used. Drug costs were applied to the percentage of people on 1, 2 or 3 plus drugs by age band and gender based on data from 27 GP practices from the CPRD database11 (personal communication S Ley-Flurrie) (Table S3).
Monitoring resource use and costs were based on the number of consultations needed by number of drugs, and the number of tests needed by type of drug (see Table S5). A UK study showed the average follow-up frequency after intensification of medication was about 1.3 months, and mean time from recording a raised BP to intensification of medication was around 6 months.12 The model was simplified by applying all first-year costs of the different steps of treatment in the first year of the model, a conservative assumption because some people may in fact die before treatment escalation. The average number of consultations when established on treatment based on CPRD data was 1.9 GP consultations per year.13 Blood pressure monitoring was assumed to happen during consultations.
7. Hospital costs:
Where the source was stated as NHS reference costs, this included all resources related to the hospital admission. For stroke: The event state included NHS and social care costs. Recurrent strokes were also included in the costs. The costs for TIA, MI, unstable angina, and heart failure were all from the same source (See Table 1), and included all healthcare costs after a first event. See full model write-up for further detail.
Resource use associated with adverse events was based on the cost and length of hospital stays for AKI, or injurious falls (NICE CG161)14. The average length of hospital stay following a fall was reported as 2.7 days.15 A greater stay of 8.6 days for those admitted for a fall aged over 65 years (personal communication, Julia Titterton) was tested in a sensitivity analysis.

7
8. Model Validation
Results were validated by comparing undiscounted life years for men and women age 60 on no treatment (taking a straight average of the life years from the four risk subgroups) with the life expectancy of men and women aged 60 from the Life tables for England 2016 (the source used for life expectancy in the model).16
9. Sensitivity analyses:
Probabilistic Sensitivity Analysis (PSA)
PSA was undertaken to assess parameter uncertainty. Where possible, distributions were attached to inputs in the model. For the distribution of first events and of people on 1, 2 and 3 drugs, the dirichlet distribution was used. For the incidence of heart failure, probabilities of adverse events, and utilities, the beta distribution was used, which is bounded between 0 and 1. SMR’s and relative risks were made probabilistic using the lognormal distribution. The model was run for 5000 simulations for the base case and each probabilistic sensitivity analysis.
Deterministic sensitivity analyses (DSA)
DSA were conducted including running the model for alternative age groups (probabilistic) and testing differential treatment durations in the no treatment group (probabilistic), which involved modelling patients starting treatment after various defined periods of time (e.g. 5 years, see table S7), to capture that people may develop other risk factors over time that would make them eligible for treatment, as this was not captured explicitly in the model (apart from people going onto treatment if they had a CVD event).
Threshold Analysis
The minimum cardiovascular risk levels by sex and age group were calculated using the UK QRISK2 calculator,17 to assess whether the threshold risk levels identified by the model were clinically feasible using the following values:
Untreated SBP of 140 mmHg for all age groups (minimum for stage 1 hypertension)
Total cholesterol (TC): high-density lipoprotein cholesterol (HDL-C) ratio of 2.5. (estimated from 2.5th percentile from the National Diet and Nutrition Survey)18
All other variables within the calculator were left blank.

8
Additional Results
10. Sensitivity analyses further details
Treatment effect
Table S14 shows that using the upper confidence interval of treatment effect can lead to treatment being dominated in all groups. This is because some of the upper confidence intervals were above 1. The relative cardiovascular risks used in the base case were considered very conservative, and tables S12 and S13 support the inference that less conservative relative risks would make treatment even more cost effective, and these are likely to be closer to the treatment effect in practice.
Differential treatment duration
For men, the assumptions made about differential treatment duration affected the base-case conclusion in younger people, as there was some uncertainty about whether it was cost-effective to treat everyone in these groups if they may become eligible for treatment in a shorter time frame. For women, the differential treatment durations did not impact the base case conclusions because it was still not cost effective to treat all younger women (aged 40 and 50), regardless of durations tested.

9
References 1. National Institute for Health and Care Excellence. Hypertension in Adults: Diagnosis
and Management (NG136).; 2019.
2. ClinRisk Ltd. Qrisk 2-2017 risk calculator. Published online 2017.
3. Brunström M, Carlberg B. Association of blood pressure lowering with mortality and cardiovascular disease across blood pressure levels a systematic review and meta-analysis. JAMA Intern Med. 2018;178(1):28-36. doi:10.1001/jamainternmed.2017.6015
4. National Institute for Health and Clinical Excellence. Statins for the Preventions of Cardiovascular Events (TA94).; 2006.
5. Cowie MR, Wood DA, Coats AJS, et al. Incidence and aetiology of heart failure: A population-based study. Eur Heart J. 1999;20(6):421-428. doi:10.1053/euhj.1998.1280
6. National Clinical Guideline Centre. Cardiovascular Risk Assessment and Reduction, Including Lipid Modification (CG181). NICE; 2014.
7. Rocco M V., Sink KM, Lovato LC, et al. Effects of Intensive Blood Pressure Treatment on Acute Kidney Injury Events in the Systolic Blood Pressure Intervention Trial (SPRINT). Am J Kidney Dis. 2018;71(3):352-361. doi:10.1053/j.ajkd.2017.08.021
8. Sullivan PW, Slejko JF, Sculpher MJ, Ghushchyan V. Catalogue of EQ-5D scores for the United Kingdom. Med Decis Mak. 2011;31(6):800-804. doi:10.1177/0272989X11401031
9. Peasgood T, Herrmann K, Kanis JA, Brazier JE. An updated systematic review of health state utility values for osteoporosis related conditions. Osteoporos Int. 2009;20(6):853-868. doi:10.1007/s00198-009-0844-y
10. Prescription Cost Analysis - NHS Digital.
11. Clinical Practice Research Datalink | CPRD.
12. Xu W, Goldberg SI, Shubina M, Turchin A. Optimal systolic blood pressure target, time to intensification, and time to follow-up in treatment of hypertension: Population based retrospective cohort study. BMJ. 2015;350. doi:10.1136/bmj.h158
13. McManus RJ. Evaluating the impact of the 2011 NICE Hypertension Guideline on the Management of Hypertension in Primary Care and Subsequent Outcomes — SPCR.
14. National Institute for Health and Care Excellence. Falls in Older People: Assessing Risk and Prevention (CG161).; 2013.
15. Kenny R., O’Shea D, Walker H. Impact of a Dedicated Syncope and Falls Facility for Older Adults on Emergency Beds - PubMed. Age Ageing. 2002;31(4):272-275.
16. National life tables, UK: 2014 to 2016 - Office for National Statistics.
10
17. Hippisley-Cox J, Coupland C, Vinogradova Y, et al. Predicting cardiovascular risk in England and Wales: Prospective derivation and validation of QRISK2. BMJ. 2008;336(7659):1475-1482. doi:10.1136/bmj.39609.449676.25
18. Public Health England FSA. NDNS: Results from Years 7 and 8 (Combined): Results of the National Diet and Nutrition Survey (Ndns) Rolling Programme for 2014 to 2015 and 2015 to 2016.; 2018. https://www.gov.uk/government/statistics/ndns-results-from-years-7-and-8-combined
11
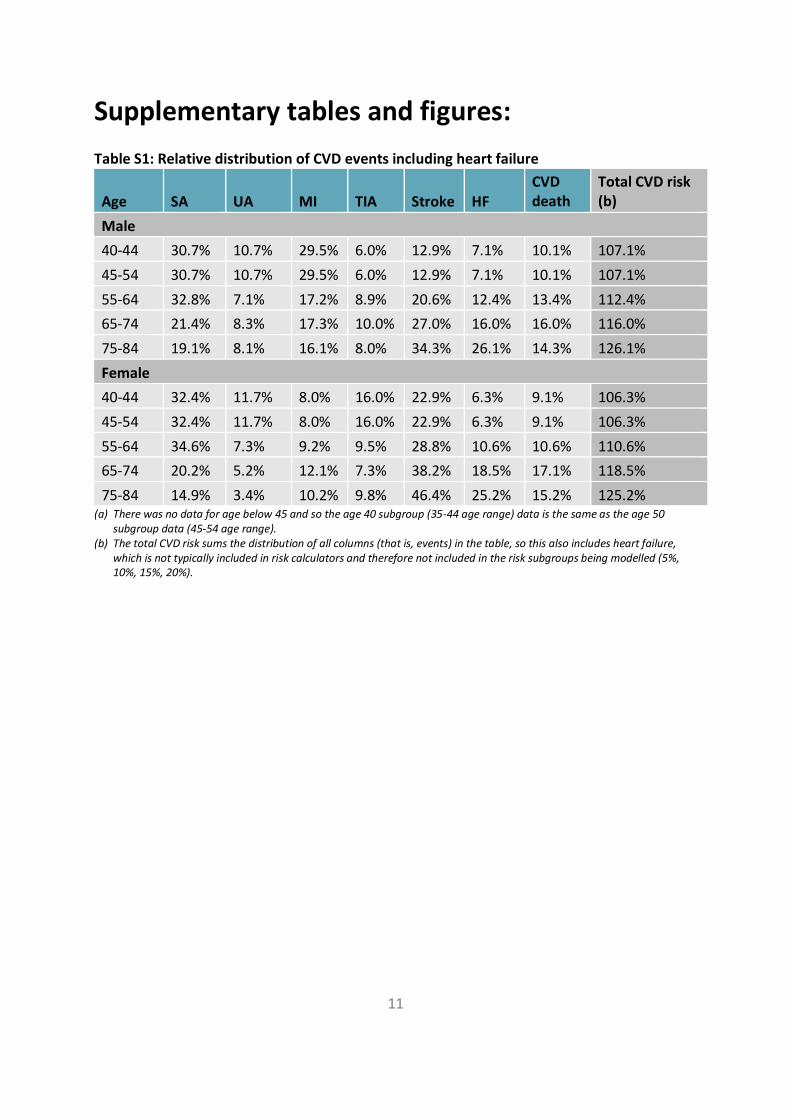
Supplementary tables and figures:
Table S1: Relative distribution of CVD events including heart failure
Age SA UA MI TIA Stroke HF CVD death
Total CVD risk (b)
Male
40-44 30.7% 10.7% 29.5% 6.0% 12.9% 7.1% 10.1% 107.1%
45-54 30.7% 10.7% 29.5% 6.0% 12.9% 7.1% 10.1% 107.1%
55-64 32.8% 7.1% 17.2% 8.9% 20.6% 12.4% 13.4% 112.4%
65-74 21.4% 8.3% 17.3% 10.0% 27.0% 16.0% 16.0% 116.0%
75-84 19.1% 8.1% 16.1% 8.0% 34.3% 26.1% 14.3% 126.1%
Female
40-44 32.4% 11.7% 8.0% 16.0% 22.9% 6.3% 9.1% 106.3%
45-54 32.4% 11.7% 8.0% 16.0% 22.9% 6.3% 9.1% 106.3%
55-64 34.6% 7.3% 9.2% 9.5% 28.8% 10.6% 10.6% 110.6%
65-74 20.2% 5.2% 12.1% 7.3% 38.2% 18.5% 17.1% 118.5%
75-84 14.9% 3.4% 10.2% 9.8% 46.4% 25.2% 15.2% 125.2% (a) There was no data for age below 45 and so the age 40 subgroup (35-44 age range) data is the same as the age 50
subgroup data (45-54 age range). (b) The total CVD risk sums the distribution of all columns (that is, events) in the table, so this also includes heart failure,
which is not typically included in risk calculators and therefore not included in the risk subgroups being modelled (5%, 10%, 15%, 20%).
12
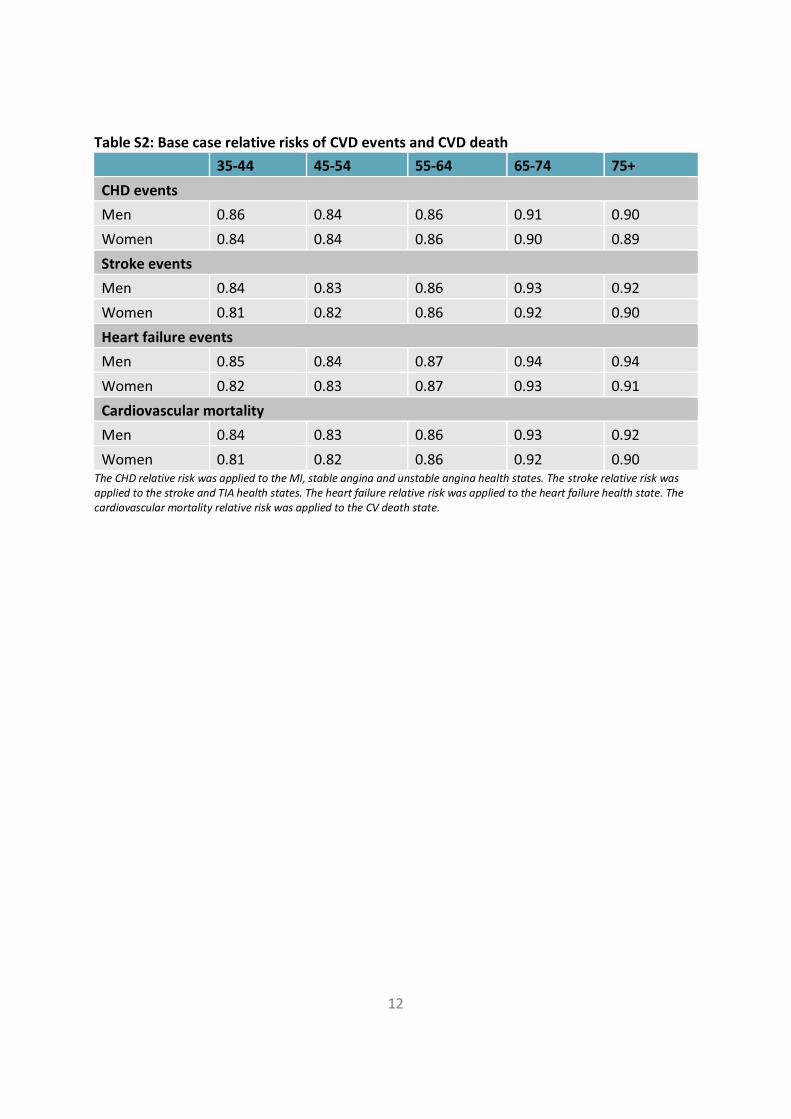
Table S2: Base case relative risks of CVD events and CVD death
35-44 45-54 55-64 65-74 75+
CHD events
Men 0.86 0.84 0.86 0.91 0.90
Women 0.84 0.84 0.86 0.90 0.89
Stroke events
Men 0.84 0.83 0.86 0.93 0.92
Women 0.81 0.82 0.86 0.92 0.90
Heart failure events
Men 0.85 0.84 0.87 0.94 0.94
Women 0.82 0.83 0.87 0.93 0.91
Cardiovascular mortality
Men 0.84 0.83 0.86 0.93 0.92
Women 0.81 0.82 0.86 0.92 0.90 The CHD relative risk was applied to the MI, stable angina and unstable angina health states. The stroke relative risk was applied to the stroke and TIA health states. The heart failure relative risk was applied to the heart failure health state. The cardiovascular mortality relative risk was applied to the CV death state.
13
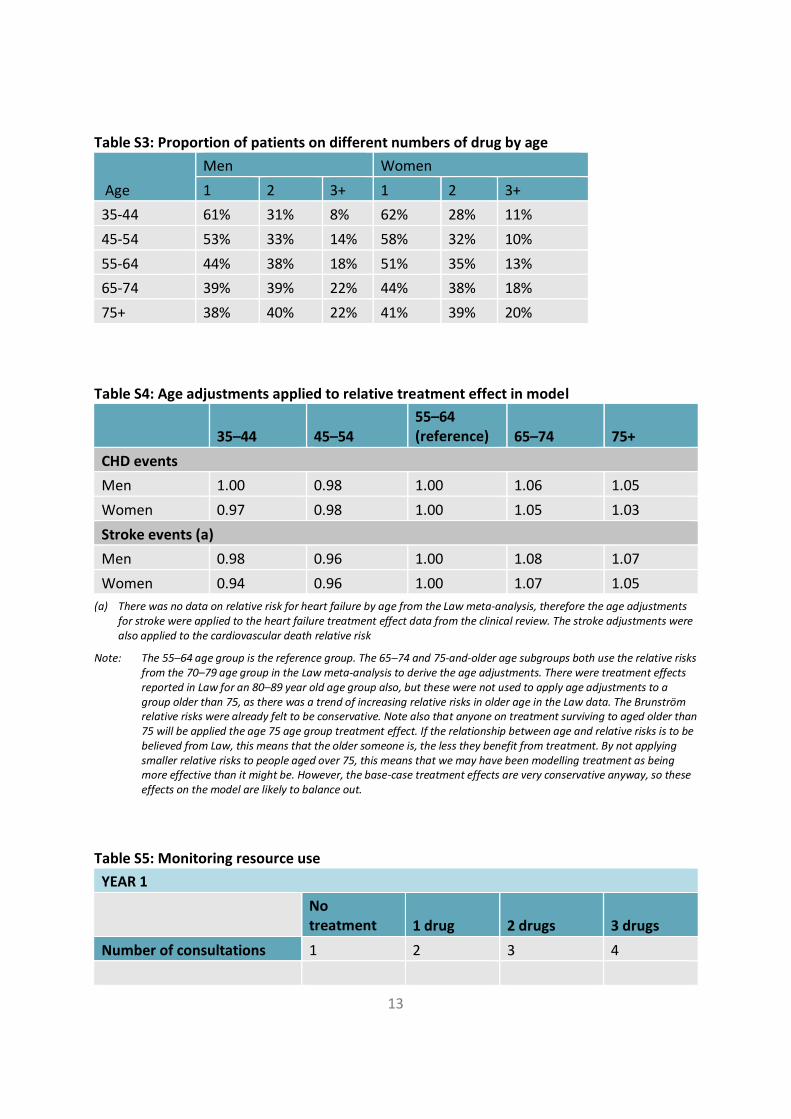
Table S3: Proportion of patients on different numbers of drug by age
Age
Men Women
1 2 3+ 1 2 3+
35-44 61% 31% 8% 62% 28% 11%
45-54 53% 33% 14% 58% 32% 10%
55-64 44% 38% 18% 51% 35% 13%
65-74 39% 39% 22% 44% 38% 18%
75+ 38% 40% 22% 41% 39% 20%
Table S4: Age adjustments applied to relative treatment effect in model
35–44 45–54 55–64 (reference) 65–74 75+
CHD events
Men 1.00 0.98 1.00 1.06 1.05
Women 0.97 0.98 1.00 1.05 1.03
Stroke events (a)
Men 0.98 0.96 1.00 1.08 1.07
Women 0.94 0.96 1.00 1.07 1.05
(a) There was no data on relative risk for heart failure by age from the Law meta-analysis, therefore the age adjustments for stroke were applied to the heart failure treatment effect data from the clinical review. The stroke adjustments were also applied to the cardiovascular death relative risk
Note: The 55–64 age group is the reference group. The 65–74 and 75-and-older age subgroups both use the relative risks from the 70–79 age group in the Law meta-analysis to derive the age adjustments. There were treatment effects reported in Law for an 80–89 year old age group also, but these were not used to apply age adjustments to a group older than 75, as there was a trend of increasing relative risks in older age in the Law data. The Brunström relative risks were already felt to be conservative. Note also that anyone on treatment surviving to aged older than 75 will be applied the age 75 age group treatment effect. If the relationship between age and relative risks is to be believed from Law, this means that the older someone is, the less they benefit from treatment. By not applying smaller relative risks to people aged over 75, this means that we may have been modelling treatment as being more effective than it might be. However, the base-case treatment effects are very conservative anyway, so these effects on the model are likely to balance out.
Table S5: Monitoring resource use
YEAR 1
No treatment 1 drug 2 drugs 3 drugs
Number of consultations 1 2 3 4
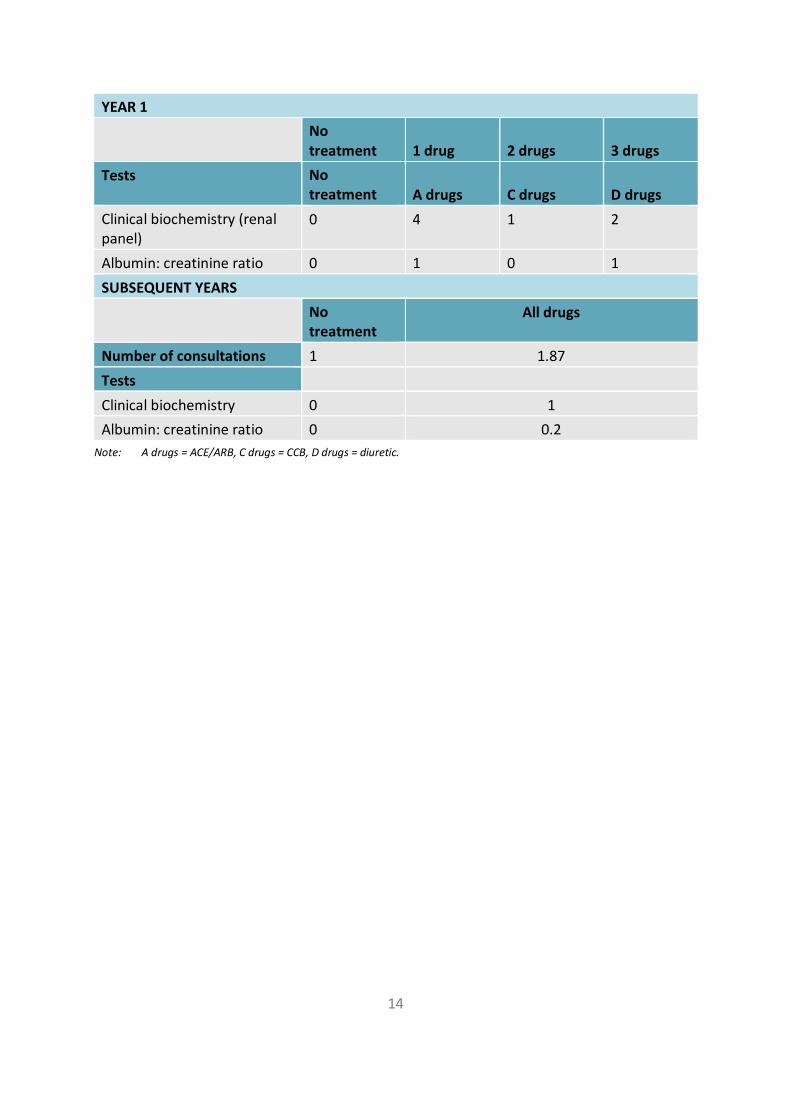
14
YEAR 1
No treatment 1 drug 2 drugs 3 drugs
Tests No treatment A drugs C drugs D drugs
Clinical biochemistry (renal panel)
0 4 1 2
Albumin: creatinine ratio 0 1 0 1
SUBSEQUENT YEARS
No treatment
All drugs
Number of consultations 1 1.87
Tests
Clinical biochemistry 0 1
Albumin: creatinine ratio 0 0.2
Note: A drugs = ACE/ARB, C drugs = CCB, D drugs = diuretic.
15
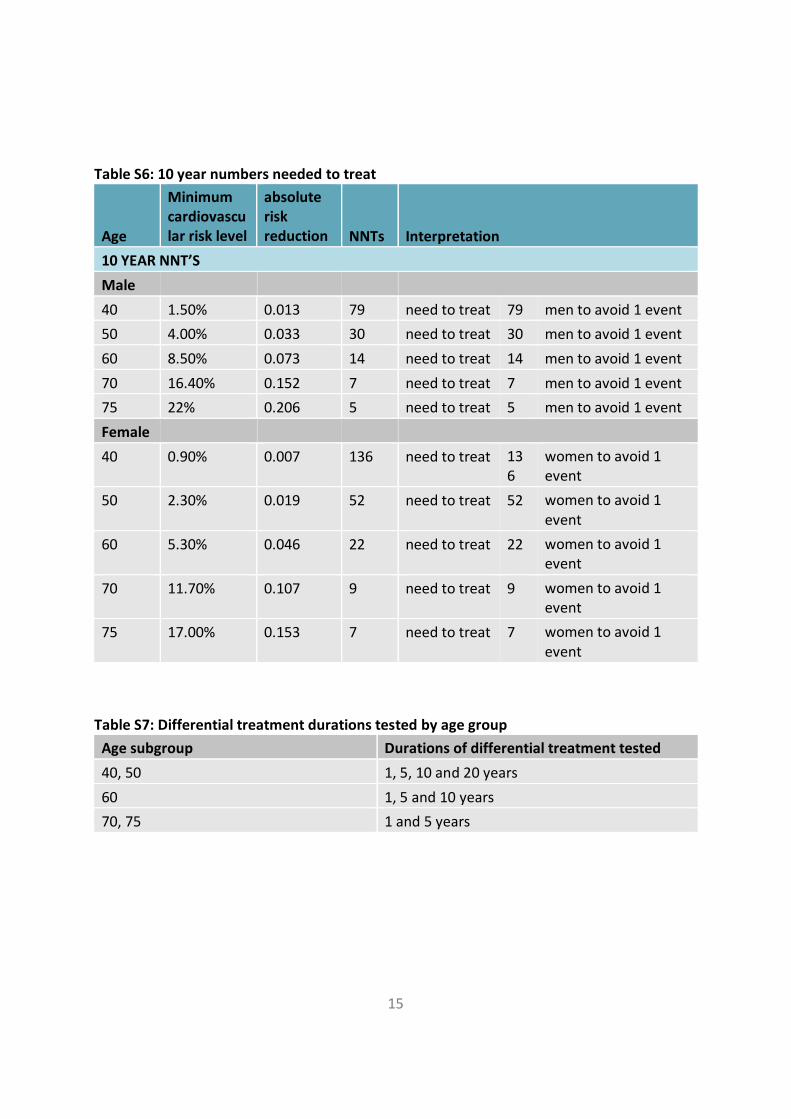
Table S6: 10 year numbers needed to treat
Age
Minimum cardiovascular risk level
absolute risk reduction NNTs Interpretation
10 YEAR NNT’S
Male
40 1.50% 0.013 79 need to treat 79 men to avoid 1 event
50 4.00% 0.033 30 need to treat 30 men to avoid 1 event
60 8.50% 0.073 14 need to treat 14 men to avoid 1 event
70 16.40% 0.152 7 need to treat 7 men to avoid 1 event
75 22% 0.206 5 need to treat 5 men to avoid 1 event
Female
40 0.90% 0.007 136 need to treat 136
women to avoid 1 event
50 2.30% 0.019 52 need to treat 52 women to avoid 1 event
60 5.30% 0.046 22 need to treat 22 women to avoid 1 event
70 11.70% 0.107 9 need to treat 9 women to avoid 1 event
75 17.00% 0.153 7 need to treat 7 women to avoid 1 event
Table S7: Differential treatment durations tested by age group
Age subgroup Durations of differential treatment tested
40, 50 1, 5, 10 and 20 years
60 1, 5 and 10 years
70, 75 1 and 5 years
16
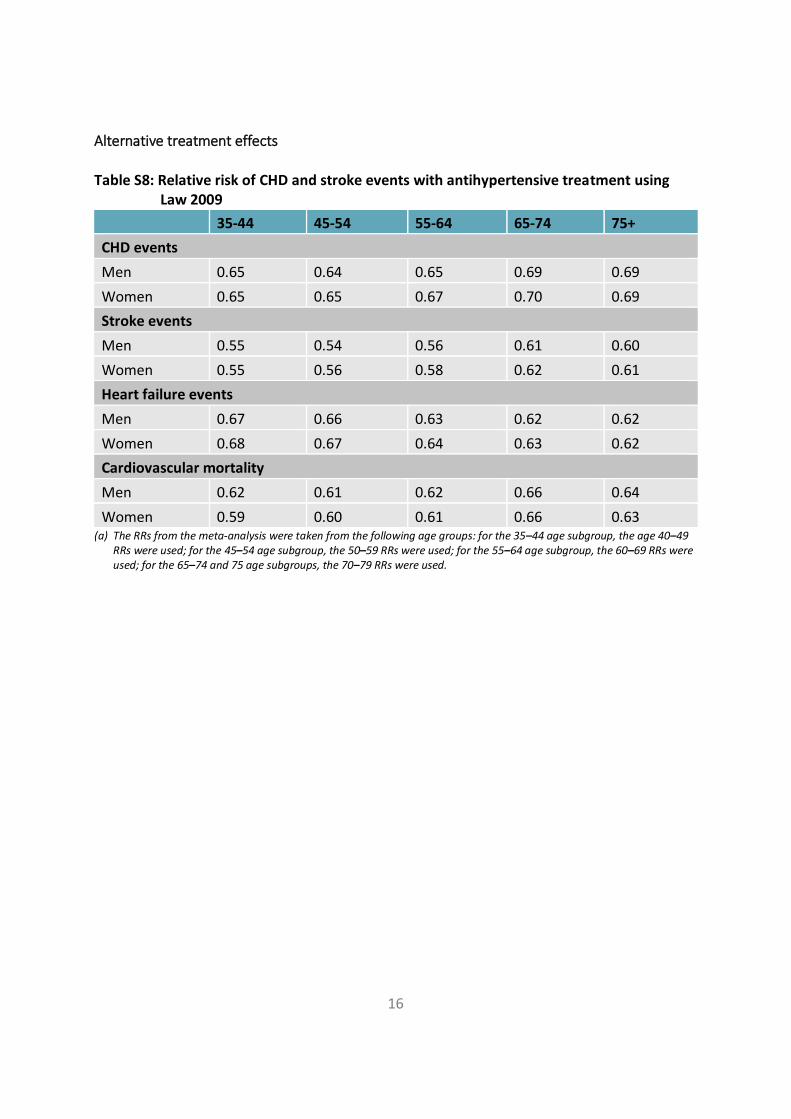
Alternative treatment effects
Table S8: Relative risk of CHD and stroke events with antihypertensive treatment using Law 2009
35-44 45-54 55-64 65-74 75+
CHD events
Men 0.65 0.64 0.65 0.69 0.69
Women 0.65 0.65 0.67 0.70 0.69
Stroke events
Men 0.55 0.54 0.56 0.61 0.60
Women 0.55 0.56 0.58 0.62 0.61
Heart failure events
Men 0.67 0.66 0.63 0.62 0.62
Women 0.68 0.67 0.64 0.63 0.62
Cardiovascular mortality
Men 0.62 0.61 0.62 0.66 0.64
Women 0.59 0.60 0.61 0.66 0.63 (a) The RRs from the meta-analysis were taken from the following age groups: for the 35–44 age subgroup, the age 40–49
RRs were used; for the 45–54 age subgroup, the 50–59 RRs were used; for the 55–64 age subgroup, the 60–69 RRs were used; for the 65–74 and 75 age subgroups, the 70–79 RRs were used.

17
Table S9: Estimated and proportional SBP reduction based on number of drugs (Law 2009)
Pre-treatment systolic BP
No. of drugs
Estimated reduction in systolic BP (a)
Proportional systolic BP reduction in reference to 1 drug (b)
150 1 8.7
150 2 16.5 1.90
150 3 23.6 2.71 (a) Taken from table 3, Law 2009. (b) Calculated.
18
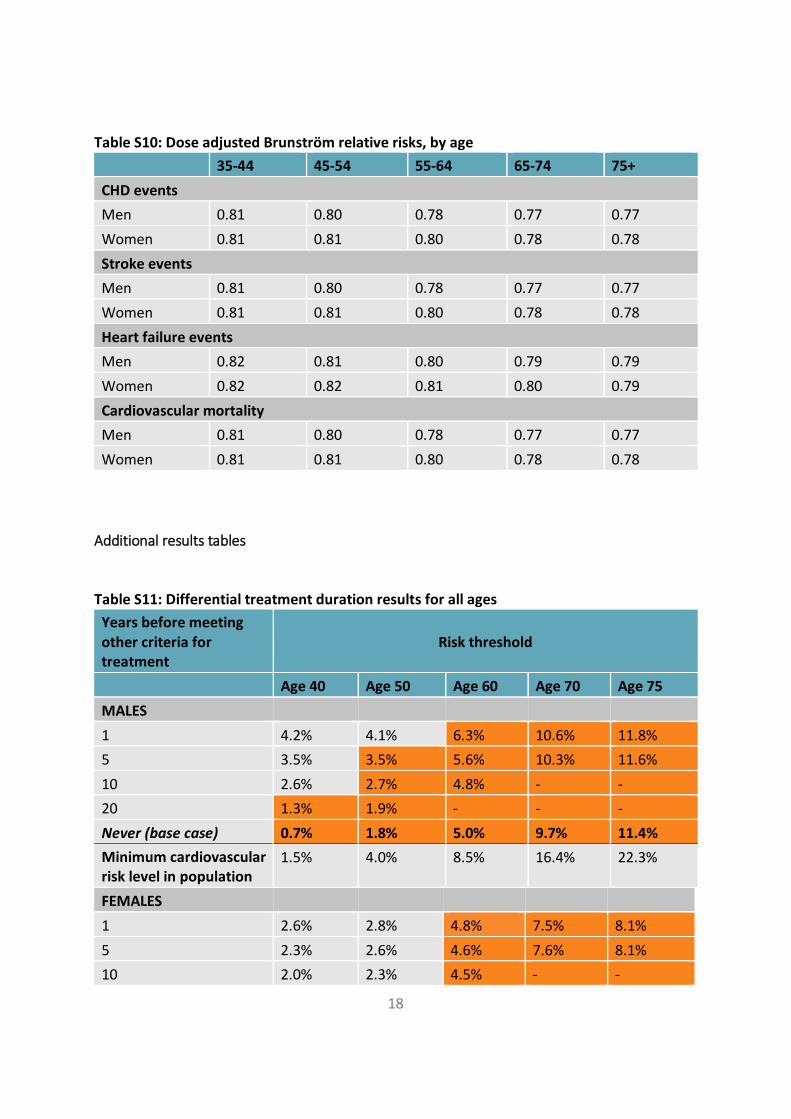
Table S10: Dose adjusted Brunström relative risks, by age
35-44 45-54 55-64 65-74 75+
CHD events
Men 0.81 0.80 0.78 0.77 0.77
Women 0.81 0.81 0.80 0.78 0.78
Stroke events
Men 0.81 0.80 0.78 0.77 0.77
Women 0.81 0.81 0.80 0.78 0.78
Heart failure events
Men 0.82 0.81 0.80 0.79 0.79
Women 0.82 0.82 0.81 0.80 0.79
Cardiovascular mortality
Men 0.81 0.80 0.78 0.77 0.77
Women 0.81 0.81 0.80 0.78 0.78
Additional results tables
Table S11: Differential treatment duration results for all ages
Years before meeting other criteria for treatment
Risk threshold
Age 40 Age 50 Age 60 Age 70 Age 75
MALES
1 4.2% 4.1% 6.3% 10.6% 11.8%
5 3.5% 3.5% 5.6% 10.3% 11.6%
10 2.6% 2.7% 4.8% - -
20 1.3% 1.9% - - -
Never (base case) 0.7% 1.8% 5.0% 9.7% 11.4%
Minimum cardiovascular risk level in population
1.5% 4.0% 8.5% 16.4% 22.3%
FEMALES
1 2.6% 2.8% 4.8% 7.5% 8.1%
5 2.3% 2.6% 4.6% 7.6% 8.1%
10 2.0% 2.3% 4.5% - -

19
Years before meeting other criteria for treatment
Risk threshold
Age 40 Age 50 Age 60 Age 70 Age 75
MALES
20 1.6% 2.6% - - -
Never (base case) 1.7% 2.8% 4.9% 7.5% 8.5%
Minimum cardiovascular risk level in population
0.9% 2.3% 5.3% 11.7% 17.0%
The columns show the risk thresholds for the different age groups. The rows show the differential treatment durations tested and the results of the base-case analysis for each age group (that is, where a lifetime of treatment was compared to a lifetime of no treatment – except if people had a CVD event). Additionally, the minimum cardiovascular risk values in the population for each age and gender are also presented. Cells that are orange indicate that the risk thresholds for that age are below the minimum cardiovascular risk values for that age in the population. If this is the case, then this means that it is cost effective to treat all of that age and gender.
SA1: Using relative risks from Law 2009 (probabilistic)
Table S12: Using relative risks from Law 2009
Analysis
Risk Incremental cost
Increment
al QALY
s
ICER
Probability Tx CE at 20k
Incremental cost
Incrementa
l QALYs
ICER
Probability Tx CE at 20k
Male Female
Age 60 (base case age)
5% £458 0.247 £1,859 100% £387 0.213 £1,821 100%
10% -£27 0.374 Dominant 100% -£321 0.350 Dominant 100%
15% -£452 0.483 Dominant 100% -£930 0.464 Dominant 100%
20% -£821 0.574 Dominant 100% -£1,449 0.558 Dominant 100%
Age 40
5% -£128 0.404 Dominant 100% -£265 0.319 Dominant 100%
10% -£728 0.548 Dominant 100% -£1,275 0.490 Dominant 100%
15% -£1,225 0.660 Dominant 100% -£2,102 0.622 Dominant 100%
20% -£1,635 0.745 Dominant 100% -£2,774 0.723 Dominant 100%
Age 50
5% £142 0.340 £418 100% £67 0.271 £249 100%
10% -£391 0.480 Dominant 100% -£777 0.425 Dominant 100%
15% -£836 0.595 Dominant 100% -£1,480 0.549 Dominant 100%
20% -£1,212 0.686 Dominant 100% -£2,069 0.645 Dominant 100%
Age 70
5% £564 0.142 £3,981 100% £479 0.144 £3,333 100%
10% £186 0.237 £787 100% -£67 0.252 Dominant 100%

20
15% -£153 0.322 Dominant 100% -£554 0.348 Dominant 100%
20% -£458 0.397 Dominant 100% -£984 0.431 Dominant 100%
Age 75
5% £589 0.096 £6,163 100% £518 0.105 £4,914 100%
10% £268 0.175 £1,534 100% £59 0.195 £303 100%
15% -£28 0.247 Dominant 100% -£360 0.275 Dominant 100%
20% -£301 0.312 Dominant 100% -£739 0.348 Dominant 100% Cells shaded green mean treatment is a dominant intervention (both more effective and less expensive). Abbreviations: CE = cost effective, 20k = £20,000, ICER = incremental cost effectiveness ratio, QALYS = quality adjusted life-years, Tx = treatment.
SA2: Adjusted base case data (Brunström) to take into account more medication (probabilistic)
Table S13 : Using adjusted Brunström relative risks taking into account more medication
Analysis
Risk
Incremental cost
Incremental QALYs
ICER
Probability Tx CE at 20k
Incremental cost
Incremental QALYs
ICER
Probability Tx CE at 20k
Male Female
Age 60 (base case age)
5% £891 0.129 £6,891 95% £881 0.110 £7,998 92%
10% £592 0.203 £2,919 99% £485 0.184 £2,633 98%
15% £345 0.262 £1,317 99% £142 0.243 £584 99%
20% £132 0.309 £426 99% -
£144 0.293 Domina
nt 100%
Age 40
5% £640 0.197 £3,255 98% £628 0.152 £4,132 96%
10% £332 0.266 £1,248 99% £136 0.231 £589 99%
15% £67 0.319 £209 99% -
£261 £0 Domina
nt 99%
20% -£140 0.356 Domina
nt 100% -
£562 0.331 Domina
nt 100%
Age 50
5% £751 0.172 £4,361 97% £751 0.133 £5,631 95%
10% £453 0.245 £1,845 99% £310 0.209 £1,478 99%
15% £195 0.302 £646 99% -£61 £0 Domina
nt 100%
20% £13 0.347 £38 100% -
£346 0.314 Domina
nt 99%
Age 70
5% £801 0.079 £10,106 91% £791 0.079 £10,066 89%
10% £570 0.136 £4,183 99% £452 0.143 £3,156 98%
15% £351 0.188 £1,873 99% £171 0.195 £879 99%
21
20%
£161 0.232 £694 100% -£96 0.242 Dominant
99%
Age 75
5% £748 0.055 £13,696 83% £747 0.058 £12,885 82%
10% £551 0.102 £5,417 98% £477 0.109 £4,385 97%
15% £362 0.145 £2,504 100% £224 0.155 £1,445 99%
20% £194 0.182 £1,066 100% -£5 0.195 Domina
nt 99%
Cells shaded green mean treatment is a dominant intervention (both more effective and less expensive). Abbreviations: CE = cost effective, 20k = £20,000, ICER = incremental cost effectiveness ratio, QALYS = quality adjusted life-years, Tx = treatment.
Table S14: Sensitivity analysis results (deterministic)
Analysis Risk Incremental cost
Incremental QALYs
ICER Incremental cost
Incremental QALYs
ICER
Male Female
Base case
5% £1,125 0.06 £20,063 £1,116 0.06 £19,757
10% £932 0.10 £9,807 £846 0.10 £8,572
15% £762 0.13 £5,959 £615 0.13 £4,618
20% £613 0.16 £3,948 £418 0.16 £2,601
SA4: Lower CI of Base case treatment effect
5% £833 0.16 £5,199 £764 0.15 £5,211
10% £512 0.25 £2,059 £284 0.24 £1,168
15% £234 0.32 £724 -£122 0.32 Dominant
20% -£4 0.39 Dominant -£462 0.39 Dominant
SA5: Upper CI of Base case treatment effect
5% £1,421 -0.06 Dominate
d £1,479 -0.05 Dominate
d
10% £1,351 -0.08 Dominate
d £1,415 -0.06 Dominate
d
15% £1,278 -0.09 Dominate
d £1,347 -0.08 Dominate
d
20% £1,205 -0.10 Dominate
d £1,275 -0.09 Dominate
d
SA6: Annual CV risk increase for women the same as men
5% £1,125 0.06 £20,063 £1,006 0.07 £14,350
10% £932 0.10 £9,807 £774 0.11 £7,327
15% £762 0.13 £5,959 £573 0.13 £4,243
20% £613 0.16 £3,948 £398 0.16 £2,511
SA7: Annual CV risk increase for women
5% £1,125 0.06 £20,063 £1,055 0.06 £16,409
10% £932 0.10 £9,807 £806 0.10 £7,834
15% £762 0.13 £5,959 £591 0.13 £4,393
22
halfway between women and men
20%
£613 0.16 £3,948 £406 0.16 £2,540
SA8: Lower drug costs by 50%
5% £983 0.06 £17,532 £972 0.06 £17,208
10% £799 0.10 £8,408 £712 0.10 £7,214
15% £638 0.13 £4,986 £490 0.13 £3,681
20% £496 0.16 £3,198 £302 0.16 £1,878
SA9: Increase drug costs by 50%
5% £1,267 0.06 £22,593 £1,260 0.06 £22,307
10% £1,065 0.10 £11,206 £980 0.10 £9,931
15% £886 0.13 £6,932 £740 0.13 £5,556
20% £729 0.16 £4,698 £534 0.16 £3,323
SA10: Half health state costs
5% £1,214 0.06 £21,646 £1,246 0.06 £22,073
10% £1,076 0.10 £11,322 £1,065 0.10 £10,787
15% £952 0.13 £7,444 £905 0.13 £6,796
20% £840 0.16 £5,414 £764 0.16 £4,759
SA11: Double health state costs
5% £947 0.06 £16,896 £854 0.06 £15,127
10% £644 0.10 £6,777 £409 0.10 £4,144
15% £382 0.13 £2,989 £35 0.13 £263
20% £158 0.16 £1,016 -£276 0.16 Dominant
SA12: Nurse doing appointment instead of GP
5% £759 0.06 £13,532 £727 0.06 £12,877
10% £588 0.10 £6,185 £483 0.10 £4,891
15% £439 0.13 £3,431 £275 0.13 £2,068
20% £309 0.16 £1,994 £101 0.16 £627
SA13: No. of consultations for first yr on treatment being doubled
5% £1,213 0.06 £21,630 £1,202 0.06 £21,282
10% £1,013 0.10 £10,661 £925 0.10 £9,371
15% £837 0.13 £6,545 £687 0.13 £5,160
20% £682 0.16 £4,395 £484 0.16 £3,013
SA14: Having no adverse events
5% £704 0.06 £11,557 £659 0.06 £10,681
10% £539 0.10 £5,416 £422 0.10 £4,079
15% £396 0.13 £2,996 £222 0.14 £1,613
20% £272 0.16 £1,707 £54 0.16 £327
SA15: Longer length of stay for falls
5% £1,623 0.06 £28,953 £1,650 0.06 £29,217
10% £1,399 0.10 £14,727 £1,345 0.10 £13,626
15% £1,200 0.13 £9,386 £1,080 0.13 £8,113
20% £1,023 0.16 £6,592 £851 0.16 £5,301
23
SA16: Apply over 75s AKI risk to falls also
5% £1,227 0.05 £22,328 £1,241 0.06 £22,508
10% £1,022 0.09 £10,861 £955 0.10 £9,795
15% £840 0.13 £6,613 £710 0.13 £5,370
20% £680 0.15 £4,404 £499 0.16 £3,125
SA17: Apply fall utility loss for 4 months
5% £1,125 0.05 £23,995 £1,116 0.05 £23,930
10% £932 0.09 £10,785 £846 0.09 £9,453
15% £762 0.12 £6,361 £615 0.12 £4,936
20% £613 0.15 £4,150 £418 0.15 £2,737
SA18: Utilities lower CI
5% £1,125 0.06 £18,718 £1,116 0.06 £18,215
10% £932 0.10 £9,136 £846 0.11 £7,891
15% £762 0.14 £5,543 £615 0.14 £4,243
20% £613 0.17 £3,667 £418 0.18 £2,384
SA19: Utilities upper CI
5% £1,125 0.05 £21,615 £1,116 0.05 £21,585
10% £932 0.09 £10,585 £846 0.09 £9,382
15% £762 0.12 £6,442 £615 0.12 £5,066
20% £613 0.14 £4,275 £418 0.15 £2,861
SA20: Double SMR for HF
5% £1,127 0.06 £19,607 £1,118 0.06 £19,278
10% £935 0.10 £9,612 £850 0.10 £8,404
15% £766 0.13 £5,858 £620 0.14 £4,549
20% £618 0.16 £3,895 £423 0.16 £2,579 Note that cells shaded red are above the NICE cost effectiveness threshold of £20,000 per QALY. Dominated means an intervention is both more expensive and less effective than the comparator. Cells shaded green mean treatment is a dominant intervention (both more effective and less expensive). The base-case results presented in the table below for reference are the deterministic results. Abbreviations: CE = cost effective, 20k = £20,000, ICER = incremental cost effectiveness ratio, QALYS = quality adjusted life-years.
24
Figures
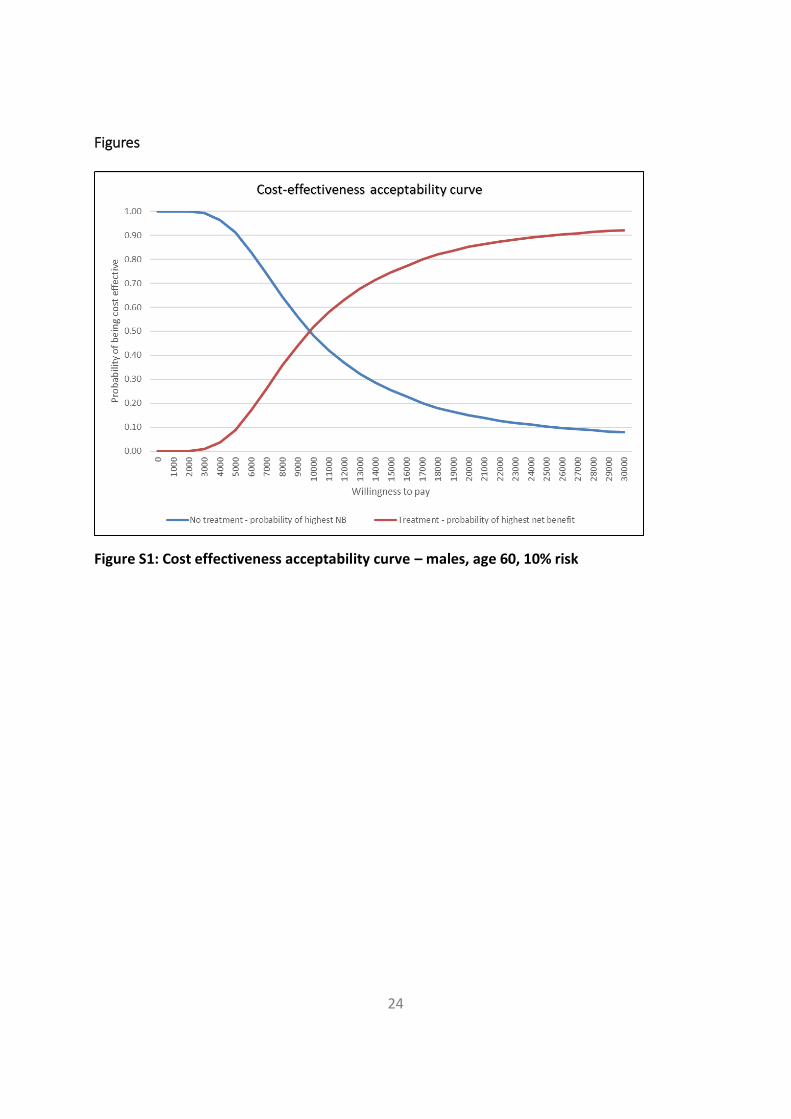
Figure S1: Cost effectiveness acceptability curve – males, age 60, 10% risk

25
Figure S2: Cost effectiveness acceptability curve – females, age 60, 10% risk
Figure S3: Scatterplot – males, age 60, 10% risk
26
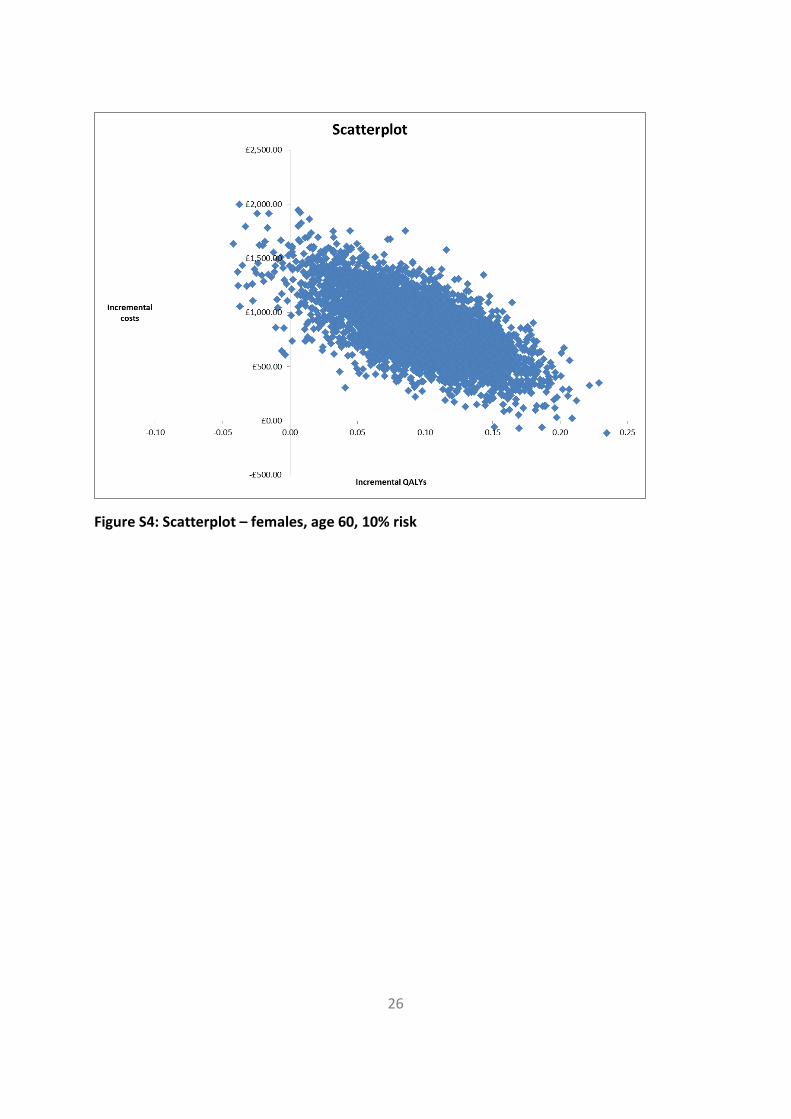
Figure S4: Scatterplot – females, age 60, 10% risk