Data Modeling and Interactive Visualization for … Modeling and Interactive Visualization for...
19
Data Modeling and Interactive Visualization for Advertisement Auction Modeling John F. Canny Biye Jiang Ryan Casey Jian Qiao Tian Liu Marc Capelo Electrical Engineering and Computer Sciences University of California at Berkeley Technical Report No. UCB/EECS-2016-61 http://www.eecs.berkeley.edu/Pubs/TechRpts/2016/EECS-2016-61.html May 12, 2016
Transcript of Data Modeling and Interactive Visualization for … Modeling and Interactive Visualization for...

Data Modeling and Interactive Visualization for
Advertisement Auction Modeling
John F. CannyBiye JiangRyan CaseyJian QiaoTian LiuMarc Capelo
Electrical Engineering and Computer SciencesUniversity of California at Berkeley
Technical Report No. UCB/EECS-2016-61
http://www.eecs.berkeley.edu/Pubs/TechRpts/2016/EECS-2016-61.html
May 12, 2016

Copyright © 2016, by the author(s).All rights reserved.
Permission to make digital or hard copies of all or part of this work forpersonal or classroom use is granted without fee provided that copies arenot made or distributed for profit or commercial advantage and that copiesbear this notice and the full citation on the first page. To copy otherwise, torepublish, to post on servers or to redistribute to lists, requires prior specificpermission.

Data Modeling and Interactive Visualization for Advertisement
Auction Modeling
by Ryan Casey
April 2016
Capstone Final Report
Submitted to the Department of Electrical Engineering and Computer Sciences,
University of California at Berkeley, in partial satisfaction of the requirements for
the degree of Master of Engineering.
Approval for the Report:
Committee:
Professor John Canny
Capstone Advisor
(Date)
* * * * * * *
Professor Joseph Gonzalez
Second Reader
(Date)
Abstract
This capstone project seeks to explore the usefulness of interactive vi-sualizations for machine learning. Specifically, we look at online searchadvertisements, which represent one of the biggest use cases of the recentBig Data boom. We develop a tool aimed to help Ad Operations teamsat search engine companies tune parameters for their auction process inan e↵ort to balance tradeo↵s between profit, advertiser satisfaction, anduser satisfaction. Often times, business decision makers treat machinelearning algorithms as a black box, as it is di�cult to see what is goingon underneath the hood. This project seeks to better inform the userof what is happening by shortening the feedback loop, thus allowing AdOperations teams to quickly tune models and deploy changes. We ac-complish this using a GPU-accelerated machine learning library calledBIDMach for click rate prediction, and visualizations developed with ahigh performance JavaScript library called D3.js. This paper discussesthe challenges in using Sparse Factor Analysis for click rate prediction,and how we turned to a Latent Dirichlet Allocation model to achievebetter results. We also discuss the system architecture and technologicalchoices for the visualization, and the challenges we faced in connecting itwith the backend auction simulation.
1
Data Modeling and Interactive Visualization for
Advertisement Auction Modeling
Ryan Casey
Capstone Teammates
Marc CapeloTian Liu
Jian (Jack) Qiao
Capstone Advisors
Professor John CannyBiye Jiang
Contents
1 Chapter 1: Technical Contributions (Individually Written) 2
1.1 Introduction . . . . . . . . . . . . . . . . . . . . . . . . . . . . . . . . . . . . . . 2
1.2 Data Modeling . . . . . . . . . . . . . . . . . . . . . . . . . . . . . . . . . . . . 2
1.2.1 Sparse Factor Analysis . . . . . . . . . . . . . . . . . . . . . . . . . . . . 3
1.2.2 Challenges with SFA . . . . . . . . . . . . . . . . . . . . . . . . . . . . . 4
1.2.3 Latent Direchlet Allocation . . . . . . . . . . . . . . . . . . . . . . . . . . 5
1.3 Real Time Visualization . . . . . . . . . . . . . . . . . . . . . . . . . . . . . . . . 6
1.3.1 Choice of Visualization Technology . . . . . . . . . . . . . . . . . . . . . 6
1.3.2 Initial Prototype . . . . . . . . . . . . . . . . . . . . . . . . . . . . . . . 7
1.3.3 Web Server for Simulation Integration . . . . . . . . . . . . . . . . . . . . 8
1.4 Conclusion . . . . . . . . . . . . . . . . . . . . . . . . . . . . . . . . . . . . . . 10
2 Chapter 2: Technical Contributions (Co-written with teammates) 12
2.1 Introduction . . . . . . . . . . . . . . . . . . . . . . . . . . . . . . . . . . . . . . 12
2.2 Industry Analysis . . . . . . . . . . . . . . . . . . . . . . . . . . . . . . . . . . . 12
2.3 Marketing and Stakeholders . . . . . . . . . . . . . . . . . . . . . . . . . . . . . 13
2.3.1 Direct Stakeholders - Search Engine Companies . . . . . . . . . . . . . . 13
2.3.2 Indirect Stakeholders - Advertisers and Users . . . . . . . . . . . . . . . . 13
2.4 Intellectual Property . . . . . . . . . . . . . . . . . . . . . . . . . . . . . . . . . . 14
1

1 Chapter 1: Technical Contributions (Individually Written)
1.1 Introduction
Our project seeks to combine machine learning and real-time, interactive visualizations to developa tool to help search engine companies optimize their search advertisement auction process. Searchengines like Yahoo generated $13.6 billion in revenue from search advertisements in 2015, and thisfigure is only expected to rise in the coming years (Turk 2015: 3-5). Thus, it is extremely importantthat Yahoo displays paid advertisements in the best possible order to maximize metrics such asrevenue and user satisfaction. The advertisement auction process is complex, and involves elaborateranking schemes that take place within milliseconds each time a user enters a search query. As thereare millions of these auctions taking place in real time every second, there is so much data that it isnearly impossible for Yahoo teams to make insights and improve performance of the algorithms.
The project involves two main components. First, the Simulation component is the backend datamodel that must be capable of predicting clickthrough rates for advertisements and running a com-plete simulation of an ad auction. Second, in the Visualization component we evaluate performancemetrics (such as revenue, advertiser satisfaction, and user satisfaction) and create an interactive vi-sual display of these metrics on the frontend. Combining these two components, we can providethe Yahoo Ad Operations team a visual dashboard on which they could turn knobs and tweak pa-rameters, and see in real time how different changes to the ranking model affect each performancemetric, allowing them to balance tradeoffs and select the best model.
The entire team initially worked together to complete the data wrangling and data modeling stagesin a consolidated effort to build the necessary data model of clickthrough rates as quickly as possible(see Figure 1 below for the work breakdown structure). We then split into two subteams and workedin parallel; Tian and Jack developed the backend simulation system while Marc and I worked to-gether to create the frontend visualization. This paper will focus on my two main contributions to theproject. First, we consider the data modeling component of the project, where we initially attemptedto use a technique called Sparse Factor Analysis to predict unknown clickthrough rates. Second, wediscuss our efforts to build the interactive visualization component of the project, which takes theform of a web application that can give a user real-time feedback as they modify parameters. Thisvisualization product was integrated with the simulation pipeline discussed in Jack’s paper to createa fully functional prototype.
1.2 Data Modeling
The result of an advertisement auction is a ranking of all of the advertisers that made bids, fromwhich the advertisements are displayed in slots at various locations on a display page. Typically, thehighest ranked ads are displayed at the top of the page, just above the results returned by the searchquery. These highly sought after positions have the highest visibility and are most likely to grab theuser’s attention and generate clicks. In order to run the advertisement auction simulation, we needto model user behavior by predicting the clickthrough rate, or the likelihood that a user will click on
2

Figure 1: Work Breakdown Structure. The linear structure of the work in the initial stages requiredthe team to work together to build the data model quickly. Once completed, we split into subteamsto work on the two main components, which were developed in parallel and eventually integrated.
a given ad if it is displayed in a given slot on the page. We were supplied with a dataset from Yahoowhich consisted of 8GB worth of anonymized auction records, where each record contained the rankof the advertisement, the number of impressions (or views) it generated, and the number of times itwas clicked. This data gave us the historical clickthrough rates, but only for the particular rank thateach advertisement achieved. The challenge was in taking this data and extrapolating to figure outthe clickthrough rates at all other possible ranks. This was necessary so that the simulation couldtake into account what would happen in other scenario where the ranking algorithm was changed.In the following sections, we discuss our initial efforts to use Sparse Factor Analysis to solve thischallenge, and how we eventually moved to a Latent Dirichlet Allocation model.
1.2.1 Sparse Factor Analysis
Sparse Factor Analysis (SFA) is a Matrix Factorization algorithm that seeks to decomposes a matrixinto latent factors; in other words, it identifies the most important hidden patterns in the data matrix(Lan 2014: 2-5). The idea is that we can use knowledge from the hidden patterns to make predictionson the missing data in the original matrix. In our case, we have a sparsely filled data matrix of clickrates for M unique (advertiser, keyword) pairs in each of N possible ranking positions, and ourgoal is to predict the missing, unknown click rates. We seek to use a rank-1 matrix factorization todecompose the sparse matrix (called C) into two hidden factors (called A and B). The first hiddenfactor A is a column vector representing the positional dependent click rates, or how the rankingaffects how often an ad is clicked. The second hidden factor B is a row vector that represents theclick rates for each unique (advertiser, keyword) pair - this can be thought of as the quality of thead, as it measures how likely an ad is to be clicked, independent of the position that it’s displayed aton the page (see Figure 2 below for a visual representation of this deconstruction). We use a rank-1SFA algorithm for both simplicity and the ability to obtain very interpretable results. Essentially,one hidden factor gives us the click rate if an ad is placed in the top slot, and the other factor scalesit by the ad’s true slot position.
3

Figure 2: Sparse Factor Analysis. CTR is shorthand for clickthrough rate, N represents the numberof possible ad rankings, M represents the number of unique (advertiser, keyword) pairs, and thedimensions of each matrix are indicated in brackets. Here, we show how the sparse matrix C can beapproximated as the product of the 2 hidden factors, A and B.
These two factors A and B are calculated using a technique called Alternating Least Squares (ALS),which alternates holding one factor constant, and updating the other factor to give the smallestsquared error (the sum of the squared difference between each known click rate and it’s predictedclick rate in the reconstructed matrix). We can use these two factors to approximate the entire clickrate matrix, giving us our predictions for each of the unknown click rates that are required for the adauction simulation.
The SFA algorithm has previously been successfully applied to a similarly sparse clickthrough ratedataset, as SFA gave nearly a 10% improvement over baseline algorithms (Canny 2002: 6-7). Onetool that provides an implementation of SFA is BIDMach, which is a GPU-accelerated MachineLearning library developed by our advisor, Professor John Canny, at UC Berkeley (Canny 2013).Given the massive size of our dataset, it is important that we utilize BIDMach’s implementation, aswe need a high performance library (in terms of speed) so we can produce interactive visualizationsin real time. If the machine learning on the backend is not fast enough, the visualizations on thefrontend cannot make the necessary impact in terms of providing a real-time, instant feedback loopfor the users.
1.2.2 Challenges with SFA
Unfortunately, we found that the SFA algorithm did not give us the results we expected. The negativelog likelihood is a measure of the accuracy of the matrix reconstruction, based on the squared errormentioned previously. When we ran the SFA algorithm on our sparse matrix, we initialized theweight of the hidden factors to 0. However, the weights fluctuated wildly with each minibatchthrough the first iteration, and the negative log likelihood exploded to NaN (or Not a Number).We attempted to tune the parameters, such as the learning rate and the amount of regularization,but even then the SFA algorithm still did not working correctly, as the likelihood stayed relativelyconstant and failed to improve over subsequent passes through the data. If it was working, we wouldhave expected the negative log likelihood to rise slowly with each iteration, as the model converges
4

towards the optimal solution via Alternating Least Squares. An additional problem was that someof the weights in the factors are negative. Intuitively this didn’t make sense, since we should neverhave negative click rates (even if an ad was never clicked, the click rate would be 0).
We do not believe the problem with the SFA algorithm was related to the sparseness of our click ratedata matrix. Initially, we believed that the algorithm might be performing poorly because the sparsematrix was not full rank - that is, if there were linearly dependent columns (for example, if an adwas never clicked, there would be a linearly dependent column of all zeros in the matrix). However,as addressed in Tian’s paper, we handled this problem by only considering advertiser/keyword pairswe see in the data (instead of all possible pairs of advertisers and keywords) and by adding a smalloffset term to the click values, guaranteeing that every column has at least one non-zero value. Evenafter addressing these concerns, the issues with SFA continued to persist. We think that there mayhave been other issues with the dataset that prevented the SFA algorithm from converging to thecorrect solution. Jack later discovered that our dataset had been heavily filtered, in that we only hada random subset of the results from each auction, rather than the entire output ranking. Regardless,we needed to quickly find an alternative method to predict the missing clickthrough rates.
Upon further reflection, we realized that perhaps we should have normalized the data, as this mighthave been able to solve the negative weights issue. We had assumed that since all of the click rateswere positive, this would naturally cause the factors to be positive. However, without normalization,the Gaussian noise model implied by ALS allows some of the weights to be negative. We couldhave tried subtracting the mean CTR from each ad, and scaling by the variance. Rather, we decidedto try an alternative algorithm instead.
1.2.3 Latent Direchlet Allocation
We turned to another Matrix Factorization algorithm called Latent Dirichlet Allocation (LDA). LDAis a generative probabilistic model that discovers latent, or hidden, patterns or topics from a collec-tion of items (Blei: 2003). In our case, we use it to find similarities between different advertisements,and use these hidden topics to predict the missing values. Following the same setup described abovefor SFA, we seek to decompose a sparse matrix of clickthrough rates. However, instead of usingAlternating Least Squares, we assume that there is a generative process that draws items accordingto a prior distribution of topics, and prior distributions within each topic.
Specifically, we used an online Variational Bayes LDA model (Hoffman: 2010). We used the samemodel discussed in the Hoffman paper, except there are two input matrices: the first representsthe clicks, which is the value we are trying to predict. The second is the number of views (alsocalled ”impressions”), which is the number of times the advertisement was actually viewed by theuser. The second matrix of views scales the LDA predicted click value appropriately. The output ofthis rank-1 LDA is the two previously discussed hidden factors (the rank dependent factor, and theadvertisement dependent factor) that together predict the entire click rate matrix . The fact that thealgorithm is ”online” means that we can complete the updates in batches, and thus we do not haveto load the entire dataset in memory at once, which would be slow and memory intensive.
5

This model did converge, and it gave us reasonable results, as the weights in both factors were allpositive, which matches our intuition that click rates should all be positive. However, one interestingnote was that rank-dependent factor of click rates did not drop off as quickly as we expected as therank decreased. This indicates the quality of the ad itself is actually far more significant than theprecise rank that it is displayed at. Now that we had a full click rate matrix for all advertisements inall ranking positions, Jack’s paper discusses how we used the click rate modeling in the simulationcomponent of the project.
1.3 Real Time Visualization
The key benefit of interactive visualization is that it provides a real-time closed feedback loop;decision makers can instantly see the effects of changing parameters in a machine learning model.Instead of running a simulation and having to wait days in order to evaluate changes (as is currentlythe case in the advertisement auction industry), a user can interactively test proposed new parametercombinations on a small stream of data before they are deployed to live auctions. Quick interactivesimulations can greatly reduce the risk of making changes to the advertisement auction process, asit makes it less likely to incur financial and/or reputational losses resulting from new settings thatmake auctions perform surprisingly poorly.
1.3.1 Choice of Visualization Technology
Interactive, real-time visualization for our project is made possible by the use of the aforementionedhigh-performance, GPU-accelerated library BIDMach. However, while BIDMach provides state-of-the-art performance in terms of machine learning algorithms, it does not provide a frontend interfacefor users to experiment with parameters. We searched for a complementary high performance visu-alization library, and the JavaSciprt library D3.js was the clear choice as it provides:
1. High performance, enabling smooth animation and user interaction, and demonstratingdramatic performance improvements over similar technologies such as Protovis and AdobeFlash (Bostock 2011:1).
2. The ability to dynamically update graph content to support real-time updates.
3. Cross-browser functionality.
We also decided to use another JavaScript toolkit called Rickshaw to produce the real-time, inter-active visualizations. Rickshaw is a library built on top of D3.js, and we chose it for a variety ofreasons:
1. It is free-to-use.
2. It was built specifically for for creating real time graphs and handling living data that con-tinuously updates in real time, which is exactly what we need in order to handle the outputstream of continuous advertisement auction simulations (Patra 2014:13).
6
3. Its limited overhead means that it provides performance on par with D3.js, allowing us tomaintain the interactivity that we desire (Patra 2014:13).
4. It conveniently provided abundant documentation, instructions, and ability to get startedand get an application running quickly.
Marc’s paper discusses how we use D3.js and Rickshaw to create a dashboard of graphics. He alsodiscusses how we integrate our frontend with PubNub, which is a real-time data stream network.We chose PubNub because:
1. It handles asynchronous message passing. This is important because we cannot know ex-actly the rate at which the backend simulation will output the metrics.
2. It enables storage and playback. It stores our metric data in the cloud, enabling the user tobrowse the entire history of the simulation, or zoom in to see a particular time range.
3. It is already integrated with Rickshaw. In fact, it is the default method to update a Rickshawgraph with new data. This means that it provided clear documentation and examples withwhich to get started, and we didn’t have to worry about implementing our own messagepassing and storage interface to update the graphs.
The alternative to using Rickshaw and PubNub was to use another charting library such as C3.js.We did actually go this route very late in the project, when we added multiple extra ”per advertiser”graphs - these would only display a single metric for a single advertiser over time. The downside tothis method was that we had to store large JavaScript arrays and update them as each batch of thesimulation completed, which was slow and memory inefficient. We also found that the animation anduser interface were not as good with C3.js, and the Rickshaw graphs were also more customizable.We decided to keep using Rickshaw and Pubnub for the main dashboard graph for the additionalflexibility and simplicity.
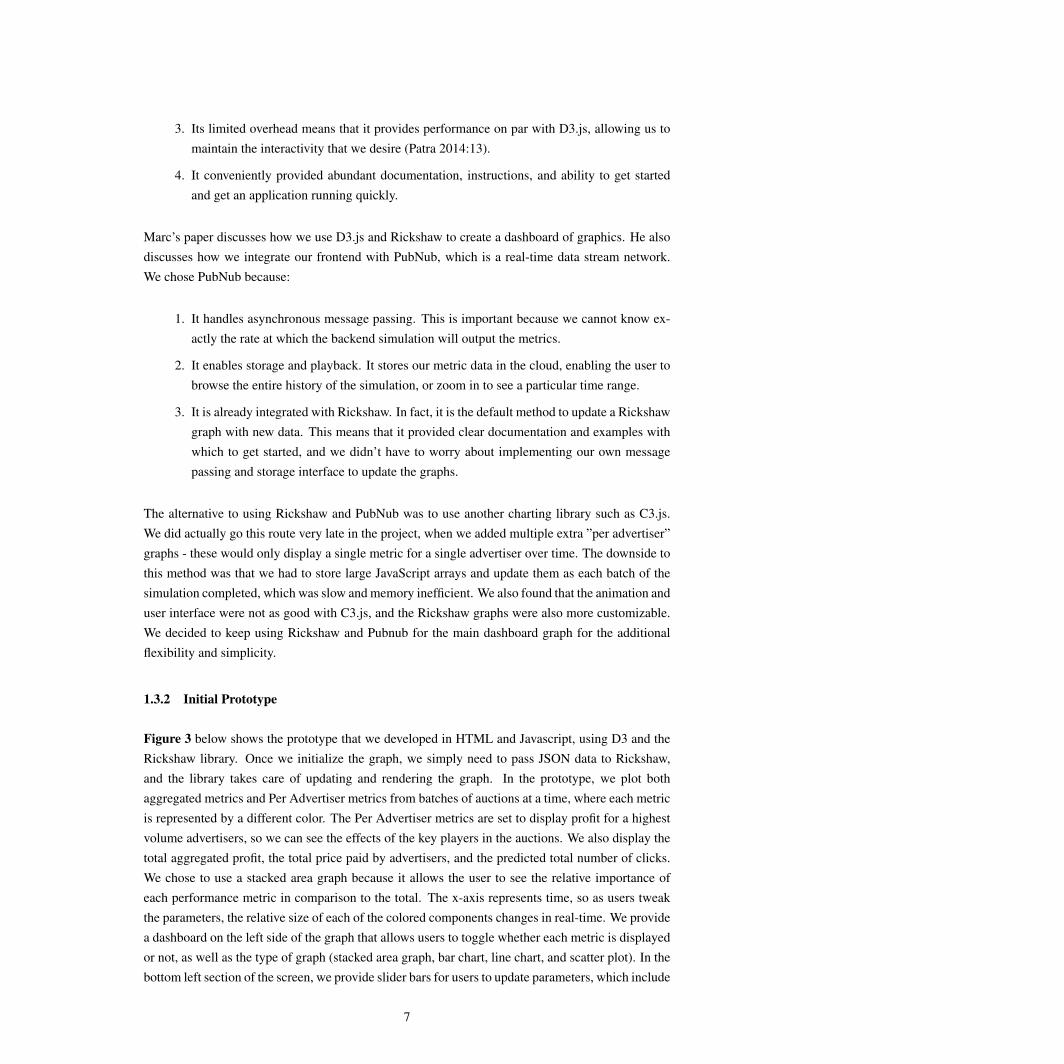
1.3.2 Initial Prototype
Figure 3 below shows the prototype that we developed in HTML and Javascript, using D3 and theRickshaw library. Once we initialize the graph, we simply need to pass JSON data to Rickshaw,and the library takes care of updating and rendering the graph. In the prototype, we plot bothaggregated metrics and Per Advertiser metrics from batches of auctions at a time, where each metricis represented by a different color. The Per Advertiser metrics are set to display profit for a highestvolume advertisers, so we can see the effects of the key players in the auctions. We also display thetotal aggregated profit, the total price paid by advertisers, and the predicted total number of clicks.We chose to use a stacked area graph because it allows the user to see the relative importance ofeach performance metric in comparison to the total. The x-axis represents time, so as users tweakthe parameters, the relative size of each of the colored components changes in real-time. We providea dashboard on the left side of the graph that allows users to toggle whether each metric is displayedor not, as well as the type of graph (stacked area graph, bar chart, line chart, and scatter plot). In thebottom left section of the screen, we provide slider bars for users to update parameters, which include
7

the variables for computing the advertisements’ quality score used for ranking. These parameterslet us modify the weigh the advertiser’s bid, the weight of the ad’s CTR, and the reserve price, all ofwhich are discussed in further detail in Jack’s paper.
Figure 3: Frontend Visualization Prototype. In this demo, we use a JavaScript toolkit called Rick-shaw to plot aggregated metrics, as well as Per Advertiser profits, on the same plot as different colorsin a stacked area graph, allowing us to see the relative importance of each component compared tothe total.
Very late in the project, we decided to add additional visualizations for Per Advertiser metrics,as Figure 4 below shows. We noticed that it was difficult to view Per Advertiser metrics whenthey were in stacked area graphs, as it would make it difficult to determine the influence of a singleadvertiser. Additionally, the line chart was also not as useful, as their would be too many overlappinglines and the graph would be too crowded. The idea here was the display a single metric (i.e. profit)for the top 5 advertisers, and display them as a stacked set of single line charts, each with their ownX axis, to resemble at EKG. This made it easier to see how parameter chances caused variationsin single advertisers, without all the clutter of other advertisers. It would be interesting to integratemore of these single graphs in the future, perhaps to study further metrics individually, or to bettersee correlations between pairs of metrics.
1.3.3 Web Server for Simulation Integration
The frontend Rickshaw/PubNub dashboard runs in the internet browser, and consists of a combina-tion of JavaScript and HTML code. Meanwhile, the backend simulation is written in Scala, which isthe native language of BIDMach. In order to integrate the Simulation and Visualization components,we use the Scala Play Web Framework. Scala Play is a lightweight web architecture that allows us tostream data from the simulation directly to the browser. We need to handle communication betweentwo concurrent processes - the JavaScript visualization running in the browser and the BIDMachsimulation running constantly in the background. We make use of Scala’s Actor System to handlemessage passing between concurrent processes, which means that we do not have to deal with threadmanagement ourselves. We also utilize a paradigm in Scala called an Iteratee, which acts as data
8

Figure 4: Per Advertiser Metrics Visualization. Here we show the Per Advertiser metrics. In thisexample, we plot the profit over time of each of the advertisers. The stacked line chart formatresembles an EKG, and lets us pick out variations in particular key advertisers.
sink. An Iteratee is a consumer of a data stream, so that whenever data is passed to the server, theIteratee can process it.
Figure 5 shows the complete architecture of the system, and how data flows across it. A Web Socketis initialized in the JavaScript code, which allows us to pass messages from the front end visualiza-tion to the Iteratee in the Web Server when a user changes a parameter via a slider from the browser.The Iteratee sends this event data to the Actor, which parses the data and updates the backend simu-lation. Meanwhile, the backend simulation is running the entire time in the background. It receivesthe new parameter values, updates the model by modifying the ranking algorithm, and continuesto run the simulation in batches. When a batch finishes and new data is available, the Web Serverreceives the data and the Actor propagates it along to the frontend visualization. In this way, wecomplete the feedback loop, and allow the model and simulation to be updated and the new data tobe displayed as soon as it is available.
The frontend was designed to be very general, in that it accepts data in a simple JSON formatconsisting of the series name and the data to be shown; for example, Ad1: 10, Ad2: 15, Ad3:7.5 might be the JSON representation of a single point in time on the graph if we were displayingprofits generated from 3 different advertisers. Because it is not customized to a specific metric,the visualization will work for any other metric we want to display in the future, and could in factbe applied to entirely new applications quite easily. Marc’s paper discusses other potential metricswe may be able to calculate and display, and how we are able to display multiple types of metricssimultaneously.
9
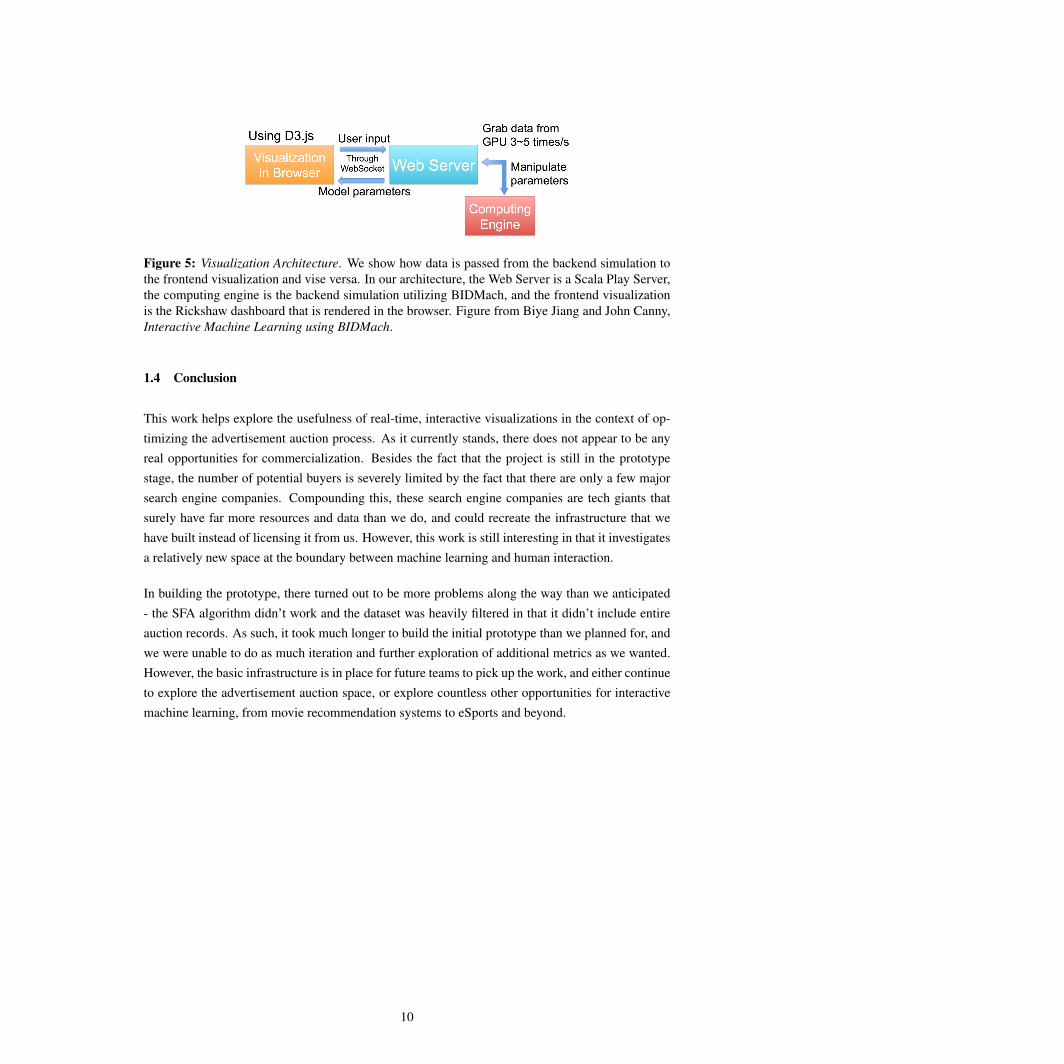
Figure 5: Visualization Architecture. We show how data is passed from the backend simulation tothe frontend visualization and vise versa. In our architecture, the Web Server is a Scala Play Server,the computing engine is the backend simulation utilizing BIDMach, and the frontend visualizationis the Rickshaw dashboard that is rendered in the browser. Figure from Biye Jiang and John Canny,Interactive Machine Learning using BIDMach.
1.4 Conclusion
This work helps explore the usefulness of real-time, interactive visualizations in the context of op-timizing the advertisement auction process. As it currently stands, there does not appear to be anyreal opportunities for commercialization. Besides the fact that the project is still in the prototypestage, the number of potential buyers is severely limited by the fact that there are only a few majorsearch engine companies. Compounding this, these search engine companies are tech giants thatsurely have far more resources and data than we do, and could recreate the infrastructure that wehave built instead of licensing it from us. However, this work is still interesting in that it investigatesa relatively new space at the boundary between machine learning and human interaction.
In building the prototype, there turned out to be more problems along the way than we anticipated- the SFA algorithm didn’t work and the dataset was heavily filtered in that it didn’t include entireauction records. As such, it took much longer to build the initial prototype than we planned for, andwe were unable to do as much iteration and further exploration of additional metrics as we wanted.However, the basic infrastructure is in place for future teams to pick up the work, and either continueto explore the advertisement auction space, or explore countless other opportunities for interactivemachine learning, from movie recommendation systems to eSports and beyond.
10

References
[1] Blei, David M. and Andrew Y. Ng and Michael I. Jordan. Latent Dirichlet Allocation.January 2003. Journal of Machine Learning Research. Vol 3. Pages 992-1022.https://www.cs.princeton.edu/ blei/papers/BleiNgJordan2003.pdf. Retrieved March 13, 2016. Web.
[2] Bostock, Michael and Vadim Ogievetsky and Jeffrey Heer. D3: Data-Driven Documents.http://vis.stanford.edu/files/2011-D3-InfoVis.pdf October 2011. Web.
[3] Canny, John. Collaborative Filtering with Privacy via Factor Analysis. ACM SIGIR. 11 Au-gust 2002. Tampere, Finland. Web. http://www.cs.berkeley.edu/ jfc/papers/02/SIGIR02.pdf. 25November 2015.
[4] Canny, John and Huasha Zhao. BIDMach: Large-scale Learning with Zero Memory Allocation.NIPS Biglearn Conference. 2013. Lake Tahoe, NV. Web.http://eecs.berkeley.edu/ hzhao/papers/BIDMach.pdf. 25 November 2015.
[5] Hoffman, Matthew D. and David M. Blei and Francis Bach. ”Online Learning for Latent Dirich-let Allocation.” 2010. Neural Information Processing Systems Conference. Web.https://www.cs.princeton.edu/ blei/papers/HoffmanBleiBach2010b.pdf
[6] Jiang, Biye and John Canny. Interactive Machine Learning using BIDMach. December 12 2015.Learning Sys Conference. December 2015. Web.http://learningsys.org/papers/LearningSys 2015 paper 20.pdf.
[7] Lan, Andrew S., Andrew E. Waters, Christoph Studer, and Richard G. Baraniuk. Sparse FactorAnalysis for Learning and Content Analytics. Journal of Machine Learning Research. Volume 15.June 2014. Web. http://www.jmlr.org/papers/volume15/lan14a/lan14a.pdf. Retrieved 25 November2015.
[8] Patra, Sambit Kumar. Data Visualization for Hybrid Application.International Journal of Emerging Science and Engineering. Vol 2, Issue 10.http://www.ijese.org/attachments/File/v2i10/J07970821014.pdf August 2014. Web.
[9] Turk, Sarah. IBISWorld Industry Report OD5889. Digital Advertising Agencies in the US.2015. Retrieved October 20, 2015 from IBISWorld database.
11

2 Chapter 2: Technical Contributions (Co-written with teammates)
2.1 Introduction
The digital advertising industry is booming - revenue from online advertisements was $13.6 billionin 2015, and will only continue to explode as internet traffic grows exponentially (Turk 2015:3-5). Thus, even a small improvement in the way that advertisements are displayed would have anenormous impact on bottom lines for both search engines and advertisers. Our project seeks todevelop an interactive, web-based graphical tool in order to optimize the bidding process for searchengine advertising. Visualizations will allow search engines to better analyze performance metricsin real time and help deliver the best possible ad experience for both advertisers and users. Thispaper will conduct an industry analysis of the digital search advertising industry, survey the currentlandscape for both direct and indirect stakeholders as part of a market analysis, and explore potentialintellectual property issues.
2.2 Industry Analysis
The search advertisement industry is relatively new, beginning in 1998 when GoTo.com (later re-branded as Overture) created the first search advertisement auction, in which advertisers placed bidsfor slots on the resulting search page (Jansen 2008:119). The Overture model was successful butinefficient, and was succeeded by the Google AdWords platform in 2002, which set the industrystandard with a more profitable pricing/allocation method (Jansen 2008:120). In the Google model,after the bids are placed, the ranking of advertisements is determined by many factors including thebid price and the estimated click-through rate (CTR) (Ye 2011:1). The search engine charges ad-vertisers using a pay-by-click model, in which advertisers only pay when users click the ads (Khan2015:15).
As the internet has become more prominent in people’s lives, the search advertisement industry hasgrown tremendously, which has generated a huge demand for the software technology that powersthe industry. According to an IBISWorld report, industry revenue is expected to grow 7.3% annually,and has a strong base for future growth as it survived the recent global recession unscathed (Khan2015:5). Advertisers who had previously spent conservatively during the recession have begun toscale upwards on their advertising budgets, which helps the overall growth of the industry (Khan2015:5). The increased advertiser demand has been encouraging technology upgrades - if a searchengine company falls behind on adopting new technologies, the quality of search traffic decreases, soadvertisers relocate their budgets to other competitors (Khan 2015:21). Thus, companies are alwayslooking for software that helps fine-tune their search advertisement operation strategy, which iswhere our project comes into play.
In a highly competitive environment for technological development, large companies with massiveresources have dominated the market. The biggest company is Google, which controls 75.2% ofthe market with its AdWords platform (Khan 2015:26). Other major players include Yahoo! Inc.and Microsoft, who formed a duo in 2010 by sharing core algorithms and revenues (Khan 2015:28).
12
Facing fierce competition, we focus on differentiating ourselves by developing tools that can be usedfor daily monitoring of auction processes by Ad Operations teams, instead of by advertisers.
2.3 Marketing and Stakeholders
Now that we have an overview of the industry, we can analyze the stakeholders and market oppor-tunities. The direct stakeholders of the project are search engine companies, and in particular theYahoo Ad Operations team, who will use the real-time, interactive visualizations to guide criticalbusiness decisions and tune parameters to build the optimal model for ad auctions. Although adver-tisers and the users of the search engine are obscured from the inner workings of the advertisementauction process, they are also indirectly affected by the choices made by search engine companies.
2.3.1 Direct Stakeholders - Search Engine Companies
Search engine companies face the daunting task of optimizing the advertisement auction process inorder to maximize revenue. Current machine learning solutions can deliver an answer to minimizea given cost function, but the issue is that many of these solutions resemble a black box, as there isno way to see how the different variables interact or how changing a parameter can affect differentparts of the model. Our tool helps expose the internals of the algorithm, providing knobs to turnthat enable the user to instantly compare performance tradeoffs, such as sacrificing profit to keepadvertiser and/or user satisfaction high.
2.3.2 Indirect Stakeholders - Advertisers and Users
An advertiser’s primary goal is to display its advertisement to the correct target audience. If adver-tisers are unable to consistently win auctions at reasonable prices, they will be unable to spend theiradvertising budget, and be forced to move on to other methods of advertising. A survey of 41,548advertisers demonstrated that 42% of them had no exposure on the first page of search results onYahoo Bing Network (Hamilton 2013). To mitigate this issue, we include advertiser satisfactionperformance metrics such as ads shown per advertiser, and average cost per ad. Additionally, weinclude user satisfaction metrics like click rate and conversion rate for Yahoo’s 800 million monthlyusers, who would like to be shown relevant ads that can enhance their online experience by direct-ing them towards new products they might not have otherwise discovered (Gallagher 2013). Ourvisualizations help search engine companies track user satisfaction via metrics such as clickthroughrates.
Hal Varian, Google’s Chief Economist, argues that market forces at play give search engine compa-nies an incentive to increase advertiser and user satisfaction (2014). If user satisfaction is high, theyare more likely to click the ad and go through with the purchase. This makes advertisers happier,as they make more profit per click, and can now afford to bid more per click, since their conversionrates are higher. Search engine companies are also happy, as higher bid prices and higher clickrates both equate to more revenue. Our tool helps search engine companies balance the advertiser
13

and user satisfaction metrics with other performance goals, and run simulations to weigh potentialconsequences of different choices.
2.4 Intellectual Property
As we move forward with the project, there are important intellectual property issues that we needto consider. The general purpose of the project is to build a tool that enables a user to have real-time visual feedback when the parameters of a machine learning model are tuned. This idea is veryclose to a patent filed by Microsoft Corporation in November 2014, titled Interactive Optimizationof the Behavior of a System, which would make it very difficult to patent the general idea of ourproject. (Kapoor 2014). However, the Microsoft patent is not very specific with regard to potentialapplications, so perhaps we could file a more detailed patent addressing the specific problem of adranking optimization.
Although we might have a chance in the future to patent our project’s idea, we currently do not seea clear opportunity to pursue a patent. First, our project is closely related to the thesis work of a UCBerkeley EECS PhD student, in that both projects leverage the computing power of a GPU througha dedicated library (BIDMach) to build an interactive visualization tool, and we have received directhelp from that student. Thus, it may not even be possible to patent this work, as it is too close toworks belonging to the university. Furthermore, in the short term we do not see a need to try to patentour work, as we are not oriented towards a full product, but rather a research question about the valueof interactive visualizations. However, if the project prototype turns out to be extremely valuableor we find an interesting use case eventually, we could possibly utilize the intellectual property tostart a company when the use case is sufficiently different from the PhD student’s work. Finally,open-sourcing is not as viable an option as it once was, since it makes it difficult to find VC fundingand generate privately held intellectual property.
Building a full product out of this project would require us to further study market opportunities, andmost likely change the use case. Ad Operations is a relatively small market in which there are onlya few main players, so it is not likely to have a large customer base to penetrate. We could applythe same tools and techniques to other problems, such as eSports and online betting markets wherethere might be more market opportunity, but this would still be at least 1 to 2 years on the horizon.
14

References
[1] Gallagher, Billy. Yahoo Monthly Active Users Are Up 20% to 800M, Including 350MOn Mobile, Says Marissa Mayer. TechCrunch. 11 September 2013. Web.http://techcrunch.com/2013/09/11/marissa-mayer-yahoo-monthly-active-users-are-up-20-to-800m-including-350m-on-mobile/. 20 October 2015.
[2] Hamilton, Gregg. Google AdWords vs Yahoo Bing Network - A PPC Performance Comparison.Search Engine Watch. 4 April 2013. Web. http://searchenginewatch.com/sew/study/2259377/google-adwords-vs-yahoo-bing-network-a-ppc-performance-comparison. 20 October 2015.
[3] Jansen, Bernard J.; Mullen, Tracy (2008). Sponsored search: an overview of the concept, history,and technology. Electronic Business. Vol 6, No. 2, pp. 114-131.
[4] Kapoor, Ashish; Lee, Bongshin; Tan, Desney S.; Horvitz, Eric J. (2014). Interactive Optimiza-tion of the Behavior of a System. Microsoft Corporation, assignee. Patent 8,898,090. 25 November2014. print.
[5] Khan, Sarah (2014). IBISWorld Industry Report 51913a. Search Engines in the US. RetrievedOctober 15, 2015.
[6] Marvin, Ginny. New PPC Report: Bing Ads vs Google AdWords in 6 US Verticals. Search
Engine Watch. 20 March 2013. Web. http://searchengineland.com/new-ppc-report-bing-ads-vs-adwords-in-6-us-verticals-15229. 20 October 2015.
[7] Turk, Sarah (2015). IBISWorld Industry Report OD5889. Digital Advertising Agencies in theUS. Retrieved October 20, 2015 from IBISWorld database.
[8] Varian, Hal. Insights on the AdWords Auction. Online video clip. Youtube. 18 June 2014. Web.https://www.youtube.com/watch?v=PjOHTFRaBWA. 18 October 2015.
[9] Ye, Chen, Berkhin, Pavell Anderson, Bo; Devanur, Nikhil R (2011). Real-Time Bidding Algo-rithms for Performance-Based Display Ad Allocation. Presented at 2011 ACM SIGKDD Conference
on Knowledge Discovery and Data Mining, San Diego, August 21-24.
15