VISJET & VISFLOOD: Software for Environmental Hydraulic Modeling and Visualization · ·...
6
7 TH ASIAN SYMPOSIUM ON VISUALIZATION, 2003 Paper number: conf24a155 conf24a155-1 VISJET & VISFLOOD: Software for Environmental Hydraulic Modeling and Visualization Joseph H.W. Lee, Valiant Cheung, C.P. Kuang, D.K.W. Choi, 1 and W.P. Wang, C.H. Tu, B. Chan, Y.K. Choi 2 1. Department of Civil Engineering, University of Hong Kong, [email protected] 2. Department of Computer Science, University of Hong Kong, [email protected] Corresponding author Joseph H.W. Lee Abstract We present two general interactive PC-based modeling and visualization software systems developed for the study of two types of environmental water flows: buoyant jet mixing and urban drainage problems. VISJET (http://www.aoe-water.hku.hk/visjet) is arguably the most robust software with advanced graphics for the prediction of mixing and transport of effluent discharges into a stratified crossflow. The prediction engine is a Lagrangian model for buoyant jets with three-dimensional trajectories, and is based on extensive basic experiments and turbulence model calculations. It can be used in outfall design and environmental impact assessment, and as an educational or training tool. VISFLOOD (http://www.aoe-water.hku.hk/visflood) is based on the numerical solution of the Saint-Venant equations, and caters for the simulation of unsteady flood propagation in urban drainage systems. Both software systems are fully interactive with data interrogation; the 3D visualization is fully integrated with the model engine, and enables the user to appreciate the context of the problem in a most effective way. Both models have been well-validated against laboratory and field data, and have been applied to many actual engineering projects. This software product is an outcome of a grant by the Hong Kong Innovation and Technology Fund (ITF). Keywords: Mixing and transport; buoyant jet; outfall design; environmental impact assessment; mixing zone; urban drainage; flood propagation; visualization; virtual reality. 1. Introduction Environmental sustainability is critical to the long term economic development of a society; it can only be achieved with the aid of reliable decision support tools. Quantitative environmental impact assessment can help make sound decisions in environmental management and planning. And yet worldwide there is currently no robust model for satisfactory risk assessment and effective communication of the predicted impact to the stakeholders. The aim of our research is to integrate proven mathematical models with state-of-the-art 3D graphics to develop software for effective impact assessment and its visualization. We present herein an overview of two virtual reality environmental hydraulic software systems, VISJET and VISFLOOD, for simulating effluent discharges and flood propagation in urban drainage
Transcript of VISJET & VISFLOOD: Software for Environmental Hydraulic Modeling and Visualization · ·...

7TH ASIAN SYMPOSIUM ON VISUALIZATION, 2003
Paper number: conf24a155 conf24a155-1
VISJET & VISFLOOD: Software for Environmental Hydraulic Modeling and Visualization
Joseph H.W. Lee, Valiant Cheung, C.P. Kuang, D.K.W. Choi,1
and W.P. Wang, C.H. Tu, B. Chan, Y.K. Choi 2
1. Department of Civil Engineering, University of Hong Kong, [email protected] 2. Department of Computer Science, University of Hong Kong, [email protected]
Corresponding author Joseph H.W. Lee
Abstract
We present two general interactive PC-based modeling and visualization software systems developed for the study of two types of environmental water flows: buoyant jet mixing and urban drainage problems. VISJET (http://www.aoe-water.hku.hk/visjet) is arguably the most robust software with advanced graphics for the prediction of mixing and transport of effluent discharges into a stratified crossflow. The prediction engine is a Lagrangian model for buoyant jets with three-dimensional trajectories, and is based on extensive basic experiments and turbulence model calculations. It can be used in outfall design and environmental impact assessment, and as an educational or training tool. VISFLOOD (http://www.aoe-water.hku.hk/visflood) is based on the numerical solution of the Saint-Venant equations, and caters for the simulation of unsteady flood propagation in urban drainage systems. Both software systems are fully interactive with data interrogation; the 3D visualization is fully integrated with the model engine, and enables the user to appreciate the context of the problem in a most effective way. Both models have been well-validated against laboratory and field data, and have been applied to many actual engineering projects. This software product is an outcome of a grant by the Hong Kong Innovation and Technology Fund (ITF). Keywords: Mixing and transport; buoyant jet; outfall design; environmental impact assessment; mixing zone; urban drainage; flood propagation; visualization; virtual reality. 1. Introduction Environmental sustainability is critical to the long term economic development of a society; it can only be achieved with the aid of reliable decision support tools. Quantitative environmental impact assessment can help make sound decisions in environmental management and planning. And yet worldwide there is currently no robust model for satisfactory risk assessment and effective communication of the predicted impact to the stakeholders. The aim of our research is to integrate proven mathematical models with state-of-the-art 3D graphics to develop software for effective impact assessment and its visualization.
We present herein an overview of two virtual reality environmental hydraulic software systems, VISJET and VISFLOOD, for simulating effluent discharges and flood propagation in urban drainage

VISJET & VISFLOOD: Software Environment for Hydraulic Modeling and Visualization
conf24a155-2
systems respectively. The model engine and system design features are described. The software is an off-spring from several large environmental assessment and urban drainage projects; it reflects the authors’ belief in using visualization technology to enhance understanding of the engineering problem. The software can be used for design, simulation, or educational training. 2. VISJET – software for environmental discharge prediction Natural and man-made discharges in the environment abound – wastewater effluents from cities and industry, thermal discharges from power stations, hydrothermal vents from the ocean floor, chimney smoke. They exist in the form of jets and plumes. The effluent discharge is mixed by the turbulent vortices in the environment, leading to a continuous and rapid reduction in pollutant concentration. VISJET is based on the Lagrangian model JETLAG [3,4], which simulates the turbulent mixing of Lagrangian plume elements in a stratified crossflow (second image of abstract) via a shear entrainment and vortex entrainment hypothesis. The model has also been validated by results of turbulence modeling and laser-induced fluorescence techniques, and has been applied to many engineering projects (e.g. Environmental impact assessment of the Hong Kong Strategic Sewage Disposal Scheme, Hong Kong Harbour Area Treatment Scheme (HATS, first image of abstract), Post-operation environmental monitoring of the Sydney Ocean Outfall). 2.1 VISJET system structure and features
Fig. 1. VISJET system structure
In VISJET, a friendly user interface is provided for inputting parameters about the jet characteristics, the ambient conditions, and the geometric specifications of the risers and diffusers on an outfall (for multiple jet groups). The input parameter values are checked against their valid ranges and visual feedbacks are also provided to help the user validate the input values. Jet trajectories are then computed by the JETLAG model which has been fully integrated in VISJET. Interactive 3D computer graphics is then used to display the spatial layouts of all jet trajectories to instantly give the user real-time visual feedback (Fig. 1). Jet trajectories visualization The evolution of jets and other time-varying properties, such as velocity, are displayed with special animation effects to enhance the understanding of the data displayed. Color-coding is applied to the jet according to effluent concentration, and dynamic texture mapping is used to portray the dynamic behavior
Outfalland Ambient
Parameters
ComputationResults
3D Navigation andVisualization
Module
JETLAG
2D Graphs and Cross-section
Display
Outfall Design
Ambient Current Profile
Animation Mode
Help System
Help
Help
Ambient Profile, Mixing zone
Jet Evolution Surface- and
Particle-based.
Outfall Parameters
Ambient info.
VISJET & VISFLOOD: Software Environment for Hydraulic Modeling and Visualization
conf24a155-3
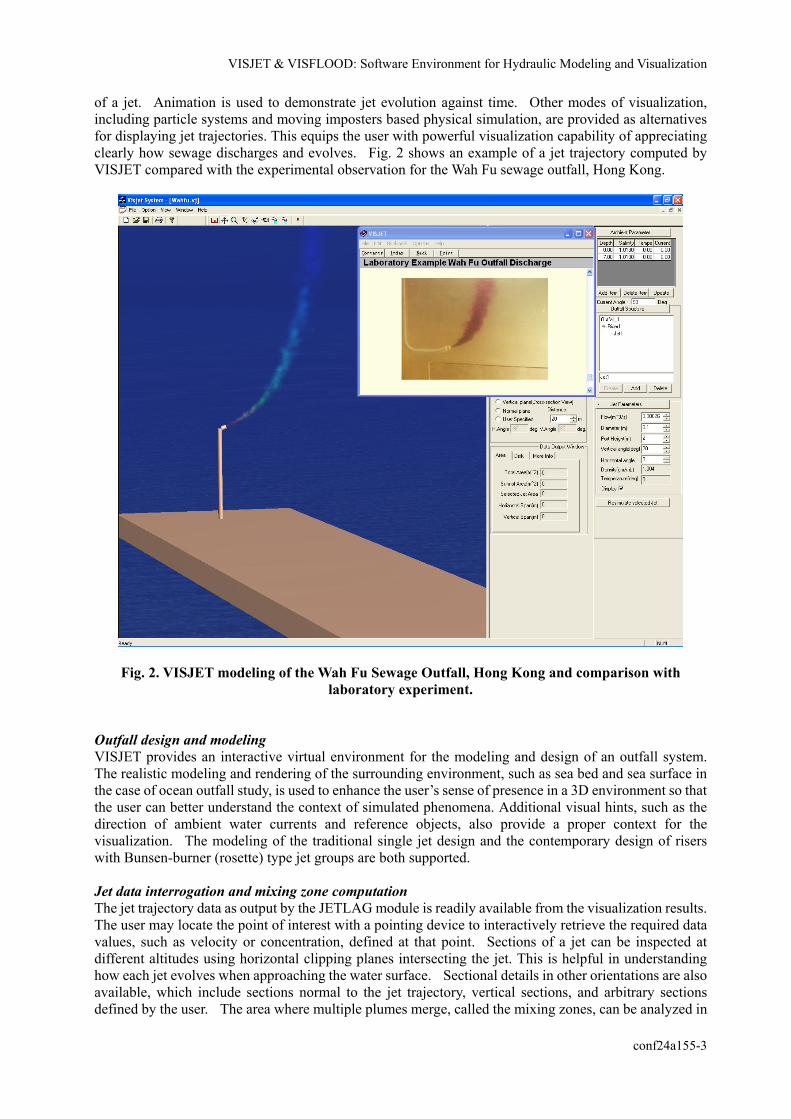
of a jet. Animation is used to demonstrate jet evolution against time. Other modes of visualization, including particle systems and moving imposters based physical simulation, are provided as alternatives for displaying jet trajectories. This equips the user with powerful visualization capability of appreciating clearly how sewage discharges and evolves. Fig. 2 shows an example of a jet trajectory computed by VISJET compared with the experimental observation for the Wah Fu sewage outfall, Hong Kong.
Fig. 2. VISJET modeling of the Wah Fu Sewage Outfall, Hong Kong and comparison with laboratory experiment.
Outfall design and modeling VISJET provides an interactive virtual environment for the modeling and design of an outfall system. The realistic modeling and rendering of the surrounding environment, such as sea bed and sea surface in the case of ocean outfall study, is used to enhance the user’s sense of presence in a 3D environment so that the user can better understand the context of simulated phenomena. Additional visual hints, such as the direction of ambient water currents and reference objects, also provide a proper context for the visualization. The modeling of the traditional single jet design and the contemporary design of risers with Bunsen-burner (rosette) type jet groups are both supported. Jet data interrogation and mixing zone computation The jet trajectory data as output by the JETLAG module is readily available from the visualization results. The user may locate the point of interest with a pointing device to interactively retrieve the required data values, such as velocity or concentration, defined at that point. Sections of a jet can be inspected at different altitudes using horizontal clipping planes intersecting the jet. This is helpful in understanding how each jet evolves when approaching the water surface. Sectional details in other orientations are also available, which include sections normal to the jet trajectory, vertical sections, and arbitrary sections defined by the user. The area where multiple plumes merge, called the mixing zones, can be analyzed in

VISJET & VISFLOOD: Software Environment for Hydraulic Modeling and Visualization
conf24a155-4
any section. In particular, the size of a mixing zone and the composite dilution of any point within the zone can be determined. Fig. 3 shows the VISJET output for a rosette-type jet group from an ocean outfall riser; the merging jets in a selected cutting plane can be seen. Fig. 4 shows the comparison of the path and cross-section jet width of a 2-jet group with the observed cross-section concentration field using the laser-induced fluorescence (LIF) technique. 3. VISFLOOD The visualization capability of common industry-standard urban drainage software is limited mainly to 2D colour animations of water depth on a horizontal plane and longitudinal sectional profiles; with no visualization of the flow or water movement. VISFLOOD was developed as an interactive tool to enable the user to appreciate the physical process and relate the drainage system to its physical surroundings, so that it can be used as a training or educational tool. The modeling engine is based on the Preissmann four-point implicit finite difference scheme and solves the one-dimensional Saint Venant equations for free surface flow [1,2]. It allows non-equidistant grids and computes discharge and elevation at the same grid point. The model simulates both subcritical and supercritical flows; surcharged flow is computed through the use of a “Preissmann slot”, which is a vertical extension of the closed channel section. The modeling engine currently treats a tree-like drainage network structure with single downstream outlet and multiple upstream inlets.
Fig. 3. VISJET main screen showing a rosette-type jet group from an ocean outfall riser

VISJET & VISFLOOD: Software Environment for Hydraulic Modeling and Visualization
conf24a155-5
Fig. 4. Modeling merging plumes by VISJET and comparison with observed cross-sectional scalar
field using the Laser-induced Fluorescence (LIF) technique 3.1 VISFLOOD System Structure and features The system design is functionally similar to that of VISJET. Unlike other similar software that have their visualization modules detached as separate modules, which must be invoked explicitly, VISFLOOD’s visualization system is completely integrated with the main navigation system. In other words, visualization is always running. The channel definition module is also tightly integrated with the central 3D Navigation and Visualization module. The purpose of such integration is to provide close-coupling between modeling and visualization.
VISFLOOD’s interface is designed from the ground up to be fully 3D to give users a better sense of dimension and a feeling of immersion. Operations such as channel design and visualization can be carried out at any vantage point. The user has full control to the view point motion at any time and there is a rich set of navigation modes to help move around. Channel design is interactive. A 3D model of the channel network is always displayed. Parameter changes are immediately reflected on the corresponding 3D model. The channel network can be manipulated freely to have a complicated shape instead of a traditional point and stick model. To enhance visual realism, water surface has been specially treated to produce a flowing effect. Overflow of water is also animated. Supporting objects such as trees and buildings can be added to match actual environment of a real scenario.
Fig. 5 shows the visualization of the Tai Hang Tung Storage Scheme that is being constructed to solve the most urgent urban flooding problem in Hong Kong. A 3D view of the system, the hydrographs at different locations and a longitudinal section view along the storm water channel can be generated according to the requirement of the user. This underground flood alleviation scheme is the first large scale underground storm water storage scheme in Hong Kong; it is environmentally acceptable and can be built safely with minimal public disruption. The evolution of the flash flood through the urban surroundings and overflow into the storage tank through a system of side weirs are shown. VISFLOOD gives a realistic and intuitive depiction of urban flood control under tight space constraints – which is unobtainable using standard software.
2 b)
Fig. 4b) Predicted and observed LIF images of the
cross-section concentration field at two downstream sections
D=3.1mm; Uj=0.76 m/s; Ua=0.1 m/s; Uj/Ua=7.7; Jet densimetric Froude no.=32
Top view
LIF VISJETMeasurement Prediction
Section view
Fig. 4a) Top view of the merging of two jets discharged into a crossflow at 60 and 120 degrees

VISJET & VISFLOOD: Software Environment for Hydraulic Modeling and Visualization
conf24a155-6
Fig. 5. Modeling the flood propagation in the Tai Hang Tung Storage Scheme by VISFLOOD Concluding Remarks VISJET and VISFLOOD are two user-friendly tools for environmental assessment and education – they are unique in the integration of robust model engines with visualization technology. The simple and powerful software enables users to learn the physics of the flow quickly, and to understand and solve new problems with it. More details and movies can be downloaded from the software website: http://www.aoe-water.hku.hk/visjet and http://www.aoe-water.hku.hk/visflood. References [1] Cunge, J.A. and Wegner, M., “Integration numerique des equations d'ecoulement de Barre de St-Venant par un
schema implicite de differences finies”, La Houille Blanche, No. 1, 33-39, 1964. [2] Havno, K. and Brorsen, M., “A general mathematical modelling system for flood forecasting and flood control”,
Proceeding international Conference on Hydraulics of Floods and Flood Control, Cambridge, UK; BHRA, Stevenage, 1986.
[3] Lee, J.H.W., and Cheung, V., “Generalized Lagrangian model for buoyant jets in a current”, J. of Environmental Engineering, ASCE, Vol. 116, No. 6, Dec. 1990, pp. 1085-1106.
[4] Lee, J.H.W. and Chu. V.H., “Turbulent jets and plumes − a Lagrangian approach”, Kluwer Academic Publishers, 2003.
List of multimedia data 1) VISJET − Merging of rosette-shaped multiple buoyant plumes (conf24a155_1.mpg, 3.9MB) 2) VISJET − Plume trapping in a stratified crossflow (conf24a155_2.mpg, 2.6MB) 3) VISFLOOD − Urban Flooding in Mongkok, Hong Kong (conf24a155_3.mpg, 6.7MB)