Data Logging and Analysis
6
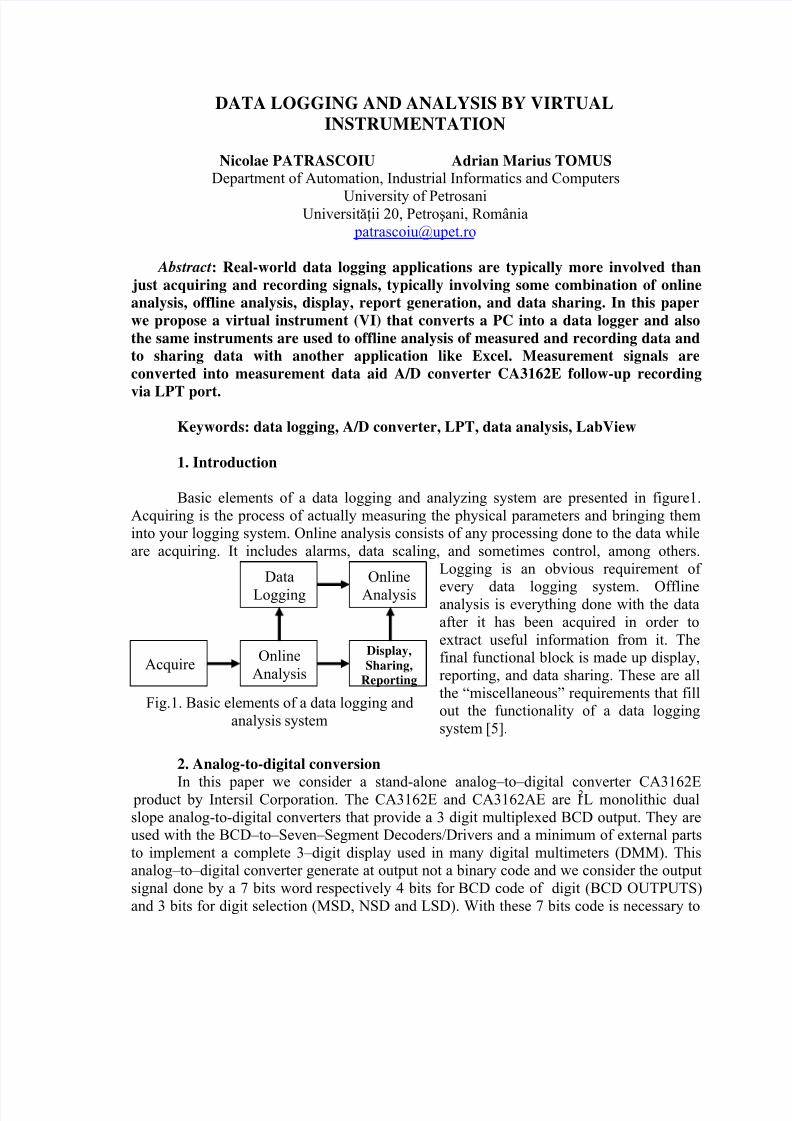
DATA LOGGING AND ANALYSIS BY VIRTUAL INSTRUMENTATION Nicolae PATRASCOIU Adrian Marius TOMUS Department of Automation, Industrial Informatics and Computers University of Petrosani Universităţii 20, Petroşani, România [email protected] Abstract: Real-world data logging applications are typically more involved than just acquiring and recording signals, typically involving some combination of online analysis, offline analysis, display, report generation, and data sharing. In this paper we propose a virtual instrument (VI) that converts a PC into a data logger and also the same instruments are used to offline analysis of measured and recording data and to sharing data with another application like Excel. Measurement signals are converted into measurement data aid A/D converter CA3162E follow-up recording via LPT port. Keywords: data logging, A/D converter, LPT, data analysis, LabView 1. Introduction Basic elements of a data logging and analyzing system are presented in figure1. Acquiring is the process of actually measuring the physical parameters and bringing them into your logging system. Online analysis consists of any processing done to the data while are acquiring. It includes alarms, data scaling, and sometimes control, among others. Logging is an obvious requirement of every data logging system. Offline analysis is everything done with the data after it has been acquired in order to extract useful information from it. The final functional block is made up display, reporting, and data sharing. These are all the “miscellaneous” requirements that fill out the functionality of a data logging system [5]. Online Analysis Data Logging Online Analysis Display, Sharing, Reporting Acquire Fig.1. Basic elements of a data logging and analysis system 2. Analog-to-digital conversion In this paper we consider a stand-alone analog–to–digital converter CA3162E product by Intersil Corporation. The CA3162E and CA3162AE are I 2 L monolithic dual slope analog-to-digital converters that provide a 3 digit multiplexed BCD output. They are used with the BCD–to–Seven–Segment Decoders/Drivers and a minimum of external parts to implement a complete 3–digit display used in many digital multimeters (DMM). This analog–to–digital converter generate at output not a binary code and we consider the output signal done by a 7 bits word respectively 4 bits for BCD code of digit (BCD OUTPUTS) and 3 bits for digit selection (MSD, NSD and LSD). With these 7 bits code is necessary to
-
Upload
patrascoiu7297 -
Category
Documents
-
view
223 -
download
0
Transcript of Data Logging and Analysis
8/3/2019 Data Logging and Analysis
http://slidepdf.com/reader/full/data-logging-and-analysis 1/6
DATA LOGGING AND ANALYSIS BY VIRTUAL
INSTRUMENTATION
Nicolae PATRASCOIU Adrian Marius TOMUS
Department of Automation, Industrial Informatics and Computers
University of PetrosaniUniversităţii 20, Petroşani, România
Abstract: Real-world data logging applications are typically more involved than
just acquiring and recording signals, typically involving some combination of online
analysis, offline analysis, display, report generation, and data sharing. In this paper
we propose a virtual instrument (VI) that converts a PC into a data logger and also
the same instruments are used to offline analysis of measured and recording data and
to sharing data with another application like Excel. Measurement signals are
converted into measurement data aid A/D converter CA3162E follow-up recording
via LPT port.
Keywords: data logging, A/D converter, LPT, data analysis, LabView
1. Introduction
Basic elements of a data logging and analyzing system are presented in figure1.
Acquiring is the process of actually measuring the physical parameters and bringing theminto your logging system. Online analysis consists of any processing done to the data while
are acquiring. It includes alarms, data scaling, and sometimes control, among others.
Logging is an obvious requirement of
every data logging system. Offlineanalysis is everything done with the data
after it has been acquired in order to
extract useful information from it. Thefinal functional block is made up display,
reporting, and data sharing. These are all
the “miscellaneous” requirements that fillout the functionality of a data logging
system [5].
Online
Analysis
Data
Logging
Online
Analysis
Display,
Sharing,
Reporting
Acquire
Fig.1. Basic elements of a data logging and
analysis system
2. Analog-to-digital conversion
In this paper we consider a stand-alone analog–to–digital converter CA3162E product by Intersil Corporation. The CA3162E and CA3162AE are I2L monolithic dual
slope analog-to-digital converters that provide a 3 digit multiplexed BCD output. They areused with the BCD–to–Seven–Segment Decoders/Drivers and a minimum of external parts
to implement a complete 3–digit display used in many digital multimeters (DMM). Thisanalog–to–digital converter generate at output not a binary code and we consider the output
signal done by a 7 bits word respectively 4 bits for BCD code of digit (BCD OUTPUTS)
and 3 bits for digit selection (MSD, NSD and LSD). With these 7 bits code is necessary to

8/3/2019 Data Logging and Analysis
http://slidepdf.com/reader/full/data-logging-and-analysis 2/6
display measured value and to store consecutive
values into properly file so that these codes areacquired through LPT port [1]. For this the ones
7 bits are connected to the data section (pins 2 to
9, D0 … D7) of the LPT port like diagram
presented in fig.2.
3. Virtual Instrument
Software is of critical importance in PC-
based data logging systems, because well-written logging software determines how data is
stored, how quickly data can be written to disk,
and how efficiently disk space is used and givesdifferent data management capabilities.
The software use, in this paper, to create
a PC-based data logger is LabVIEW and alsothe same LabVIEW programs, that are called
virtual instruments or VIs, are used for offline
analysis. Every VI uses functions that
manipulate input from the user interface or other sources and display that information andevery VI has two components front panel respectively diagram bloc.
3 x 100 kO
4 x 100 kO
NSD
MSD
LSD
23
22
21
20
3
5
16
15
1
7
4
V+IN
V-IN
10 kO
50 kO
2
13
10
11
4
8
9
1214
0,27 µF
INPUTSIGNAL
Hold
+ 5V
+ 5V
D0
D1
D2
D3
D4
D5
D6
CA3162
Fig. 2. LPT converter connection
The VI that perform both basics function that are data logging and data analysis has
two mains front panels ONLINE ACQUISITION respectively OFFLINE ANALYSISselected by means of the Tab Control.
3.1. Acquisition Virtual Instrument
The front panel corresponding to ONLINE ACQUISITION is presented in fig.3.
and this front panel is used to control acquisition process and also to display the important
parameters of the acquisition process like acquisition state or measured values and alsorecord date and time. There are three components that are waveform graph in stack plot and
two blocks Acquisition
Control that controlacquisition parameters
like parallel port address
number of acquisitions,number of points per
acquisition respectively
Acquisition Progress that
show in different formcurrent value acquired.
Waveform graph display
the filtered and nonfiltered form of the
acquired signal.Fig.3. ONLINE ACQUISITION Front Panel

8/3/2019 Data Logging and Analysis
http://slidepdf.com/reader/full/data-logging-and-analysis 3/6
To ensure the read bits on data section on the LPT port is used a Sequence
Structure where the first 3 sequences are used for LPT settings [3]. All other programelements are included into a While Loop that repeats the subdiagram inside it until the
conditional terminal, an input terminal, receives a particular Boolean value so that
acquisition can be interrupt by user. After port settings is select the file where are storage
the measured values and for that are used File Dialog respectively New File. The programcan assure one ore more acquisition; number of these is selected by properly control and
number of points of every this acquisition that mean number of values is also selected by
properly control, both on the front panel.
Fig.4. ONLINE ACQUISITION Diagram Bloc
One of the most important sections of the diagram bloc is conversion section
(fig.4.). In this section the 7 bits word acquired is converted into same numerical
representation. To obtain the last one numerical respectively value acquired is used 3 Case
Structure. One of these is selected by properly bit corresponding MSD, NSD and LSD
analog–to–digital converter outputs connected at D4, D5 and D6 bits of the LPT port and
wired to the selected terminal. All that structures are included into a For Loop where
controls value Points/Acquisition is the value wired to the count (N) terminal.Every structure contains a subdiagram (SubVI) BCD-NUM.vi [2] that computes the
right value of the 4 last significant bits. These bits represent the corresponding BCD code
for tenths, units respectively tens. The conversion in whichever structure, only when this
are selected, in decimal number Nr is accomplished by relation:3
32
21
10
0 2D2D2D2D Nr ⋅+⋅+⋅+⋅= (1)
were Di represent bits of the BCD output of the analog–to–digital converter and the value V acquired has the form:
Nr 10D Nr D Nr 10DV 651
4 ⋅⋅+⋅+⋅⋅=−
(2)
8/3/2019 Data Logging and Analysis
http://slidepdf.com/reader/full/data-logging-and-analysis 4/6
Every values generates by For Loop are displayed under numerical value form and
are logging and displayed also under graph form by the Acquisition Results window. At thesame time are generating by Get Date/Time String the real time called record which will
be associated to the stored data. Logging data are definite by using Circuit Interface Nod
(CIN) Write File that writes data to an open file specified by refnum and after
performance [6].For cut the spikes inlays by analog–to–digital converter is used Median Filter that
applies a median filter of rank to the input data sequence. The result of this operation is to
filter the signal represented by input data sequence and on the Front panel it can observe thedifference.
3.2. Analysis Virtual Instrument
The terms "data analysis" and "statistics" mean the same thing, the study of how we
describe, combine, and make inferences from numbers. A lot of measured are scared of numbers, but statistics has got less to do with numbers, and more to do with rules for
arranging them. There are three general areas that make up the field of statistics and one of
these is descriptive statistics which fall into one of two categories: measures of centraltendency (mean, median, and mode) or measures of dispersion (standard deviation and
variance).
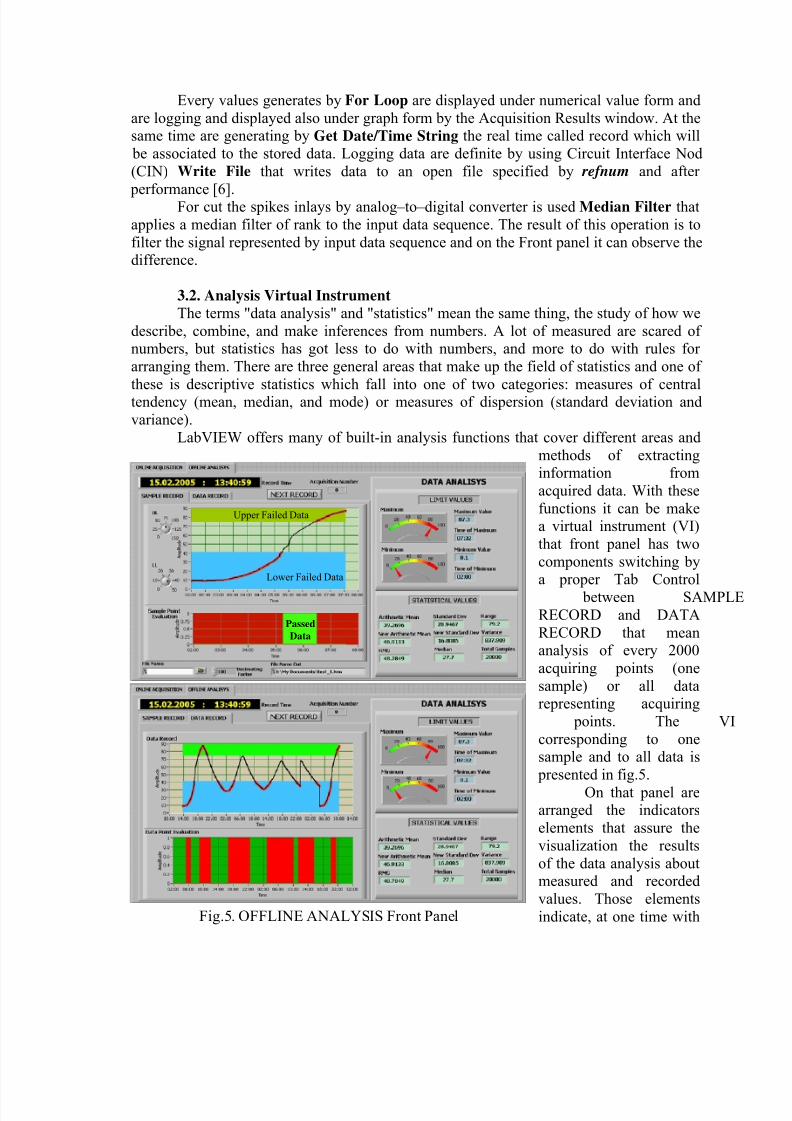
LabVIEW offers many of built-in analysis functions that cover different areas and
methods of extractinginformation from
acquired data. With these
functions it can be makea virtual instrument (VI)
that front panel has two
components switching bya proper Tab Control
between SAMPLE
RECORD and DATA
RECORD that meananalysis of every 2000
acquiring points (one
sample) or all datarepresenting acquiring
points. The VI
corresponding to onesample and to all data is
presented in fig.5.
Passed
Data
Lower Failed Data
Upper Failed Data
On that panel arearranged the indicators
elements that assure the
visualization the results
of the data analysis aboutmeasured and recorded
values. Those elements
indicate, at one time withFig.5. OFFLINE ANALYSIS Front Panel
8/3/2019 Data Logging and Analysis
http://slidepdf.com/reader/full/data-logging-and-analysis 5/6
record time the limits values and statistical values. For the limit values are indicate also the
time when these limits are accomplished. The statistical values represent the statistic parameters described above that is mean, standard deviation and variance computed
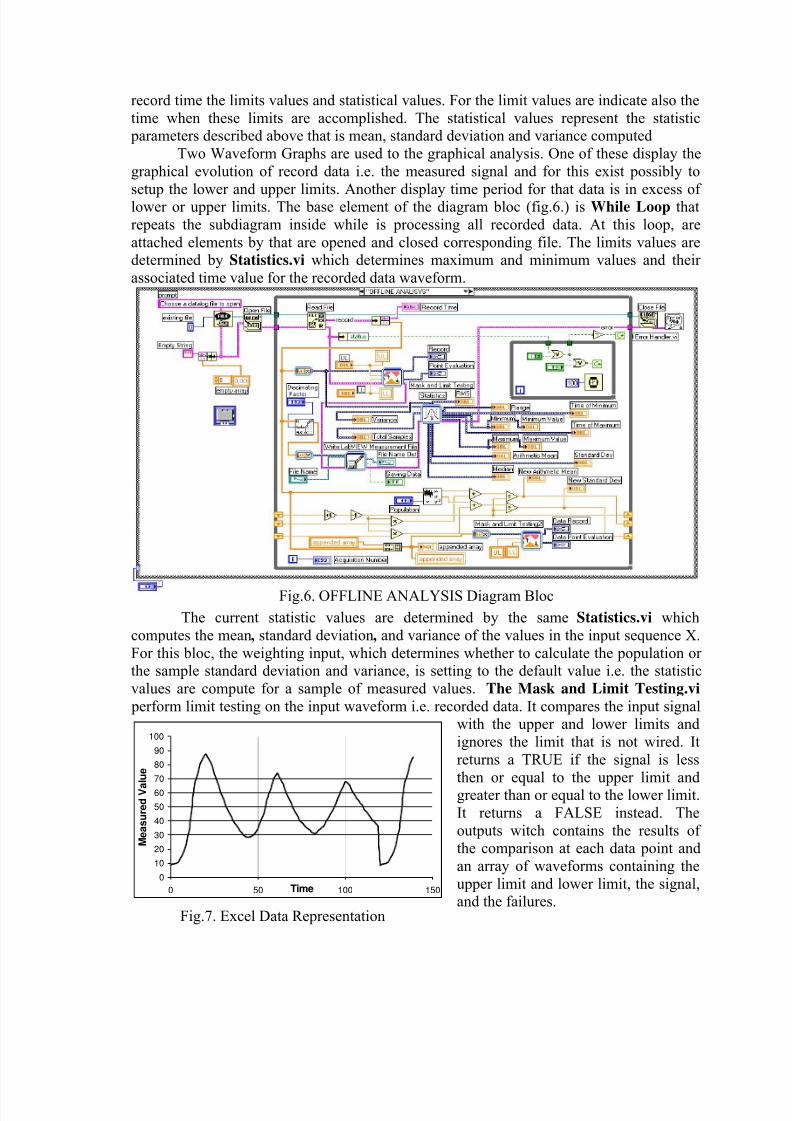
Two Waveform Graphs are used to the graphical analysis. One of these display the
graphical evolution of record data i.e. the measured signal and for this exist possibly to
setup the lower and upper limits. Another display time period for that data is in excess of lower or upper limits. The base element of the diagram bloc (fig.6.) is While Loop that
repeats the subdiagram inside while is processing all recorded data. At this loop, are
attached elements by that are opened and closed corresponding file. The limits values aredetermined by Statistics.vi which determines maximum and minimum values and their
associated time value for the recorded data waveform.
The current statistic values are determined by the same Statistics.vi which
computes the mean, standard deviation, and variance of the values in the input sequence X.
For this bloc, the weighting input, which determines whether to calculate the population or the sample standard deviation and variance, is setting to the default value i.e. the statistic
values are compute for a sample of measured values. The Mask and Limit Testing.vi
perform limit testing on the input waveform i.e. recorded data. It compares the input signalwith the upper and lower limits and
ignores the limit that is not wired. It
returns a TRUE if the signal is less
then or equal to the upper limit andgreater than or equal to the lower limit.
It returns a FALSE instead. The
outputs witch contains the results of the comparison at each data point and
an array of waveforms containing the
upper limit and lower limit, the signal,and the failures.
Fig.6. OFFLINE ANALYSIS Diagram Bloc
0
10
20
30
40
50
60
70
80
90
100
0 50 100 150Time
M e a s u r e d V a
l u e
Fig.7. Excel Data Representation
8/3/2019 Data Logging and Analysis
http://slidepdf.com/reader/full/data-logging-and-analysis 6/6
Use LabVIEW measurement data files To save measurement data files is use the
Write LabVIEW Measurement File Express.vi generates. The LabVIEW data file is atab-delimited text file that can open with a spreadsheet application like Microsoft Excel or a
text-editing application. The recorded data with graph representation in Excel for the same
acquisitions data sequences are presented in figure 7. In addition to the data an Express.vi
generates, the .lvm file includes information about the data, such as the date and time thedata was generated.
5. Conclusions
Using data logging offer the possibility to follow up the evolution for a system or process variable for a long time.
PC-based data logging systems provide the most flexibility, customization, and
integration. The PC-based data logging systems propose in this paper can be simple makingusing a usual DMM from which is enough to ladle out the signals generate to display. This
signal can be different from DMM to DMM but is so easy to adapt the VI to proper signals
form. We are consider a difficult case where analog–to–digital converter provide a 3 digitmultiplexed BCD output but if digits are not multiplexed the solution for VI are simplest.
We are consider also that LabVIEW which is a soft dedicated to data acquisition
satisfy the requests for data logging software. Aid a virtual instrument can create
applications that provide dialogs and interfaces that can use so that depending on their input, specific analysis routines are performed on any given data set. By building this type
of application, users build a certain degree of interactivity into their applications.
References
[1].CIASCAI, I. 1998. Sisteme de achizitie de date pentru calculatoare personale.
Ed. Albastra, Cluj-Napoca, 1998; pp 125
[2].PATRASCOIU, N. 2004Sisteme de achizitie si prelucrare a datelor. Instrumentatie
virtuala. Ed. Didactica si Pedagogica, Bucuresti, 2004; pp
258[3] PATRASCOIU, N. 2002. Modelarea şi simularea prin utilizarea instrumentaţiei
virtuale. In Revista de Instrumentatie Virtuala.Cluj-Napoca,
Romania, 2002; pp 5-8,ISSN 1453-8059[4]. * * * .2001. A Review of PC-Based Data Logging and Recording
Techniques. National Instruments, December.2001
[5] * * *. 2003. LabVIEW for Measurement and Data Analysis
National Instruments, January.2003
[6]. * * *.2003. LabVIEW. User Manual. National Instruments, April 2003
Edition Part Number 320999E-01