Data for Hydrologic Synthesis Project
15
Data for Hydrologic Synthesis Project Expanded Datasets for 431 MOPEX Basins (Working Document) 2009 Summer Institute at the University of British Columbia, Vancouver, Canada Prepared by Matej Durcik Peter Troch Paul Brooks Hydrology and Water Resources, University of Arizona Murugesu Sivapalan Department of Civil and Environmental Engineering, University of Illinois
Transcript of Data for Hydrologic Synthesis Project

Data for Hydrologic Synthesis Project
Expanded Datasets for 431 MOPEX Basins (Working Document)
2009 Summer Institute at the University of British Columbia, Vancouver, Canada
Prepared by
Matej Durcik
Peter Troch Paul Brooks
Hydrology and Water Resources, University of Arizona
Murugesu Sivapalan
Department of Civil and Environmental Engineering, University of Illinois

Data Access
Data access is public, but it requires login:
Username: public
Password: public
Acknowledgment
When using these data in any publication, please acknowledge the website by including
text such as: “Data for Hydrologic Synthesis Project were prepared by Matej Durcik and
supported by SAHRA and Water Cycle Dynamics in a Changing Environment:
Advancing Hydrologic Science through Synthesis project and are available at
http://nero.hwr.arizona.edu/mopex/.”
and cite:
Durcik M., Troch P.A., Brooks P.D., and Sivapalan M. (2009) Data for Hydrologic
Synthesis Project. Retrieved dd Mon YYYY, from http://nero.hwr.arizona.edu/mopex/.
or
Brooks P.D., Troch P.A., Durcik M., Gallo E., and Schlegel M. (2011) Quantifying
regional-scale ecosystem response to changes in precipitation: Not all rain is created
equal. Water Resources Research, 47, W00J08 doi: 10.1029/2010WR009762.
or
Voepel H., Ruddell B., Schumer R., Troch P.A., Brooks P.D., Neal A., Durcik M., and
Sivapalan M. (2011) Quantifying the role of climate and landscape characteristics on
hydrologic partitioning and vegetation response. Water Resources Research doi:
10.1029/2010WR009944.

This data collection consists of historical hydro-meteorological and remotely sensed data
for 431 MOPEX catchments (Schaake et al., 2006; Duan et al., 2006).
Time Period:
10/01/1999 – 12/31/2008
Datasets:
Data type Dataset Source
Hydrological
Daily streamflow USGS
Daily baseflow
Daily storm runoff Computed
Meteorological
Daily site observations:
precipitation, minimal and maximal temperatures
NCDC, NRCS,
USGS
Monthly PRISM:
precipitation, minimal and maximal temperatures Oregon State
Monthly potential evapotranspiration (PRISM) Computed
MODIS
normalized difference vegetation index (NDVI)
enhanced vegetation index (EVI)
leaf area index (LAI)
fraction of photosynthetically active radiation (Fpar)
gross primary production (GPP)
net photosynthesis (PsnNet)
surface reflectance (band1 – band7)
NASA,
USGS
Additional Daily snow water equivalent (SWQ) NRCS
NARR short- and long-wave radiations NCEP
Needed
Daily gridded high resolution (~ 4 km) data:
precipitation, minimal and maximal temperatures
(to expand MOPEX database for the period from
1/1/2004 to 12/31/2008)
Data Location:
http://nero.hwr.arizona.edu/mopex/
and
ftp://nero.hwr.arizona.edu/mopex/
Note: Authentication for http and ftp is required.

USGS Streamflows
Streamflov data are obtained from the USGS National Water Information System
(NWIS) (available at http://water.usgs.gov/nwis).
Data are located in sub-directories USGSStreamFlows431 and
USGSStreamFlowsSelected92.
Data are organized by USGS gage numbers with extension dsf. Each text file contains 5
columns:
1: date (yyyymmdd)
2: streamflow discharge in m3/s (10.3f)
3: daily streamflow discharge in mm (10.4f)
4: daily baseflow in mm (10.4f)
5: daily storm runoff in mm (10.4f)
The one parameter filter developed by Lyne and Hollick (1979) was used to partition the
streamflow into two components, baseflow and storm runoff. Mathematically written:
kkk fby
where y is a streamflow, b is a baseflow, f is a storm runoff and k is a time step number.
The filter equation is
112
1
kkkk yy
aabb
subject to kk yb , where a = 0.925 is the filter parameter (Lyne and Hollick, 1979;
Arnold and Allen, 1999; and Eckhardt, 2005).
Database Format
Data are also available in the ms access database which uses in the Observations Data
Model (ODM) developed by CUAHSI to store values and necessary information about
data. Database documentation and schema is at http://his.cuahsi.org/odmdatabases.html.
Database file StreamFlows4Mopex431.zip is in the sub-directory MSAccessDB.
Variables
VariableID VariableCode VariableName
100003 Q Discharge, daily
100013 Qmm Discharge, daily
100014 BF Base Flow, daily
100015 SR Storm Runoff, daily

MODIS Data
MODIS data are obtained from ftp://e4ftl01u.ecs.nasa.gov/MOLT/:
Product Dataset MOD Spatial
resolution
Temporal
resolution
Vegetation Indices NDVI, EVI MOD13A2 1 km 16 days
LAI/Fpar LAI, Fpar MOD15A2 1 km 8 days
Gross Primary Productivity GPP, PsnNet MOD17A2 1 km 8 days
More detail information about the data and other product can be found at http://modis-
land.gsfc.nasa.gov/index.htm.
The MODIS data were spatially averaged for each catchment and derived data are located
in directories MODIS431 and MODISSelected92. Each directory contains three sub-
directories qHigh, qMedium and qLow where data are computed using different data
quality filtering.
Derived data located in qLow are computed from all valid values.
For so called medium and high quality, the following filtering schema is used:
Product Medium quality High quality
Vegetation Indices Usefulness <= 8 (1000) Usefulness <= 4 (0100)
LAI/Fpar QC <= 81 (01010001) QC <= 48 (00110000)
Gross Primary Productivity QC <= 81 (01010001) QC <= 48 (00110000)
Data are organized by USGS gage numbers with extension mod. Each text file contains
19 columns:
1: date (yyyymmdd)
2: NDVI (9.4f)
3: EVI (9.4f)
4: Fpar in% (9.4f)
5: LAI in m2/m2 (9.4f)
6: GPP in kg/m2 (9.4f)
7: PsnNet in kg/m2 (9.4f)
8: Std of NDVI (9.4f)
9: Std of EVI (9.4f)
10: Std of Fpar in% (9.4f)
11: Std of LAI in m2/m2 (9.4f)
12: Std of GPP in kg/m2 (9.4f)
13: Std of PsnNet in kg/m2 (9.4f)
14: Percentage of grid points used to derive NDVI (4d)
15: Percentage of grid points used to derive EVI (4d)

16: Percentage of grid points used to derive Fpar (4d)
17: Percentage of grid points used to derive LAI (4d)
18: Percentage of grid points used to derive GPP (4d)
19: Percentage of grid points used to derive PsnNet (4d)
Database Format
Data are also available in the ms access database which uses in the Observations Data
Model (ODM) developed by CUAHSI to store values and necessary information about
data. Database documentation and schema is at http://his.cuahsi.org/odmdatabases.html.
File Modis4Mopex431.zip contains database files for each quality level and is located in
the sub-directory MSAccessDB.
Variables
VariableID VariableCode VariableName
1 NDVI Normalized Difference Vegetation Index, 16 days
2 EVI Enhanced Vegetation Index, 16 days
3 FPAR Fraction of Photosynthetically Active Radiation, 8 days
4 LAI Leaf Area Index, 8 days
5 GPP Gross Primary Production, as carbon, 8 days
6 PSN Net Photosynthesis, as carbon, 8 days
DataValues table is a central table which stores data (see ODM description). The column
ValueAccuracy stores standard deviation of the spatially averaged value (column
DataValue) and the column CensorCode represents percentage of all grid points located
in a selected site (catchment) which value was included in the average.
DataValues
ValueID
DataValue
ValueAccuracy
LocalDateTime
UTCOffse
t
DateTimeUTC
SiteID
VariableID
OffsetValue
OffsetTypeID
CensorCode
QualifierID
MethodID
SourceID
SampleID
DerivedFromID
QualityControlLevelID
1 0.5048 0.0479 2/18/2000 0 2/18/2000 1 1 100 1 1 1 2
2 0.434 0.0522 2/18/2000 0 2/18/2000 2 1 88 1 1 1 2
Additional Data
MODIS data were recomputed using the highest possible filtering schema:
Vegetation Indices - Usefulness <= 1 (0001) AND ModLand_QA = 0 (00)
LAI/Fpar - QC = 0 (00000000)
Gross Primary Productivity - QC = 0 (00000000)
These data are stored in Modis4Mopex431_QH.zip in the sub-directory MSAccessDB.

MODIS Surface Reflectance
MODIS data are obtained from ftp://e4ftl01u.ecs.nasa.gov/MOLT/:
Product Dataset MOD Spatial
resolution
Temporal
resolution
Surface Reflectance
Band1 (620–670 nm)
Band2 (841–876 nm)
Band3 (459–479 nm)
Band4 (545–565 nm)
Band5 (1230–1250 nm)
Band6 (1628–1652 nm)
Band7 (2105–2155 nm)
MOD09A1 500 m 8 days
More detail information about the data and other product can be found at http://modis-
land.gsfc.nasa.gov/index.htm.
The MODIS data were spatially averaged for each catchment. They are located in the
directory MODIS431/mod09a1/SurfaceReflectance. Data were computed in two different
levels of quality (HighQuality and HighQualityClear) with the following filtering
schema:
HighQuality – band data quality <= 2 (0010) and QA bits = 0 (00);
HighQualityClear – band data quality <= 2 (0010) and QA bits <= 1 (01) and State QA
cloud = 0 (00);
Data are organized by USGS gage numbers with extension mod. Each text file contains
22 columns:
1: date (yyyymmdd)
2: Band1 (9.4f)
3: Band2 (9.4f)
4: Band3 (9.4f)
5: Band4 (9.4f)
6: Band5 (9.4f)
7: Band6 (9.4f)
8: Band7 (9.4f)
9: Std of Band1 (9.4f)
10: Std of Band2 (9.4f)
11: Std of Band3 (9.4f)
12: Std of Band4 (9.4f)
13: Std of Band5 (9.4f)
14: Std of Band6 (9.4f)
15: Std of Band7 (9.4f)
16: Percentage of grid points used to derive Band1 (4d)
17: Percentage of grid points used to derive Band2 (4d)

18: Percentage of grid points used to derive Band3 (4d)
19: Percentage of grid points used to derive Band4 (4d)
20: Percentage of grid points used to derive Band5 (4d)
21: Percentage of grid points used to derive Band6 (4d)
22: Percentage of grid points used to derive Band7 (4d)
Indexes derived from Surface Reflectance
Indexes were computed for each grid point from filtered surface reflectance data and then
spatially averaged for each catchment. They are located in the directory
MODIS431/mod09a1/DerivedProducts.
Data are organized by USGS gage numbers with extension mod. Each text file contains
16 columns:
1: date (yyyymmdd)
2: NDVI (9.4f)
3: EVI (9.4f)
4: NDWI (9.4f)
5: SIWSI (9.4f)
6: MSAVI (9.4f)
7: Std of NDVI (9.4f)
8: Std of EVI (9.4f)
9: Std of NDWI (9.4f)
10: Std of SIWSI (9.4f)
11: Std of MSAVI (9.4f)
12: Percentage of grid points used to derive NDVI (4d)
13: Percentage of grid points used to derive EVI (4d)
14: Percentage of grid points used to derive NDWI (4d)
15: Percentage of grid points used to derive SIWSI (4d)
16: Percentage of grid points used to derive MSAVI (4d)
NDVI - Normalized Difference Vegetation Index
12
12
BandBand
BandBandNDVI
(Huete et al., 1999, 2002)
EVI - Enhanced Vegetation Index
0.135.710.62
120.2
BandBandBand
BandBandEVI (Huete et al., 1999, 2002)
NDWI - Normalized Difference Water Index
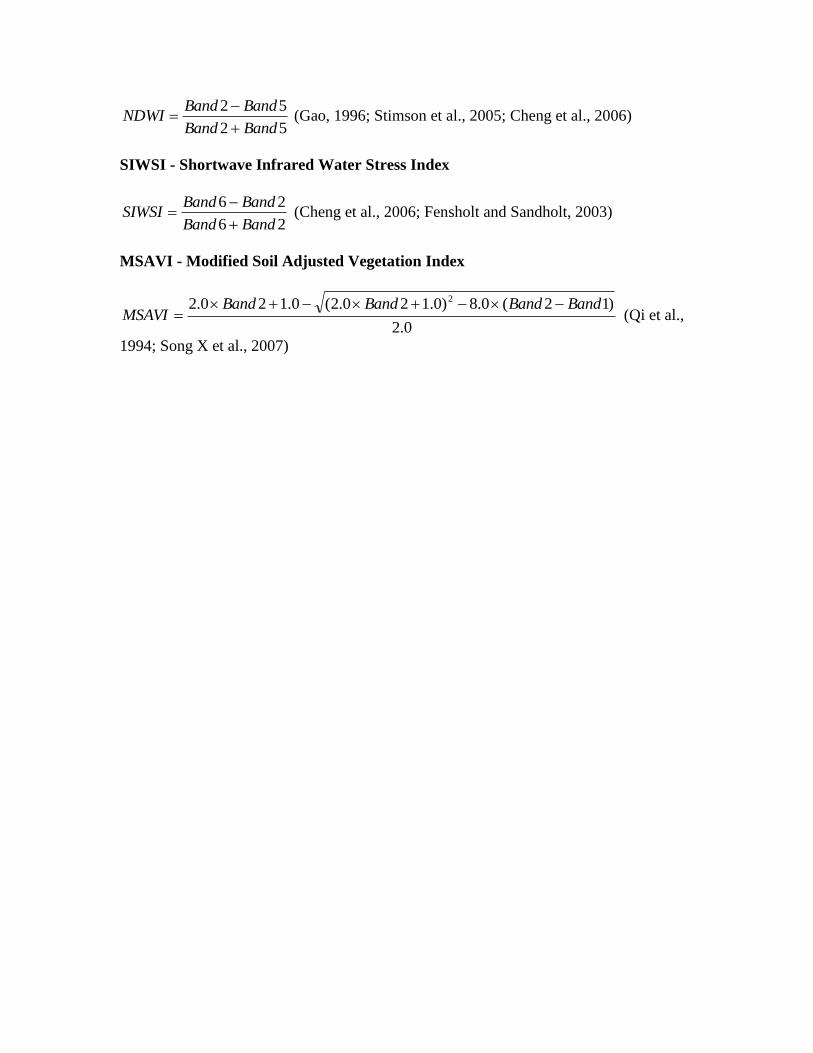
52
52
BandBand
BandBandNDWI
(Gao, 1996; Stimson et al., 2005; Cheng et al., 2006)
SIWSI - Shortwave Infrared Water Stress Index
26
26
BandBand
BandBandSIWSI
(Cheng et al., 2006; Fensholt and Sandholt, 2003)
MSAVI - Modified Soil Adjusted Vegetation Index
0.2
)12(0.8)0.120.2(0.120.2 2 BandBandBandBandMSAVI
(Qi et al.,
1994; Song X et al., 2007)

NARR Radiation Data
North American Regional Reanalysis (NARR) data were obtained from the
http://nomads.ncdc.noaa.gov/data/narr/ and some description can be found at
http://www.emc.ncep.noaa.gov/mmb/rreanl/.
Time period: 1979 – 2008
Temporal resolution: 3 hours
Spatial resolution: 32 km
The reanalysis data were re-sampled to higher resolution (~6 km) and spatially averaged
for each catchment. Derived data are located in the directory NARR/Radiation at the ftp
server ftp://nero.hwr.arizona.edu/mopex/.
Data are organized by USGS gage numbers with extension rad. Each text file contains 3
columns:
1: date (yyyymmddhh) in UTC
2: DSWRF:sfc:kpds=204,1,0:0-3hr ave:winds are N/S: Downward shortwave radiation
flux [W/m2]
3: DLWRF:sfc:kpds=205,1,0:0-3hr ave:winds are N/S: Downward longwave radiation
flux [W/m2]

Monthly Data
PRISM monthly precipitation, minimal and maximal temperatures were obtained from
the Oregon State University at http://www.prism.oregonstate.edu/. Data were spatially
aggregated (average, sum) for each catchment.
USGS daily streamflows (available at http://water.usgs.gov/nwis) and derived daily base
flows and storm runoffs were aggregate to monthly values.
Monthly potential evapotranspiration was computed from the monthly average
temperature using Hamon equation (Hamon 1961)
100
95.4
97.13
062.0
2
T
t
t
eW
WdDPET
Where d is the number of days in a month, D is the mean monthly hours of daylight in
units of 12 h, Wt is a saturated water vapor density and T is the monthly mean
temperature in oC. PET is computed in mm per month.
Monthly mean temperature was computed as (Tmax+Tmin)/2.
The monthly hours of daylight was modeled using algorithm described by Forsythe et al.
(1995).
Data are located in the directory MonthlyData431 at the ftp server
ftp://nero.hwr.arizona.edu/mopex/. They are organized by USGS gage numbers with
extension mly. Each text file contains 8 columns:
1: date (yyyymmdd)
2: monthly precipitation in mm (8.2f)
3: monthly potential evapotranspiration in mm (8.2f)
4: monthly stream flow in mm (8.2f)
5: monthly average maximal temperature in oC (8.2f)
6: monthly average minimal temperature in mm oC (8.2f)
7: monthly base flow in mm (8.2f)
8: monthly storm runoff in mm (8.2f)
Database Format
Data are also available in the ms access database (see MonthlyData4Mopex431.zip)
which uses in the Observations Data Model (ODM) developed by CUAHSI to store
values and necessary information about data. Database documentation and schema is at
http://his.cuahsi.org/odmdatabases.html.

Variables
VariableID VariableCode VariableName
2001 Prcp Precipitation, monthly
2002 Tmax Temperature, monthly, maximum
2003 Tmin Temperature, monthly, minimum
2007 PE Potential Evaportanspiration, monthly
2013 Qmm Discharge, monthly, minimum
2014 BF Base Flow, monthly, minimum
2015 SR Storm Runoff, monthly, minimum

Seasonal Data
This dataset contains computed Horton and Humidity Indexes (Troch et al., 2009) for
different seasons:
yearly;
season 1: April – September;
season 2: May – October;
season 3: April – October.
Horton Index - SRP
QPHI
Humidity Index - PET
PHuI
Stream flow (discharge): Q = BF + SR
Seasonal data (see Variable table below) were computed using the monthly data (see
description above).
Variables VariableID VariableCode VariableName
3001 Prcp_y Precipitation, water year
3002 Q_y Discharge, water year
3003 SR_y Storm Runoff, water year
3011 Prcp_s1 Precipitation, season Apr-Sep
3012 Q_s1 Discharge, season Apr-Sep
3013 SR_s1 Storm Runoff, season Apr-Sep
3021 Prcp_s2 Precipitation, season May-Oct
3022 Q_s2 Discharge, season May-Oct
3023 SR_s2 Storm Runoff, season May-Oct
3031 Prcp_s3 Precipitation, season Apr-Oct
3032 Q_s3 Discharge, season Apr-Oct
3033 SR_s3 Storm Runoff, season Apr-Oct
3501 HI_y Horton Index, water year
3502 HuI_y Humidity Index, water year
3511 HI_s1 Horton Index, season Apr-Sep
3512 HuI_s1 Humidity Index, season Apr-Sep
3521 HI_s2 Horton Index, season May-Oct
3522 HuI_s2 Humidity Index, season May-Oct
3531 HI_s3 Horton Index, season Apr-Oct
3532 HuI_s3 Humidity Index, season Apr-Oct

Data are available only in the ms access database (see Horton_PRISM.zip) which uses in
the Observations Data Model (ODM) developed by CUAHSI to store values and
necessary information about data. Database documentation and schema is at
http://his.cuahsi.org/odmdatabases.html.

References
Forsythe W.C., E.J. Rykiel Jr., R.S. Stahl, H. Wu, R.M. Schoolfield (1995) A model
comparison for daylength as a function of latitude and day of year. Ecological Modelling,
Volume 80, Issue 1, Pages 87-95.
Huete, A., Didan, K., Miura, T., Rodríguez, E.P., Gao, X., Ferreira, L.G. (2002)
Overview of the radiometric and biophysical performance of the MODIS vegetation
indices. Remote Sensing of Environment 83,195-213.
Huete A., Justice C., and van Leeuwen W (1999) Modis Vegetation Index (MOD 13)
Algorithm Theoretical Basis Document, Version 3.
http://modis.gsfc.nasa.gov/data/atbd/atbd_mod13.pdf
Schaake J., S. Cong, and Q Duan (2006) U.S.MOPEX Data Set.
ftp://hydrology.nws.noaa.gov/pub/gcip/mopex/US_Data/Documentation/.
Duan Q, Schaake J, Andreassian V, Franks S, Goteti G, Gupta HV, Gusev YM, Habets F,
Hall A, Hay L, Hogue T, Huang M, Leavesley G, Liang X, Nasonova ON, Noilhan J,
Oudin L, Sorooshian S, Wagener T, Wood EF (2006) Model Parameter Estimation
Experiment (MOPEX): An overview of science strategy and major results from the
second and third workshops. Journal of Hydrology, 320(1-2), 3-17.
Stimson H.C., D.D. Breshears, S.L. Ustin, S.C. Kefauver (2005) Spectral sensing of foliar water conditions in two co-occurring conifer species: Pinus edulis and Juniperus monosperma. Remote Sensing of Environment, 96, 108– 118.
Cheng Y.B., P.J. Zarco-Tejada, D. Riano, C.A. Rueda, and S.L. Ustin (2006) Estimating
vegetation water content with hyperspectral data for different canopy scenarios:
Relationships between AVIRIS and MODIS indexes. Remote Sensing of Environment,
104(3), 346-359.
Gao B.C. (1996) NDWI - A normalized difference water index for remote sensing of
vegetation liquid water from space. Remote Sensing of Environment, 58(3), 257-266.
Fensholt R. and I. Sandholt (2003) Derivation of a shortwave infrared water stress index
from MODIS near- and shortwave infrared data in a semiarid environment. Remote
Sensing of Environment, 87(1), 111-121.
Qi J., A. Chehbouni, A. Huete, Y. Kerr, and S. Sorooshian (1994) A modified soil
adjusted vegetation index. Remote Sensing of the Environment, 48, 119-126.
Song X., S. Huang; L., Qinhuo, and L. Xiaotao (2007) Vegetation water inversion using
MODIS satellite data. In: Geoscience and Remote Sensing Symposium, 2007. IGARSS
2007. IEEE International.