
Data Equity Cebr
44
Report for SAS April 2012 Data equity Unlocking the value of big data
-
Upload
bobby-babaloo -
Category
Documents
-
view
21 -
download
0
Transcript of Data Equity Cebr
Report for SASApril 2012
Data equityUnlocking the value of big data

Data equity: Unlocking the value of big data
| 2
DisclaimerWhilst every effort has been made to ensure the accuracy of the material in this document, neither the Centre for Economics and Business Research Ltd (Cebr) nor the report’s authors will be liable for any loss or damages incurred through the use of the report.
Authorship and acknowledgementsThis report has been produced by Cebr, an independent economics and business research consultancy established in 1993, providing forecasts and advice to City institutions, government departments, local authorities and numerous blue chip companies throughout Europe. The study was led by Shehan Mohamed and Osman Ismail, with direction from Oliver Hogan, Head of Microeconomics.
This study was commissioned by SAS UK and Ireland, the leader in business analytics software and services, and the largest independent vendor in the business intelligence market. Through innovative solutions, SAS helps customers at more than 55,000 sites globally improve performance and deliver value by making better decisions faster. The report has utilised data available in the public domain from a variety of sources including the Office for National Statistics, TDWI, McKinsey and IDC.
London, April 2012
Centre for Economics and Business Research LtdUnit 1, 4 Bath Street, London EC1V 9DXTel: 020 7324 2850 Web: www.cebr.com
Data equity: Unlocking the value of big data
| 3
ContentsExecutive Summary ................................................................................................................................................................. 4
1 Introduction and background ...........................................................................................................................................7
1.1 Data equity: a new type of capital? ............................................................................................................................. 7
1.2 Purpose and objective of the study ............................................................................................................................. 8
1.3 Summary of methodology ............................................................................................................................................ 8
1.4 Structure of this report ................................................................................................................................................. 8
2 Methodology for quantifying the macroeconomic benefits of big data ...................................................................... 9
2.1 Overall approach .......................................................................................................................................................... 9
2.2 Economy-wide benefits from cost savings and revenue growth opportunities ...................................................... 10
2.3 Economy-wide benefits from product innovation ..................................................................................................... 12
2.4 Economy-wide benefits from business creation ....................................................................................................... 14
2.5 Employment impacts .................................................................................................................................................. 14
3 Identification and quantification of the benefits of big data to business .................................................................. 15
3.1 Characteristics of big data, big data analytics and operational benefits for business ........................................... 15
3.2 Cost savings and revenue growth opportunities – literature review findings .......................................................... 17
3.3 Product innovation...................................................................................................................................................... 18
3.4 Business creation ....................................................................................................................................................... 18
4 Current and prospective big data analytics rates of adoption ...................................................................................20
4.1 Current patterns of big data analytics adoption .......................................................................................................20
4.2 Drivers of and barriers to growth in adoption ............................................................................................................20
4.3 Measuring growth potential for big data analytics adoption across industries ....................................................... 21
4.4 Prospective patterns of adoption .............................................................................................................................. 25
4.5 Big data analytics adoption scenario ........................................................................................................................26
5 The value of data equity by industry .............................................................................................................................. 28
5.1 Macroeconomic context ............................................................................................................................................ 28
5.2 Prospects across industries .......................................................................................................................................30
5.3 The value of data equity by industry ..........................................................................................................................30
5.4 Business efficiency benefits ...................................................................................................................................... 31
5.4.1 Customer Intelligence .......................................................................................................................................32
5.4.2 Supply Chain Management ..............................................................................................................................32
5.4.3 Quality Management .........................................................................................................................................33
5.4.4 Risk Management .............................................................................................................................................33
5.4.5 Performance Management ...............................................................................................................................33
5.4.6 Fraud Detection .................................................................................................................................................34
5.5 Business innovation benefits .....................................................................................................................................34
5.6 Business creation and employment benefits ............................................................................................................35
5.7 Conclusion ..................................................................................................................................................................35
Appendix A: Literature Review .............................................................................................................................................36
Appendix B: Bibliography ......................................................................................................................................................39
Data equity: Unlocking the value of big data
| 4
Executive summaryThis is the summary of an independent economic study on ‘big data’ by the Centre for Economics and Business Research (Cebr)1. As the amount of data continues to grow exponentially, compounded by the internet, social media, cloud computing and mobile devices, it poses both a challenge and an opportunity for organisations – how to manage, analyse and make use of the ever-increasing amount of data being generated.
In our study, we investigated how UK organisations can unlock the economic value of big data through the adoption of big data analytics. By using big data analytics solutions, and specifically high-performance analytics, businesses and governments can analyse huge amounts of data in seconds and minutes to reveal previously unseen patterns, senti-ments and customer intelligence. This speed and accuracy of insight, delivered across any device including smart phones and tablets, means organisations can make better, faster decisions.
Our study focuses on establishing a measure of the aggregate economic benefits that could be gained for organisations in the private and public sectors by unlocking the insights available from big data. The economic value of big data has been termed as ‘data equity’2. Data equity is achieved through an analysis of six key mechanisms through which these insights can be capitalised into gains and, thus, how these six mechanisms impact on hard economic variables relating to three core benefits - business efficiency, business innovation and business creation. The six mechanisms are custom-er intelligence, supply chain intelligence, performance, quality and risk management and fraud detection.
Headline results: Economy-wide benefits projected for the period 2012-2017
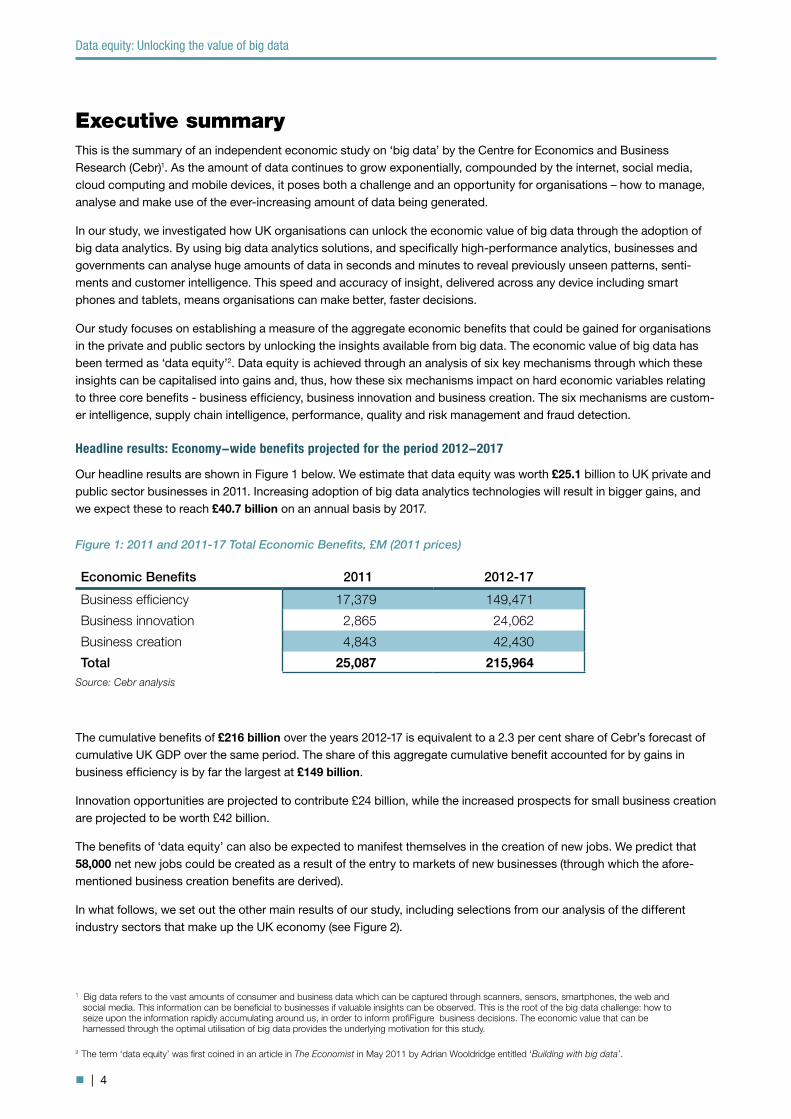
Our headline results are shown in Figure 1 below. We estimate that data equity was worth £25.1 billion to UK private and public sector businesses in 2011. Increasing adoption of big data analytics technologies will result in bigger gains, and we expect these to reach £40.7 billion on an annual basis by 2017.
The cumulative benefits of £216 billion over the years 2012-17 is equivalent to a 2.3 per cent share of Cebr’s forecast of cumulative UK GDP over the same period. The share of this aggregate cumulative benefit accounted for by gains in business efficiency is by far the largest at £149 billion.
Innovation opportunities are projected to contribute £24 billion, while the increased prospects for small business creation are projected to be worth £42 billion.
The benefits of ‘data equity’ can also be expected to manifest themselves in the creation of new jobs. We predict that 58,000 net new jobs could be created as a result of the entry to markets of new businesses (through which the afore-mentioned business creation benefits are derived).
In what follows, we set out the other main results of our study, including selections from our analysis of the different industry sectors that make up the UK economy (see Figure 2).
1 Big data refers to the vast amounts of consumer and business data which can be captured through scanners, sensors, smartphones, the web and social media. This information can be beneficial to businesses if valuable insights can be observed. This is the root of the big data challenge: how to seize upon the information rapidly accumulating around us, in order to inform profiFigure business decisions. The economic value that can be harnessed through the optimal utilisation of big data provides the underlying motivation for this study.
2 The term ‘data equity’ was first coined in an article in The Economist in May 2011 by Adrian Wooldridge entitled ‘Building with big data’.
Economic Benefits 2011 2012-17
Business efficiency 17,379 149,471
Business innovation 2,865 24,062
Business creation 4,843 42,430
Total 25,087 215,964
Figure 1: 2011 and 2011-17 Total Economic Benefits, £M (2011 prices)
Source: Cebr analysis

Data equity: Unlocking the value of big data
| 5
Better customer intelligence to reap £74 billion in benefits
The main efficiency gain to the UK economy is contributed through improvements in customer intelligence. Consumer spending accounts for over 60 per cent of UK GDP, meaning that enhanced customer intelligence, informed by big data, will have a significant impact on the national economy. Data-driven improvements in targeted customer marketing, the more effective meeting of demand and the analytical evaluation of customer behaviour is forecast to produce £73.8 billion in benefits over the years 2012-17.
£46 billion boost to the supply chain
There is also much value to be unlocked from supply chain and logistical data. Predictive analytics forecasting demand, anticipating replenishment points, optimising stock and resource allocations can greatly reduce costs. Cebr anticipates £45.9 billion in gains through this channel.
Public sector could save £2 billion in fraud detection and generate £4 billion through better performance management
According to the latest figures from the National Fraud Authority, the public sector lost £20 billion through fraud in 2011/123. High-performance analytics can improve the scope and accuracy of fraud prevention, furnishing cost savings for the public sector of £2.0 billion by 2017. A further £5.6 billion in efficiencies could be gained through the effective analysis of performance data, with the healthcare system benefiting to the tune of £1.9 billion.
Data-driven innovation to increase value added by £24 billion
The innovation potential of big data will lead to a £24.1 billion contribution to the UK economy between the years 2012-17. Applying high-performance analytics to the big data available within the research and development process will assist in the evolution of new products and services, and lead to the creation of new markets for businesses to exploit.
Cebr expects the Manufacturing sector to see the largest innovation gain from the adoption of big data analytics. The utilisation of high-performance analytics could lead to new product development benefits of £8.1 billion in increased output over the years 2012-17. The Retail sector can also experience significant gains through the innovation channel. The inception of new consumer products in the Retail sector is expected to induce a £3.1 billion rise in output over the forecast period.
3 Annual Fraud Indicator 2012 – National Fraud Authority (March 2012)
Industry 2011 2012-17
Manufacturing 5,965 45,252
Retail 3,406 32,478
Other Activities 3,446 27,929
Professional Services 3,039 27,649
Central Government 2,517 20,405
Healthcare 1,450 14,384
Telecoms 1,465 13,740
Transport & Logistics 1,360 12,417
Retail Banking 708 6,408
Energy & Utilities 660 5,430
Investment Banking 554 5,275
Insurance 517 4,595
UK economy 25,087 215,964
Figure 2: 2011 and 2011-17 Industry Benefits, £M (2011 prices)
Source: Cebr analysis

Data equity: Unlocking the value of big data
| 6
Levelling the playing field for SMBs could yield £42 billion in business creation benefits and raise employment by around 58,000
Improvements in market and customer intelligence in every sector will support entrepreneurial activity, allowing for more precise strategising and reduced uncertainty, therefore attracting new business start-ups into these markets. This enhanced information, and ability to react dynamically to changes in the market landscape, will enable smaller businesses to compete more effectively with larger and more-established ones, having reduced the ‘barriers to entry’ to the market. Small retailers and manufacturers are anticipated to take significant advantage of this big data opportunity, generating £14.5 billion of new business over the next five years.
The total numbers of jobs created is expected to be 58,000 over the next five years as a result of new business start-ups and increased demand for data-specific roles.
Data equity: Unlocking the value of big data
| 7
1 Introduction and backgroundThe Centre for Economics and Business Research (Cebr) was appointed by SAS to undertake a study quantifying the economic benefits of big data to the UK. For the purposes of this report, we have labelled these economic benefits arising from big data as ‘data equity’.4
This is the first ever study of the economic impact of big data in the UK economy and provides an independent assess-ment of the role that recent advances in Information & Communications Technology (ICT) can play in rebalancing and reviving economic growth across the Manufacturing and Services sectors.
1.1 Data equity: a new type of capital?The current economic uncertainty caused by the European sovereign debt crises, plans for public sector reform and the absence of a clear growth strategy have forced many enterprises to reassess their business models. Pressures mount to increase profitability, enhance performance and create innovative products of the highest quality for both existing and prospective customers. However, the significant funding gap for investing in new and exciting opportunities means that many firms have been unable to exploit their full growth potential. The universal challenge of finance, operations and sales directors is, therefore, to grow organically in a business environment where access to capital is constrained.
Big data is becoming an increasingly important asset to draw upon: large volumes of highly detailed data from the vari-ous strands of a business provide the opportunity to deliver significant financial and economic benefits to firms and consumers. The advent of big data analytics in recent years has made it easier to capitalise on the wealth of historic and real-time data generated through supply chains, production processes and customer behaviours.
The value of big data that can be unlocked from analytics, also known as ‘data equity’, is increasing rapidly as techno-logical innovations take hold. Scanners, sensors, mobile phones, loyalty cards, smart meters, the web and social media platforms generate vast amounts of structured and unstructured data. Within all this information lie many potentially profitable insights regarding customers behaviours, market trends and supply chain processes. The data equity is only released when the data is analysed to reveal these insights, allowing for a business to capitalise upon the resulting opportunities.
Big data analytics tools need to be optimised for large datasets. Predictive analytics, data mining and advanced data visualisation are all examples of high-performance analytics tools, which can be deployed to compute rapid streams of high-volume and complex data, in order to provide the timely business insights required for better firm decision-making.
Whilst in-house big data ‘archives’ are not as prevalent among SMBs (small and medium-sized businesses) as they are in larger firms due to the requisite scale of technology remaining relatively expensive, we expect big data to provide benefits across firms of all sizes over the forecast period. The cost of processing power and data storage continues to decline long-term, with the proliferation of cloud computing supporting affordable expansions in technological capac-ity. Businesses may also detect the benefits available through vertical and horizontal data agglomeration, realised when suppliers, manufacturers and retailers pool their existing data in pursuit of efficiency and innovation. Social media and other public sources of big data provide insights which are potentially observable by all businesses. We also expect data equity to be dispersed through market research firms – specialist big data accumulators, who may discern and sell insights to those smaller businesses for whom high-performance IT infrastructure is unaffordable. Further, we expect many start-ups to be supported by demand for specialist data analytics skills – indeed, data specialist roles are already increasingly central to the UK’s ICT industry.
At an economy-wide level, enterprises adopting high-performance analytics unlock the economic value of big data, attaining cost savings, experiencing revenue growth and fostering the innovation of new products. This raises value added and employment in the UK economy, and increases the global competitiveness of the UK’s goods and services.
4 The term ‘data equity’ was first coined by Adrian Wooldridge in the Schumpeter column of The Economist in May 2011; Building with Big Data. Comparable to ‘Brand Equity’, the term refers to the monetisation of vast amount of data accessed, stored and analysed by businesses.
Data equity: Unlocking the value of big data
| 8
1.2 Purpose and objective of the studySAS asked that we provide a robust quantification of the economic benefits of big data in the hope of informing a wide audience of its potential and contributing to the unfolding big data debate. Cebr set out to achieve this by understand-ing and discussing big data combined with high-powered analytics in terms of their potential impact on hard economic variables.
Our study is an attempt to assess the potential value of data equity to the companies that gather and store big data, and who combine this with high-performance analytics to harness the big data’s full potential. We undertook this at the sec-tor level by reviewing and developing an understanding from the available literature of how and by what means big data could be expected to impact on each of twelve sectors: Retail Banking, Insurance, Investment Banking, Retail, Central Government, Healthcare, Transport & Logistics, Telecommunications, Energy & Utilities, Manufacturing, Professional Services and Other Activities.
The results at this level were aggregated to provide the direct economic benefits that could flow from harnessing the potential of big data in the UK.
1.3 Summary of methodologyIn order to model the economic benefits of big data (‘data equity’) to the UK economy, Cebr developed a macro- economic model designed to calculate the aggregate economy-wide impacts of big data analytics.
We adopted a three-stage approach to the study. These were to:
1. Identify and quantify the benefits of big data to business: this required an understanding of the benefits of big data at the enterprise level, by assembling a framework to capture those benefits in terms of economic variables, namely business efficiency, innovation and creation impacts. This involved a review of relevant academic and business litera-ture on the potential enterprise-level impacts. We evaluated each industry in terms of five key characteristics which collectively represent the extent to which big data has the potential to transform its operations: data intensity, earnings volatility, product differentiation, supply chain complexity and IT intensity.
2. Determine current and prospective rates of big data analytics adoption: this required an understanding of the major drivers of and inhibitors to the widespread adoption of big data analytics, in order to arrive at appropriate adop-tion forecasts. In undertaking this step, we were primarily informed by the evaluation of the sector-level potential of big data to transform business operations (as related in stage 1 above). We also conducted a review of the adoption rates anticipated by technology experts in the current business environment.
3. Calculate the aggregate economy-wide benefits of big data: this involved deploying the information from the first two stages into a macroeconomic model, in order to estimate the sum benefits across the UK economy. The enterprise-level benefits and adoption rates were calculated and aggregated separately for each of the twelve industry sectors.
1.4 Structure of this reportThis report is structured as follows:
• Section 2 considers the methodology used to calculate the macroeconomic benefits of big data.
• Section 3 considers the methodology used to understand the business-level operational benefits of big data and to express these as either cost savings or revenue opportunities.
• Section 4 analyses the key drivers and inhibitors of adoption. This analysis draws upon data and forecasts produced by technology specialists, expert reviews and analyst reports, which we used as the basis for industry adoption forecasts in our macroeconomic model.
Data equity: Unlocking the value of big data
| 9
2 Methodology for quantifying the macroeconomic benefits of big data This section provides an outline of the methodology that was employed to calculate the aggregate economy-wide benefits of big data. Although this is the last in a three-stage approach, it is the macroeconomic quantification that is the primary focus of this report. It is appropriate, therefore, to set out early on the methodology used to undertake this macroeconomic quantification.
2.1 Overall approachThe economic model used to quantify the macroeconomic impact of data equity was designed to analyse three broad sources of benefits:
1. Enterprise-level business efficiency gains from big data – The impact on firm revenues and costs through six key mechanisms: Customer Intelligence, Supply Chain Management, PQR (Performance, Quality and Risk) Management and Fraud Detection. The quantification of the firm-level impacts through each mechanism was based on a review of the academic and industry literature.
2. Enterprise-level business innovation gains from big data – The impact on firm innovation and, as a consequence, new product development through more efficient use of research and development. This was quantified by modelling the effect of an increase in data-driven R&D expenditure and the knock-on effect on future long-term sales in each industry.
3. Enterprise-level business creation gains from big data – The impact of reduced barriers to entry to new markets and technologies on SMB (small- and medium-sized business) creation. This was based on quantifying the effects on the number of business start-ups as a result of the profits signals generated through the first two channels.
We combined our estimates of the value of these economic gains with estimated current and projected levels of industry-specific adoption rates of big data analytics – the proportion of businesses in each industry which are currently adopting and can be expected to adopt in the future high-performance analytics technologies. Quantification of current and future rates of adoption was based on a review of industry reports from technology experts and an assessment of industry ‘potentiality’ based on five factors: data intensity, earnings volatility, product differentiation, supply chain com-plexity and IT intensity. This ‘potentiality’ analysis was also a key element in understanding and quantifying the value of the aforementioned three sources of enterprise-level benefits, as discussed further below.
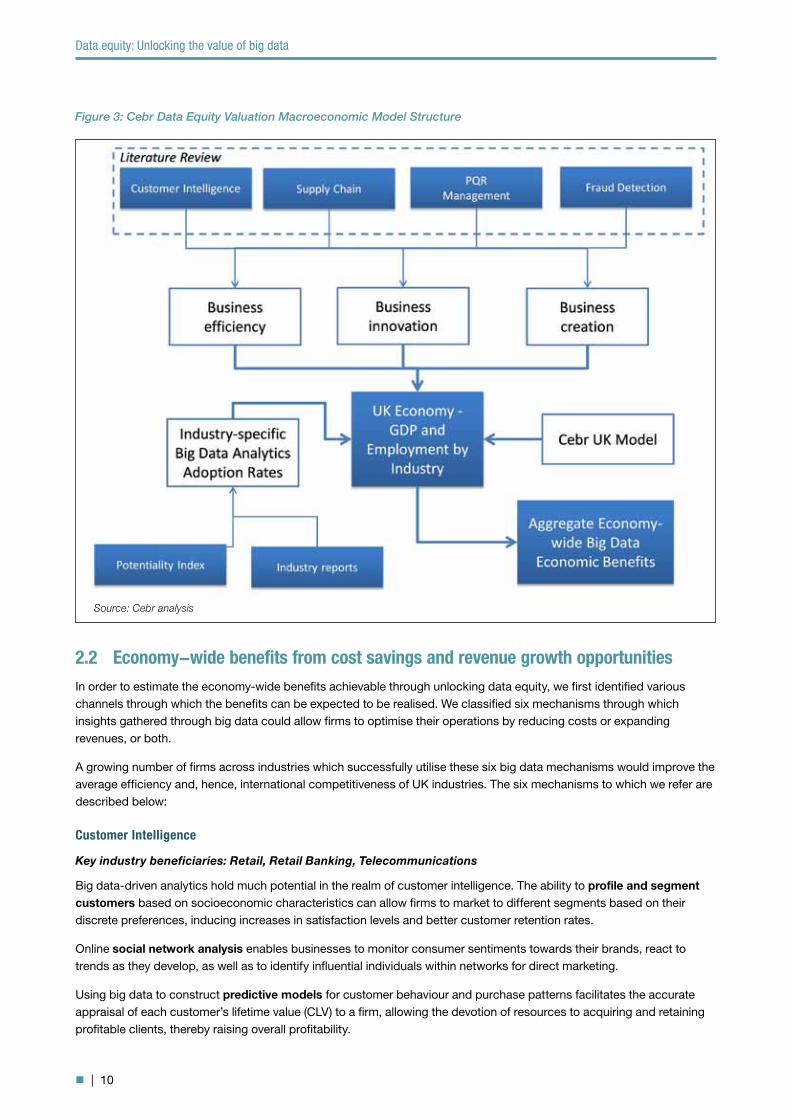
We developed a bespoke macroeconomic model to calculate the aggregate economy-wide impact over the next six years of big data flowing. The model was built around National Statistics’ economic data for sectors and the economy as a whole, Cebr’s in-house economic forecasting, as well as our estimates of enterprise-level impacts and rates of adop-tion of big data analytics. Figure 3 illustrates the structure of the model.
Cebr’s macroeconomic model estimates changes in economic fundamentals (GDP and employment) as a result of changes in the adoption of big data analytics across each industry. Higher rates of adoption across industry drive ever greater economy-wide benefits.
Data equity: Unlocking the value of big data
| 10
2.2 Economy-wide benefits from cost savings and revenue growth opportunitiesIn order to estimate the economy-wide benefits achievable through unlocking data equity, we first identified various channels through which the benefits can be expected to be realised. We classified six mechanisms through which insights gathered through big data could allow firms to optimise their operations by reducing costs or expanding revenues, or both.
A growing number of firms across industries which successfully utilise these six big data mechanisms would improve the average efficiency and, hence, international competitiveness of UK industries. The six mechanisms to which we refer are described below:
Customer Intelligence
Key industry beneficiaries: Retail, Retail Banking, Telecommunications
Big data-driven analytics hold much potential in the realm of customer intelligence. The ability to profile and segment customers based on socioeconomic characteristics can allow firms to market to different segments based on their discrete preferences, inducing increases in satisfaction levels and better customer retention rates.
Online social network analysis enables businesses to monitor consumer sentiments towards their brands, react to trends as they develop, as well as to identify influential individuals within networks for direct marketing.
Using big data to construct predictive models for customer behaviour and purchase patterns facilitates the accurate appraisal of each customer’s lifetime value (CLV) to a firm, allowing the devotion of resources to acquiring and retaining profitable clients, thereby raising overall profitability.
Figure 3: Cebr Data Equity Valuation Macroeconomic Model Structure
Source: Cebr analysis

Data equity: Unlocking the value of big data
| 11
Dynamic analysis of market demand responses to price/product changes can facilitate optimal pricing and stocking decisions, reducing revenues lost through customer defections.
These tools indicate the possibilities for business efficiency improvements through customer intelligence channels. The kinds of profit-maximising pricing structures that could be facilitated through high-performance analytics could, in theory, induce producers to maximise output because of greater certainty that spending would increase amongst all types of consumers because preferences are being met. This would minimise deadweight loss to the UK economy. The extent to which consumers benefit depends on a range of factors including, for instance, competitiveness of the mar-kets in question or, in the absence of such competitiveness, the nature of state intervention such as taxes, subsidies or detailed regulation.
Supply Chain Management
Key industry beneficiaries: Manufacturing, Retail, Transport & Logistics
Supply chains are complex systems, producing much data from various sources. Firms using analytics to forecast demand changes can match their supply to these anticipated levels, reducing expenditure on warehousing for superflu-ous orders, and mitigating revenues lost through stock-outs.
By analysing stock utilisation and geospatial data on deliveries, businesses can automate replenishment decisions to reduce lead times, thereby minimising costly delays and process interruptions. Businesses can also use supplier data to monitor performance, taking decisions to change supplier based on superior quality or price competiveness.
Optimal inventory levels may be computed, through analytics accounting for product lifecycles, lead times, location attributes and forecasted demand levels. The sharing of big data with upstream and downstream units in the supply chain, or vertical data agglomeration, can guide enterprises seeking to avoid inefficiencies arising from incomplete information, helping to achieve demand-driven supply and just-in-time (JIT) delivery processes.
Quality Management
Key industry beneficiaries: Manufacturing, Energy & Utilities, Telecoms
Improving the quality of goods and services produced and sold can increase profitability and reduce costs simultane-ously. In the manufacturing process, predictive data analytics can be used to minimise performance variability and pre-empt quality issues with early-warning alerts which can significantly reduce scrap rates, decrease time to market and rational supply chain costs.
Identifying disruptions to the production process before and as they occur can save significant capital expenditures on equipment/machinery, and reduce labour expenditure on unplanned maintenance and repairs.
Real-time monitoring enables managers to make swifter decisions to address quality which ultimately reduces customer attrition, supports brand equity and increases profitability over the medium to long term.
A sustained period of quality improvement through the real-time use of data across supply chain, production and sales functions allows for significant operating and capital expenditure reductions to take place. In addition, higher levels of quality will increase profits and generate further value added.
Risk Management
Key industry beneficiaries: Investment Banking, Retail Banking, Insurance
The evaluation and bearing of risk is central to the Financial Services sector, where investments are selected by balanc-ing the likelihood of gains against the likelihood of losses. Big data can offer assistance to firms seeking full and dynamic appraisal of risk exposures, from internal and external sources, across all categories. High-performance analytics can integrate ‘risk silos’ into enterprise-wide risk profiles, mitigating the dangers posed by separate departments managing risks in isolation, without accounting for the interrelation of different risk types.
Further, real-time analysis of external market conditions, balance sheet composition and trading updates across all financial instruments can enable dynamically-optimised capital buffers, proposing the best hedging strategies, whilst conforming to the organisation’s risk appetite.
Data equity: Unlocking the value of big data
| 12
More effective risk management will lower instances of unanticipated losses, as well as mitigate their impacts, provid-ing firms with lowered long-term costs. Effective risk management can ultimately ensure greater stability in the financial sector, as market shocks can be absorbed more successfully. This will have important effects in the wider UK economy, permitting improved business and credit continuity even in times of financial market distress.
Performance Management
Key industry beneficiaries: Government, Healthcare
The Government’s intention to cut spending by £95 billion by 20155 and plans to make £20 billion of efficiency savings in the NHS by 20146 have both highlighted the urgency of improving productivity in these sectors. Staff performance infor-mation can be dynamically monitored and forecast through predictive analytics tools, allowing departments to link stra-tegic objectives with service-user outcomes. The use of predictive KPIs, balance scorecards and dashboards within the public sector can instil operational benefits provided that the required data is fully accessible to operations managers.
The introduction of Performance Information (PI) in the budgeting process has been widely employed during reforms to improve expenditure control and public sector management. The benefits of PI include improvements in setting objec-tives, monitoring of performance, planning and management functions and transparency. Healthcare IT systems which efficiently communicate and integrate patient data across departments and institutions, whilst retaining privacy controls, are likely to improve efficiency and quality of care.
Fraud Detection
Key industry beneficiaries: Government, Retail Banking, Insurance
For the financial year 2011-12, fraud cost the UK economy £73.0 billion according to the National Fraud Authority – an executive agency of the Home Office7. Public sector fraud cost the UK taxpayer £20.3 billion with £15.6 billion lost in tax and benefits fraud. Fraud has cost the private sector £45.5 billion over the same period, of which £16.1 billion is retail fraud.
The benefits of data analytics within fraud detection have been documented by the Audit Commission’s National Fraud Initiative (NFI), established in 1996. The NFI is programme that matches electronic data within and between public and private sector bodies to prevent and detect fraud. In 2008/9 the NFI traced £215m in fraud, error and overpayments.
Analytics are common in automated fraud detection, and sectors making use of automated systems can improve their robustness by harnessing the potential in big data. Customer intelligence insights can be incorporated to model ‘normal’ customer behaviour, for the accurate flagging of outlier occurrences or suspiciously divergent activity. Introducing big data about prevailing fraud patterns can allow systems to ‘learn’ new types of fraud, as fraudsters adapt to the systems designed to combat them. Social network analysis can also be employed to identify networks of collaborating fraud-sters, or discover evidence of fraudulent insurance or government benefits claims. All of this will lead to more efficient investment of auditors’ time, both through less fraudulent activity going undiscovered and less time spent investigating ‘false positives’.
2.3 Economy-wide benefits from product innovationIn order to calculate the aggregate economy-wide benefits associated with enterprise-level product innovation, we estimated the business impacts of more effective research and development (R&D) activities as a result of big data analytics.
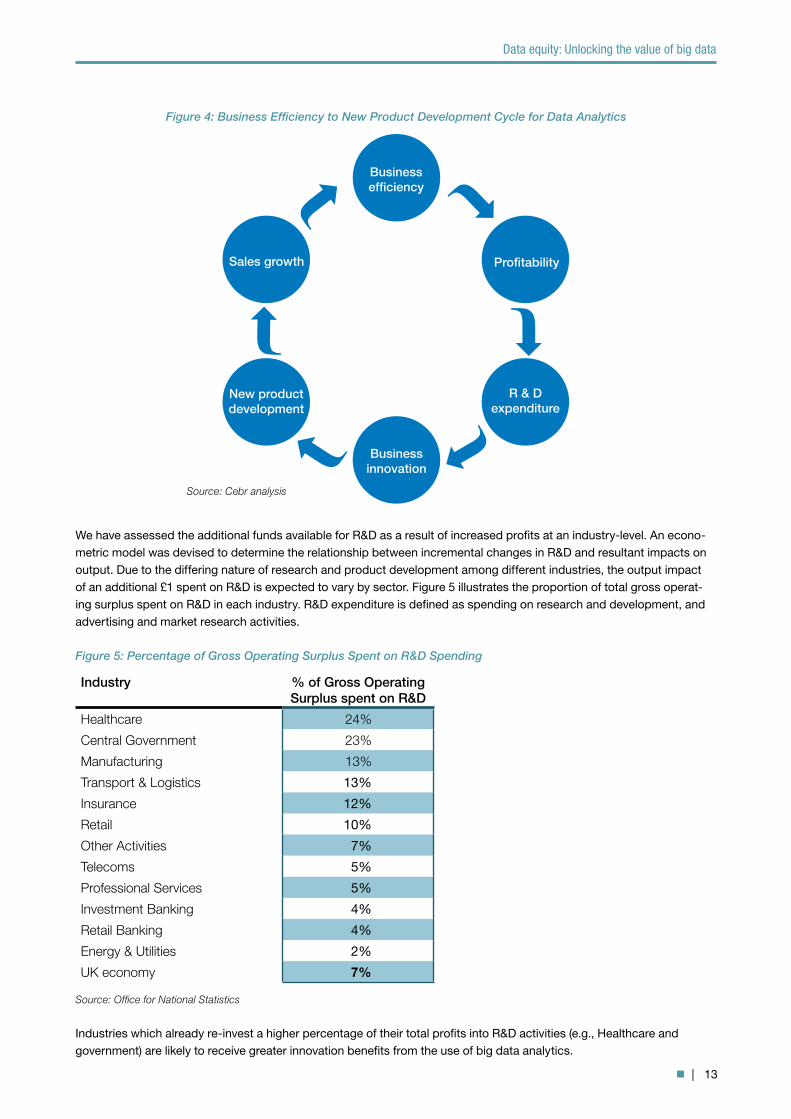
As was discussed in the previous section, the use of big data analytics tools increases operational efficiency which ulti-mately enhances profitability. This allows for a proportion of the additional profits to be reinvested into analytics-support-ed product innovation. As such, big data is not solely a profit driver through its efficiency impacts, but can dynamically generate additional revenues by precipitating the creation of new products. Figure 4 illustrates the virtuous cycle linking business efficiency with innovation and new product development.
5 2011 March Budget (HM Treasury 2011) 6 Quality, Innovation, Productivity and Prevention programme (Department of Health 2012) 7 Annual Fraud Indicator 2012 (National Fraud Authority March 2012)
Data equity: Unlocking the value of big data
| 13
Figure 4: Business Efficiency to New Product Development Cycle for Data Analytics
Business efficiency
Profitability
R & D expenditure
Business innovation
Sales growth
New product development
Source: Cebr analysis
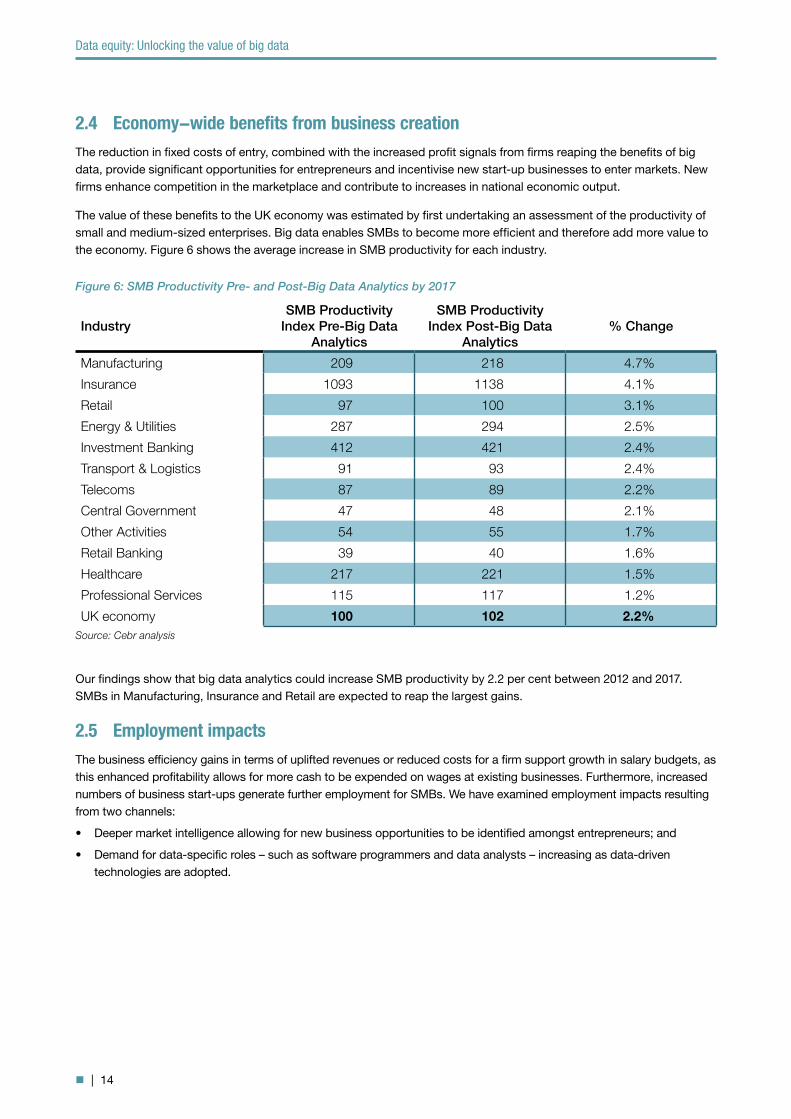
We have assessed the additional funds available for R&D as a result of increased profits at an industry-level. An econo-metric model was devised to determine the relationship between incremental changes in R&D and resultant impacts on output. Due to the differing nature of research and product development among different industries, the output impact of an additional £1 spent on R&D is expected to vary by sector. Figure 5 illustrates the proportion of total gross operat-ing surplus spent on R&D in each industry. R&D expenditure is defined as spending on research and development, and advertising and market research activities.
Industries which already re-invest a higher percentage of their total profits into R&D activities (e.g., Healthcare and government) are likely to receive greater innovation benefits from the use of big data analytics.
Industry % of Gross Operating Surplus spent on R&D
Healthcare 24%
Central Government 23%
Manufacturing 13%
Transport & Logistics 13%
Insurance 12%
Retail 10%
Other Activities 7%
Telecoms 5%
Professional Services 5%
Investment Banking 4%
Retail Banking 4%
Energy & Utilities 2%
UK economy 7%
Figure 5: Percentage of Gross Operating Surplus Spent on R&D Spending
Source: Office for National Statistics
Data equity: Unlocking the value of big data
| 14
2.4 Economy-wide benefits from business creationThe reduction in fixed costs of entry, combined with the increased profit signals from firms reaping the benefits of big data, provide significant opportunities for entrepreneurs and incentivise new start-up businesses to enter markets. New firms enhance competition in the marketplace and contribute to increases in national economic output.
The value of these benefits to the UK economy was estimated by first undertaking an assessment of the productivity of small and medium-sized enterprises. Big data enables SMBs to become more efficient and therefore add more value to the economy. Figure 6 shows the average increase in SMB productivity for each industry.
Our findings show that big data analytics could increase SMB productivity by 2.2 per cent between 2012 and 2017. SMBs in Manufacturing, Insurance and Retail are expected to reap the largest gains.
2.5 Employment impactsThe business efficiency gains in terms of uplifted revenues or reduced costs for a firm support growth in salary budgets, as this enhanced profitability allows for more cash to be expended on wages at existing businesses. Furthermore, increased numbers of business start-ups generate further employment for SMBs. We have examined employment impacts resulting from two channels:
• Deeper market intelligence allowing for new business opportunities to be identified amongst entrepreneurs; and
• Demand for data-specific roles – such as software programmers and data analysts – increasing as data-driven technologies are adopted.
IndustrySMB Productivity
Index Pre-Big Data Analytics
SMB Productivity Index Post-Big Data
Analytics% Change
Manufacturing 209 218 4.7%
Insurance 1093 1138 4.1%
Retail 97 100 3.1%
Energy & Utilities 287 294 2.5%
Investment Banking 412 421 2.4%
Transport & Logistics 91 93 2.4%
Telecoms 87 89 2.2%
Central Government 47 48 2.1%
Other Activities 54 55 1.7%
Retail Banking 39 40 1.6%
Healthcare 217 221 1.5%
Professional Services 115 117 1.2%
UK economy 100 102 2.2%
Figure 6: SMB Productivity Pre- and Post-Big Data Analytics by 2017
Source: Cebr analysis
Data equity: Unlocking the value of big data
| 15
3 Identification and quantification of the benefits of big data to businessThis section delineates our methodology for identifying and quantifying the expected benefits of big data to business through which data equity is generated. As outlined in subsection 1.3 and section 2, this required us to develop an understanding of the benefits of big data at the level of individual business activities and processes. These benefits were modelled in a framework capturing the drivers of economic success for an enterprise, namely exploiting opportunities to increase revenues, reduce costs and inspire new product development. Further, we identified the reduced barriers to entry that result from the operational benefits to SMBs.
3.1 Characteristics of big data, big data analytics and operational benefits for business
Defining Big Data
Most definitions of big data focus on the scale of data stored. The McKinsey Global Institute8 defines big data as:
“datasets whose size is beyond the ability of typical database software tools to capture, store, manage and analyse.”
This goes some way to identifying how big data differs from ordinary datasets. However, data variety and data velocity are equally important attributes of big data. The Data Warehousing Institute (TDWI) defines big data as a mixture of high data volume, data type variety and data feed velocity9.
1. Data volumes
Most businesses define big data in terabytes or petabytes. In this sense, big data can be measured by counting the quantity of records, transactions, Tables or files in a given data set. As the volume of stored data increases, so does the necessary sophistication of technologies or techniques required to analyse or discover insights from it.
2. Data type variety
Big data can be described as data of many formats which is compiled from a great variety of sources. These can include transaction histories, internet records (browsing clickstreams, social media activity, etc), production or supply chain processes and geospatial datasets. More formally, there are three broad categories of data, which further illustrate the varieties present within ‘big’ data:
Structured data: This type describes data which is grouped into a relational scheme (e.g. rows and columns within a standard database). Due to the data’s configuration and consistency, it can be queried simply in order to arrive at use-able information, based on an organisation’s parameters and operational need.
Semi-structured data: Refers to data which may have some relational structure, but which is incomplete or irregular.
Unstructured data: Captures data of all formats which cannot easily be indexed into relational tables for analysis or querying. Examples include text and web pages, social network content and blog posts, images, audio and video.
3. Data feed velocity
The velocity of data in terms of the frequency of its generation and delivery is also a facet of big data. Data generated by automated production or transaction processes, internet browsers, or audio and video captured through smart phones and sensors mean that businesses must compute many rapid streams of constantly-updating information.
Defining Big Data Analytics
Big data analytics describe software solutions which are designed to handle the attributes of big data. These high-performance tools may include data mining, advanced analytics, data visualisation and in-database analytics. Currently around 34 per cent of businesses perform analytics on big data whilst 40 per cent practice some form of advanced analytics on regular data which does not fit the ‘big data’ description10.
8 Big Data: The Next Frontier for Innovation, Competition and Productivity (McKinsey Global Institute, June 2011)9 Big Data Analytics (TDWI Research, Q4 2011)10 Big Data Analytics (TDWI Research, Q4 2011)

Data equity: Unlocking the value of big data
| 16
Figure 7 provides a selection of tools and techniques which have been identified as having high growth potential by tech-nology experts within the big data field. This is defined as the percentage increase of businesses that anticipate adopting the following tools within the next three years.
Descriptions of some high-performance tools and techniques used in big data analytics are provided below:
Advanced data visualisation – This tool typically provides a point-and-click interface by which analysis can be enhanced through interactive statistical graphics. This enables faster analysis, better decision-making and more effec-tive presentation and comprehension of results.
In-memory database analytics – This technique provides scalable in-memory access to data, rather than traditional disk-based processing which can be unwieldy when data sets are very large or complex. This enables fast and efficient support for business intelligence functions, such as real-time dashboards and KPIs.
High-Performance Analytics
High-Performance Analytics is a technology solution used by businesses who need to solve complex problems requiring analysis of big data at a detailed level. The technology is specifically designed to deal with high volume, variety and velocity data.
High-Performance Analytics is optimised to deliver results in real-time using in-memory analytics processing. This means that data is stored locally in a database and is accessed in-memory using parallel computing power. This therefore enables complex jobs that routinely take hours or days to be done in seconds or minutes.
Industry Impacts
Investment Banking – risk portfolios can be recalculated at very high speeds, accounting for movements in interest rates, exchange rates and counter-party risks in real-time. Risk exposure, portfolio VAR and liquidity coverage can be determined in minutes.
Retail Banking – customer relationship dynamic pricing allows assessment of bank products and services purchased with associated profitability. Banks can determine their level of credit exposure in their consumer-lending portfolio. According to research by SAS, one financial institution has been able to calculate the profitability of a loan default in 84 seconds versus 167 hours.
Retail – alternate pricing scenarios can be run instantly, enabling inventories to be reduced and driving increases in profit margins. Analysis of vast numbers of consumer segments can be used to decide what merchandise needs to be replenished.
Telecommunications – High-Performance Analytics allows real-time monitoring of network demand and forecasting of bandwidth in response to customer behaviour.
Government – revenue impacts of changes in tax policy and budget decisions can be understood quickly and with accuracy. The effect of tax simplification and code adjustments can be modelled efficiently. Identification of tax and benefits fraud can be improved through analysis of structured and unstructured data.
Big Data Analytics Tools & Techniques Potential Growth (%)
Advanced data visualisation 27%
In-memory database 17%
Real-time reports and dashboards 16%
Text mining 16%
Advanced analytics 16%
Visual discovery 15%
Predictive analytics 14%
Figure 7: Potential Growth in Big Data Analytics Tools and Techniques
Source: TDWI
Data equity: Unlocking the value of big data
| 17
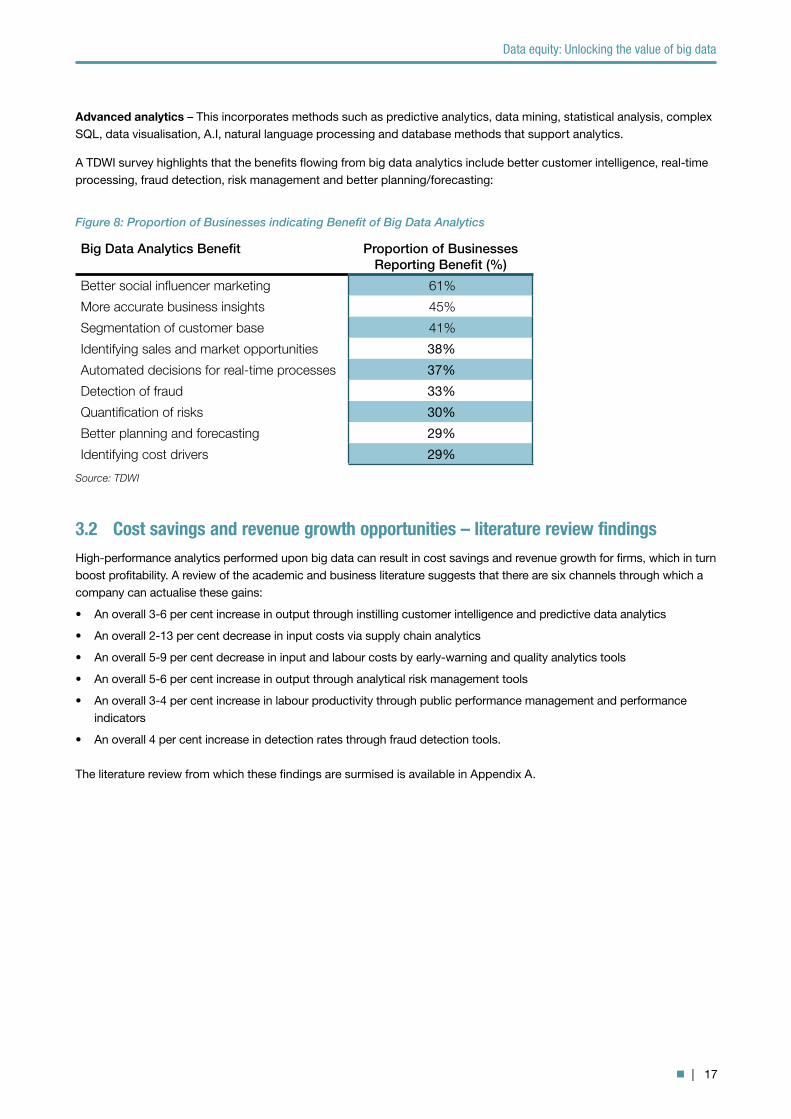
Advanced analytics – This incorporates methods such as predictive analytics, data mining, statistical analysis, complex SQL, data visualisation, A.I, natural language processing and database methods that support analytics.
A TDWI survey highlights that the benefits flowing from big data analytics include better customer intelligence, real-time processing, fraud detection, risk management and better planning/forecasting:
3.2 Cost savings and revenue growth opportunities – literature review findingsHigh-performance analytics performed upon big data can result in cost savings and revenue growth for firms, which in turn boost profitability. A review of the academic and business literature suggests that there are six channels through which a company can actualise these gains:
• An overall 3-6 per cent increase in output through instilling customer intelligence and predictive data analytics
• An overall 2-13 per cent decrease in input costs via supply chain analytics
• An overall 5-9 per cent decrease in input and labour costs by early-warning and quality analytics tools
• An overall 5-6 per cent increase in output through analytical risk management tools
• An overall 3-4 per cent increase in labour productivity through public performance management and performance indicators
• An overall 4 per cent increase in detection rates through fraud detection tools.
The literature review from which these findings are surmised is available in Appendix A.
Big Data Analytics Benefit Proportion of Businesses Reporting Benefit (%)
Better social influencer marketing 61%
More accurate business insights 45%
Segmentation of customer base 41%
Identifying sales and market opportunities 38%
Automated decisions for real-time processes 37%
Detection of fraud 33%
Quantification of risks 30%
Better planning and forecasting 29%
Identifying cost drivers 29%
Figure 8: Proportion of Businesses indicating Benefit of Big Data Analytics
Source: TDWI
Data equity: Unlocking the value of big data
| 18
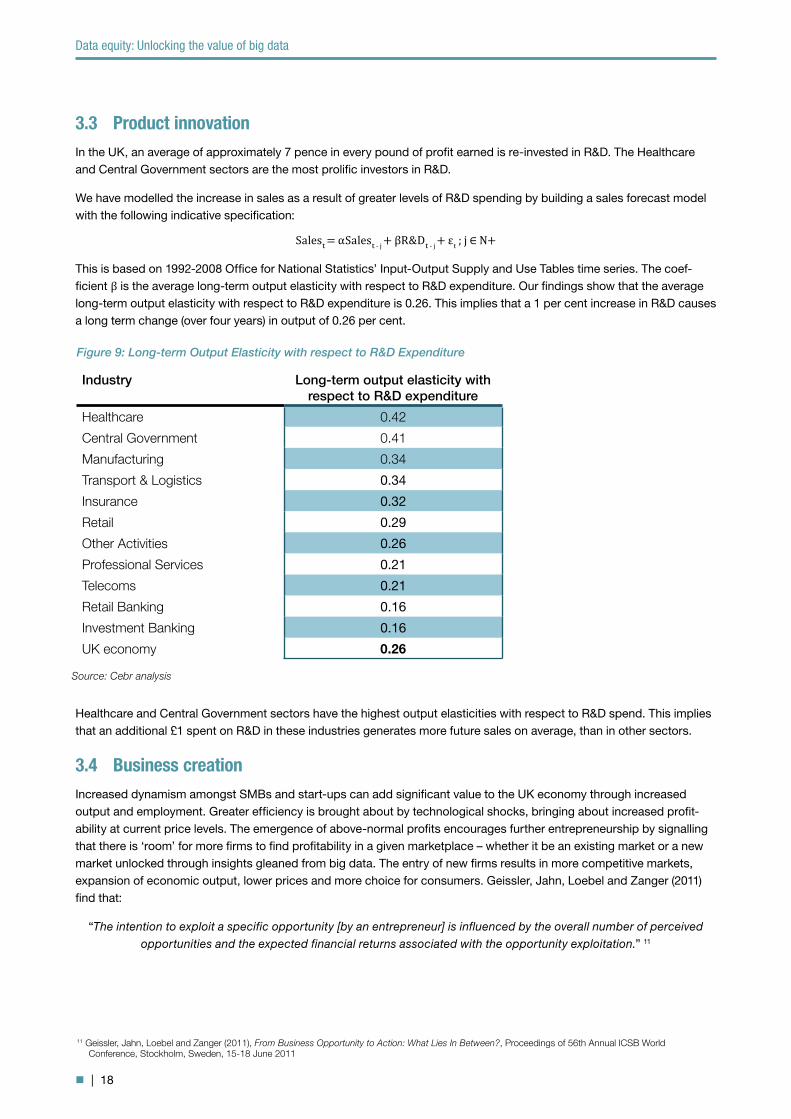
3.3 Product innovationIn the UK, an average of approximately 7 pence in every pound of profit earned is re-invested in R&D. The Healthcare and Central Government sectors are the most prolific investors in R&D.
We have modelled the increase in sales as a result of greater levels of R&D spending by building a sales forecast model with the following indicative specification:
Sales� = αSales� - j + βR&D� - j + εt ; j ∈ N+
This is based on 1992-2008 Office for National Statistics’ Input-Output Supply and Use Tables time series. The coef-ficient β is the average long-term output elasticity with respect to R&D expenditure. Our findings show that the average long-term output elasticity with respect to R&D expenditure is 0.26. This implies that a 1 per cent increase in R&D causes a long term change (over four years) in output of 0.26 per cent.
Healthcare and Central Government sectors have the highest output elasticities with respect to R&D spend. This implies that an additional £1 spent on R&D in these industries generates more future sales on average, than in other sectors.
3.4 Business creation Increased dynamism amongst SMBs and start-ups can add significant value to the UK economy through increased output and employment. Greater efficiency is brought about by technological shocks, bringing about increased profit-ability at current price levels. The emergence of above-normal profits encourages further entrepreneurship by signalling that there is ‘room’ for more firms to find profitability in a given marketplace – whether it be an existing market or a new market unlocked through insights gleaned from big data. The entry of new firms results in more competitive markets, expansion of economic output, lower prices and more choice for consumers. Geissler, Jahn, Loebel and Zanger (2011) find that:
“The intention to exploit a specific opportunity [by an entrepreneur] is influenced by the overall number of perceived opportunities and the expected financial returns associated with the opportunity exploitation.” 11
Industry Long-term output elasticity with respect to R&D expenditure
Healthcare 0.42
Central Government 0.41
Manufacturing 0.34
Transport & Logistics 0.34
Insurance 0.32
Retail 0.29
Other Activities 0.26
Professional Services 0.21
Telecoms 0.21
Retail Banking 0.16
Investment Banking 0.16
UK economy 0.26
Figure 9: Long-term Output Elasticity with respect to R&D Expenditure
Source: Cebr analysis
11 Geissler, Jahn, Loebel and Zanger (2011), From Business Opportunity to Action: What Lies In Between?, Proceedings of 56th Annual ICSB World Conference, Stockholm, Sweden, 15-18 June 2011
Data equity: Unlocking the value of big data
| 19
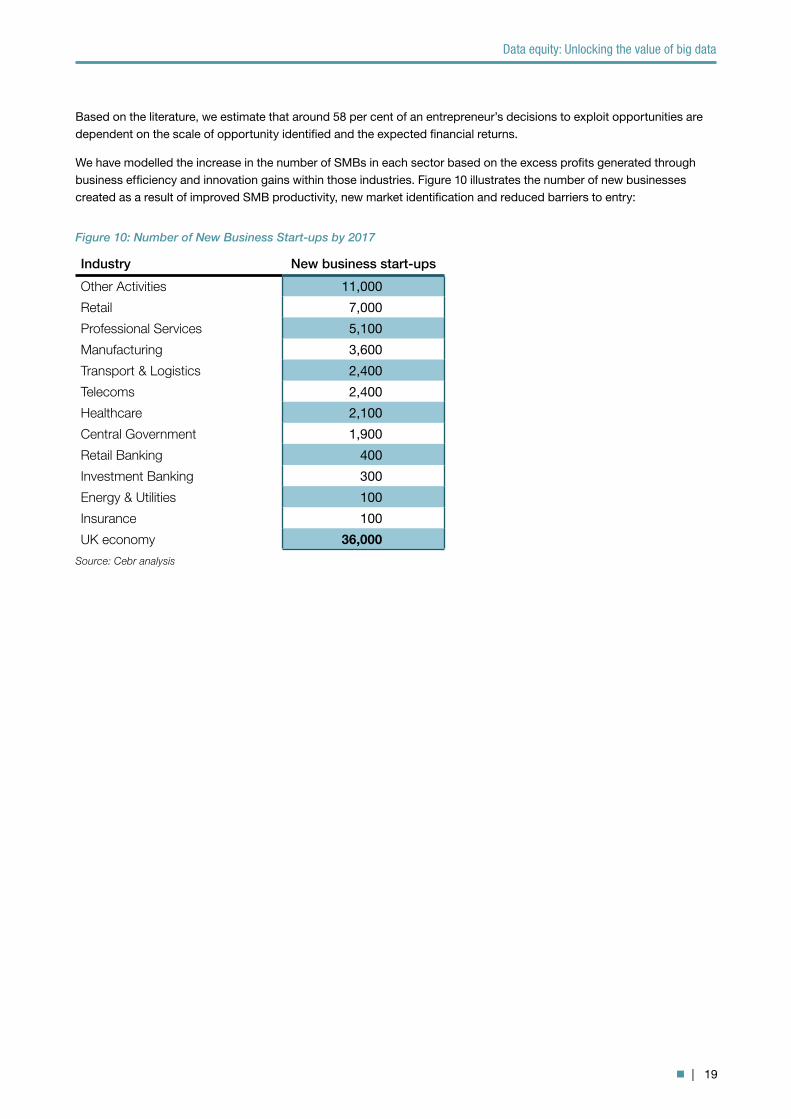
Industry New business start-ups
Other Activities 11,000
Retail 7,000
Professional Services 5,100
Manufacturing 3,600
Transport & Logistics 2,400
Telecoms 2,400
Healthcare 2,100
Central Government 1,900
Retail Banking 400
Investment Banking 300
Energy & Utilities 100
Insurance 100
UK economy 36,000
Figure 10: Number of New Business Start-ups by 2017
Source: Cebr analysis
Based on the literature, we estimate that around 58 per cent of an entrepreneur’s decisions to exploit opportunities are dependent on the scale of opportunity identified and the expected financial returns.
We have modelled the increase in the number of SMBs in each sector based on the excess profits generated through business efficiency and innovation gains within those industries. Figure 10 illustrates the number of new businesses created as a result of improved SMB productivity, new market identification and reduced barriers to entry:
Data equity: Unlocking the value of big data
| 20
4 Current and prospective big data analytics rates of adoptionThis section reviews the current patterns of big data analytics adoption and considers how adoption patterns are likely to evolve over the next five years. We developed baseline assumptions for adoption, pinpointing the factors which could lead to greater than expected growth in adoption and the factors which could inhibit such growth. These assumptions are sourced from experts’ views articulated in analyst reports, industry white papers and academic studies.
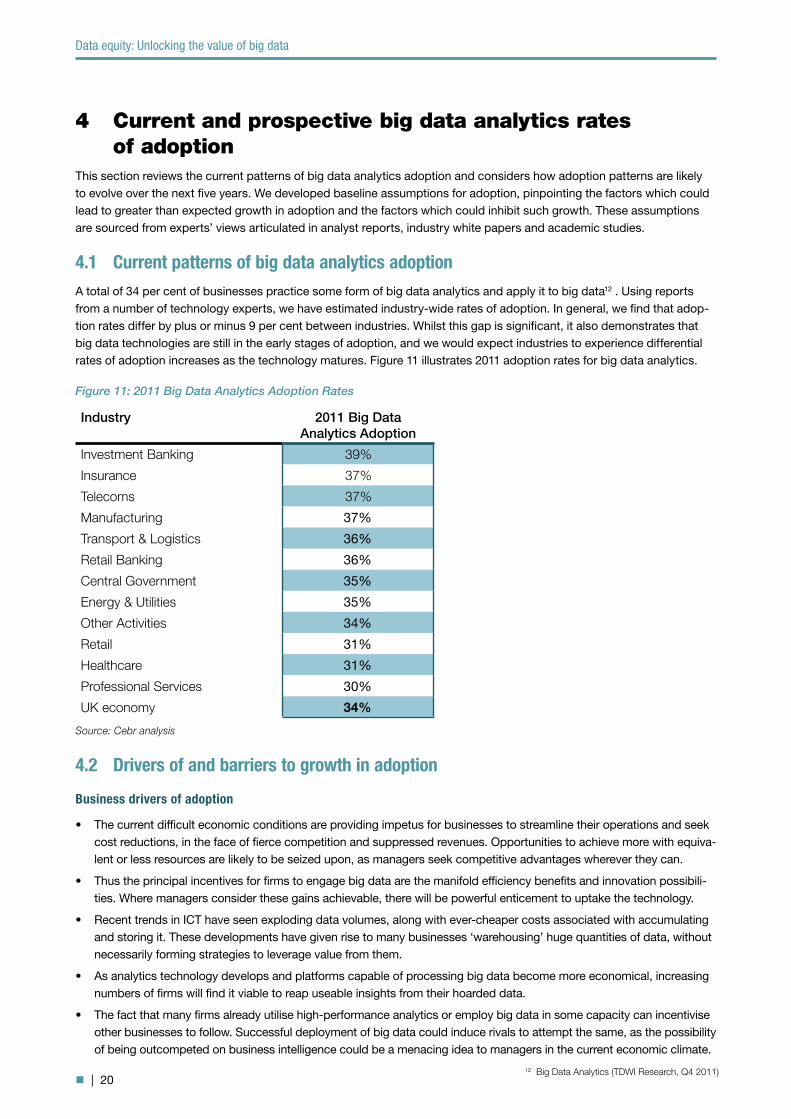
4.1 Current patterns of big data analytics adoptionA total of 34 per cent of businesses practice some form of big data analytics and apply it to big data12 . Using reports from a number of technology experts, we have estimated industry-wide rates of adoption. In general, we find that adop-tion rates differ by plus or minus 9 per cent between industries. Whilst this gap is significant, it also demonstrates that big data technologies are still in the early stages of adoption, and we would expect industries to experience differential rates of adoption increases as the technology matures. Figure 11 illustrates 2011 adoption rates for big data analytics.
4.2 Drivers of and barriers to growth in adoption
Business drivers of adoption
• The current difficult economic conditions are providing impetus for businesses to streamline their operations and seek cost reductions, in the face of fierce competition and suppressed revenues. Opportunities to achieve more with equiva-lent or less resources are likely to be seized upon, as managers seek competitive advantages wherever they can.
• Thus the principal incentives for firms to engage big data are the manifold efficiency benefits and innovation possibili-ties. Where managers consider these gains achievable, there will be powerful enticement to uptake the technology.
• Recent trends in ICT have seen exploding data volumes, along with ever-cheaper costs associated with accumulating and storing it. These developments have given rise to many businesses ‘warehousing’ huge quantities of data, without necessarily forming strategies to leverage value from them.
• As analytics technology develops and platforms capable of processing big data become more economical, increasing numbers of firms will find it viable to reap useable insights from their hoarded data.
• The fact that many firms already utilise high-performance analytics or employ big data in some capacity can incentivise other businesses to follow. Successful deployment of big data could induce rivals to attempt the same, as the possibility of being outcompeted on business intelligence could be a menacing idea to managers in the current economic climate.
Industry 2011 Big Data Analytics Adoption
Investment Banking 39%
Insurance 37%
Telecoms 37%
Manufacturing 37%
Transport & Logistics 36%
Retail Banking 36%
Central Government 35%
Energy & Utilities 35%
Other Activities 34%
Retail 31%
Healthcare 31%
Professional Services 30%
UK economy 34%
Figure 11: 2011 Big Data Analytics Adoption Rates
Source: Cebr analysis
12 Big Data Analytics (TDWI Research, Q4 2011)
Data equity: Unlocking the value of big data
| 21
Business barriers to growth of adoption
• A major obstacle to undertaking big data analytics is the level of technical skill required to optimally operate such systems. Although software solutions for tackling big data continue to become more user-friendly, they have not yet reached the stage where no specialist knowledge is necessary. The requisite skills for big data analysis are above those required for traditional data mining, and the cost of hiring big data specialists can be prohibitive for many firms.
• The infrastructure needed for processing and returning big data queries is not equivalent to that required for ordi-nary data storage and querying. Optimising hardware for dynamic and complex big data can be a difficult and costly process.
• As data volumes rise, so does the cost associated with securing the data against virtual or physical threats. Since the stored ‘data equity’ represents value to a business, measures to protect this source of value need to be carefully imple-mented. Compliance with data protection regulations will also need to be diligently ensured.
• Hence some businesses may simply consider the investment too costly, with squeezed budgets forcing them to abstain in the near-term. Though as processing power continues to become cheaper and many diverse solutions to tackle big data are developed, the costs of implementing big data analytics are expected to fall. Further, as benefits take hold in other firms, the anticipated rate of return on the ICT investment will rise.
4.3 Measuring growth potential for big data analytics adoption across industriesIn order to model the prospective adoption rates across the economy, Cebr classified the examined industry groups along five metrics: data intensity, earnings volatility, product differentiation, supply chain complexity, and IT intensity. By establishing each industry’s relative ‘score’ within these five metrics, we estimate the potential gains available through the implementation of big data analytics.
Data Intensity
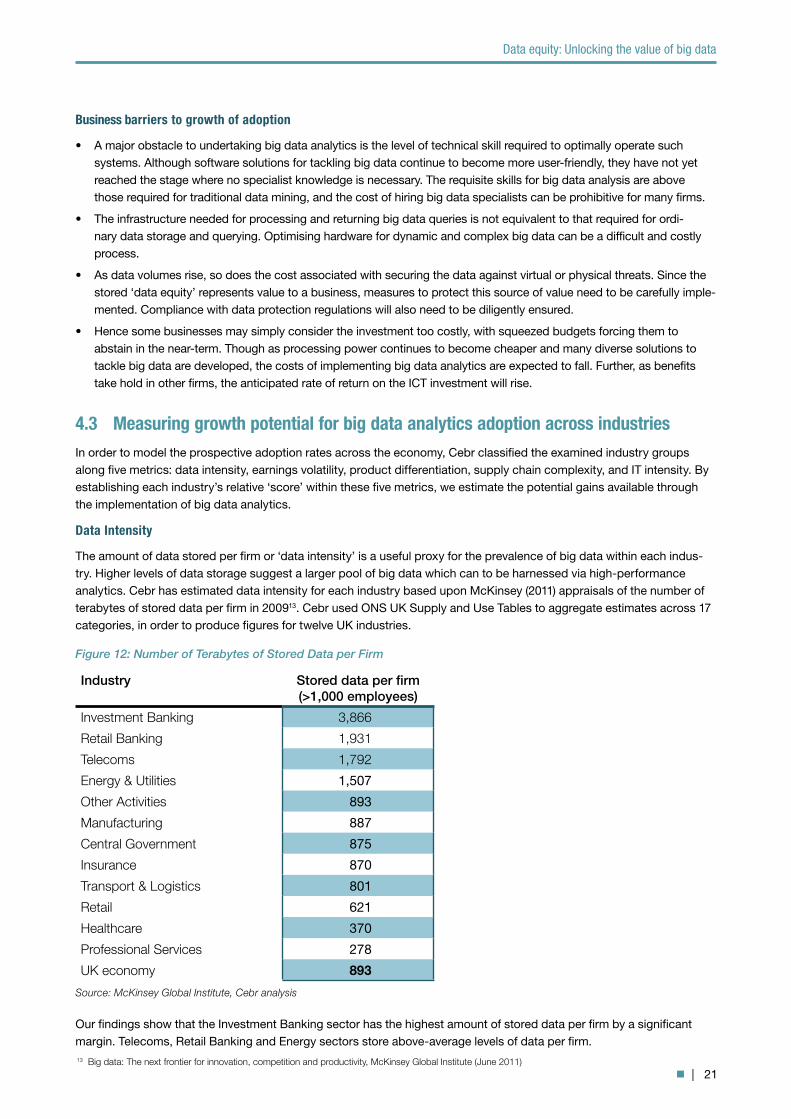
The amount of data stored per firm or ‘data intensity’ is a useful proxy for the prevalence of big data within each indus-try. Higher levels of data storage suggest a larger pool of big data which can to be harnessed via high-performance analytics. Cebr has estimated data intensity for each industry based upon McKinsey (2011) appraisals of the number of terabytes of stored data per firm in 200913. Cebr used ONS UK Supply and Use Tables to aggregate estimates across 17 categories, in order to produce figures for twelve UK industries.
Our findings show that the Investment Banking sector has the highest amount of stored data per firm by a significant margin. Telecoms, Retail Banking and Energy sectors store above-average levels of data per firm.
Industry Stored data per firm (>1,000 employees)
Investment Banking 3,866
Retail Banking 1,931
Telecoms 1,792
Energy & Utilities 1,507
Other Activities 893
Manufacturing 887
Central Government 875
Insurance 870
Transport & Logistics 801
Retail 621
Healthcare 370
Professional Services 278
UK economy 893
Figure 12: Number of Terabytes of Stored Data per Firm
Source: McKinsey Global Institute, Cebr analysis
13 Big data: The next frontier for innovation, competition and productivity, McKinsey Global Institute (June 2011)
Data equity: Unlocking the value of big data
| 22
Earnings Volatility
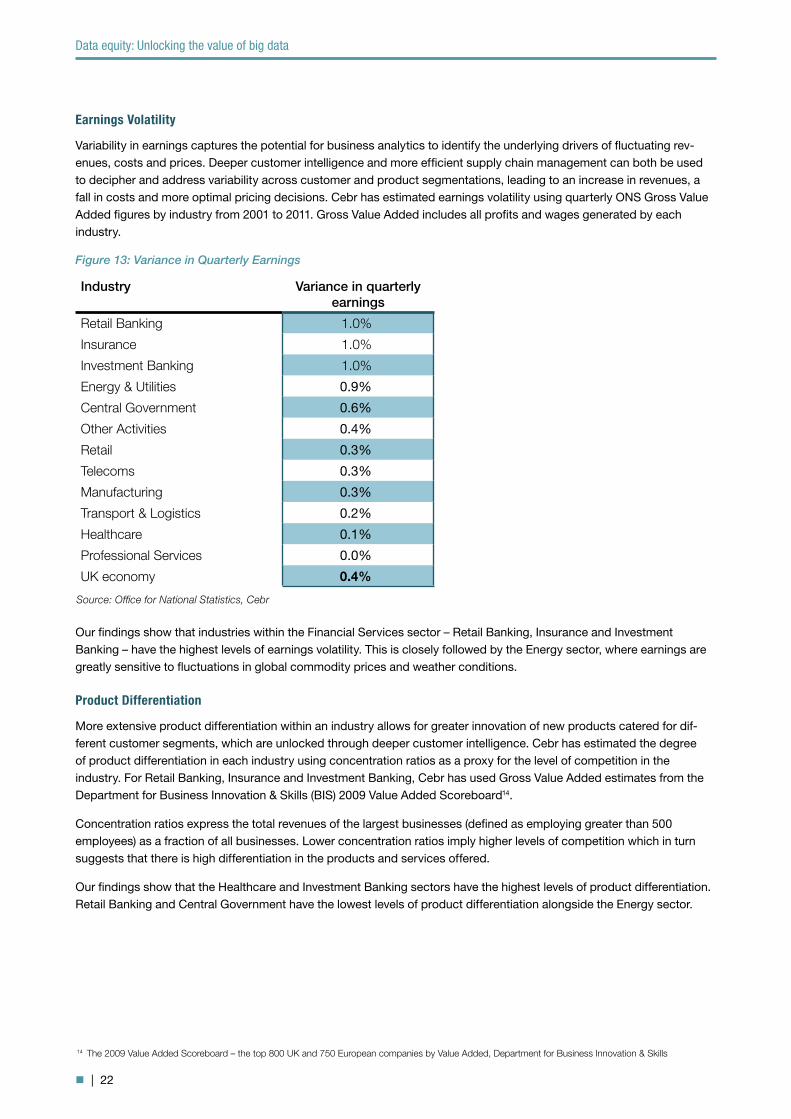
Variability in earnings captures the potential for business analytics to identify the underlying drivers of fluctuating rev-enues, costs and prices. Deeper customer intelligence and more efficient supply chain management can both be used to decipher and address variability across customer and product segmentations, leading to an increase in revenues, a fall in costs and more optimal pricing decisions. Cebr has estimated earnings volatility using quarterly ONS Gross Value Added figures by industry from 2001 to 2011. Gross Value Added includes all profits and wages generated by each industry.
Our findings show that industries within the Financial Services sector – Retail Banking, Insurance and Investment Banking – have the highest levels of earnings volatility. This is closely followed by the Energy sector, where earnings are greatly sensitive to fluctuations in global commodity prices and weather conditions.
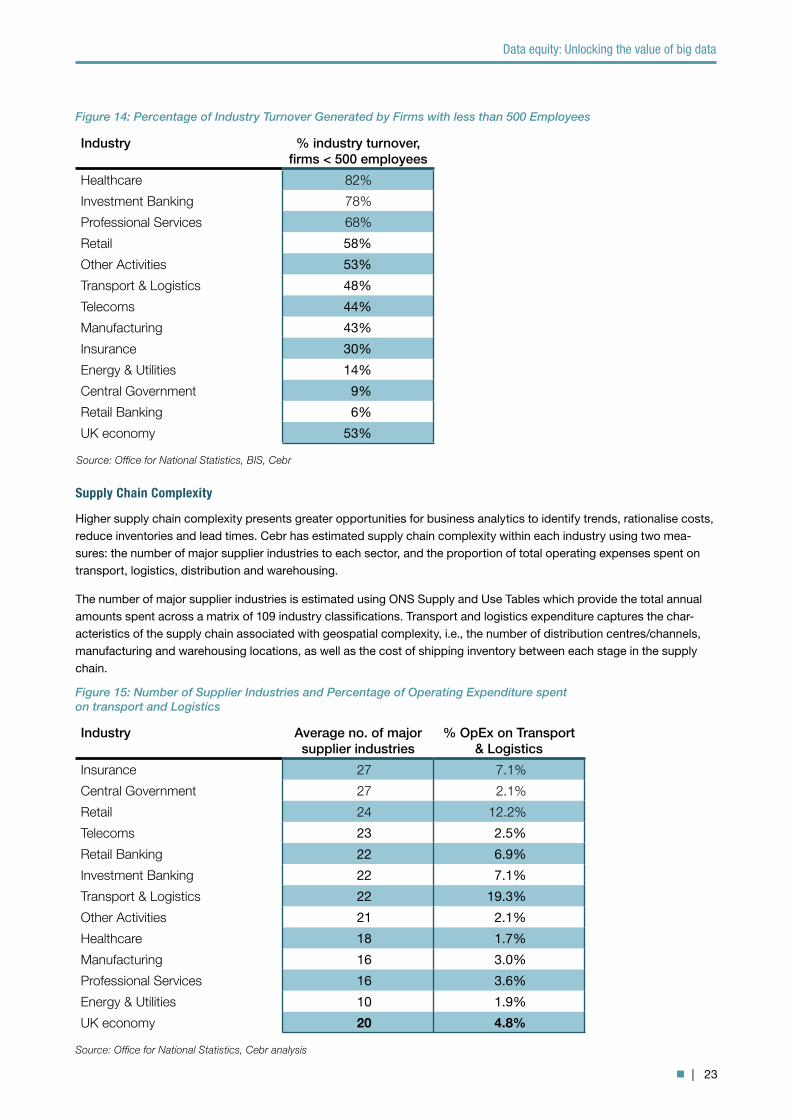
Product Differentiation
More extensive product differentiation within an industry allows for greater innovation of new products catered for dif-ferent customer segments, which are unlocked through deeper customer intelligence. Cebr has estimated the degree of product differentiation in each industry using concentration ratios as a proxy for the level of competition in the industry. For Retail Banking, Insurance and Investment Banking, Cebr has used Gross Value Added estimates from the Department for Business Innovation & Skills (BIS) 2009 Value Added Scoreboard14.
Concentration ratios express the total revenues of the largest businesses (defined as employing greater than 500 employees) as a fraction of all businesses. Lower concentration ratios imply higher levels of competition which in turn suggests that there is high differentiation in the products and services offered.
Our findings show that the Healthcare and Investment Banking sectors have the highest levels of product differentiation. Retail Banking and Central Government have the lowest levels of product differentiation alongside the Energy sector.
14 The 2009 Value Added Scoreboard – the top 800 UK and 750 European companies by Value Added, Department for Business Innovation & Skills
Industry Variance in quarterly earnings
Retail Banking 1.0%
Insurance 1.0%
Investment Banking 1.0%
Energy & Utilities 0.9%
Central Government 0.6%
Other Activities 0.4%
Retail 0.3%
Telecoms 0.3%
Manufacturing 0.3%
Transport & Logistics 0.2%
Healthcare 0.1%
Professional Services 0.0%
UK economy 0.4%
Figure 13: Variance in Quarterly Earnings
Source: Office for National Statistics, Cebr
Data equity: Unlocking the value of big data
| 23
Industry % industry turnover, firms < 500 employees
Healthcare 82%
Investment Banking 78%
Professional Services 68%
Retail 58%
Other Activities 53%
Transport & Logistics 48%
Telecoms 44%
Manufacturing 43%
Insurance 30%
Energy & Utilities 14%
Central Government 9%
Retail Banking 6%
UK economy 53%
Figure 14: Percentage of Industry Turnover Generated by Firms with less than 500 Employees
Source: Office for National Statistics, BIS, Cebr
Supply Chain Complexity
Higher supply chain complexity presents greater opportunities for business analytics to identify trends, rationalise costs, reduce inventories and lead times. Cebr has estimated supply chain complexity within each industry using two mea-sures: the number of major supplier industries to each sector, and the proportion of total operating expenses spent on transport, logistics, distribution and warehousing.
The number of major supplier industries is estimated using ONS Supply and Use Tables which provide the total annual amounts spent across a matrix of 109 industry classifications. Transport and logistics expenditure captures the char-acteristics of the supply chain associated with geospatial complexity, i.e., the number of distribution centres/channels, manufacturing and warehousing locations, as well as the cost of shipping inventory between each stage in the supply chain.
Industry Average no. of major supplier industries
% OpEx on Transport & Logistics
Insurance 27 7.1%
Central Government 27 2.1%
Retail 24 12.2%
Telecoms 23 2.5%
Retail Banking 22 6.9%
Investment Banking 22 7.1%
Transport & Logistics 22 19.3%
Other Activities 21 2.1%
Healthcare 18 1.7%
Manufacturing 16 3.0%
Professional Services 16 3.6%
Energy & Utilities 10 1.9%
UK economy 20 4.8%
Figure 15: Number of Supplier Industries and Percentage of Operating Expenditure spent on transport and Logistics
Source: Office for National Statistics, Cebr analysis
Data equity: Unlocking the value of big data
| 24
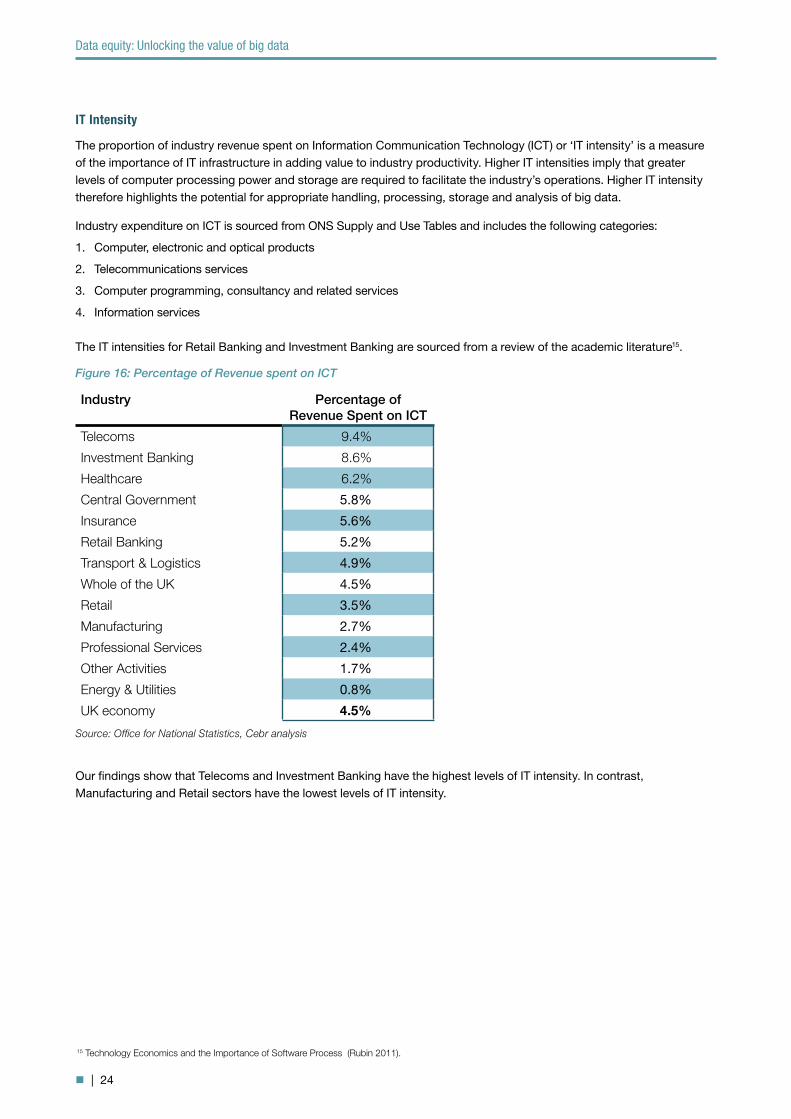
IT Intensity
The proportion of industry revenue spent on Information Communication Technology (ICT) or ‘IT intensity’ is a measure of the importance of IT infrastructure in adding value to industry productivity. Higher IT intensities imply that greater levels of computer processing power and storage are required to facilitate the industry’s operations. Higher IT intensity therefore highlights the potential for appropriate handling, processing, storage and analysis of big data.
Industry expenditure on ICT is sourced from ONS Supply and Use Tables and includes the following categories:
1. Computer, electronic and optical products
2. Telecommunications services
3. Computer programming, consultancy and related services
4. Information services
The IT intensities for Retail Banking and Investment Banking are sourced from a review of the academic literature15.
Our findings show that Telecoms and Investment Banking have the highest levels of IT intensity. In contrast, Manufacturing and Retail sectors have the lowest levels of IT intensity.
15 Technology Economics and the Importance of Software Process (Rubin 2011).
Industry Percentage of Revenue Spent on ICT
Telecoms 9.4%
Investment Banking 8.6%
Healthcare 6.2%
Central Government 5.8%
Insurance 5.6%
Retail Banking 5.2%
Transport & Logistics 4.9%
Whole of the UK 4.5%
Retail 3.5%
Manufacturing 2.7%
Professional Services 2.4%
Other Activities 1.7%
Energy & Utilities 0.8%
UK economy 4.5%
Figure 16: Percentage of Revenue spent on ICT
Source: Office for National Statistics, Cebr analysis
Data equity: Unlocking the value of big data
| 25
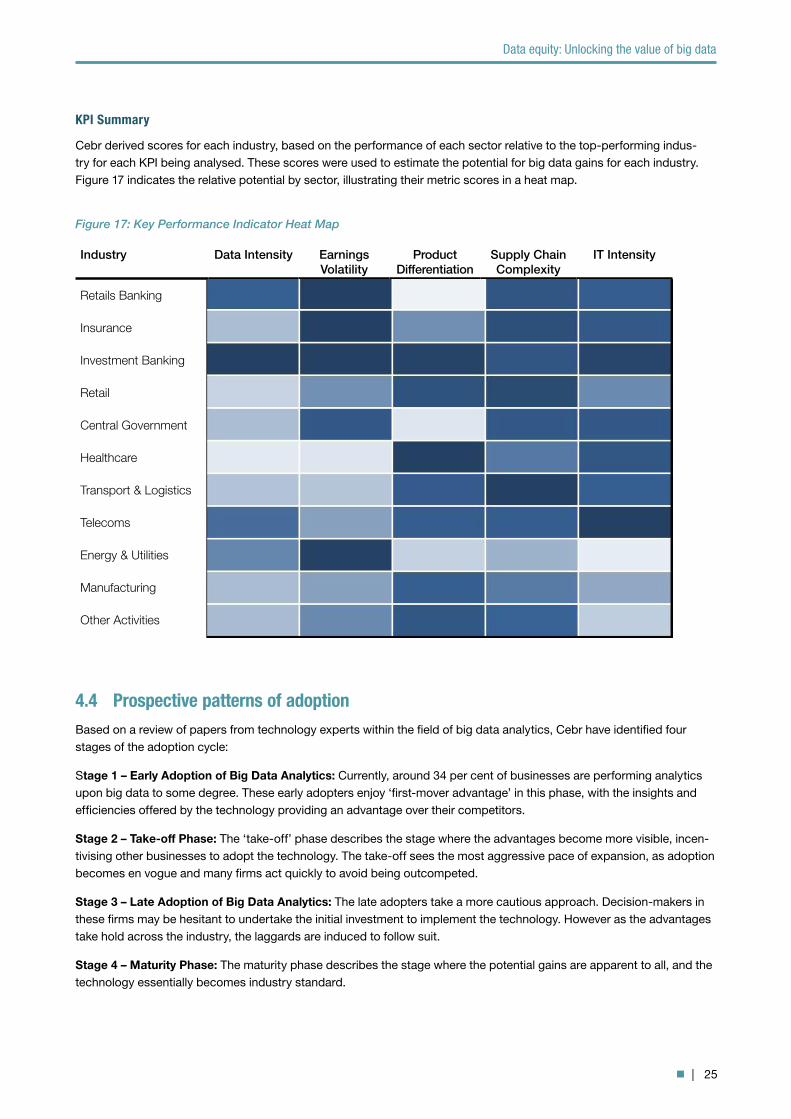
KPI Summary
Cebr derived scores for each industry, based on the performance of each sector relative to the top-performing indus-try for each KPI being analysed. These scores were used to estimate the potential for big data gains for each industry. Figure 17 indicates the relative potential by sector, illustrating their metric scores in a heat map.
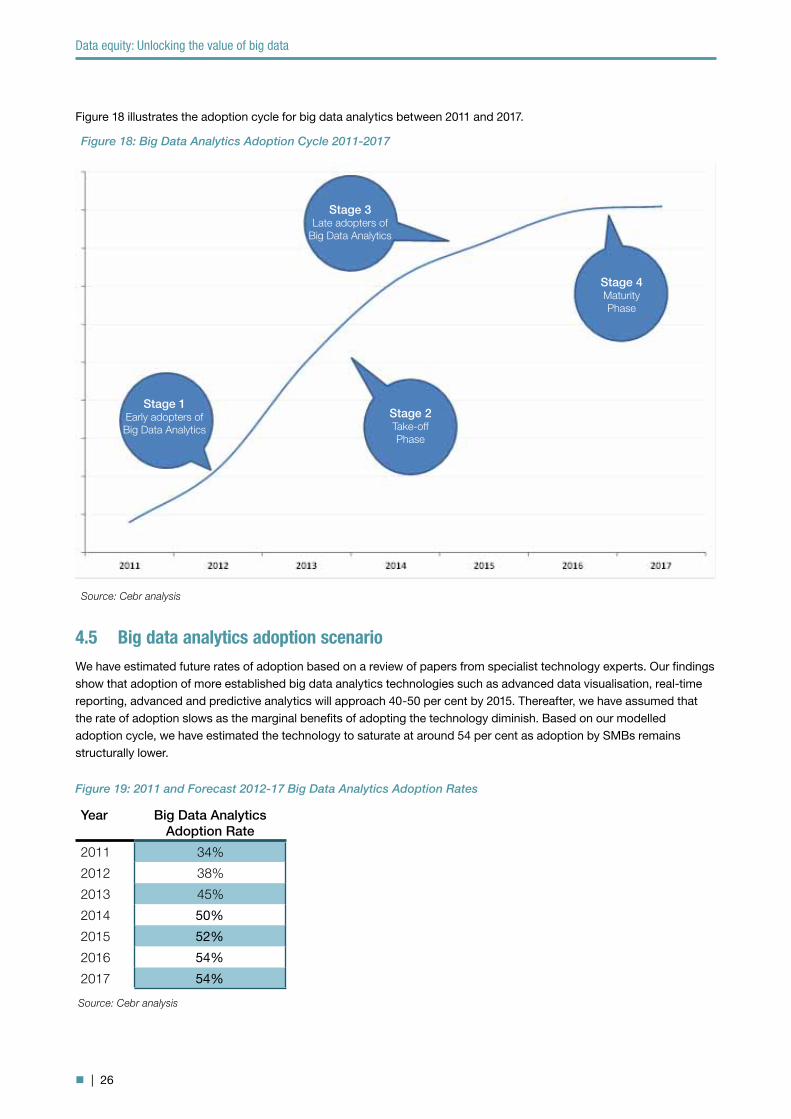
4.4 Prospective patterns of adoptionBased on a review of papers from technology experts within the field of big data analytics, Cebr have identified four stages of the adoption cycle:
Stage 1 – Early Adoption of Big Data Analytics: Currently, around 34 per cent of businesses are performing analytics upon big data to some degree. These early adopters enjoy ‘first-mover advantage’ in this phase, with the insights and efficiencies offered by the technology providing an advantage over their competitors.
Stage 2 – Take-off Phase: The ‘take-off’ phase describes the stage where the advantages become more visible, incen-tivising other businesses to adopt the technology. The take-off sees the most aggressive pace of expansion, as adoption becomes en vogue and many firms act quickly to avoid being outcompeted.
Stage 3 – Late Adoption of Big Data Analytics: The late adopters take a more cautious approach. Decision-makers in these firms may be hesitant to undertake the initial investment to implement the technology. However as the advantages take hold across the industry, the laggards are induced to follow suit.
Stage 4 – Maturity Phase: The maturity phase describes the stage where the potential gains are apparent to all, and the technology essentially becomes industry standard.
Figure 17: Key Performance Indicator Heat Map
Industry Data Intensity Earnings Volatility
Product Differentiation
Supply Chain Complexity
IT Intensity
Retails Banking
Insurance
Investment Banking
Retail
Central Government
Healthcare
Transport & Logistics
Telecoms
Energy & Utilities
Manufacturing
Other Activities
Data equity: Unlocking the value of big data
| 26
Figure 18 illustrates the adoption cycle for big data analytics between 2011 and 2017.
4.5 Big data analytics adoption scenarioWe have estimated future rates of adoption based on a review of papers from specialist technology experts. Our findings show that adoption of more established big data analytics technologies such as advanced data visualisation, real-time reporting, advanced and predictive analytics will approach 40-50 per cent by 2015. Thereafter, we have assumed that the rate of adoption slows as the marginal benefits of adopting the technology diminish. Based on our modelled adoption cycle, we have estimated the technology to saturate at around 54 per cent as adoption by SMBs remains structurally lower.
Stage 3Late adopters of
Big Data Analytics
Stage 1Early adopters of Big Data Analytics
Stage 2Take-off Phase
Stage 4Maturity Phase
Figure 18: Big Data Analytics Adoption Cycle 2011-2017
Source: Cebr analysis
Year Big Data Analytics Adoption Rate
2011 34%
2012 38%
2013 45%
2014 50%
2015 52%
2016 54%
2017 54%
Figure 19: 2011 and Forecast 2012-17 Big Data Analytics Adoption Rates
Source: Cebr analysis

Data equity: Unlocking the value of big data
| 27
Based on our analysis of the ‘potentiality’ for each industry to adopt big data technologies (see section 4.3), we have estimated industry-specific adoption rates. Adoption rates are expected to widen between industries to plus or minus 19 per cent by 2017 from 9 per cent in 2011. We expect the Financial Services and telecommunication sectors to have the highest rates of adoption by 2017, as these industries are extremely data-intensive and have a higher level of IT spend compared to total turnover. Figure 20 shows current and future rates of big data analytics adoption by industry.
Figure 20: 2011 and Forecast 2017 Big Data Analytics Adoption Rates
Data equity: Unlocking the value of big data
| 28
5 The value of data equity by industry
5.1 Macroeconomic contextThere has been a trend of better-than-expected news for the UK economy in recent months, with leading indicators for the Manufacturing and Services sectors suggesting modest expansion in 2012. Compared with the Chancellor’s Autumn Statement, which was made at a time of widespread fears of financial meltdown in the Eurozone, the March 2012 Budget was unveiled in a much less gloomy economic environment. Tentative signs are emerging that monetary easing through-out the developed world is having a positive effect on the short-term economic outlook and that, for the UK at least; a recession this year will probably be avoided.
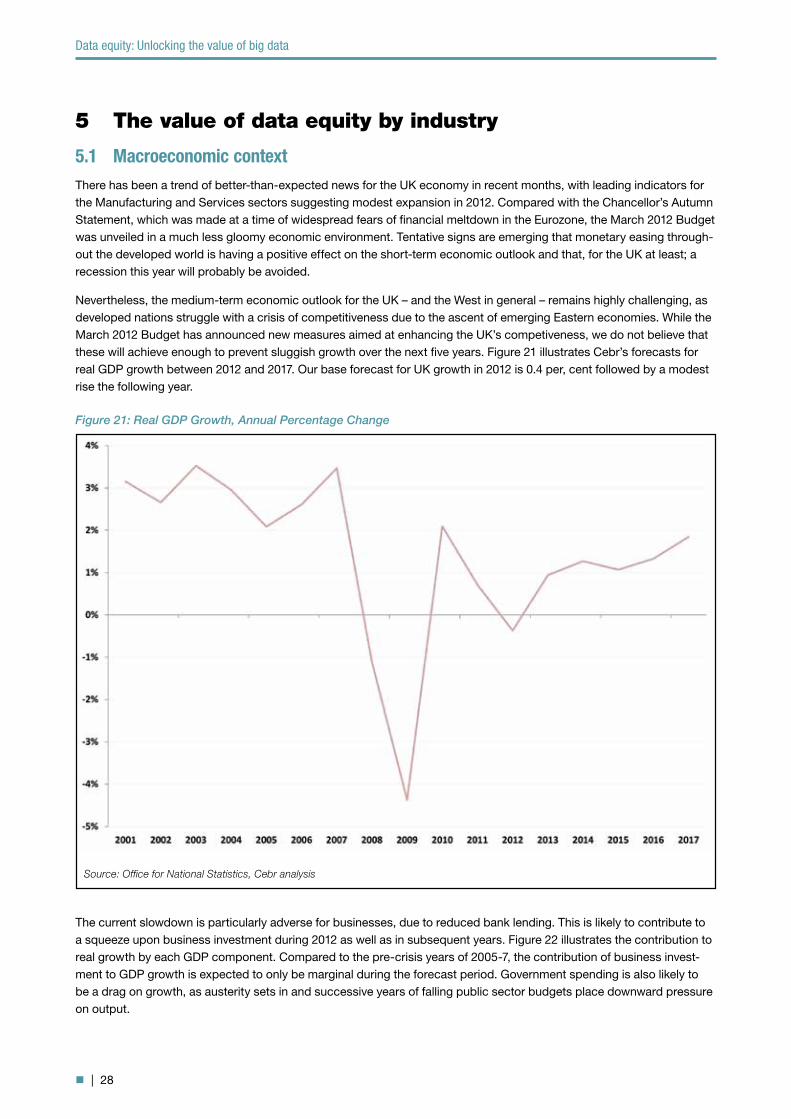
Nevertheless, the medium-term economic outlook for the UK – and the West in general – remains highly challenging, as developed nations struggle with a crisis of competitiveness due to the ascent of emerging Eastern economies. While the March 2012 Budget has announced new measures aimed at enhancing the UK’s competiveness, we do not believe that these will achieve enough to prevent sluggish growth over the next five years. Figure 21 illustrates Cebr’s forecasts for real GDP growth between 2012 and 2017. Our base forecast for UK growth in 2012 is 0.4 per, cent followed by a modest rise the following year.
The current slowdown is particularly adverse for businesses, due to reduced bank lending. This is likely to contribute to a squeeze upon business investment during 2012 as well as in subsequent years. Figure 22 illustrates the contribution to real growth by each GDP component. Compared to the pre-crisis years of 2005-7, the contribution of business invest-ment to GDP growth is expected to only be marginal during the forecast period. Government spending is also likely to be a drag on growth, as austerity sets in and successive years of falling public sector budgets place downward pressure on output.
Source: Office for National Statistics, Cebr analysis
Figure 21: Real GDP Growth, Annual Percentage Change
Data equity: Unlocking the value of big data
| 29
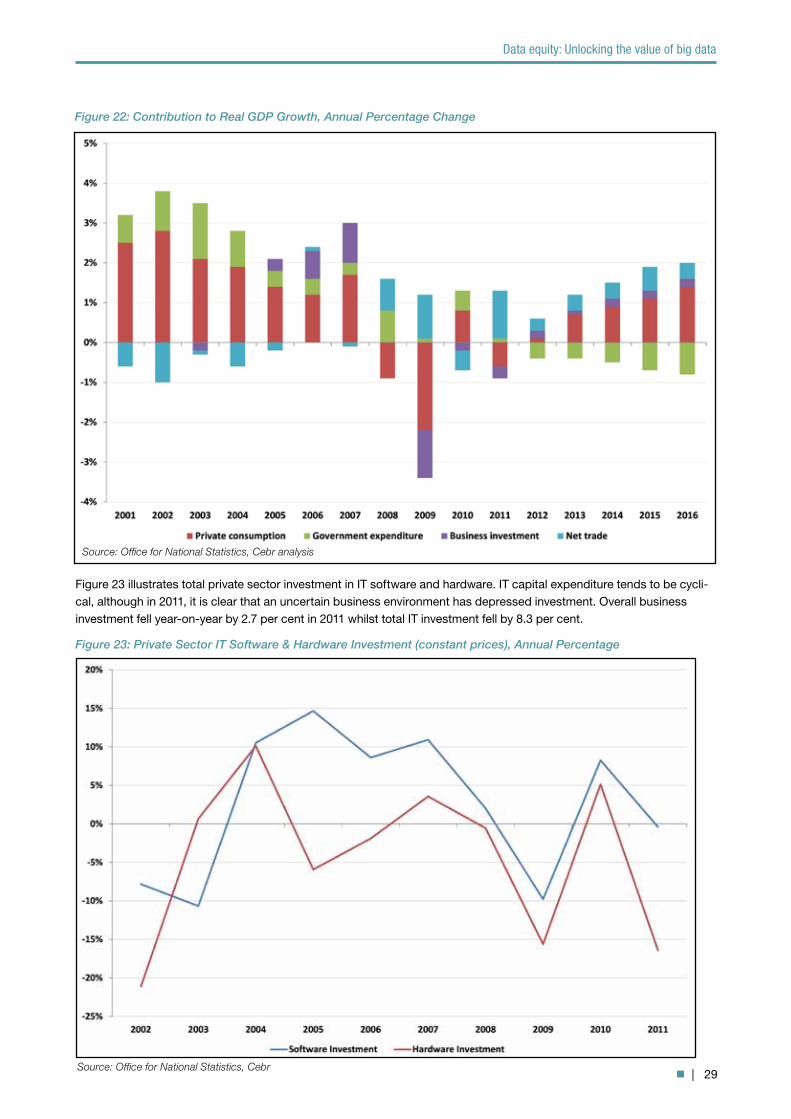
Figure 23 illustrates total private sector investment in IT software and hardware. IT capital expenditure tends to be cycli-cal, although in 2011, it is clear that an uncertain business environment has depressed investment. Overall business investment fell year-on-year by 2.7 per cent in 2011 whilst total IT investment fell by 8.3 per cent.
Figure 23: Private Sector IT Software & Hardware Investment (constant prices), Annual Percentage
Source: Office for National Statistics, Cebr
Figure 22: Contribution to Real GDP Growth, Annual Percentage Change
Source: Office for National Statistics, Cebr analysis

Data equity: Unlocking the value of big data
| 30
5.2 Prospects across industriesLooking across industries, we anticipate ICT and Professional Services sectors to exhibit higher rates of GDP growth compared to other sectors between 2012 and 2017. Figure 24 illustrates the compounded annual growth rate in GDP of each sector.
Financial and Retail sectors are expected to show lower rates of growth as both of these industries have historically relied on periods of strong credit availability.
5.3 The value of data equity by industry
Industry 2012-17 Economic Benefits
Manufacturing 45,252
Retail 32,478
Other Activities 27,929
Professional Services 27,649
Central Government 20,405
Healthcare 14,384
Telecoms 13,740
Transport & Logistics 12,417
Retail Banking 6,408
Energy & Utilities 5,430
Investment Banking 5,275
Insurance 4,595
UK economy 215,964
Figure 25: 2012-17 Cumulative Economic Benefits by Industry or Data Equity, £M (2011 prices)
Source: Cebr analysis
Figure 24: Compounded Growth in GDP (2011-2017), Percentage Change
Source: Cebr analysis
Data equity: Unlocking the value of big data
| 31
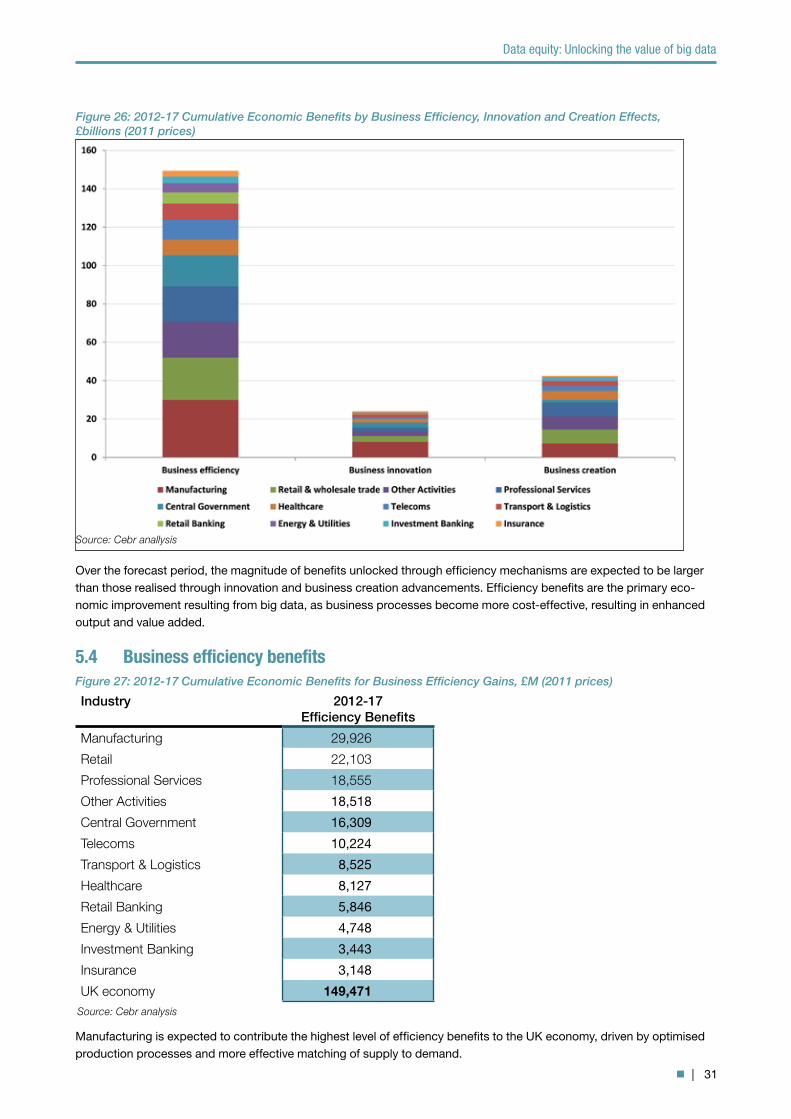
Over the forecast period, the magnitude of benefits unlocked through efficiency mechanisms are expected to be larger than those realised through innovation and business creation advancements. Efficiency benefits are the primary eco-nomic improvement resulting from big data, as business processes become more cost-effective, resulting in enhanced output and value added.
5.4 Business efficiency benefits
Manufacturing is expected to contribute the highest level of efficiency benefits to the UK economy, driven by optimised production processes and more effective matching of supply to demand.
Figure 26: 2012-17 Cumulative Economic Benefits by Business Efficiency, Innovation and Creation Effects, £billions (2011 prices)
Source: Cebr anallysis
Industry 2012-17 Efficiency Benefits
Manufacturing 29,926
Retail 22,103
Professional Services 18,555
Other Activities 18,518
Central Government 16,309
Telecoms 10,224
Transport & Logistics 8,525
Healthcare 8,127
Retail Banking 5,846
Energy & Utilities 4,748
Investment Banking 3,443
Insurance 3,148
UK economy 149,471
Figure 27: 2012-17 Cumulative Economic Benefits for Business Efficiency Gains, £M (2011 prices)
Source: Cebr analysis
Data equity: Unlocking the value of big data
| 32
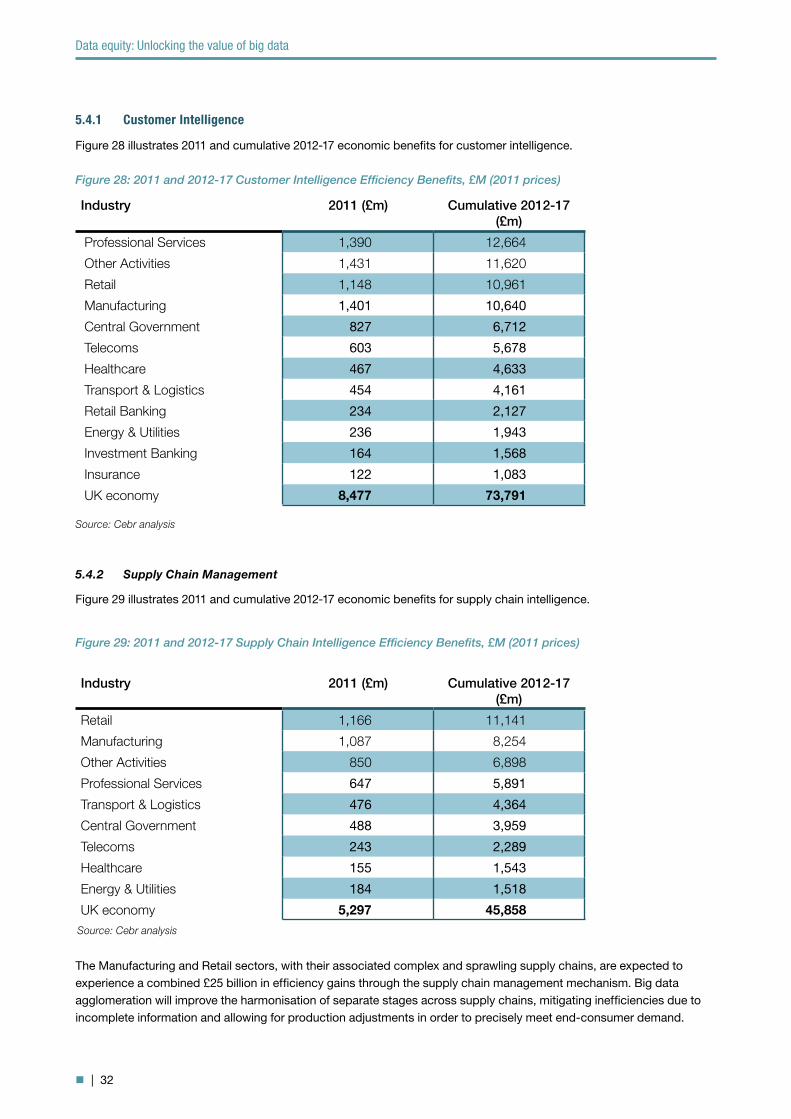
5.4.1 Customer Intelligence
Figure 28 illustrates 2011 and cumulative 2012-17 economic benefits for customer intelligence.
5.4.2 Supply Chain Management
Figure 29 illustrates 2011 and cumulative 2012-17 economic benefits for supply chain intelligence.
The Manufacturing and Retail sectors, with their associated complex and sprawling supply chains, are expected to experience a combined £25 billion in efficiency gains through the supply chain management mechanism. Big data agglomeration will improve the harmonisation of separate stages across supply chains, mitigating inefficiencies due to incomplete information and allowing for production adjustments in order to precisely meet end-consumer demand.
Industry 2011 (£m) Cumulative 2012-17 (£m)
Professional Services 1,390 12,664
Other Activities 1,431 11,620
Retail 1,148 10,961
Manufacturing 1,401 10,640
Central Government 827 6,712
Telecoms 603 5,678
Healthcare 467 4,633
Transport & Logistics 454 4,161
Retail Banking 234 2,127
Energy & Utilities 236 1,943
Investment Banking 164 1,568
Insurance 122 1,083
UK economy 8,477 73,791
Figure 28: 2011 and 2012-17 Customer Intelligence Efficiency Benefits, £M (2011 prices)
Source: Cebr analysis
Industry 2011 (£m) Cumulative 2012-17 (£m)
Retail 1,166 11,141
Manufacturing 1,087 8,254
Other Activities 850 6,898
Professional Services 647 5,891
Transport & Logistics 476 4,364
Central Government 488 3,959
Telecoms 243 2,289
Healthcare 155 1,543
Energy & Utilities 184 1,518
UK economy 5,297 45,858
Figure 29: 2011 and 2012-17 Supply Chain Intelligence Efficiency Benefits, £M (2011 prices)
Source: Cebr analysis
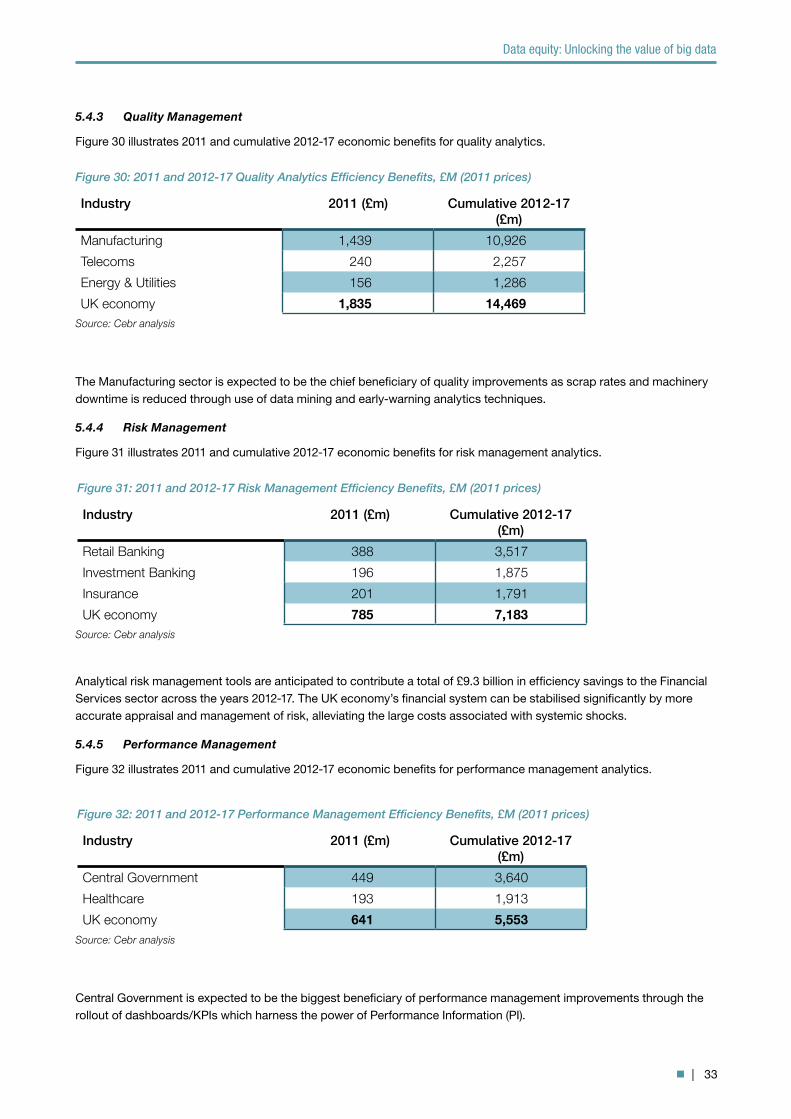
Data equity: Unlocking the value of big data
| 33
5.4.3 Quality Management
Figure 30 illustrates 2011 and cumulative 2012-17 economic benefits for quality analytics.
The Manufacturing sector is expected to be the chief beneficiary of quality improvements as scrap rates and machinery downtime is reduced through use of data mining and early-warning analytics techniques.
5.4.4 Risk Management
Figure 31 illustrates 2011 and cumulative 2012-17 economic benefits for risk management analytics.
Analytical risk management tools are anticipated to contribute a total of £9.3 billion in efficiency savings to the Financial Services sector across the years 2012-17. The UK economy’s financial system can be stabilised significantly by more accurate appraisal and management of risk, alleviating the large costs associated with systemic shocks.
5.4.5 Performance Management
Figure 32 illustrates 2011 and cumulative 2012-17 economic benefits for performance management analytics.
Central Government is expected to be the biggest beneficiary of performance management improvements through the rollout of dashboards/KPIs which harness the power of Performance Information (PI).
Industry 2011 (£m) Cumulative 2012-17 (£m)
Manufacturing 1,439 10,926
Telecoms 240 2,257
Energy & Utilities 156 1,286
UK economy 1,835 14,469
Figure 30: 2011 and 2012-17 Quality Analytics Efficiency Benefits, £M (2011 prices)
Source: Cebr analysis
Industry 2011 (£m) Cumulative 2012-17 (£m)
Retail Banking 388 3,517
Investment Banking 196 1,875
Insurance 201 1,791
UK economy 785 7,183
Figure 31: 2011 and 2012-17 Risk Management Efficiency Benefits, £M (2011 prices)
Source: Cebr analysis
Industry 2011 (£m) Cumulative 2012-17 (£m)
Central Government 449 3,640
Healthcare 193 1,913
UK economy 641 5,553
Figure 32: 2011 and 2012-17 Performance Management Efficiency Benefits, £M (2011 prices)
Source: Cebr analysis
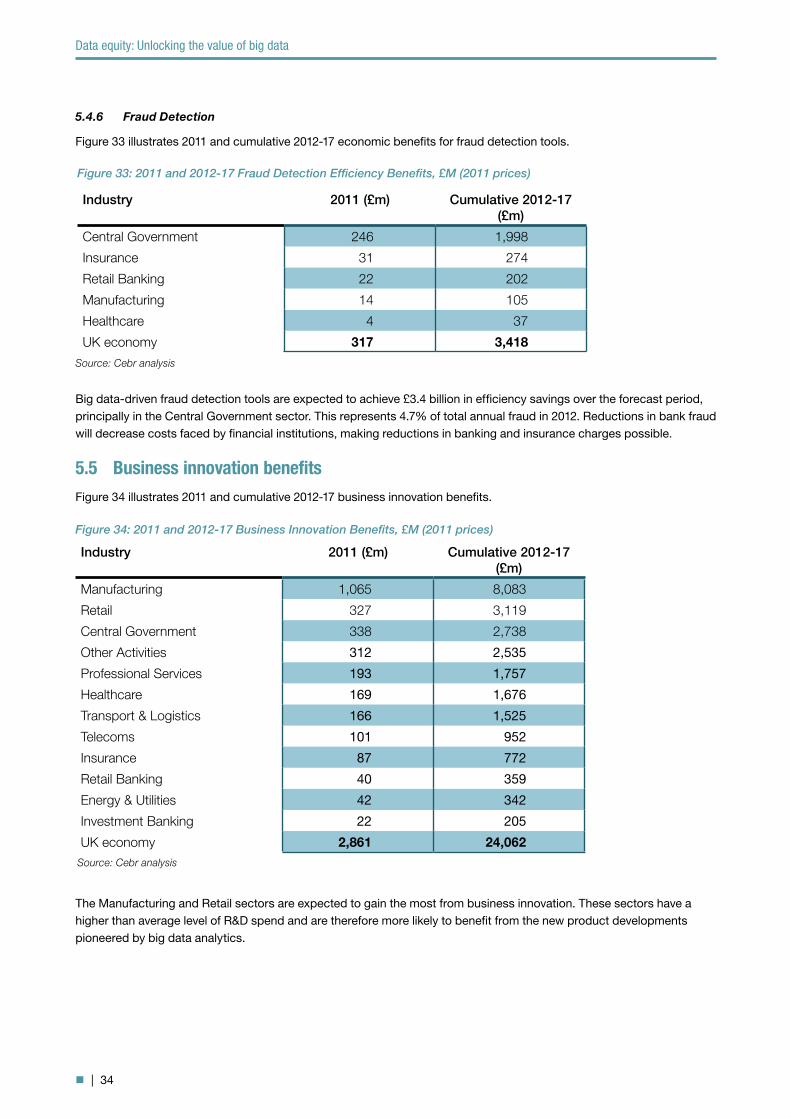
Data equity: Unlocking the value of big data
| 34
5.4.6 Fraud Detection
Figure 33 illustrates 2011 and cumulative 2012-17 economic benefits for fraud detection tools.
Big data-driven fraud detection tools are expected to achieve £3.4 billion in efficiency savings over the forecast period, principally in the Central Government sector. This represents 4.7% of total annual fraud in 2012. Reductions in bank fraud will decrease costs faced by financial institutions, making reductions in banking and insurance charges possible.
5.5 Business innovation benefitsFigure 34 illustrates 2011 and cumulative 2012-17 business innovation benefits.
The Manufacturing and Retail sectors are expected to gain the most from business innovation. These sectors have a higher than average level of R&D spend and are therefore more likely to benefit from the new product developments pioneered by big data analytics.
Industry 2011 (£m) Cumulative 2012-17 (£m)
Central Government 246 1,998
Insurance 31 274
Retail Banking 22 202
Manufacturing 14 105
Healthcare 4 37
UK economy 317 3,418
Figure 33: 2011 and 2012-17 Fraud Detection Efficiency Benefits, £M (2011 prices)
Source: Cebr analysis
Industry 2011 (£m) Cumulative 2012-17 (£m)
Manufacturing 1,065 8,083
Retail 327 3,119
Central Government 338 2,738
Other Activities 312 2,535
Professional Services 193 1,757
Healthcare 169 1,676
Transport & Logistics 166 1,525
Telecoms 101 952
Insurance 87 772
Retail Banking 40 359
Energy & Utilities 42 342
Investment Banking 22 205
UK economy 2,861 24,062
Figure 34: 2011 and 2012-17 Business Innovation Benefits, £M (2011 prices)
Source: Cebr analysis

Data equity: Unlocking the value of big data
| 35
5.6 Business creation and employment benefitsFigure 35 illustrates 2011 and cumulative 2012-17 business creation and employment benefits.
The Professional Services, Manufacturing and Retail sectors are expected to gain the most from business creation. These sectors have higher levels of SMB concentration when compared to Banking, Energy and Telecoms sectors. We expect 58,000 new jobs to be created between 2012 and 2017 as a result of reduced barriers to entry and increased demand for data analytics skills.
5.7 ConclusionAs technological innovations continue and the amount of data that can be captured, stored and managed escalates, we can expect ever-increasing financial opportunities. Consequently we expect more institutions to place a monetary valu-ation on their stored data, and to scrutinise how effectively they are extracting this value. With this in mind, we antici-pate data to begin making appearances on the balance sheets of companies as they seek to account for its potential in economic terms.
As firms start to recognise the true value of business data, the big data industry will ascend to strategic prominence. This presents an opportunity for the UK to increase the competitiveness of all its industries. Our study has identified £216 billion worth of potential benefits through efficiency, innovation and creation gains, driven by insights unlocked from big data. These economic benefits are dependent on businesses adopting big data analytics solutions to gain a competitive advantage in their industry.
On top of the requisite high-performance IT infrastructure, data specialists will also be needed by businesses seeking to reap the benefits of big data. Businesses therefore have to be in a position to recruit from a pool of highly-skilled, data-savvy workers. This means that the increasing data focus among UK industries needs to be matched in education and training, in order to provide a workforce qualified to seize the big data opportunity. Bold action is therefore required to ensure that science, technology, engineering and mathematics (STEM) skills are regarded with the necessary high importance at all levels of education, for the ensuring of a competitive UK in an increasingly global ICT marketplace.
Business Creation Employment Creation
Industry 2011 (£m) Cumulative 2012-17 (£m) Cumulative 2012-17 (£m)
Professional Services 806 7,337 7,000
Retail 761 7,256 16,000
Manufacturing 955 7,244 8,000
Other Activities 848 6,877 12,000
Healthcare 462 4,581 4,000
Telecoms 273 2,564 3,000
Transport & Logistics 259 2,367 3,000
Investment Banking 171 1,627 1,000
Central Government 167 1,358 2,000
Insurance 76 675 1,000
Energy & Utilities 41 340 1,000
Retail Banking 23 204 1,000
UK economy 4,843 42,430 58,000
Figure 35: 2011 and 2012-17 Business Creation and Employment Benefits, £M (2011 prices)
Source: Cebr analysis
Data equity: Unlocking the value of big data
| 36
Appendix A: Literature Review
Customer IntelligenceHa, Bae and Park (2002) assert that useful customer knowledge needs to be longitudinal, as static market knowledge becomes obsolete quickly. Big data allows for such dynamic monitoring of customer and market trends. Verhoef, van Doorn and Dorotic (2007) identify customer lifetime value (CLV) as the central metric in optimising the value of a com-pany’s customer base. Gupta and Zeithaml (2006) observe that firms strategising using such analytical customer metrics can experience improvements in financial performance.
Dennis, Marsland and Cockett (2001) demonstrate how retailers may segment and focus on profitable customers through analysis of customer data, achieving a 3% rise in turnover. Chan (2005) adds that unified, holistic views of customers, mined from many data sources, are needed to profile customers accurately. Coussement and Van den Poel (2008) enrich customer information with analytics upon online activity, finding that predictive models can be refined by accounting for the emotional tone of online customer communications, reducing attrition by at least 1%. Both they and Bailey et al. (2009) acknowledge the broad potential of enriched holistic data for optimising all firm-client interactions.
Smith, Willis and Brooks (2000) and Neslin et al (2006) illustrate how predictive models can predict customer churn, indicating where insurance premiums can be raised or lowered to minimise attrition. Wang, Hu & Yu (2010) note that customer focus is important for banks, asserting that competitive advantage can be bolstered through analysing client motivations and behaviour patterns. Dous et al. (2005) found that integrating customer data from all channels can aid banks, allowing officers to deal with queries efficiently. This leads to cost efficiencies, with more customers served by each officer, as well as improved satisfaction and retention rates. Krasnikov, Jayachandran & Kumar (2009) study how IT processes to develop firm–customer relationships impacted the performance of select U.S. commercial banks. They find that increased insight results in an average profit efficiency increase of 27.5%.
Supply Chain ManagementHendricks and Singhal (2003) demonstrate that the announcement of ‘glitches’ in supply chain operations are associated with a 10.3% decrease in shareholder wealth. D’Avanzo, Von Lewinski and Van Wassenhove (2003) find that companies described as ‘supply chain leaders’ have improved financial performance, with market capitalisation growth rates on average 17% higher than in average firms. Sahay and Ranjan (2008) observe that businesses increasingly look toward supply chain analytics to deliver efficiency savings and service improvements. Success to this end depends upon the ability to extract value from disparate data sourced from across supply chains. Ranjan’s 2009 paper finds that analyti-cal supply chain operations can achieve cost reductions, service improvements and reduced inventory levels, but again notes that full benefits are only captured when distinct data regarding (e.g.) transactions, seasonal flows, supplier perfor-mance and inventories are co-ordinated effectively. This paper shows an average five-year ROI of between 75%-100% for successfully implemented supply chain business intelligence measures.
Cachon & Fisher (2000) examined the benefits that flow from firms sharing demand and inventory data quickly and inexpensively. Sharing information can reduce costs by between 3%-14% as a result of faster/cheaper order processing, leading to shorter lead times and smaller batch sizes.
Haines, Hough and Haines (2010) find that incomplete information is a key obstacle for attaining supply chain efficiency. They highlight the ‘bullwhip effect’, where variations in customer demand induce disproportionately large changes in orders further up the supply chain. Analysis of consolidated data from all stages in supply chains can enable optimal ordering decisions. Trkman, de Oliveira and McCormack (2010) investigate the impact of analytics upon supply chain functions, finding a significant relationship between analytical ability and supply chain performance. They also note that supply chains of higher maturity can reap more value from analytics. Steckel, Gupta & Banerji (2004) examined how changes in order and delivery cycles, availability of point-of-sale (POS) information, and the pattern of customer demand affect supply chain efficiency. Speeding up cycles times (reducing order processing, storing and shipping lags) and shar-ing POS information can reduce supply chain costs by as much as 21%.
Data equity: Unlocking the value of big data
| 37
Quality ManagementLove & Irani (2003) developed an information system to determine quality costs in construction projects, and identify the causes and costs of rework. They find that such systems allow participants to collaboratively find and rectify shortcom-ings in project management practices, rationalizing quality failure costs and minimizing future disruptions. Effective qual-ity management was found to produce a saving of at least 3% in project costs.
Agus, Ahmad and Muhammad (2009) study quality management systems in the electronics and electrical sector. They find that implementation of statistical quality management practices significantly enhance a firm’s productivity, which in turn gives rise to greater profitability. Process performance can be monitored while techniques such as benchmarking, employee focus, supplier relations and training allow for continuous improvement towards the end goal of ‘zero defects’.
Levine & Toffel (2010) investigated the effect of a particular QM standard (ISO 9001) upon firm performance. On top of a marked increase in employee safety, firms implementing ISO measures experienced sales and employment growth above that of equivalent firms without QM processes. They observe that payroll and average earnings grew more rapidly post-certification, implying growth and productivity gains are realized. Those who adopt effective quality management procedures achieve roughly a 10% increase in sales.
Risk ManagementAlessandri & Drehmann (2010) examine the risks to a typical banking book, demonstrating the advantages of holistic risk integration by accounting for interactions between different risk types. Pagach & Warr (2011) study firms which appoint Chief Risk Officers in order to discover the effects of holistic risk management on firm performance. They find that firms adopting integrated risk management experience higher stock returns. Aebi, Sabato and Schmid (2011) utilise the same CRO proxy, and find that during the 2007-8 financial crisis, institutions with more developed risk management experienced higher returns on assets and equity. Ellul and Yerramilli (2010) also observe a relationship between internal risk controls and reduced downside risk for an institution, noting that this relationship is not confined to the ‘crisis years’ of 2007-8 but holds more generally. Chapelle et al. (2004) also agree that holistic assessments of operational risk can enhance the risk-adjusted profitability of an institution. Sensarma and Jayadev (2009) find that risk management is an important determinant of stock returns, as well as noting a sensitivity of stock prices to the effectiveness of risk manage-ment practices.
Cummins et al (2007) study U.S. insurers and find note they can reduce their costs by undertaking analytical enterprise-wide risk management. Hoyt & Liebenberg (2009) find that on average, insurance firms integrating risks across their enterprise are valued 4% higher than those which manage risk separately in ‘silos’, as well as experiencing less volatile returns. Eckles, Hoyt & Miller (2011) also find that this integrated enterprise-wide approach reduces the stock return vola-tility of the firm, as well as increasing the profits gained per unit of risk (ROA/return volatility) by 2.1%.
Performance ManagementFernandez, Cho & Perry (2010) examine the concept of integrated leadership in the public sector. Integrated leadership is conceived as the combination of five leadership roles that are performed collectively by employees and managers at different levels of hierarchy. The findings show that integrated leadership has a positive and sizeable effect on the perfor-mance of federal sub-agencies – accounting for 5% to 20% of variance in performance.
Curristine, Lonti & Journard (2007) examine the key institutional drivers of improving public sector efficiency and the role of performance information (PI) in OECD countries. The findings show that PI improves setting of objectives, monitoring of performance, better management and increased transparency. Around 45% of all OECD countries publish perfor-mance reports through individual ministries. In the UK, performance measures have been used to obtain more than £20 billion in annual efficiency gains over the years from 2005 to 2008.
Kuziemsky, Liu & Peyton (2011) state that health care delivery teams are increasingly adopting healthcare information systems (HCIS) to improve the efficiency and quality of care. Performance indicators are often used to measure how well goals are met (i.e. business performance management). In a report for the Department of Health, McKinsey (2010) identi-fied between 9-14% cost savings that could be enabled by reducing variability in staff productivity in the NHS.

Data equity: Unlocking the value of big data
| 38
Fraud DetectionThe National Fraud Initiative (NFI) programme run by the Audit Commission traced £215 million in fraud in 2008/9. In June 2011, the NFI launched real time data matching between government departments in order to tackle tax and ben-efits fraud. In September 2011, the facility was extended to financial institutions detecting fraudulent credit applications.
Dheepa and Dhanapal (2009) illustrate methods by which analytical platforms can highlight suspicious behaviour in a bank account’s activity. Chen and Lai (2006) find that applying personalised data can enhance the predictive ability of fraud systems. Tasoulis et al. (2008) note that bank fraud detection systems should also have the ability to learn new types of fraud, as fraudsters modify their techniques to evade detection. Srivastava et al. (2008) apply a ‘Hidden Markov’ model and find the system reaches 80% accuracy in classifying fraud and non-fraud transactions, a ratio which is veri-fied by comparative studies of the model. Gadi, Wang and do Lago (2008) adopt an ‘artificial immune system’ approach, studying a Brazilian credit card transaction database, concluding their system achieves a 30% reduction in fraud cost. Panigrahi et al. (2009) assert that a composite approach is most useful. Their integrated data mining method produces a 15-20% higher identification rate of true positives than an industry standard method.
Widder et al. (2009) note that the sheer volume of insurance claims allows fraudsters to ‘slip through the cracks’ and remain undetected, adding that analytics can offer cost savings compared with manual audit of all suspicious claims by claims adjusters. Dionne, Giuliano & Picard’s (2008) study of a large European insurers’ auto insurance data finds that analytical systems generating ‘red flags’ for an investigative unit is the optimal strategy for allocation of audit resources. Ayuso, Guillen & Bolancé (2011) support this conclusion, finding that targeted auditing reduces loss risk to insurance companies. Šubelj, Furlan & Bajec (2011) demonstrate how social network analysis can be included as a means of identi-fying insurance fraudsters working in groups, correctly classifying 90% of fraudsters in their sample.

Data equity: Unlocking the value of big data
| 39
Appendix B: BibliographyAebi, Sabato and Schmid (2011), Risk Management, Corporate Governance, and Bank Performance in the Financial Crisis, Journal of Banking and Finance
Agus, Ahmad and Muhammad (2009), An Empirical Investigation on the Impact of Quality Management on Productivity and Profitability: Associations and Mediating Effect, Contemporary Management Research, Vol. 5, No. 1, p. 77-92
Alessandri and Drehmann (2010), An Economic Capital Model Integrating Credit and Interest Rate Risk in the Banking Book, Bank of England working paper no. 338
Ayuso, Guillen and Bolancé (2011), Loss Risk through Fraud in Car Insurance, Xarxa de Referència en Economia Aplicada Working Paper 2011-08
Bailey, Baines, Wilson and Clark (2009), Segmentation and Customer Insight in Contemporary Services Marketing Practice: Why Grouping Customers Is No Longer Enough, Journal of Marketing Management, Vol. 25, Nos. 3 and 4, p. 227-252
Bititci, Garengo, Dorfler and Nudurupati (2011), Performance Measurement: Challenges for Tomorrow, International Journal of Management Reviews
Boehm (2008), Determining the Impact of Internet Channel Use on a Customer’s Lifetime, Journal of Interactive Marketing, Vol. 22, No. 5, p. 2-22
Bonacchi and Perego (2011), Improving Profitability with Customer-Centric Strategies: The Case of a Mobile Content Provider, Strategic Change: Briefings in Entrepreneurial Finance, Vol 20, No 7, p. 253-267.
Brynjolfsson, Hitt and Kim, (2011), Strength in Numbers: How Does Data-Driven Decisionmaking Affect Firm Performance?, available at SSRN.com
Cachon and Fisher (2000), Supply Chain Inventory Management and the Value of Shared Information, Management Science, Vol. 46, No. 8, p.1032-1048
Campbell and Frei (2009), Cost Structure, Customer Profitability, and Retention Implications of Self-Service Distribution Channels, Management Science, Vol. 56, No. 1, p. 4-24
Chan (2005), Toward a Unified View of Customer Relationship Management, Journal of American Academy of Business, Vol. 6, No. 1, p. 32-37
Chapelle, Crama, Hubner and Peters (2004), Basel II and Operational Risk: Implications for Risk Measurement and Management in the Financial Sector, National Bank of Belgium Working Paper
Chen and Lai (2006), Back Propagation Networks for Credit Card Fraud Prediction Using Stratified Personalized Data, Proceedings of the 5th WSEAS International Conference on Information Security and Privacy, Venice, Italy, November 20-22, 2006.
Coltman, Devinney and Midgley (2011), Customer Relationship Management and Firm Performance, Journal of Information Technology, Vol. 26, p. 205-219
Cooil, Keiningham, Aksoy and Hsu (2007), A Longitudinal Analysis of Customer Satisfaction and Share of Wallet: Investigating the Moderating Effect of Customer Characteristics, Journal of Marketing, Vol. 71, p. 67-83
Coussement and van den Poel (2008), Integrating the Voice of Customers through Call Center Emails into a Decision Support System for Churn Prediction, Journal of Information and Management, Vol. 45, No. 3
Cummins, Dionne, Gagne and Nouira (2009), Efficiency of Insurance Firms with Endogenous Risk Management and Financial Intermediation Activities, Journal of Productivity Analysis, Vol. 32, No. 2, p. 145-159
Curristine, Lonti and Joumard (2007), Improving Public Sector Efficiency: Challenges and Opportunities, OECD Journal on Budgeting, Vol. 7, No. 1, p. 1-41

Data equity: Unlocking the value of big data
| 40
D’Avanzo, von Lewinski and van Wassenhove (2003), The Link between Supply Chain and Financial Performance, Supply Chain Management Review, Vol. 7, No. 6, p. 40-47
Decker and Trusov (2010), Estimating Aggregate Consumer Preferences from Online Product Reviews, International Journal of Research in Marketing, Vol. 27, p. 293-307
Dennis, Marsland and Cockett (2001), Data Mining for Shopping Centres – Customer Knowledge-Management Framework, Journal of Knowledge Management, Vol. 5, p. 368-374
Dheepa and Dhanapal (2009) Analysis of Credit Card Fraud Detection Models, International Journal of Recent Trends in Engineering, Vol. 2, No. 3, p. 126-128.
Dionne, Giuliano and Picard (2009), Optimal Auditing with Scoring: Theory and Application to Insurance Fraud, Management Science, Vol. 55, No. 1, p. 58-70
Dous, Salomann, Kolbe and Brenner (2005), Knowledge Management Capabilities: Making Knowledge For, From and About Customers Work, Proceedings of 11th Americas Conference on Information Systems, Omaha, USA , August 11-14 2005, p. 167-178
Eckles, Hoyt and Miller (2011), The Impact of Enterprise Risk Management on the Marginal Cost of Reducing Risk: Evidence from the Insurance Industry, Haub School of Business Working Paper Series No. 11-5
The Economist (2011), Building with Big Data, in Schumpeter column, print edition, May 2011
Ellul and Yerramilli (2010), Stronger Risk Controls, Lower Risk: Evidence from U.S. Bank Holding Companies, Axa Working Paper Series No. 1, Discussion Paper No 646
Fawcett, Wallin, Allred, Fawcett and Magnan (2011) Information Technology as an Enabler of Supply Chain Collaboration: A Dynamic-Capabilities Perspective, Journal of Supply Chain Management, Vol. 47, No. 1, p.38-59
Fernandez, Cho and Perry (2010), Exploring the Link between Integrated Leadership and Public Sector Performance, The Leadership Quarterly, Vol. 21, No. 2, p. 308-323
Gadi, Wang and do Lago (2008), Credit Card Fraud Detection with Artificial Immune System, Artificial Immunse Systems, Proceedings of ICARIS 2008, p.119-131
Ganesan, George, Jap, Palmatier and Weitz (2009), Supply Chain Management and Retailer Performance, Journal of Retailing, Vol. 85, No. 1, p.84-94
Geissler, Jahn, Loebel and Zanger (2011), From Business Opportunity to Action: What Lies In Between?, Proceedings of 56th Annual ICSB World Conference, Stockholm, Sweden, 15-18 June 2011
Gupta and Zeithaml (2006), Customer Metrics and Their Impact on Financial Performance, Marketing Science, Vol. 25, No. 6, p. 718-739
Ha, Bae and Park (2002), Customer’s Time-Variant Purchase Behaviour and Corresponding Marketing Strategies, Computers and Industrial Engineering, Vol. 43, p. 801-820
Haines, Hough and Haines (2010), Individual and Environmental Impacts on Supply Chain Inventory Management, Journal of Business Logistics, Vol. 31, No. 2, p. 111-128
Haney, Jamasb and Pollitt (2009), Smart Metering and Electricity Demand: Technology, Economics and International Experience, Cambridge Working Papers in Economics 0905, Faculty of Economics, University of Cambridge
Harding and Shahbaz (2006), Data Mining in Manufacturing: A Review, Journal of Manufacturing Science and Engineering, Vol. 128, p. 969-976
Hendricks and Singhal (2003), The Effect of Supply Chain Glitches on Shareholder Wealth, Journal of Operations Management, Vol. 21, p. 501-522
HM Treasury (2011), March 2011 Budget Document, available from hm-treasury.gov.uk

Data equity: Unlocking the value of big data
| 41
Hofmann and Kotzab (2010), A Supply Chain-Oriented Approach of Working Capital Management, Journal of Business Logistics, Vol. 31, No. 2, p.305-330
Honohan (2008), Risk Management and the Costs of the Banking Crisis, National Institute Economic Review, No. 206, p. 15-24
Hoyt and Liebenberg (2011), The Value of Enterprise Risk Management, Journal of Risk and Insurance, Vol. 78, No. 4, p.795-822
Irani, Love, Elliman, Jones and Themistocleous (2005), Evaluating e-Government, Journal of Information Systems, Vol. 15, p. 61-82
Kaynak (2003), The Relationship between Total Quality Management Practices and their Effects on Firm Performance, Journal of Operations Management, Vol. 21, p. 405-435
Krasnikov, Jayachandran and Kumar (2009), The Impact of Customer Relationship Management
Implementation on Cost and Profit Efficiencies: Evidence from the U.S. Commercial Banking Industry, Journal of Marketing, Vol. 73, p. 61-76
Kuziemsky, Liu and Peyton (2010), Leveraging Goal Models and Performance Indicators to Assess Health Care Information Systems, Proceedings of Seventh International Conference on the Quality of Information and Communications Technology
Levine and Toffel (2010), Quality Management and Job Quality: How the ISO 9001 Standard for Quality Management Systems Affects Employees and Employers, Harvard Business School Technology & Operations Management Unit, Research Paper No. 09-018
Lin and Paravisinsi (2011), What’s Bank Reputation Worth? The Effect of Fraud on Financial Contracts and Investment
Love and Irani (2003), A Project Management Quality Cost Information System for the Construction Industry, Information and Management, Vol. 40, p. 649-661
McKinsey & Company (2010), Achieving World Class Productivity in the NHS 2009/10 – 2013/14: Detailing the Size of the Opportunity, Department of Health
McKinsey Global Institute (2011), Big Data: the Next Frontier for Innovation, Competition and Productivity, available from mckinsey.com
eulbroek (2005), A Senior Manager’s Guide to Integrated Risk Management, Journal of Applied Corporate Finance, Vol 14, No 4, p. 56-70.
Mittal, Anderson, Sayrak & Tadikamalla (2005), Dual Emphasis and the Long-Term Financial Impact of Customer Satisfaction, Marketing Science, Vol. 24, No. 4, p. 544-555
Molderink, Bakker, Bosman, Hurink and Smit (2010), Management and Control of Domestic Smart Grid Technology, IEEE Transactions on Smart Grid, Vol. 1, No. 2, p. 109-119
National Fraud Authority (2012), Annual Fraud Indicator 2012, available from homeoffice.gov.uk
Nagar & Rajan (2005), Measuring Customer Relationships: The Case of the Retail Banking Industry, Management Science, Vol. 51, No. 6, p. 904-919
Neslin, Gupta, Kamakura, Lu and Mason (2006), Defection Detection: Measuring and Understanding the Predictive Accuracy of Customer Churn Models, Journal of Marketing Research, Vol. 43, p. 204-211
Ngai, Xiu and Chau (2009), Application of Data Mining Techniques in Customer Relationship Management: A Literature Review and Classification, Expert Systems with Applications, Vol. 36, p. 2592-2602
Pagach and Warr (2011), The Characteristics of Firms That Hire Chief Risk Officers, The Journal of Risk and Insurance, Vol. 78, No. 1, p. 185-211

Data equity: Unlocking the value of big data
| 42
Panigrahi, Kundu, Sural and Majumdar (2009), Credit Card Fraud Detection: A Fusion Approach using Dempster–Shafer Theory and Bayesian Learning, Information Fusion, Vol. 10, p. 354-363
Phua, Lee, Smith and Gayler (2010), A Comprehensive Survey of Data Mining-Based Fraud Detection Research, Artificial Intelligence Review.
Power (2009), The Risk Management of Nothing, Accounting, Organisations and Society, Vol. 34, p. 849-855.
Ranjan (2009), The Role of Business Intelligence in Supply Chain Management, Global Journal of e-Business & Knowledge Management, Vol. 5, No 1, p. 1-7
Reinartz, Krafft and Hoyer (2004), The Customer Relationship Management Process: Its Measurement and Impact on Performance, Journal of Marketing Research, Vol. 41, p. 293-305
Reinartz, Thomas, & Kumar (2005), Balancing Acquisition and Retention Resources to Maximize Customer Profitability, Journal of Marketing, Vol. 69, p. 63-79
Ryals (2005), The Measurement and Profitable Management of Customer Relationships, Journal of Marketing, Vol. 69, p. 252-261
Rubin (2011), Technology Economics and the Importance of Software Process, available at rubinworldwide.com
Sahay and Ranjan (2008), Real Time Business Intelligence in Supply Chain Analytics, Information Management and Computer Security, Vol. 16, No. 1, p. 28-48
Sensarma and Jayadev (2009), Are Bank Stocks Sensitive to Risk Management?, The Journal of Risk Finance, Vol 10, No 1, p. 7-22
Smith and Sparks (2009), Reward Redemption Behaviour in Retail Loyalty Schemes, British Journal of Management, Vol. 20, p. 204-218
Smith, Willis and Brooks (2000), An Analysis of Customer Retention and Insurance Claim Patterns Using Data Mining: A Case Study, The Journal of the Operational Research Society, Vol. 51, No. 5, p. 532-541
Srivastava, Kundu, Sural and Majumdar (2008), Credit Card Fraud Detection Using Hidden Markov Model, IEEE Transactions on Dependable and Secure Computing, Vol. 5, No. 1, p. 37-48.
Steckel, Gupta and Banerji (2004), Supply Chain Decision Making: Will Shorter Cycle Times and Shared Point-of-Sale Information Necessarily Help?, Management Science, Vol. 50, No. 4, p. 458-464
Subelj, Furlan and Bajec (2011), An Expert System for Detecting Automobile Insurance Fraud using Social Network Analysis, Expert Systems with Applications, Vol. 38, No. 1
Tasoulis, Adams, Weston, and Hand (2008), Mining Information from Plastic Card Transaction Streams, Imperial College London Working Paper
TDWI (The Data Warehousing Institute, 2011), Big Data Analytics, 14th Sep 2011, available from tdwi.org/research
Trkman, McCormack, de Oliveira, The Impact of Business Analytics on Supply Chain Performance, Decision Support Systems 2010, Vol. 49, No. 3, p. 318-327
Tsiptsis and Chorianopoulos (2009), Data Mining Techniques in CRM: Inside Customer Segmentation, Wiley; Chichester, West Sussex, U.K
Verhoef, van Doorn and Dorotic (2007), Customer Value Management: An Overview and Research Agenda, Journal of Research and Management, Vol. 3, No. 2, p. 51-68
Wang, Hu and Yu (2010), The Application of Customer Relationship Management in Investment Banks, Asian Social Science, Vol. 6, No. 10, p. 178-182
Widder, von Ammon, Hagemann and Schönfeld (2009), An Approach for Automatic Fraud Detection in the Insurance Domain, AAAI Spring Symposium 2009 - Intelligent Event Processing, p. 98-100

Data equity: Unlocking the value of big data
| 43

Centre for Economics and Business Research LtdUnit 1, 4 Bath Street, London EC1V 9DXTel: 020 7324 2850 Web: www.cebr.com