SLA How Private Equity Data is Collected Darrell...
16
Baltimore June 2006 Thomson Financial SLA How Private Equity Data is Collected Darrell Pinto T H O M S O N F I N A N C I A L
Transcript of SLA How Private Equity Data is Collected Darrell...

BaltimoreJune 2006
Thomson Financial
SLAHow Private Equity Data is CollectedDarrell Pinto
T H O M S O N F I N A N C I A L
T H O M S O N F I N A N C I A L
Private Equity Flow of Funds
Limited PartnersLimited Partners
Private Equity FirmPrivate Equity Firm
Fund 1 Fund 2 Fund 3
CompaniesCompanies
IPO / M&A / BankruptcyIPO / M&A / Bankruptcy
Advisors & Placement
Agents
Advisors & Placement
Agents
Investment Banks, Bankers,
Lawyers
Investment Banks, Bankers,
Lawyers
FundraisingTakedowns
Distributions
Investments Proceeds
Exits

T H O M S O N F I N A N C I A L
Database
16,000
1,400
10,000
16,000 deals
VCReporter™
1800 US funds / 1000 European
funds
Over 9,400 funds
195,000
2,200
15,000
12,000
59,000
120,000 deals
VentureXpert™
Quarterly in the US Semi-annually in Europe
Fund Performance
Private Equity Funds
Limited Partners
Executives
Fund Commitments
Private Equity Firms
Portfolio Companies
Daily
Investments
Update Frequency
Database offerings are comprehensive

T H O M S O N F I N A N C I A L
• Quarterly Surveys in Partnership with associations and other third parties
• Quarterly Financial Statement Analysis of GPs and their Investors
• Daily Research through public sources and government filings
Global Content Exclusive VCA relationships
Benchmarking Tool
Private Equity Differentiators for Thomson Financial
Private Equity Data Collection at TF

T H O M S O N F I N A N C I A L
VentureXpert™
VCReporter™
SDC Platinum™
VentureXpert™
VCReporter™
SDC Platinum™
LPXpert™
Custom Benchmarking & Reporting Services
Pratt’s Guide
LP Directory
LPXpert™
Custom Benchmarking & Reporting Services
Pratt’s Guide
LP Directory
VCJ
EVCJ
Buyouts
PE Week
PE Week Wire
IBR
Pratt’s Guide
LP Directory
VCJ
EVCJ
Buyouts
PE Week
PE Week Wire
IBR
Pratt’s Guide
LP Directory
Database Services LP Services Publications
Private Equity Current Products

T H O M S O N F I N A N C I A L
Data gathering in action:
“Bono”
44 million hits on Google
1 in TF private equity database

T H O M S O N F I N A N C I A L
Question:
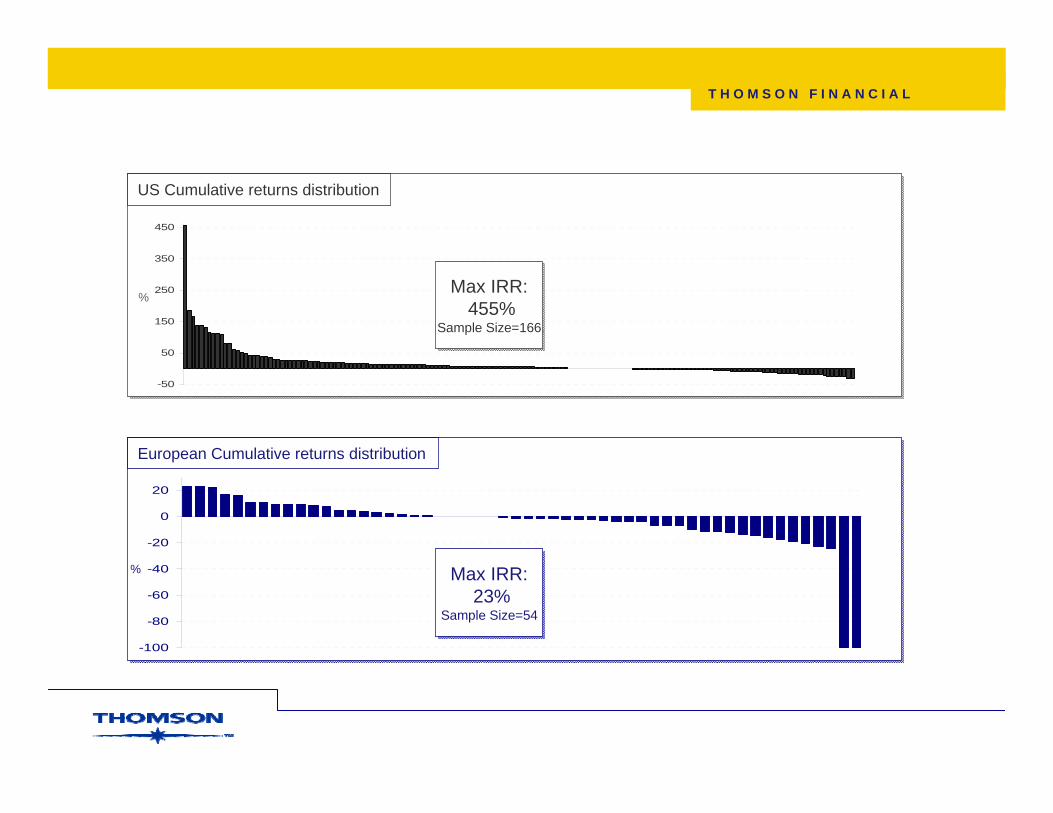
How have life science funds VC performed in the US versus Europe?
T H O M S O N F I N A N C I A L
-50
50
150
250
350
450
-100
-80
-60
-40
-20
0
20
US Cumulative returns distribution
European Cumulative returns distribution
Max IRR:455%
Sample Size=166
Max IRR:455%
Sample Size=166
%
% Max IRR:23%
Sample Size=54
Max IRR:23%
Sample Size=54
T H O M S O N F I N A N C I A L
Question:
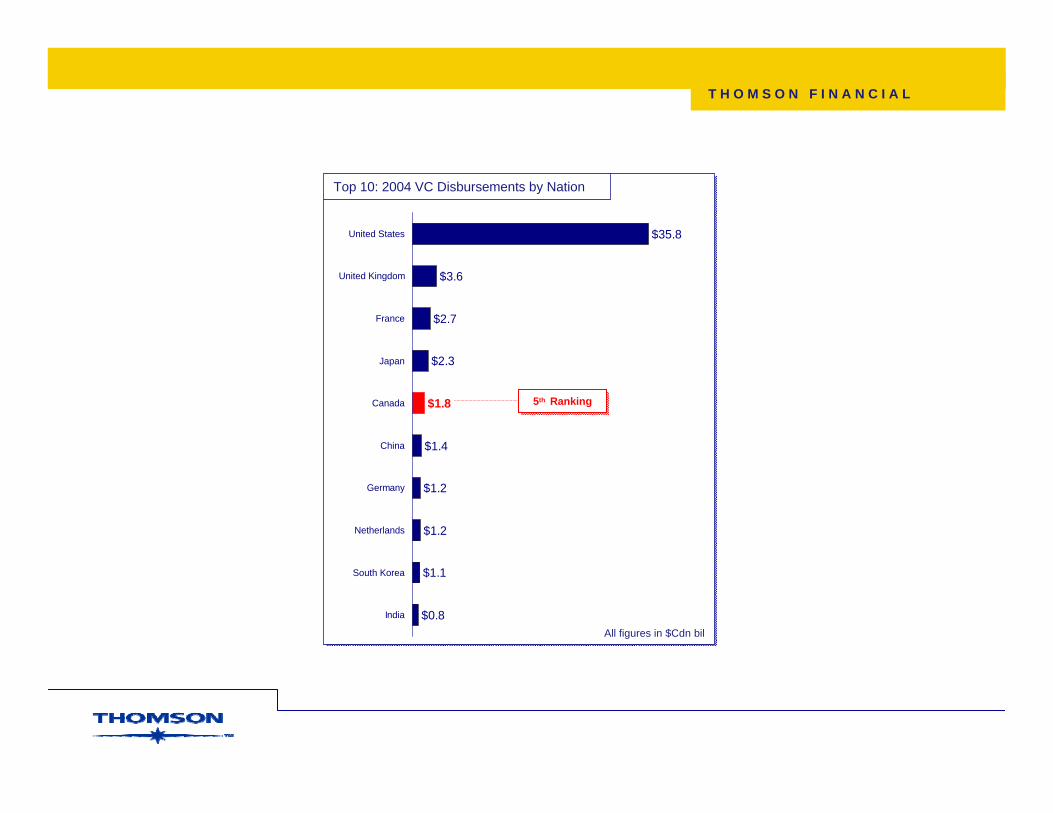
How does Canada rank globally in terms of venture capital activity?
T H O M S O N F I N A N C I A L
Top 10: 2004 VC Disbursements by Nation
$0.8
$1.1
$1.2
$1.2
$1.4
$2.3
$2.7
$3.6
$35.8
$1.8
India
South Korea
Netherlands
Germany
China
Canada
Japan
France
United Kingdom
United States
5th Ranking5th Ranking
All figures in $Cdn bil
T H O M S O N F I N A N C I A L
Question:
How does private equity fundraising last year compare to previous years?

T H O M S O N F I N A N C I A L
€ 71.8
€ 27.5€ 27.0€ 27.5€ 40.0
€ 48.0
€ 8.0
€ 20.0 € 20.3€ 25.4
1996 1997 1998 1999 2000 2001 2002 2003 2004 2005
European Private Equity Funds Raised (€ bil)
$159.5
$85.8$52.8$53.6
$111.5
$199.2
$49.5$72.5
$110.1$130.1
1996 1997 1998 1999 2000 2001 2002 2003 2004 2005
North American Private Equity Funds Raised (USD bil)
T H O M S O N F I N A N C I A L
Question:
Do VC-backed companies that have gone public fare better compared to other public companies?

T H O M S O N F I N A N C I A L
1-year returns*1-year returns*
4.1%
4.5%
-0.7%
9.2%
Dow
Nasdaq 100
S&P Index
PVCIPVCI
8.7%
12.9%
19.3%
26.7%
Dow
S&P Index
Nasdaq 100
PVCI
3-year returns*3-year returns*
PVCI
* as of January 24, 2006
T H O M S O N F I N A N C I A L
Want to know more?
• VentureXpert, the most complete private equity database globally(www.venturexpert.com)
• Send me an email at [email protected] or visit the Thomson Financial booth here at SLA
• www.thomsonfinancial.com