Data Driven Decisions 1 THE EFFECTS OF MATH INTERVENTION ... · “target math instruction to...
29
Data Driven Decisions 1 THE EFFECTS OF MATH INTERVENTION ON STUDENT ACHIEVEMENT By Staci Ulichnie Charleston Southern University, 2011 A Research Paper Submitted to the Graduate School of Southern Wesleyan University In Partial Fulfillment of the Requirements for the Degree Master of Education Professor: Dr. Keith East 2015
Transcript of Data Driven Decisions 1 THE EFFECTS OF MATH INTERVENTION ... · “target math instruction to...

Data Driven Decisions 1
THE EFFECTS OF MATH INTERVENTION ON STUDENT ACHIEVEMENT
By
Staci Ulichnie
Charleston Southern University, 2011
A Research Paper Submitted to the Graduate School of
Southern Wesleyan University
In Partial Fulfillment
of the
Requirements for the Degree
Master of Education
Professor: Dr. Keith East
2015
Data Driven Decisions 2
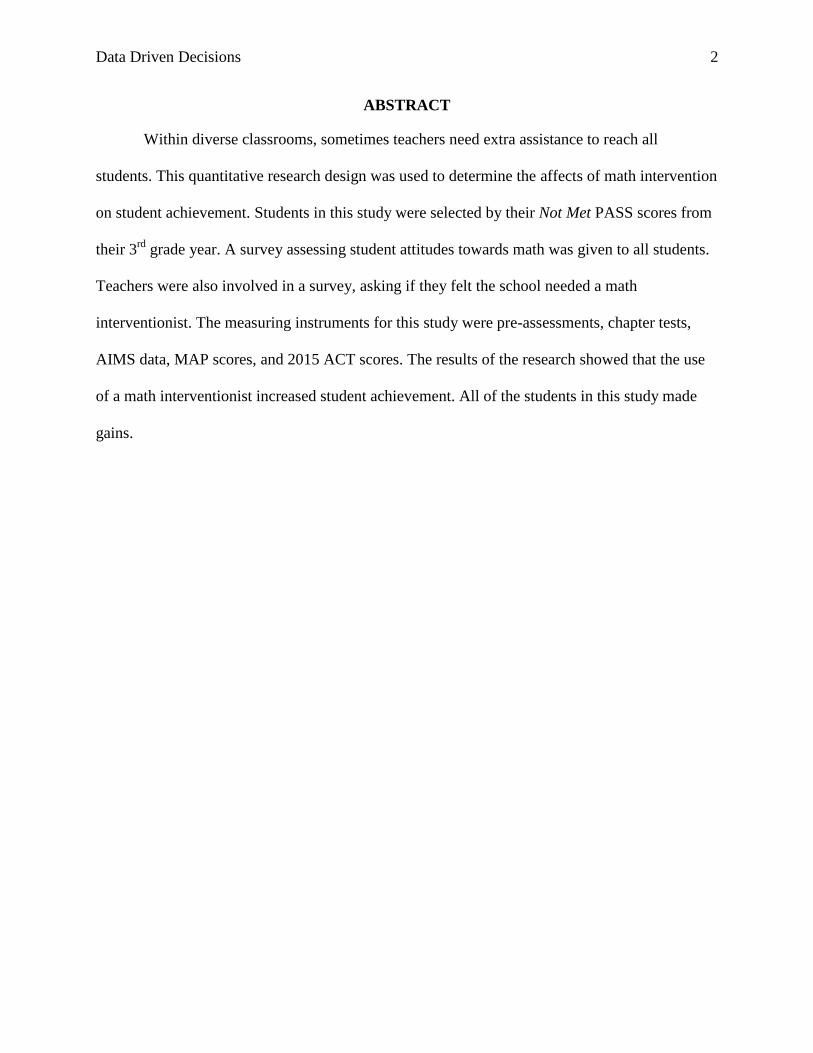
ABSTRACT
Within diverse classrooms, sometimes teachers need extra assistance to reach all
students. This quantitative research design was used to determine the affects of math intervention
on student achievement. Students in this study were selected by their Not Met PASS scores from
their 3rd
grade year. A survey assessing student attitudes towards math was given to all students.
Teachers were also involved in a survey, asking if they felt the school needed a math
interventionist. The measuring instruments for this study were pre-assessments, chapter tests,
AIMS data, MAP scores, and 2015 ACT scores. The results of the research showed that the use
of a math interventionist increased student achievement. All of the students in this study made
gains.

Data Driven Decisions 3
TABLE OF CONTENTS
Title Page……………………………………………………………………………………1
Abstract……………………………………………………………………………………...2
Table of Contents……………………………………………………………………………3
Chapter 1 Introduction …………………………………………………………………….4-6
Statement of Problem, Research Question, Hypothesis, Research Design, Rationale
Chapter 2 Review of Literature…………………………………………………………….7-13
Response to Intervention, Pre-Assessments, Small Group, MAP, AIMS, IXL, Summary
Chapter 3 Methodology……………………………………………………………………14-16
Research Design, Population Being Studied, Assumptions and Limitations, Data
Chapter 4 Results……………….…………………………………………………………..17-22
Data Presentation, Data Analysis
Chapter 5 Discussion………………………………………………………………………..23-25
Summary, Conclusion, Recommendations, Limitations, Impact on Education
Works Cited………………………………………………………………………………....26-27
Appendixes……………………………………………………………………………….......27-28
Student Survey, Teacher Survey, Parent Letter

Data Driven Decisions 4
Chapter 1
Being proficient in math is a necessary skill for life. Interventions are being provided for
students nationwide who perform below basic on various assessments. In this research study, 4th
grade students at Harborview Elementary who scored “Not Met” on the Palmetto Assessment of
State Standards will have the opportunity to receive extra math assistance. The focus is to
provide extra support to students who struggle and need more assistance then what their teacher
can provide in a routine classroom setting. The methods to this research study will begin with
identifying students who need extra support in math. At the beginning, 4th
grade teachers will
pull data from spring 2014 PASS scores. Letters will be sent home asking parents to allow their
students to work with an interventionist once a week for thirty minutes during the school day
revisiting curriculum covered in the classroom. A data binder will record students pre-
assessment and post assessment scores. Every day, students will go to the computer lab to get on
IXL for thirty minutes with Harbor View Elementary’s lead teacher. Students will also be taking
the AIMS Web progress monitoring monthly. MAP data will be collected fall 2014, winter 2015,
and spring 2015 to display student growth. The goal at the end of the study will be to have the
students who scored “Not Met” on the Palmetto Assessment of State Standards to perform
“Met.” If this goal is achieved this proves a math interventionist is necessary for the 2015-2016
school year.

Data Driven Decisions 5
Statement of the Problem
As an experienced practicing professional educator the teacher-researcher has observed
over the years that students in 4th
grade come more prepared as readers then they do as
mathematicians. Students are required to read at home nightly, have 25 books read by the end of
the school year, and have the opportunity to work with a reading interventionist if they are
struggling readers. Charleston County, South Carolina, does not fund a math interventionist for
Harborview Elementary School. The purpose of this quantitative study is to determine what, if
any, affect an intensive math intervention would support students with math that enter fourth
grade. The curriculum and small group will be constructed by looking at data. The teacher will
analyze data from PASS, MAP, pretests, posttests, IXL and AIMS Web to provide small group
instruction that promotes student growth in math.
Research Question
What impact does an intensive math intervention have on math achievement of fourth
grade students at HVES as measured by PASS?
Hypothesis
It is the hypothesis of the teacher researcher that this study will be important evidence to
support students learning in mathematics. Students deserve an equal amount of support in math
as they do reading.
Research Design
The research will study mostly quantitative data. Students were selected by their 2014
not met PASS scores. These scores range from 535 to 591. Students current MAP data will be
Data Driven Decisions 6
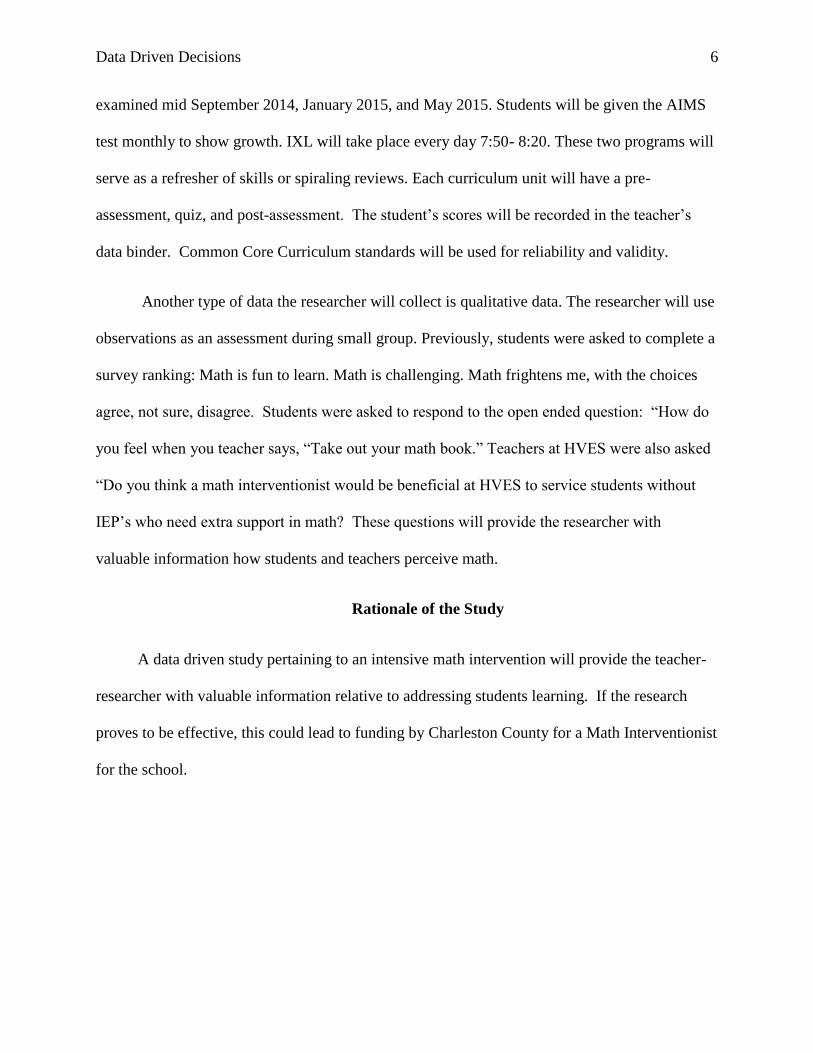
examined mid September 2014, January 2015, and May 2015. Students will be given the AIMS
test monthly to show growth. IXL will take place every day 7:50- 8:20. These two programs will
serve as a refresher of skills or spiraling reviews. Each curriculum unit will have a pre-
assessment, quiz, and post-assessment. The student’s scores will be recorded in the teacher’s
data binder. Common Core Curriculum standards will be used for reliability and validity.
Another type of data the researcher will collect is qualitative data. The researcher will use
observations as an assessment during small group. Previously, students were asked to complete a
survey ranking: Math is fun to learn. Math is challenging. Math frightens me, with the choices
agree, not sure, disagree. Students were asked to respond to the open ended question: “How do
you feel when you teacher says, “Take out your math book.” Teachers at HVES were also asked
“Do you think a math interventionist would be beneficial at HVES to service students without
IEP’s who need extra support in math? These questions will provide the researcher with
valuable information how students and teachers perceive math.
Rationale of the Study
A data driven study pertaining to an intensive math intervention will provide the teacher-
researcher with valuable information relative to addressing students learning. If the research
proves to be effective, this could lead to funding by Charleston County for a Math Interventionist
for the school.

Data Driven Decisions 7
Chapter 2
In Robert Frosts, “Revelation” Robert Frost speaks of the tendency of humans to hide
their true identity from others while at the same time hoping that someone will find them out.
“We make ourselves a place apart, behind light words that tease and flout, but oh, the agitated
heart till someone find us really out. 'Tis pity if the case require (or so we say) that in the end
we speak the literal to inspire the understanding of a friend. But so with all, from babes that play
at hide-and-seek to God afar, so all who hide too well away must speak and tell us where they
are” (Frost). In a poem that is most likely talking about faith and love, from a teacher’s
standpoint it may have a deeper meaning. “If only students could tell us where they are.” “In the
absence of such a revelation, the teacher has to practice the assessor’s art: find out what the
students know and can do- and lead each to the next upward step” (Scherer, 2014, pp. 7).
Mrs. Brown has a very heterogeneous fourth grade class. More than half of her students
are gifted and talented, two students have Individualized Education Plans, six are in the fiftieth
percentile in Math, and five students have been promoted because they have been “pushed
through the system.” No classes’ demographics are perfect, however why have the five
struggling students not been serviced or tested for their weaknesses in math? Now the teacher
has to figure out a way to catch these students up while adhering to the rigorous new standards.

Data Driven Decisions 8
Let us face the facts; teachers are directly responsible for “crucial, life saving work” (Buffman,
2010, pp. 10). “Educators today are like tightrope walkers without a safety net, responsible for
meeting the needs of every student, with little room for error” (Buffman, 2010, pp. 10). Students
who graduate today have a good chance of surviving in the global marketplace, while others who
fail in school are a greater risk of poverty, welfare, or an early death. The pressure is on for
teachers to provide the essential skills needed to survive in today’s society.
Response to Intervention
Why intervention? The purpose of RTI (Response to Intervention) is to support
struggling children before they qualify for special education. Schools should provide
interventions to students as soon as they demonstrate the need. Most teachers recognize a
weakness in a student at a young age and the student can be “RTIed.” “The purpose of RTI is to
systematically provide every student with the additional time and support” (Buffman, 2010, pp.
14). This is a leveled system that provides steps for teachers to take before a child is tested for
special education. The first step, tier one, is a teacher’s responsibility, making sure he or she is
teaching the standards and differentiating instruction with re-teaching and enrichment. Tier two,
begins small group instruction. “Research has shown that small-group instruction can be highly
effective in helping students’ master essential learning” (Buffman, 2010, pp.10). Tier three
guarantees intensive support for the student in the subject area. This additional help is
individualized and tracks at risk students. A team from the school will follow the child’s
progress. If Tier three has no effect then special education testing will take place. RTI has been
proven beneficial nationwide and should be implemented as soon as possible.
Pre-Assessments
Data Driven Decisions 9
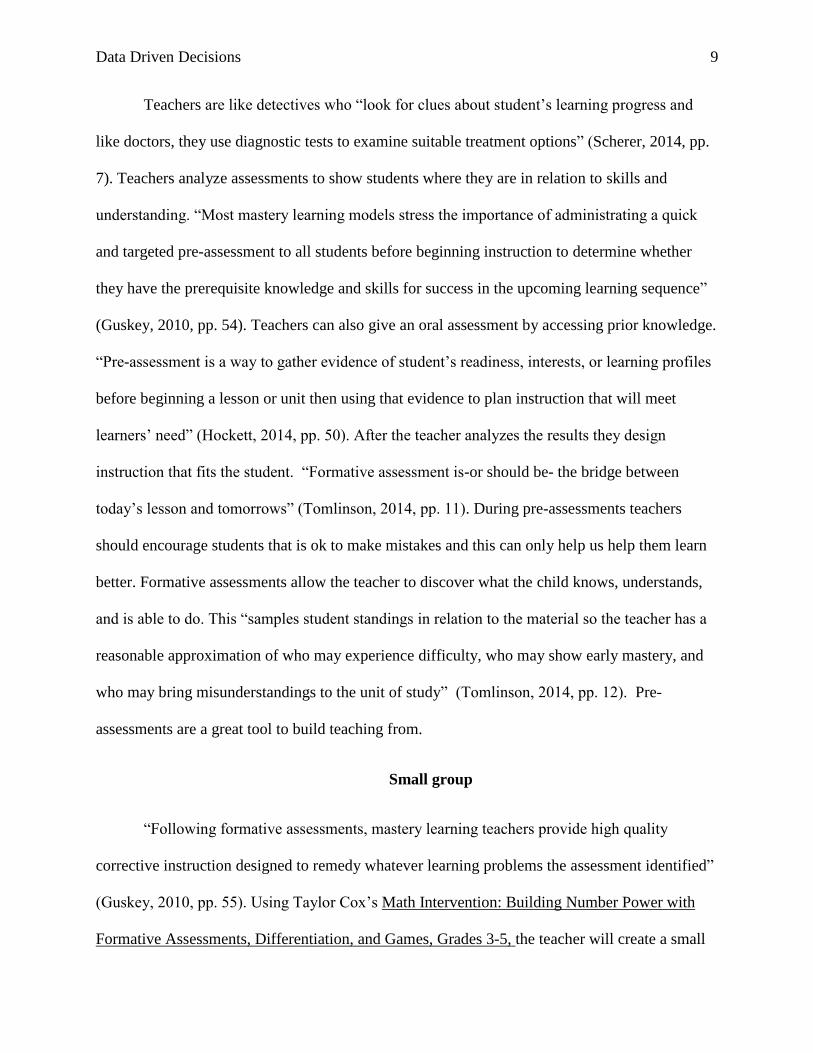
Teachers are like detectives who “look for clues about student’s learning progress and
like doctors, they use diagnostic tests to examine suitable treatment options” (Scherer, 2014, pp.
7). Teachers analyze assessments to show students where they are in relation to skills and
understanding. “Most mastery learning models stress the importance of administrating a quick
and targeted pre-assessment to all students before beginning instruction to determine whether
they have the prerequisite knowledge and skills for success in the upcoming learning sequence”
(Guskey, 2010, pp. 54). Teachers can also give an oral assessment by accessing prior knowledge.
“Pre-assessment is a way to gather evidence of student’s readiness, interests, or learning profiles
before beginning a lesson or unit then using that evidence to plan instruction that will meet
learners’ need” (Hockett, 2014, pp. 50). After the teacher analyzes the results they design
instruction that fits the student. “Formative assessment is-or should be- the bridge between
today’s lesson and tomorrows” (Tomlinson, 2014, pp. 11). During pre-assessments teachers
should encourage students that is ok to make mistakes and this can only help us help them learn
better. Formative assessments allow the teacher to discover what the child knows, understands,
and is able to do. This “samples student standings in relation to the material so the teacher has a
reasonable approximation of who may experience difficulty, who may show early mastery, and
who may bring misunderstandings to the unit of study” (Tomlinson, 2014, pp. 12). Pre-
assessments are a great tool to build teaching from.
Small group
“Following formative assessments, mastery learning teachers provide high quality
corrective instruction designed to remedy whatever learning problems the assessment identified”
(Guskey, 2010, pp. 55). Using Taylor Cox’s Math Intervention: Building Number Power with
Formative Assessments, Differentiation, and Games, Grades 3-5, the teacher will create a small
Data Driven Decisions 10
group promoting one-on-one instruction focusing on different math concepts. The teacher will
“target math instruction to struggling students by:
(1) Diagnosing weaknesses
(2) Providing specific, differentiated instruction
(3) Using formative assessments
(4) Offering corrective feedback
(5) Motivating students by using games (Taylor-Cox, 2009, pp. 5 )
Taylor-Cox emphasizes four main goals for math instructors. They must help students
achieve: “accuracy, efficiency, flexibility, and fluency in solving math problems” (Taylor-Cox,
2009, pp.1). Small groups are designed for accommodating “differences in students learning
styles, learning modalities, or types of intelligence” (Guskey, 2010, pp. 56). During whole group
instruction “many students, who struggle in math, become anxious... group work and hands-on
learning can reduce their anxiety” (Medoff, 2013, pp.46). Within small group the teacher will
need to give clear directions. “Choose activities or problems with several possible solutions and
strops to deriving those solutions to promote the idea that there are many ways to be “smart” in
math” (Medoff, 2013, pp. 46). “Make it clear through your words and behaviors that you believe
everyone can learn math by putting in the effort” (Medoff, 2013, pp. 47). Creating a comfortable
learning environment allows students to hone in on their one-on-one instructional experience.
MAP
MAP provides “the ability to track student growth over time, perceive trends and
weakness of the curriculum and provide the teachers with the tools they need to be successful in
Data Driven Decisions 11
the classroom” (NWEA, 2012, pp. 1). A case study was performed in a suburban school district
in Indiana, Mt. Vernon Schools, and they are advocates for measuring academic performance.
“We would sooner give up the ISTEP + state-mandated test than give up NWEA because of the
value it gives us in decision making” (NWEA, 2012, pp 1). Using MAP data, the Mt. Vernon
County was able to determine that they were using textbooks that were too difficult for their
students to comprehend. To address the problem, differentiation took place and two sets of
textbooks were ordered for the students based on their reading levels. MAP also compares
students to their peers. This is important for parents to know so they can understand if their child
is making growth. Parents “know their MAP scores before and after each test and they are
involved in setting their goals” (NWEA, 2012, pp. 2). Teachers in Mt. Vernon believe MAP
helps the students and teachers prep for the state mandated tests. One teacher said, “If we didn’t
have NWEA, we’d have no idea what to expect from and how to prepare for ISTEP”(NWAE,
2012, pp. 2). Teachers “gain meaningful insight into the ways students learn, so they can best
support them in meeting growth targets and passing important tests” (NWEA, 2012, pp. 2).
Educators use MAP data “when the academic focus is on helping kids reach their growth targets”
(NWEA, 2012, pp. 2). This type of assessment can help predict what students will make on state
mandated tests. At the end of the day this type of data is very important because it measures
growth. Students can show they gained knowledge throughout the year. This is important
because students may have a bad test taking day on the state mandated test and the teacher has
evidence the student has learned something this year more than a not met, met, or exemplary.
AIMS
In Tier 2 intervention, teachers monitor at-risk students more frequently to evaluate the
effectiveness of instructional changes. “AIMS web is the leading assessment and RTI solution in

Data Driven Decisions 12
school today—a complete web-based solution for universal screening, progress monitoring, and
data management for Grades K-12” (AIMSweb, 2011, pp.1). This program progress monitors to
determine the effectiveness of the teacher interventions, and whether students are progressing
sufficiently to meet year-end goals. A case study at Helen Smith Elementary School in Clark
County, Las Vegas, Nevada, takes achievement to new heights; school earns Blue Ribbon status
after turning to AIMSweb for RTI. One teacher noted, “ We’re data driven now, which is such an
improvement.” “In the past, a teacher might have suspected that a student had learning difficulties,
but lacked the tools to make an accurate evaluation” (AIMSweb, 2011, pp. 2). This program is an
effective resource to map student growth. “Parents like seeing the data and they’re often surprised
how much information we have about their child” (AIMSweb, 2011, pp. 2). Students have begun
to make the shift too, “they know where they are and where they need to be at the beginning,
middle and the end of year.” “They have control over their own performance” (AIMSweb, 2011,
pg. 2). AIMSweb is an assessment that can be used as often as needed and can be used as guide to
progress monitoring.
IXL
The purpose of IXL is to “practice and excel.” This online program is used in 50 states
and 170 countries. Students have the opportunity to practice skills and develop confidence in
reading of math. For fourth grade math specifically there are 279 math skills available for
practice. Students use visual representation, listening skills, and interactive activities to reinforce
their learning. At the end of each week students, parents, and teachers can see if the student has
“mastered” a specific skill. If a student does not master the skill they will be given a percentage
of mastery so the teacher and parent can know that is a skill they still need to work on. People all
over the world are raving about IXL. A fourth grade parent from California said, “This program

Data Driven Decisions 13
takes the frustration out of math because it allows the student to practice at his/her own pace and
stay focused.” “It's okay if you mark one wrong because another one will be waiting.” “This is a
great tool to have” (IXL.com). A fourth grade teacher from Brooklyn Center, Minnesota, said,
“My students love it!” “It really challenges them to master the concepts.” “I told one of my
students to change to another topic so she could practice for the upcoming tests, and she
said, 'No, wait” “I want to get to 100% first!” “I have never seen her more motivated to
succeed!” (IXL.com). Finally, the most important, a student from Alberta Canada said, “My
favorite feature of IXL is that if you get a question wrong IXL will tell you how to solve it and
what you did wrong.” “Another thing I really enjoy is that IXL provides awards and progress
reports showing how you do over time.” “I think these 2 things are very effective because they
make the student feel like they are actually studying and not wasting time” (IXL.com). These
testimonies are proof IXL is a great tool for practice promoting mastery. Students can have fun
while learning!
Summary
In this chapter the researcher discusses literature reviews on the breakdown of Response
to Intervention, the importance of pre-assessments, the formatting of an effective small group,
and methods to intervention. Using this knowledge the researcher will begin Tier two
intervention, track data with MAP, pre-assessments, IXL and AIMS web, and plan small group
activities.

Data Driven Decisions 14
Chapter 3
The purpose of this study is to provide tier two Response to Intervention to students who
struggle in math. The researcher will compare data from MAP 2014 to 2015 during the fall,
winter and spring. The researcher will analyze this data and compare student growth to the
students PASS 2015 scores. The researcher will evaluate student growth during this time period
using programs such as AIMSweb and IXL. The researcher is using small groups with standard
based targeted instruction to prove or disprove the validity of response to intervention.
Research Design
The data being collected is both quantitative and qualitative. The MAP, IXL, AIMS, pre-
assessments, quizzes, and post assessments are quantitative data. Student and teacher surveys
along with small group observations will be means of qualitative data. The dependent variable is
the students MAP scores. The independent variable is the small group instruction and methods of
intervention. The controlled variable is the students will receive the same Curriculum Tests (pre-
assessments, quizzes, post-assessments).
Population Being Studied
The target population all received scores of not met on PASS ranging from 535 to 591.
These students do not have Individualized Education Plans. Students scored a “low” on math

Data Driven Decisions 15
skills in grades 1, 2, and 3 by their classroom teacher on their permanent records. Students are
diverse in their own way with anxiety, 504 plans, ODD, and ADHD affecting their learning.
Assumptions and Limitations
The researcher assumes the regular education teacher is teaching the unit of study
according to the district pacing guide and grade level. Limitation: students may have a bad
testing day and their MAP scores will not increase. Students may be absent on a day of small
group.
Treatment of Data
Will intense intervention increase student growth? This question can be answered
according to the growth students make from their 2014 fall MAP score to their winter 2015
score. On average students gain 6 points from fall to winter and 12 points fall to spring. This test
is personalized to student levels so student growth may be different. Students will be identified
as on, below, or above grade level after the test. MAP data can be used to project PASS
performance.
Data Needed
Using pre-assessments to guide instruction the researcher will collect data on students’
knowledge before a unit and after. The students need to show improvement from their pretest to
post test showing they have gained knowledge. AIMS Web will give the researcher data on
curriculum covered throughout the entire year, students will be spiraling the information. Every
month the researcher would like to see the students do two more problem than last time. Students
need to show growth from their 2014 fall MAP scores to their 2015 winter MAP scores by at
least 6 points. If a student does not meet their 6 point goal mid-year it is the researchers hope that

Data Driven Decisions 16
the student will gain the full 12 points in the spring. Students also need to show mastery in a skill
in weekly IXL, weekly AIMS, and gains from their pretest to posttest.
Location of Data
The school’s lead teacher or curriculum coach will administer the test. NWEA will log
the score and the researcher will further analyze the data. Throughout the time of study the
researcher will find IXL weekly reports online while AIMS web and formative assessments will
be hand graded and recorded in a data binder.

Data Driven Decisions 17
Chapter 4 Results
As an experienced, practicing, professional educator the teacher/researcher has observed
that the students at Harbor View Elementary in the Charleston County School District are better
readers than they are mathematicians. However, the Charleston County School District does not,
currently, fund a math interventionist. The purpose of this quantitative study is to determine
what, if any, effect an intensive math intervention has on students that enter fourth grade who are
in of need extra math assistance. Using data from the students’ third grade year, students were
selected for this study based on their Not Met PASS scores. The research question is what impact
does an intensive math intervention have on math achievement of fourth grade students? In this
chapter the researcher will display the various forms of data, analyze them, and make
interpretations.
Data Presentation:
“Tables can be used effectively for summarizing results, especially if a report involves a
large amount of statistical material” (Wiersma and Jurs, 2009, pg. 91). The researcher will utilize
descriptive statistics to analyze results and draw conclusions. Using pre-assessments, post
assessments from place value, adding and subtracting, multiplication, division, patterns,
fractions, decimals, measurement, perimeter, area, geometry, Fall MAP, Winter MAP, Spring
MAP, along with 2014 PASS scores, 2015 ACT scores, and AIMS web, the researcher’s goal is
to determine whether small group interventions have an impact on student growth.

Data Driven Decisions 18
The scales of measurement consist of ordinal and interval. For most of the data the
researcher will use measures of central tendencies, specifically the mean and range. Because the
data compiled is straightforward and uncomplicated in nature, it will be displayed in the format
of a table and show the amount of growth the students made throughout the year.
Data Analysis:
Table 4.1 Student Performance in Math as Measured by 2014 PASS
Students were selected for this research study because of their 2014 Mathematics PASS
score. As displayed in Table 4.1, Student Performance in Math as Measured by 2014 PASS,
students 1 through 6 scored Not Met on the Palmetto Achievement State Standards Test.
Table 4.2 Student Performance in Math as Measured by MAP during the 2014-2015 Academic Year
Fall Winter Spring Growth
Student 1 202 203 215 +13
Student 2 199 208 208 +7
Student 3 197 197 200 +3
Student 4 202 207 205 +3
Student 5 195 195 201 +6
Student 6 194 196 204 +10
As can be seen by Table 4.2, Student Performance in Math as Measured by MAP during
the 2014-2015 Academic Year, 100% of the students realized gains. Student 1, who had a spring
score of 215, realized an overall gain of +13 when compared to the fall score of 202. Student 2,
who had a spring score of 208, realized an overall gain of +7 when compared to the fall score of
Student 1 Not Met
Student 2 Not Met
Student 3 Not Met
Student 4 Not Met
Student 5 Not Met
Student 6 Not Met
Data Driven Decisions 19
199. Student 3, who had a spring score of 208, realized an overall gain of +3 when compared to
the fall score of 197. Student 4, who had a spring score of 205, realized an overall gain of +3
when compared to the fall score of 202. Student 5, who had a spring score of 201, realized an
overall gain of +6 when compared to the fall score of 195. Finally, student 6, who had a spring
score of 204, realized a gain of +10 when compared to the fall score of 194. In all, 100% of the
students realized gains from MAP testing from fall to spring.
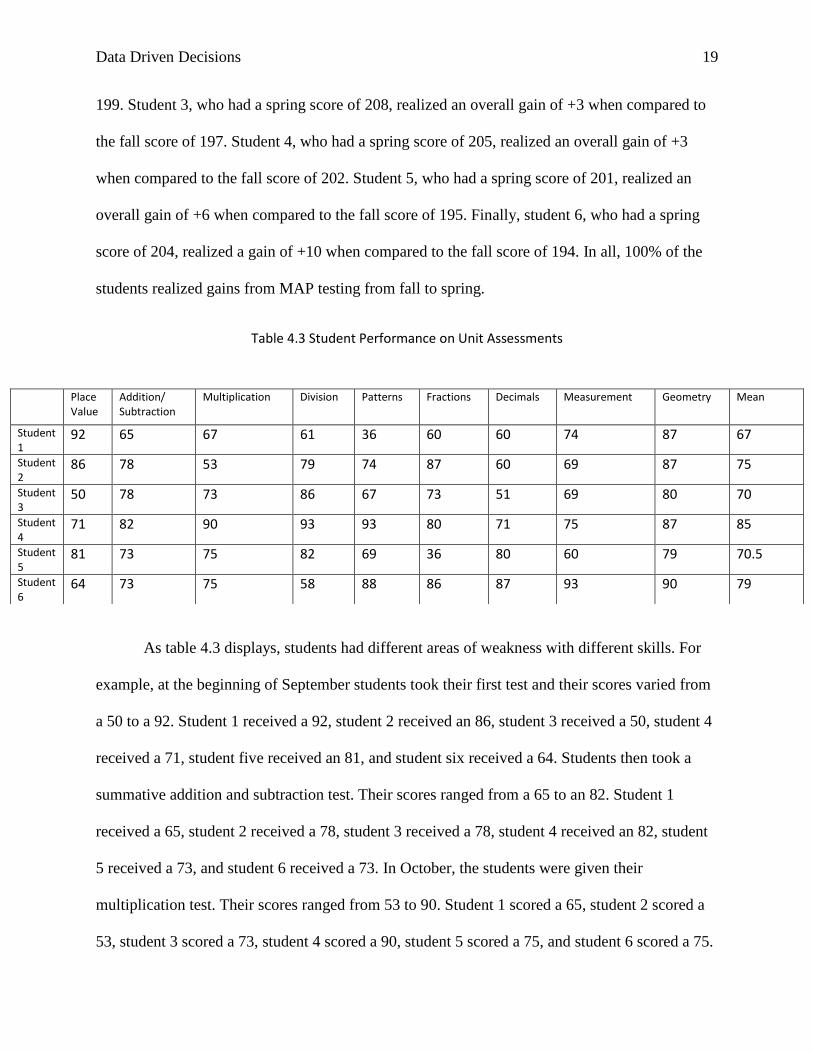
Table 4.3 Student Performance on Unit Assessments
As table 4.3 displays, students had different areas of weakness with different skills. For
example, at the beginning of September students took their first test and their scores varied from
a 50 to a 92. Student 1 received a 92, student 2 received an 86, student 3 received a 50, student 4
received a 71, student five received an 81, and student six received a 64. Students then took a
summative addition and subtraction test. Their scores ranged from a 65 to an 82. Student 1
received a 65, student 2 received a 78, student 3 received a 78, student 4 received an 82, student
5 received a 73, and student 6 received a 73. In October, the students were given their
multiplication test. Their scores ranged from 53 to 90. Student 1 scored a 65, student 2 scored a
53, student 3 scored a 73, student 4 scored a 90, student 5 scored a 75, and student 6 scored a 75.
Place Value
Addition/ Subtraction
Multiplication Division Patterns Fractions Decimals Measurement Geometry Mean
Student 1
92 65 67 61 36 60 60 74 87 67
Student 2
86 78 53 79 74 87 60 69 87 75
Student 3
50 78 73 86 67 73 51 69 80 70
Student 4
71 82 90 93 93 80 71 75 87 85
Student 5
81 73 75 82 69 36 80 60 79 70.5
Student 6
64 73 75 58 88 86 87 93 90 79
Data Driven Decisions 20
In November students took their division test. Student scores varied from 58 to 93. Student 1
scored a 61, student 2 scored a 79, student 3 scored an 86, student 4 scored a 93, student 5 scored
an 82, and student 6 scored a 58. Patterns were the next unit of study and student scores ranged
from 36 to 93. Student 1 received a 36, student 2 scored a 74, student 3 scored a 67, student 4
scored a 93, student 5 scored a 69, and student 6 scored an 88. In January, students took a
fraction assessment. The test scores ranged from a 36 to an 87. Student 1 scored a 60, student 2
scored an 87, student 3 scored a 73, student 4 scored an 80, student 5 scored a 36, and student 6
scored an 86. In February students learned a new skill, decimals, and student scores varied from
a 51 to an 87. Student 1 received a 60, student 2 received a 60, student 3 made a 51, student 4
made a 71, student 5 made an 80, and student 6 made an 87. Measurement scores ranged from a
60 to a 93. Student 1 made a 74, student 2 made a 69, student 3 made a 69, student 4 made a 75,
student 5 made a 60, and student 6 made a 93. Lastly, geometry scores ranged from 79 to 90.
Student 1 received an 87, student 2 received an 87, student 3 received an 80, student 4 received
an 87, student 5 received a 79, and student 6 received a 90. In the final column of table 4.3 each
student has an average for their test scores. The mean for student 1 was 67, student 2 was 75,
student 3 was 70, student 4 was an 85, student 6 was a 70.5, and student 6 was a 79.
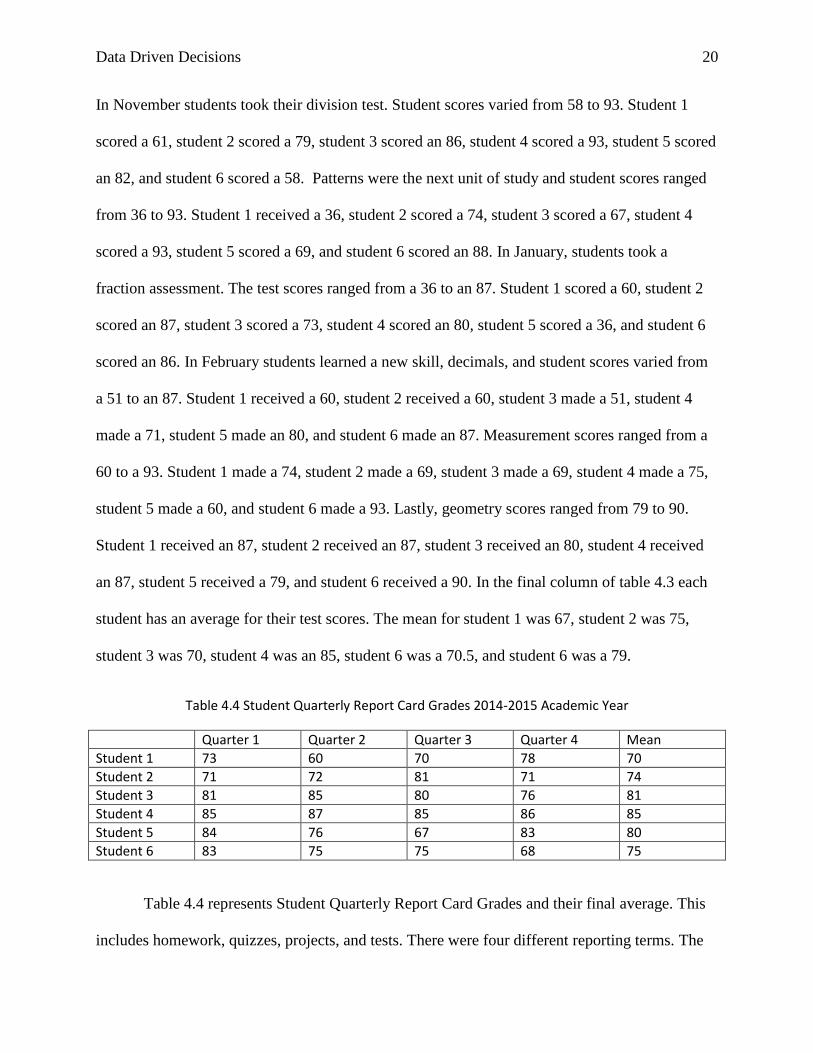
Table 4.4 Student Quarterly Report Card Grades 2014-2015 Academic Year
Quarter 1 Quarter 2 Quarter 3 Quarter 4 Mean
Student 1 73 60 70 78 70
Student 2 71 72 81 71 74
Student 3 81 85 80 76 81
Student 4 85 87 85 86 85
Student 5 84 76 67 83 80
Student 6 83 75 75 68 75
Table 4.4 represents Student Quarterly Report Card Grades and their final average. This
includes homework, quizzes, projects, and tests. There were four different reporting terms. The

Data Driven Decisions 21
purpose of this table was to track student performance over the year. Student 1’s report card
grades were: 73, 60, 70, 78, and 70. Their final average for fourth grade was a 70. Student 2
received a 71, 72, 81, 71, and 74. Their final average was a 74. Student 3’s report card grades
were an 81, 85, 80, and a 76. Their final average was an 81. Student 4 received an 85, 87, 85, 86
and their final average was an 85. Student 5 scored an 84, 76, 67, and an 83. Their final average
was an 80. Finally, student 6 received an 83, 75, 75, and a 68.
Table 4.5 Student Performance AIMS Web
Sept. Oct. Nov. Dec. Jan. Feb. March April May Growth
Student 1
6 6 6 5 4 6 7 7 9 +3
Student 2
5 6 6 7 5 6 7 7 7 +2
Student 3
10 12 11 10 10 11 11 12 12 +2
Student 4
9 10 10 10 8 9 10 10 11 +2
Student 5
6 6 7 7 6 7 8 9 10 +4
Student 6
5 6 6 10 10 11 11 11 12 +7
Table 4.5, Student Performance on AIMS Web, represents the number of problems
performed correctly and was collected by the researcher monthly. Students were given 8 minutes
to complete as many problems as possible. As the table shows, 100% of the students made gains.
Student 1 went from solving 6 problems in September to solving 9 problems in May, thus
realizing a gain of +3. Student 2 went from solving 5 problems in September to solving 7 in
May, realizing a gain of +2. Student 3 went from solving 10 problems in September to solving
12 problems in May, thus realizing a gain of +2. Student 4 went from solving 9 problems in
September to solving 11 problems in May, thus realizing a gain of +2. Student 5 went from
solving 6 problems in September to solving 10 problems in May, thus realizing a gain of +4.

Data Driven Decisions 22
Student 6 went from solving 5 problems in September to solving 12 problems in May, thus
realizing a gain of +7. In all, Table 4.5 displays student growth on AIMS Web throughout the
school year.
Table 4.6 Student Performance on 2015 ACT Aspire
Student 1 Ready
Student 2 Close
Student 3 Close
Student 4 Ready
Student 5 Close
Student 6 Close
The final table, Table 4.6, displays Student Performance on the 2015 ACT Aspire. In
May the students took this timed 55 minute test. Before the test, the teacher reviewed the entire
curriculum covered throughout the school year. As stated in table 4.6. The students performed in
the ranges from Close to Ready this can be converted to a Not Met and Met score in comparison
to PASS. Student 1 scored Ready, student 2 scored Close, student 3 scored Close, student 4
scored Ready, student 5 scored Close, and student 6 scored Close. Therefore, student 1 and 4
would scored a Met on PASS and students 2, 3, 5 and 6 would have received a Not Met.

Data Driven Decisions 23
Chapter 5 Discussion
Summary
The purpose of this research study was to determine if providing extra student support in
the area of math would increase student achievement. After a survey, one hundred percent of
teachers at Harbor View Elementary believe a math interventionist should be available for
students who struggle in math. Six students were selected for this study based on their 2014
PASS Math scores. Data was collected throughout the year by MAP, curriculum pretests, post
tests, IXL and AIMS Web along with small group observations. The results are organized and
displayed in tables that provide the reader with valuable information relative to the students’
learning and progress.
Conclusions
When looking at the data, the teacher/researcher perceives growth. In many of the tables
there is a representation of an increase of knowledge and retention. Most of the students
struggled with rounding and identifying the various number forms. The teacher/researcher
observed students struggled with regrouping and borrowing across zero. Judging from pre-
assessments students struggled with basic facts in multiplication and division. The students also
had trouble memorizing multi-step processes. The teacher used acronyms and songs as a way to
make the information repetitious for the students. The teacher also sent home extra practice for
the students to complete for a treat on Friday’s. Most of the students struggled with the

Data Driven Decisions 24
application and with being able to transfer information from a chart to their own paper. Fractions
and decimals were introduced and this concept proved to be one of the hard ones for the students.
Students had trouble grasping the concept of parts of a whole and tenths and hundredths. The last
two units involved memorization and spacial reasoning; students did well with memorizing
different shapes and formulas for perimeter and area. Student performance on unit assessments
was used as a tool to track students’ strengths and weaknesses. Student 1 displays the most
understanding in place value but struggled with patterns. Student 2 did well with geometry and
fractions but struggled with multiplication. Student 3 performed well with division but struggled
with place value and decimals. Student 4 passed every test and received a B average. Student 5
performed the best in division and struggled the most with fractions. Student 6 performed high in
the second part of the year with A’s and B’s but performed poorly with division and place value.
The report card correlation is similar to the student’s unit tests. The teacher/researcher
acknowledges increases and decreases relative to a particular skill.
When the students took AIMS Web, the teacher observed students making careless errors
due to the time constraint, however, gains were present. The ACT scores showed two of the
students performing as Ready which is similar to a Met score on PASS while the other four
students scored Close. Again, most students did not perform well because of the time restraint.
Students had to complete 31 problems in 55 minutes and complete written responses. This does
not compare to PASS because the Palmetto State Standards Assessment was not timed. Although
the goal was to have all the students meet Met there was a different test given so comparisons
may be skewed. The most influential data the researcher collected was the seasonal MAP scores
because one hundred percent of the students showed growth. This in itself should speak loudly.
MAP scores are reliable and show growth for each child.

Data Driven Decisions 25
Recommendations
The following recommendations for further research are made:
1. There is a need to conduct research on intervention effects on male and female ability in
math.
2. This study should include student behavior.
3. This study should include student attendance.
4. This study should include student socio-economic status.
Limitations
One limitation of this study was the end of the year assessment changed from the
previous year. South Carolina’s State Department of Education has no consistency. For the
researcher to conduct an effective study there needs to be reliability of assessments.
Impact on Education
This research proves to be effective. As a result of this study, one hundred percent of the
students made gains in mathematics from receiving small group interventions. Charleston
County needs to provide a math interventionist for every school.

Data Driven Decisions 26
Works Cited
AIMSweb. (2011). “Nevada Elementary School students take achievement to new heights;
school earns coveted Blue Ribbon status after turning to AIMSweb and RTI. Pearson,
pp. 1-2. http://www.aimsweb.com/wp-content/uploads/AIMSweb-Case-Study_Helen-M-
Smith-CCSD.pdf
Buffman, Austin. (2010, October). “The why behind RTI” Educational Leadership, pp. 10-16.
Frost, Robert. (2003, January). “Revelation” Poem Hunters
http://www.poemhunter.com/poem/revelation/
Guskey, Thomas. (2010, October). “Lessons of mastery learning” Educational Leadership,
pp.53-57
Hockett, Jessica. (2014, January). “Turning on the lights: what pre-assessments can do”
Educational Leadership, pp. 50-54.
IXL. (2014, September). “Testimonies” www.ixl.com/testimonials/math
Medoff,Lisa. (2013, September). “Getting beyond I hate math” Educational Leadership, pp. 44-
48.
NWEA. (2012, May). “Mt. Vernon Schools empower students and teachers to succeed by
partnering with NWEA” District level bench and growth marking, pp. 1-2
https://www.nwea.org/resources/district-level-benchmarking-growth/
Scherer, Marge. (2014, March). “The assessor’s art” Educational Leadership, pp. 7
Taylor-Cox, J. (2009). Math intervention: Building number power with formative assessments,
differentiation, and games, Grades 3-5 pp. 1-5. Eye on Education.

Data Driven Decisions 27
Wiersma, W., & Jurs, S.G. (2009). Research and Methods in Education (9th
ed). Boston: Allyn
and Bacon.
Appendix A
Teacher Survey
Do you think a math interventionist would be beneficial at HVES to service students without
IEP’s who need extra support in math? Circle your choice. If no, explain.
Yes No
Student Survey
Open-ended question
What feeling do you get then the teacher says, “Now take out your math books?”
______________________________________________________________________________
______________________________________________________________________________
Rating scale
Math is fun to learn. Agree Not sure Disagree
Math is challenging. Agree Not sure Disagree
Math frightens me. Agree Not sure Disagree

Data Driven Decisions 28
Appendix B
Student Letter
Dear parents,
My name is Ms. Ulichnie and I am a 4th
grade teacher at Harborview Elementary. Your
child has been selected to receive extra support in math during the school day. Math small group
will meet on Monday’s from 2:00- 2:30. My goal is to provide extra practice for the students
while building their confidence in mathematics. We will be reviewing curriculum from their
classroom while spiraling material throughout the year. By signing below you acknowledge
their participation. Thank you; I can’t wait to see their growth!
______________________________ Staci Ulichnie
Signature

Data Driven Decisions 29