Diagnosing gastrointestinal illnesses using fecal ... · World J Gastroenterol 2016 ... Diagnosing...
12
Submit a Manuscript: http://www.wjgnet.com/esps/ Help Desk: http://www.wjgnet.com/esps/helpdesk.aspx DOI: 10.3748/wjg.v22.i4.1639 World J Gastroenterol 2016 January 28; 22(4): 1639-1649 ISSN 1007-9327 (print) ISSN 2219-2840 (online) © 2016 Baishideng Publishing Group Inc. All rights reserved. 1639 January 28, 2016|Volume 22|Issue 4| WJG|www.wjgnet.com REVIEW Diagnosing gastrointestinal illnesses using fecal headspace volatile organic compounds Daniel K Chan, Cadman L Leggett, Kenneth K Wang Daniel K Chan, Cadman L Leggett, Kenneth K Wang, Division of Gastroenterology and Hepatology, Mayo Clinic, Rochester, MN 55905, United States Author contributions: All authors contributed equally to this paper with the conception and design of the study, literature review, analysis, drafting, critical revision, and approval of the final version. Supported by National Institute of Health Grants, No. P30 CA015083, No. U01 CA182940, No. U54 CA163004; and Kathy and Russ Van Cleve Endowment for Gastroenterology Research (all to Wang KK). Conflict-of-interest statement: The eNose Company (Zutphen, NL) provided Aeonose and Aetholab equipment for research use not directly related to this study. No commercial financial support was provided. Daniel Chan and Cadman Leggett have no disclosures. Open-Access: This article is an open-access article which was selected by an in-house editor and fully peer-reviewed by external reviewers. It is distributed in accordance with the Creative Commons Attribution Non Commercial (CC BY-NC 4.0) license, which permits others to distribute, remix, adapt, build upon this work non-commercially, and license their derivative works on different terms, provided the original work is properly cited and the use is non-commercial. See: http://creativecommons.org/ licenses/by-nc/4.0/ Correspondence to: Kenneth K Wang, MD, Division of Gastroenterology and Hepatology, Mayo Clinic, 200 First St SW, Rochester, MN 55905, United States. [email protected] Telephone: +1-507-2842174 Fax: +1-507-2557612 Received: August 8, 2015 Peer-review started: August 10, 2015 First decision: September 29, 2015 Revised: October 11, 2015 Accepted: November 13, 2015 Article in press: November 13, 2015 Published online: January 28, 2016 Abstract Volatile organic compounds (VOCs) emitted from stool are the components of the smell of stool representing the end products of microbial activity and metabolism that can be used to diagnose disease. Despite the abundance of hydrogen, carbon dioxide, and methane that have already been identified in human flatus, the small portion of trace gases making up the VOCs emitted from stool include organic acids, alcohols, esters, heterocyclic compounds, aldehydes, ketones, and alkanes, among others. These are the gases that vary among individuals in sickness and in health, in dietary changes, and in gut microbial activity. Electronic nose devices are analytical and pattern recognition platforms that can utilize mass spectrometry or electrochemical sensors to detect these VOCs in gas samples. When paired with machine-learning and pattern recognition algorithms, this can identify patterns of VOCs, and thus patterns of smell, that can be used to identify disease states. In this review, we provide a clinical background of VOC identification, electronic nose development, and review gastroenterology applications toward diagnosing disease by the volatile headspace analysis of stool. Key words: Electronic nose; Volatile organic compounds; Feces; Mass spectrometry; Odors © The Author(s) 2016. Published by Baishideng Publishing Group Inc. All rights reserved. Core tip: Electronic noses, which include analytical spectrometric platforms and pattern recognition devices, can be used to diagnose disease by analysis of volatile organic compounds generated by the microbiome and the end products of metabolism in the fecal headspace gas. Chan DK, Leggett CL, Wang KK. Diagnosing gastrointestinal
Transcript of Diagnosing gastrointestinal illnesses using fecal ... · World J Gastroenterol 2016 ... Diagnosing...
Submit a Manuscript: http://www.wjgnet.com/esps/Help Desk: http://www.wjgnet.com/esps/helpdesk.aspxDOI: 10.3748/wjg.v22.i4.1639
World J Gastroenterol 2016 January 28; 22(4): 1639-1649 ISSN 1007-9327 (print) ISSN 2219-2840 (online)
© 2016 Baishideng Publishing Group Inc. All rights reserved.
1639 January 28, 2016|Volume 22|Issue 4|WJG|www.wjgnet.com
REVIEW
Diagnosing gastrointestinal illnesses using fecal headspace volatile organic compounds
Daniel K Chan, Cadman L Leggett, Kenneth K Wang
Daniel K Chan, Cadman L Leggett, Kenneth K Wang, Division of Gastroenterology and Hepatology, Mayo Clinic, Rochester, MN 55905, United States
Author contributions: All authors contributed equally to this paper with the conception and design of the study, literature review, analysis, drafting, critical revision, and approval of the final version.
Supported by National Institute of Health Grants, No. P30 CA015083, No. U01 CA182940, No. U54 CA163004; and Kathy and Russ Van Cleve Endowment for Gastroenterology Research (all to Wang KK).
Conflict-of-interest statement: The eNose Company (Zutphen, NL) provided Aeonose and Aetholab equipment for research use not directly related to this study. No commercial financial support was provided. Daniel Chan and Cadman Leggett have no disclosures.
Open-Access: This article is an open-access article which was selected by an in-house editor and fully peer-reviewed by external reviewers. It is distributed in accordance with the Creative Commons Attribution Non Commercial (CC BY-NC 4.0) license, which permits others to distribute, remix, adapt, build upon this work non-commercially, and license their derivative works on different terms, provided the original work is properly cited and the use is non-commercial. See: http://creativecommons.org/licenses/by-nc/4.0/
Correspondence to: Kenneth K Wang, MD, Division of Gastroenterology and Hepatology, Mayo Clinic, 200 First St SW, Rochester, MN 55905, United States. [email protected]: +1-507-2842174Fax: +1-507-2557612
Received: August 8, 2015Peer-review started: August 10, 2015First decision: September 29, 2015Revised: October 11, 2015Accepted: November 13, 2015 Article in press: November 13, 2015Published online: January 28, 2016
AbstractVolatile organic compounds (VOCs) emitted from stool are the components of the smell of stool representing the end products of microbial activity and metabolism that can be used to diagnose disease. Despite the abundance of hydrogen, carbon dioxide, and methane that have already been identified in human flatus, the small portion of trace gases making up the VOCs emitted from stool include organic acids, alcohols, esters, heterocyclic compounds, aldehydes, ketones, and alkanes, among others. These are the gases that vary among individuals in sickness and in health, in dietary changes, and in gut microbial activity. Electronic nose devices are analytical and pattern recognition platforms that can utilize mass spectrometry or electrochemical sensors to detect these VOCs in gas samples. When paired with machine-learning and pattern recognition algorithms, this can identify patterns of VOCs, and thus patterns of smell, that can be used to identify disease states. In this review, we provide a clinical background of VOC identification, electronic nose development, and review gastroenterology applications toward diagnosing disease by the volatile headspace analysis of stool.
Key words: Electronic nose; Volatile organic compounds; Feces; Mass spectrometry; Odors
© The Author(s) 2016. Published by Baishideng Publishing Group Inc. All rights reserved.
Core tip: Electronic noses, which include analytical spectrometric platforms and pattern recognition devices, can be used to diagnose disease by analysis of volatile organic compounds generated by the microbiome and the end products of metabolism in the fecal headspace gas.
Chan DK, Leggett CL, Wang KK. Diagnosing gastrointestinal

illnesses using fecal headspace volatile organic compounds. World J Gastroenterol 2016; 22(4): 1639-1649 Available from: URL: http://www.wjgnet.com/1007-9327/full/v22/i4/1639.htm DOI: http://dx.doi.org/10.3748/wjg.v22.i4.1639
INTRODUCTIONMedical perception of smell Fundamental to a clinician’s diagnostic ability is our mastery of the five senses of perception: sight, sound, touch, taste, and smell. Throughout the history of medicine, the ability to maximize the use of these senses has been ever evolving. Sight is the most often utilized sense with advanced medical imaging, such as computed tomography and magnetic resonance imaging, which allows us to look beyond the superficial to peer deep within the human body. However, smell has long been used to detect disease. Hippocrates, the father of medicine, characterized the pungent stench of melena as early as 400 BCE[1]. Traditional Chinese and Arab physicians noted distinct urinary scents in diseases such as diabetes[2]. In the late 19th century, Nobel laureate Robert Koch, the father of germ theory, identified distinctive smells associated with cultured microorganisms and infected wounds[2,3]. In 1971, Nobel laureate Linus Pauling, with the use of analytical tools, quantified volatile organic compounds (VOCs) emitted off a sample of breath and urine vapor, launching a new era of volatile and smell research[4].
In 1989, Williams and Pembroke[5] reported an unusual case of a patient with melanoma that was diagnosed through smell by a canine. This case was unique as it was diagnosed by the patient’s dog, which continuously sniffed at a suspicious lesion on her leg, and one day attempted to bite it off. This led to numerous canine trials in which dogs were successfully trained to detect colorectal cancer[6], lung and breast cancer[7], ovarian cancer[8], bladder cancer[9], and, most recently, thyroid cancer[10] by merely smelling patients and their samples that they provide. Canines are thought to genetically possess 20 times as many olfactory receptors as humans[11], and it is undisputed that the canine’s perception of smell far surpasses that of humans.
Perhaps our limited sense of smell as humans has prevented us from directly smelling and diagnosing disease. The smell of Clostridium difficile (C. difficile)-infected stool has been thought to be distinct enough for human diagnoses, and initial studies suggested that healthcare workers were able to distinguish this malady. In one study, a questionnaire was given to 138 nurses whose patients’ stool samples had been tested for C. difficile. Based on responses, the staff were able to discern C. difficile-infected stool with 55% sensitivity and 83% specificity, with a negative predictive value of 92%[12]. A similar study found that nursing staff correctly identified C. difficile in 31 of 37 cases, with
a sensitivity of 84% and a specificity of 77%[13]. A canine study fared even better, with a trained beagle achieving 83% sensitivity and 98% specificity in identifying 25 of 30 cases of C. difficile and 265 of 270 controls in the hospital setting[14]. Ultimately however, prior human studies detecting C. difficile by odor were criticized for unblinded study designs. In a controlled study, 18 nurses who evaluated 10 stool samples (5 C. difficile-positive and 5 C. difficile-negative) outside of a clinical context performed no better than by chance alone. Their sensitivity was 26% and specificity 69%. Furthermore, there was no correlation with the level of confidence or the years of nursing experience with predictive outcome[15].
Clearly, our innate sense of smell may be the weakest of our perceptive abilities for medical diagnosis. However, through technological advances in the past few decades, there have been recent developments in tools to extend our ability to smell.
Volatile analytical platforms The modern era of gas analysis and odor detection started with the advent of combination gas chroma-tography and mass spectrometry (GC-MS) in the early 1950s[16,17]. In 1952, Nobel laureate Archer John Porter Martin described the process of GC, which is a chromatographic process of separating gases through a liquid-gas interface. Using an absorbent column coated with a liquid sample (known as the stationary phase), an inert carrier gas such as nitrogen is used to help carry gases from the stationary phase in a heated column (the mobile phase). Over time, gases vaporize at different rates, and the retention time, or the difference in time that a gas leaves the column, can be used to analyze its composition[16]. When coupled to a mass spectrometer, different gases within the sample can be individually identified.
The process of quadrupole mass spectrometry was described by Nobel laureate Wolfgang Paul in 1953. This technique uses four metal rods that generate a varying electromagnetic field surrounding an ion path passing between these metal rods. Ions such as those generated from a preceding GC sample can be separated by their mass-to-charge (m/z) ratios, as only certain ions at a given quadrupole setting can successfully pass through this mass filter to reach a detector, while others collide with the metal rods (Figure 1). A detector can separate the ions as peaks based on mass-to-charge ratio, which can thus be used to identify the composition of samples by comparing against a library of standards[17,18].
Initial limitations of GC-MS included the inability to adequately capture VOCs, which often escaped into the atmosphere at the time of collection. In 1971, Linus Pauling developed a cryogenic trap to condense volatiles using liquid nitrogen and was able to first successfully quantify VOCs on the breath and urine[4]. In the following years, absorptive fibers were
Chan DK et al . Diagnosing gastrointestinal illnesses using fecal headspace
1640 January 28, 2016|Volume 22|Issue 4|WJG|www.wjgnet.com

developed for use in solid phase microextraction (SPME), which skips the use of a liquid phase, and is now commonly used to trap VOCs for subsequent desorption and mass spectrometry[3].
GC-MS is not without its limitations, however, as it is fraught with complexity, requires trained personnel, has a high capital and operating cost, and as such has not ever fully developed into a mainstream medical diagnostic tool[19]. Indeed, at our institution, clinical GC-MS for VOC detection is used today only by toxico-logy to evaluate for volatile alcohols. In an effort to overcome the barriers of GC-MS, new modifications to ionization techniques have allowed for performance of real-time or online mass spectrometry. These platforms have simplified the workflow to allow for direct sample acquisition to minimize VOC loss and include such techniques as proton-transfer-reaction MS (PTR-MS), selected ion flow tube MS (SIFT-MS), ion-molecule reaction spectrometry (IMR-MS), secondary electrospray ionization MS (SESI-MS), and field-asymmetric ion mobility spectrometry (FAIMS)[20-23]. These newer techniques build on the principle of MS, and vary the ionization methods and ion interactivity to measure and identify volatiles without pre-concen-tration or separation steps.
PTR-MS uses H3O+ as a primary ion source that is mixed with a continuously provided sample of air. Gases that have a proton affinity greater than water will accept the proton. This has the advantage of not requiring pre-concentration and separation of the target gas, as well as not being affected by high concentrations of N2, CO2, O2, or H2O, which is common in breath samples[24]. SIFT-MS also utilizes a proton-transfer reaction for ionization; however, it uses NO+ and O2
+ in addition to H3O+ as primary ions to allow for further resolution and increased specificity of volatiles. This is achieved by evaluating differences in interactivity with respective selected ions among
compounds that would otherwise have overlapping mass-to-charge ratios with H3O+ alone. SIFT-MS also provides rapid identification of volatiles within seconds of analysis, which is particularly suited for real-time breath analysis[25].
Ion molecule reaction spectrometry (IMR-MS) has been used in breath and gas analysis because of its ionization method that reduces sample fragmentation. By using electrostatic lenses, IMR-MS can filter for ions generated from the primary ion source, such as krypton or xenon, to have kinetic energy below a threshold of fragmenting potential analyte gases. With initial MS ionization techniques, high kinetic energy imparted in the process caused fragmentation of samples, which would generate complex compounds with overlapping mass-to-charge peaks and be unsuitable for complex volatile analysis. IMR-MS is a soft ionization technique that reduces fragmentation[26]. Electrospray ionization (ESI) is used in SESI-MS and is likewise a soft ionization mass spectrometry technique that initially used a radioactive source of ionized gas, which has since been adapted for use with a non-radioactive source[27].
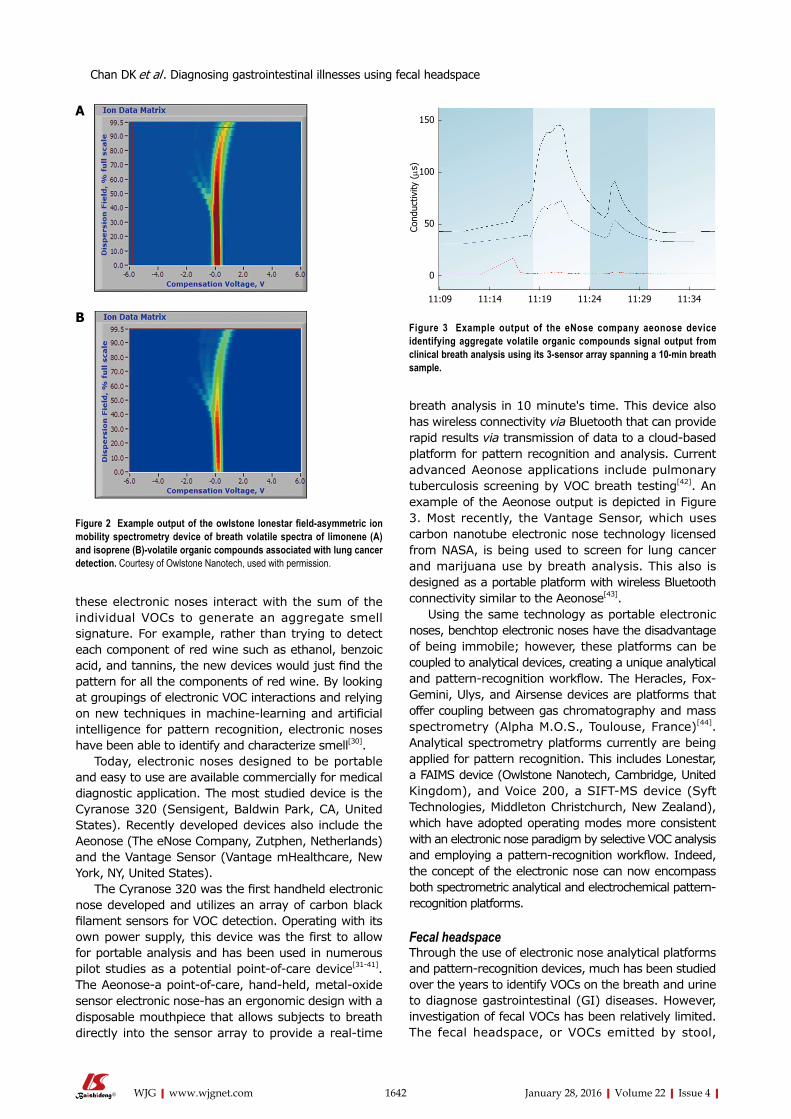
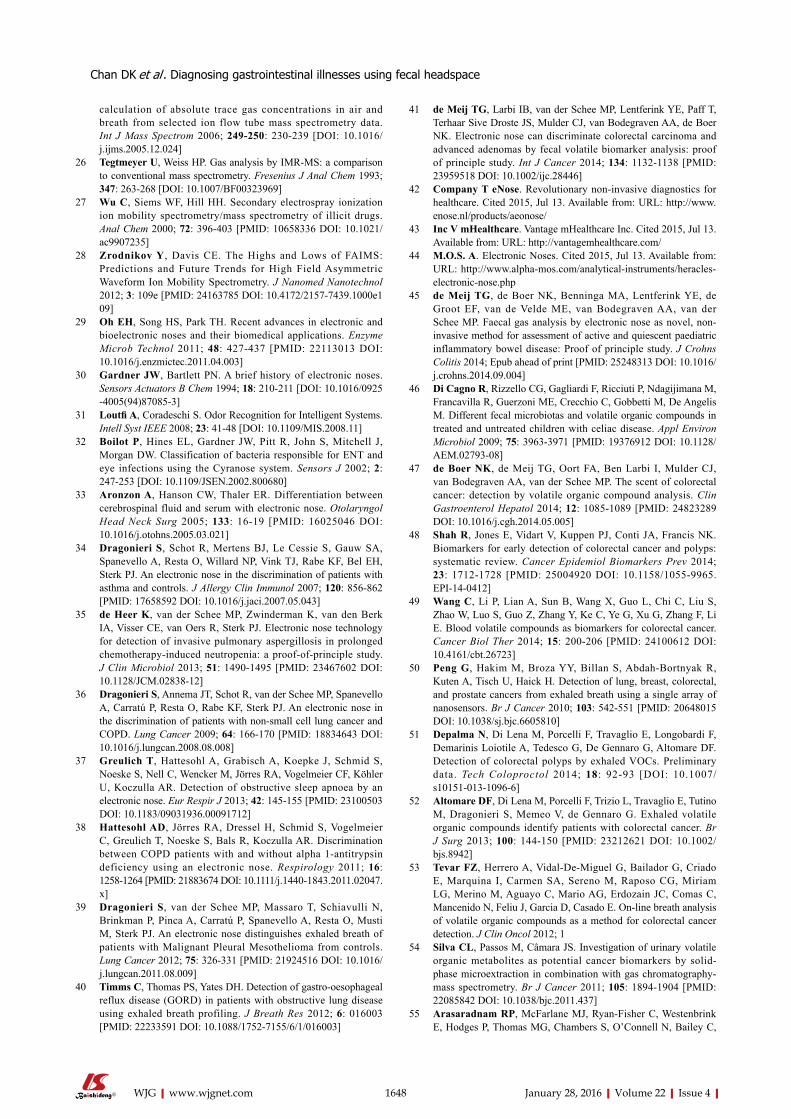
Finally, ion mobility spectrometry (IMS), which can be used with SESI and MS, is also a method that separates gases based on travel time within a drift tube that measures an ion’s drift velocity in a carrier gas against an electric field gradient. FAIMS utilizes this principle, but also applies an asymmetric electric field gradient to displace an ion toward an electrode. By applying a certain voltage, this deflection can be corrected, and the ion reaches the detector. The required voltage to correct a deflection can be used to identify volatiles based on the ion’s mobility coefficient. This property is consistent at atmospheric pressure and allows for ambient analysis of volatiles, a useful property for the potential capability of handheld or portable application[28]. An example of FAIMS output from the Owlstone (Cambridge, United Kingdom) Lonestar device is depicted in Figure 2.
Electronic noseA wide variety of analytical spectrometric devices are commercially available; however, the capital cost and the technical training required to operate these devices make their use within clinical medicine generally limited to large research centers. In an effort to create machine olfaction that more closely resembles canine and human olfaction and one that may be more widely applied, developers in the 1980s turned to using electronic sensors to nonspecifically capture and characterize VOCs in patterns[29]. In 1994, Gardner et al[30] defined the term electronic nose as an instrument composed of an array of electronic chemical sensors with partial specificity and a pattern-cognition system capable of recognizing simple or complex odors. Conceptually, instead of attempting to capture and analyze individual gases as with mass spectrometry,
1641 January 28, 2016|Volume 22|Issue 4|WJG|www.wjgnet.com
Figure 1 Quadrupole mass filter schematic: ionized gas enters the quadrupole through a slit and interacts with charged metal poles. Based on mass and charge, different ionized gases successfully pass through a second slit to a detector that measures the mass-to-charge ratio of the ionized gas (solid arrow), while other ionized gases will collide with metal rods and will not reach the detector (dotted line and asterisk).
Ionized gas
To detector
Chan DK et al . Diagnosing gastrointestinal illnesses using fecal headspace
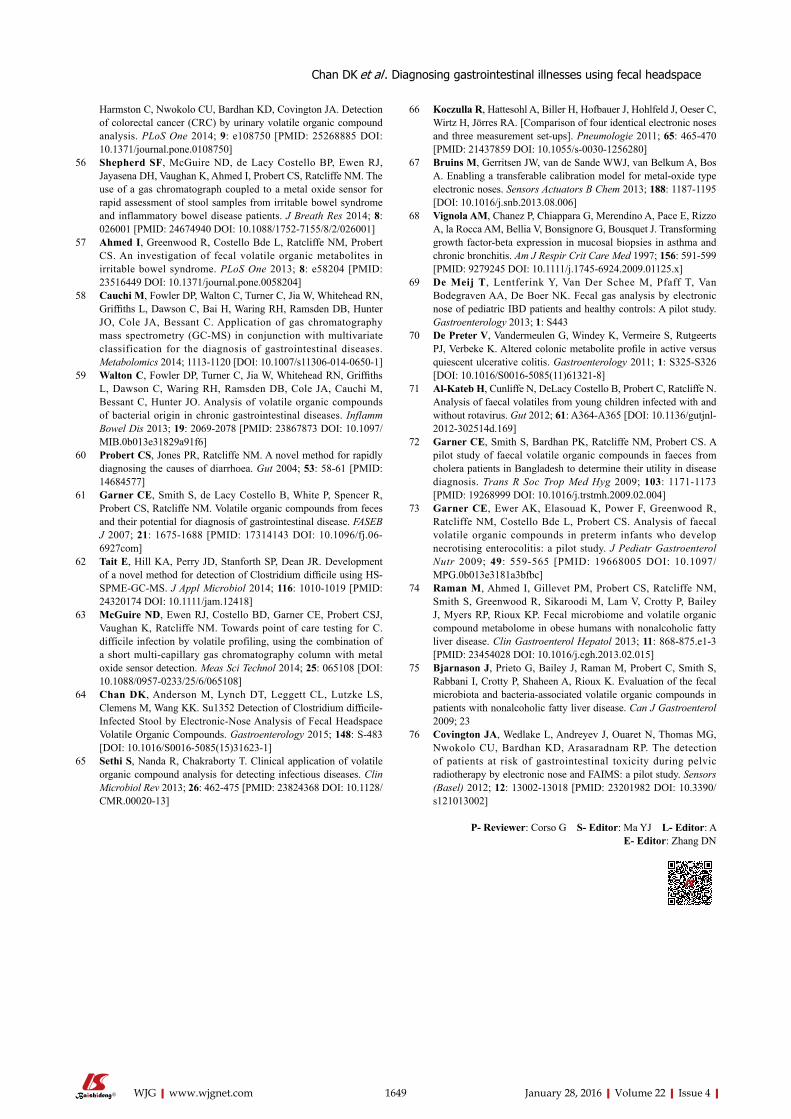
breath analysis in 10 minute's time. This device also has wireless connectivity via Bluetooth that can provide rapid results via transmission of data to a cloud-based platform for pattern recognition and analysis. Current advanced Aeonose applications include pulmonary tuberculosis screening by VOC breath testing[42]. An example of the Aeonose output is depicted in Figure 3. Most recently, the Vantage Sensor, which uses carbon nanotube electronic nose technology licensed from NASA, is being used to screen for lung cancer and marijuana use by breath analysis. This also is designed as a portable platform with wireless Bluetooth connectivity similar to the Aeonose[43].
Using the same technology as portable electronic noses, benchtop electronic noses have the disadvantage of being immobile; however, these platforms can be coupled to analytical devices, creating a unique analytical and pattern-recognition workflow. The Heracles, Fox-Gemini, Ulys, and Airsense devices are platforms that offer coupling between gas chromatography and mass spectrometry (Alpha M.O.S., Toulouse, France)[44]. Analytical spectrometry platforms currently are being applied for pattern recognition. This includes Lonestar, a FAIMS device (Owlstone Nanotech, Cambridge, United Kingdom), and Voice 200, a SIFT-MS device (Syft Technologies, Middleton Christchurch, New Zealand), which have adopted operating modes more consistent with an electronic nose paradigm by selective VOC analysis and employing a pattern-recognition workflow. Indeed, the concept of the electronic nose can now encompass both spectrometric analytical and electrochemical pattern-recognition platforms.
Fecal headspaceThrough the use of electronic nose analytical platforms and pattern-recognition devices, much has been studied over the years to identify VOCs on the breath and urine to diagnose gastrointestinal (GI) diseases. However, investigation of fecal VOCs has been relatively limited. The fecal headspace, or VOCs emitted by stool,
these electronic noses interact with the sum of the individual VOCs to generate an aggregate smell signature. For example, rather than trying to detect each component of red wine such as ethanol, benzoic acid, and tannins, the new devices would just find the pattern for all the components of red wine. By looking at groupings of electronic VOC interactions and relying on new techniques in machine-learning and artificial intelligence for pattern recognition, electronic noses have been able to identify and characterize smell[30].
Today, electronic noses designed to be portable and easy to use are available commercially for medical diagnostic application. The most studied device is the Cyranose 320 (Sensigent, Baldwin Park, CA, United States). Recently developed devices also include the Aeonose (The eNose Company, Zutphen, Netherlands) and the Vantage Sensor (Vantage mHealthcare, New York, NY, United States).
The Cyranose 320 was the first handheld electronic nose developed and utilizes an array of carbon black filament sensors for VOC detection. Operating with its own power supply, this device was the first to allow for portable analysis and has been used in numerous pilot studies as a potential point-of-care device[31-41]. The Aeonose-a point-of-care, hand-held, metal-oxide sensor electronic nose-has an ergonomic design with a disposable mouthpiece that allows subjects to breath directly into the sensor array to provide a real-time
1642 January 28, 2016|Volume 22|Issue 4|WJG|www.wjgnet.com
Figure 2 Example output of the owlstone lonestar field-asymmetric ion mobility spectrometry device of breath volatile spectra of limonene (A) and isoprene (B)-volatile organic compounds associated with lung cancer detection. Courtesy of Owlstone Nanotech, used with permission.
B
A
Figure 3 Example output of the eNose company aeonose device identifying aggregate volatile organic compounds signal output from clinical breath analysis using its 3-sensor array spanning a 10-min breath sample.
150
100
50
0
Cond
uctiv
ity (ms
)
11:09 11:14 11:19 11:24 11:29 11:34
Chan DK et al . Diagnosing gastrointestinal illnesses using fecal headspace

represents a unique intersection of the final pathways of nutrition and digestion, normal and pathologic metabolism, and activity of the gut microbiome, which increasingly has been thought to be associated with disease.
lITeRaTURe ReseaRChIn a review of the literature from 2000 through 2014 of VOC analysis of fecal headspace, we identified 23 studies after searching databases including EMBASE, IEEE, MEDLINE, PubMed, Scopus, and Web of Science for terms inclusive of “gastrointestinal disease,” “electronic nose,” and “fecal headspace,” or “stool.” Overwhelmingly, these studies were able to separate out healthy control and disease states, and most impressively in the cases of inflammatory bowel disease (IBD) and celiac disease, able to also discern between active and quiescent disease[45,46]. The following section examines the GI conditions distinguishable by fecal headspace VOC analysis.
IDeNTIFICaTION OF GasTROeNTeROlOGICal CONDITIONsColorectal cancerChanges in the colonic microbiome in the setting of advanced adenoma and colorectal cancer (CRC) are thought to create distinct volatile environments likely due to bacterial dysbiosis[47]. VOC detection proved to be one of the most reliable screening methods for early CRC detection when compared to other biomarkers, including tissue DNA and protein biomarkers[48]. This observation was based on a canine study, in which a Labrador retriever specially trained in scent detection evaluated watery stool samples from 37 individuals with CRC, and detected CRC with 91% sensitivity and 99% specificity compared to colonoscopy[6]. In an electronic nose-based study, De Meij et al[41] were able to discriminate between advanced adenomas and CRC. Of the stool samples collected from 157 patients, 40 had CRC, 60 had advanced adenomas, and 57 were healthy controls (Table 1). Using a Cyranose 320 electronic nose device, they were able to distinguish CRC patients from healthy controls with 85% sensitivity and 87% specificity, and for advanced adenomas from healthy controls, 62% sensitivity and
86% specificity.Identification of specific stool VOC biomarkers has
yet to be established. In contrast to other specimens, numerous volatiles have been identified with CRC in blood[49], breath[50-53], and urine[54,55]. Whether these volatiles are the result of microbiome changes in the setting of advanced adenoma or CRC, or as a direct metabolic byproduct, remains to be determined.
IBD and irritable bowel syndromeAnalysis of patients with IBD, including Crohn disease (CD) and ulcerative colitis (UC), has been the most studied application of fecal headspace analysis. These studies were able to identify the presence of IBD, and even more impressively, were able to distinguish with up to 90% to 100% accuracy the degree of disease activity associated with IBD[45] (Table 2). Furthermore, the often clinically indistinguishable irritable bowel syndrome (IBS) could be separated from IBD with a sensitivity of 76% and specificity of 88% for distinguishing IBD in one study[56]; another study showed 96% sensitivity and 80% specificity that active IBD could be distinguished from inactive CD and UC individually and grouped[57].
Cauchi et al[58] studied CD, UC, and IBS patients as a group and analyzed samples of serum, breath, urine, and stool for headspace analysis using GC-MS. They found that CD was the most distinguishable among these conditions, and that fecal headspace was the best specimen type to assess for disease activity. The differences found among specimens were so pronounced in favor of fecal headspace analysis that they suggested future CD volatile studies be directed solely at the fecal headspace.
Walton et al[59] also used GC-MS to characterize the fecal headspace of patients with active CD, UC, and IBS and found elevated concentrations of ester, indole, and alcohols of short-chain fatty acids in CD patients with active disease. Once treated, these CD patients assumed profiles more consistent with healthy controls. It is postulated that these VOC changes reflect the immunologic attack and subsequent dysbiosis of microbiota in active CD. Direct speciation and pathogenesis of these observed increases in VOCs as in CRC remain to be determined.
In individuals with IBS, it is speculated that overpopulation of unfavorable bacteria may induce abnormal bacterial fermentation, causing symptoms
1643 January 28, 2016|Volume 22|Issue 4|WJG|www.wjgnet.com
Table 1 Diagnosis of colorectal cancer by fecal volatile organic compounds detection
Ref. Year Category Disease (:control) AUC Accuracy Sensitivity Specificity Sample No. Control No.
de Meij et al[41] 2014 Colorectal cancer Advanced adenomas 0.79 - 62% 86% 60 57de Meij et al[41] 2014 Colorectal cancer Colorectal cancer 0.92 - 85% 87% 40 57de Meij et al[41] 2014 Colorectal cancer Colorectal cancer: Advanced Adenomas 0.92 - 75% 73% 40 57de Meij et al[41] 2014 Colorectal cancer Advanced adenomas + colorectal cancer 0.92 - 85% 68% 40 57Colorectal cancer pooled mean: 0.89 - 77% 79% - -
If no control is specified, the comparison is against a healthy control.
Chan DK et al . Diagnosing gastrointestinal illnesses using fecal headspace

of gas, bloating, abdominal discomfort, and diarrhea. In 2013, Ahmed et al[57] conducted a study using GC-MS that showed that VOCs from individuals with IBS were distinctly different from healthy individuals and those with IBD. A higher number of esters and organic acids were noted in the IBS group, compared to those with CD who demonstrated an increased number of aldehydes. Physiologically, changes of esters and organic acids are thought to be due to altered microbial interaction with dietary substances; however, aldehydes were observed as a byproduct of inflammation that correlated with IBD and not with IBS. This study was able to distinguish a difference between IBS patients and healthy controls with a level of accuracy approaching 94%.
Contrary to Ahmed et al[57]’s observations however, Walton et al[59] also characterized the fecal VOCs of IBS patients to healthy controls, as well as to CD and UC patients, but found no statistically significant differences in VOC concentrations. Other recent studies could not reliably distinguish IBS from healthy controls, with sensitivities only in the 50% range[56,58] (Table 3).
These findings support that metabolic, microbial,
and inflammatory changes all play a role in IBD. The lack of inflammatory changes in IBS may be a distinguishing factor for VOC identification of IBS; however, the discordant results between IBS and healthy controls suggest that further studies are needed. VOC analysis of CD patients suggests strong evidence of a fecal headspace correlation with inflammation, microbial response, and disease quiescence and inflammation resolution.
Infectious diarrheaMicroorganisms responsible for causing infectious diarrhea that have been identified by fecal headspace analysis include C. difficle, Campylobacter jejuni, Vibrio cholera, and Rotavirus (Table 4). Of these, C. difficle has been the most studied of the group. In 2004, Probert et al[60] used GC-MS to rapidly identify VOC profiles associated with C. difficile, C. jejuni, and Rotavirus. C. difficile-infected stool was found to be associated with furan species, which was thought to be due to Clostridia species fermenting fructose and producing furanose. C. jejuni-infected stool had an abundance of phenols, indoles, and organic acids, and
1644 January 28, 2016|Volume 22|Issue 4|WJG|www.wjgnet.com
Table 2 Diagnosis of inflammatory bowel disease by fecal volatile organic compounds detection
Ref. Year Category Disease (:control) AUC Accuracy Sensitivity Specificity Sample No. Control No.
Shepherd et al[56] 2014 IBD IBD:IBS - - 76% 88% 102 135Shepherd et al[56] 2014 IBD IBD - - 79% - 135 138Cauchi et al[58] 2014 IBD Crohn disease 0.97 85% 93% 78% 24 20Cauchi et al[58] 2014 IBD Ulcerative colitis 0.54 58% 43% 69% 19 20de Meij et al[45] 2014 IBD Crohn disease, active 0.85 - 86% 67% 29 28de Meij et al[45] 2014 IBD Crohn disease, remission 0.94 - 94% 94% 29 28de Meij et al[45] 2014 IBD Ulcerative colitis, active 1.00 - 100% 100% 26 28de Meij et al[45] 2014 IBD Ulcerative colitis, remission 0.94 - 94% 94% 26 28de Meij et al[45] 2014 IBD Crohn disease, active:ulcerative colitis, active 0.96 - 97% 92% 29 26de Meij et al[45] 2014 IBD Crohn disease, remission:ulcerative colitis,
remission0.81 - 88% 72% 29 26
Walton et al[59] 2013 IBD Crohn disease - - - - 22 19Walton et al[59] 2013 IBD Ulcerative colitis - - - - 20 19de Meij et al[69] 2013 IBD Crohn disease 0.98 - 92% 100% 9 10de Meij et al[69] 2013 IBD Ulcerative colitis 0.75 - 75% 77% 10 10De Preter et al[70] 2011 IBD IBD - - - - 11 11Garner et al[61] 2007 IBD Ulcerative colitis - - 96% - 18 30IBD pooled mean: 0.87 72% 86% 85% - -
If no control is specified, the comparison is against a healthy control. IBD: Inflammatory bowel disease; IBS: Irritable bowel syndrome; AUC: Area under the curve.
Table 3 Diagnosis of irritable bowel syndrome by fecal volatile organic compounds detection
Ref. Year Category Disease (:control) AUC Accuracy Sensitivity Specificity Sample No. Control No.
Shepherd et al[56] 2014 IBS IBS - - 54% - 104 137Cauchi et al[58] 2014 IBS IBS 0.63 61% 51% 71% 28 20Ahmed et al[57] 2013 IBS IBS-D:Crohn disease 0.97 - 94% 82% 62 30Ahmed et al[57] 2013 IBS IBS-D:ulcerative colitis 0.96 - 96% 80% 48 30Ahmed et al[57] 2013 IBS IBS-D:active IBD 0.98 - 96% 80% 30 110Ahmed et al[57] 2013 IBS IBS-D 0.94 - 90% 80% 30 109Walton et al[59] 2013 IBS IBS - - - - 26 19Irritable bowel syndrome pooled mean: 0.90 61% 80% 79% - -
If no control is specified, the comparison is against a healthy control. IBD: Inflammatory bowel disease; IBS: Irritable bowel syndrome; D: Diarrhea predominant; AUC: Area under the curve.
Chan DK et al . Diagnosing gastrointestinal illnesses using fecal headspace

Rotavirus-infected stool had a ubiquitous association with ethyl dodecanoate, though its connection with the virus is unclear.
In 2007, Garner et al[61] used GC-MS to identify VOCs produced in patients with UC, C. jejuni, and C. difficile infections. There were 297 volatiles identified, 44 of which were conserved between 80% of subjects. About 60% of VOCs were conserved over a 2-wk period, suggesting that a portion of VOCs were generated irrespective of day-to-day changes in diet and likely represented production of resident microbiota. Between disease groups and healthy donors, VOCs were distinctly different. Interestingly, there were decreased total VOCs in patients with C. difficile (149), C. jejuni (183), and UC (145) compared to controls. It is hypothesized that, due to shorter transit time in disease states, perhaps less VOC biosynthesis occurs in these conditions. Because of the wide array of VOCs identified, selected compounds were used as biomarkers for discriminant analysis to cluster samples into each disease state. This led to a classification with about 96% sensitivity. This study demonstrated that measured fecal VOCs likely do not represent individual end-products of the disease organism, but rather the composite microenvironment generated by infection from this organism. It also suggested that the headspace volatile environment is indeed very complex, and that single biomarker approaches to identify disease are likely oversimplified.
To challenge this notion however, Tait et al[62] developed a method to process stool using SPME and GC-MS to identify a specific volatile: 2-fluoro-4-methylphenol. This VOC was produced in C. difficile-positive samples after a processing protocol that required alcohol shocking of stool samples with 0.5 mL of stool mixed with 0.5 mL of 95% ethanol for 30 min. This was followed by centrifugation at 13000 g and removal of ethanol, and inoculation of solid residue into 10 mL of meat broth to culture overnight to elicit VOC production. Despite promising results demonstrating 83% sensitivity and 100% specificity as a single biomarker, the process described required 18 h, which is outmoded by relatively rapid and currently
available PCR-based testing and newer application of electronic nose devices.
With an understanding that VOCs are more optimally recognized in aggregation, recent studies have turned to identifying aggregate patterns of VOCs using electronic nose devices. Rather than relying on GC-MS to identify individual compounds, electronic noses distinguish aggregate patterns of VOCs for pattern recognition of disease states. In 2014, McGuire et al[63] used an electronic nose with gas chromatography and applied their findings through an artificial neural network for pattern recognition, discriminating C. difficile-positive and negative stool with 85% sensitivity and 80% specificity. In our own experience, we used the Aetholab, a commercial electronic nose device (The eNose Company, Zutphen, Netherlands) in a preliminary study of 20 C. difficile PCR-positive stool and 53 C. difficile PCR-negative stool. In a similar approach using an artificial neural network for pattern recognition, we were able to classify the stool with 80% sensitivity, 85% specificity, and 84% accuracy[64].
Other GI conditionsAn assortment of other GI conditions also has been assessed using fecal headspace analysis, including celiac disease, nonalcoholic fatty liver disease, necrotizing enterocolitis, and pelvic radiation toxicity. These pilot studies are presented in Table 5. Di Cagno et al[46] most notably demonstrated that the efficacy of celiac disease control based on gluten-free diets modulated the intestinal microbiota and subsequent fecal VOC profiles, correlated using bacterial 16S-DNA sequencing. This important observation suggests that dietary consumption may not only have a direct influence on fecal microbiota, but also on the subsequent VOCs detectable in the headspace of stool.
DIsCUssIONThe experience of fecal VOC analysis thus far has been represented prototypically by studies in C. difficile. Initial analytical discrimination with studies using
1645 January 28, 2016|Volume 22|Issue 4|WJG|www.wjgnet.com
Table 4 Diagnosis of infectious diarrhea by fecal volatile organic compounds detection
Ref. Year Category Disease (:control) AUC Accuracy Sensitivity Specificity Sample No. Control No.
McGuire et al[63] 2014 Diarrhea Clostridium difficile - 83% 85% 80% 50 50Tait et al[62] 2013 Diarrhea Clostridium difficile - - 83% 100% 77 23Al-Kateb et al[71] 2012 Diarrhea Rotavirus - - - - 27 53Garner et al[72] 2009 Diarrhea Vibrio cholera - - - - 6 3Garner et al[61] 2007 Diarrhea Clostridium difficile - - 96% - 22 30Garner et al[61] 2007 Diarrhea Campylobacter jejuni - - 96% - 31 30Probert et al[60] 2004 Diarrhea Clostridium difficile - - 83% 97% 6 6Probert et al[60] 2004 Diarrhea Campylobacter - - 100% 92% 5 6Probert et al[60] 2004 Diarrhea Rotavirus - - 100% 97% 5 6Probert et al[60] 2004 Diarrhea Non-Rota enteritis - - 63% 96% 19 6Diarrhea pooled mean: - 83% 88% 94% - -
If no control is specified, the comparison is against a healthy control. AUC: Area under the curve.
Chan DK et al . Diagnosing gastrointestinal illnesses using fecal headspace

GC-MS have helped characterize VOCs to allow for greater understanding of C. difficile and its effect on the microbiome and fecal headspace[60,61]. Once these VOCs were identified in initial studies, further studies using electronic nose approaches have abstracted aggregate VOCs for pattern recognition[63,64]. This has provided a demonstration of a potential workflow to create a VOC diagnostic method from bench analysis toward a point-of-care electronic nose application.
Analytical devices using GC-MS and newer mass spectrometry techniques remain the gold standard in reproducibly identifying specific VOCs. However, numerous platform-dependent limitations remain a barrier for clinical adoption. GC-MS is expensive, requires significant technical expertise to operate, requires offline sampling, and is relatively slow and immobile. Newer mass spectrometry techniques add advantages of online or potential real-time sample acquisition; however, they remain relatively expensive and often sacrifice precision in VOC profiling as a trade-off for online operability[65].
Electronic nose devices have the advantage of being portable, easy to use, relatively inexpensive, suitable for point-of-care use, and more rapid in operation[65]. For example, the Aetholab electronic nose device (The eNose Company, Zutphen, The Netherlands) was used by our group for C. difficile fecal headspace analysis. This runs samples over 20-min cycles. We have performed breath testing with the Aeonose (The eNose Company, Zutphen, The Netherlands), a hand-held electronic nose unit, which samples breath in real-time and operates over 10-min cycles.
Although the processing is rapid, electronic noses also have limitations. Because of their reliance on electronic sensors that interact with aggregate VOCs through various electrochemical reactions, this puts them at risk for variances in sensor performance or even manufacture or calibration. Because of numerous sensor types, and thus different signal responses per type of device, findings from one electronic nose are not comparable to that of a different device or sensor type[65]. In fact, questions about reliability even among devices of the same sensor type and model have
been raised (i.e., variances in operating or testing conditions, sensor drift)[66].
Some of these limitations are being overcome by controlling design variance, developing transferable calibration models between devices to allow for standardization of signals, and to allow inter-operability between electronic noses of the same sensor type. This limitation has not been overcome between different sensor types, however, which limits the generalizability of electronic nose-generated data to specific device models[67]. Furthermore, operating environment and testing conditions pose great variability that may directly influence the VOC production of the samples themselves.
Garner et al[62] tested for C. difficile in samples processed using GC-MS, and recovered similar VOCs from frozen stool after seven days’ time. In our studies, batches of C. difficile PCR-positive and PCR-negative stool were assessed on a weekly basis for 4 wk. After two freeze-thaw cycles (freezing at - 20 ℃, with ambient rewarming to room temperature), VOCs became difficult to detect on Aetholab testing. While the compounds of the stool itself remained intact, the active metabolic byproducts within the microbiota of the stool were halted with freezing, and likely did not recover with thawing.
Our observations suggest that the aggregate VOCs tested for C. difficile infection were not likely due to C. difficile itself, but rather to the microbial community surrounding a C. difficile-infected individual. As such, sample handling, storage, processing, and even buffering should take into account the likelihood that VOC analysis may be a representation of a living signal rather than a static compositional signal. Experimental design and controlling sample acquisition play a significant role in the reproducibility and reliability of VOC detection in the headspace of stool.
Finally, with regard to pattern recognition, machine learning, and validation, the advent of new analytical techniques (such as artificial neural networks) that have made multivariate VOC biomarker association possible comes with a risk of over-fitting large data sets, which may generate spurious associations[68].
1646 January 28, 2016|Volume 22|Issue 4|WJG|www.wjgnet.com
Table 5 Diagnosis of other gastroenterological conditions by fecal volatile organic compounds detection
Ref. Year Category Disease (:control) AUC Accuracy Sensitivity Specificity Sample No. Control No.
Di Cagno et al[46] 2009 Celiac disease Treated celiac disease - - - - 7 7Di Cagno et al[46] 2009 Celiac disease Untreated celiac disease - - - - 7 7Di Cagno et al[46] 2009 Celiac disease Treated:Untreated celiac disease - - - - 7 7Garner et al[73] 2009 Enterocolitis Necrotizing enterocolitis - - - - 6 7Raman et al[74] 2013 Liver disease NAFLD - - - - 30 30Bjarnason et al[75] 2009 Liver disease NAFLD - - - - 7 9Covington et al[76] 2012 Radiation toxicity Low GI pelvic radiation toxicity - 90% - - 10 11Covington et al[76] 2012 Radiation toxicity High GI pelvic radiation toxicity - 90% - - 11 12Covington et al[76] 2012 Radiation toxicity Low GI pelvic radiation toxicity - 80% - - 8 11Covington et al[76] 2012 Radiation toxicity High GI pelvic radiation toxicity - 80% - - 10 12
If no control is specified, the comparison is against a healthy control. NAFLD: Nonalcoholic fatty liver disease; AUC: Area under the curve; GI: Gastrointestinal.
Chan DK et al . Diagnosing gastrointestinal illnesses using fecal headspace

Indeed, most studies to date have been touted as significantly accurate with impressive performance characteristics; however, most studies have generated these metrics on training sets, and without large validation sets. Some studies have used cross-validation using leave-some-out approaches to predict how these models might operate in an independent setting, but most studies lack the test of scrutiny of using a blinded unknown test set to truly determine performance characteristics. This needs to be performed and the algorithms shown to be robust before translational applications can be fully realized.
Nevertheless, the potential application of electronic nose platforms for volatile analysis is immense. By continuing to harness computational and technological innovations, these platforms are bringing the sense of smell back to medical diagnostics. The advent of miniaturized hand-held devices powered by re-chargeable batteries (with the potential for future offline pattern recognition) may make widespread medical diagnostic testing available, with deployment in rural, community, and even developing countries. Because of the continued application of machine learning, electronic noses have the potential over time to expand their diagnostic repertoires to diagnose multiple conditions simultaneously on noninvasive specimens generated from volatile samples, including stool, breath, and urine.
CONClUsIONDespite the limitations of VOC analysis, greater clinical interest and wider adoption will allow for more clinical trials to independently validate many observations already reported. With validation, application will follow, which will elevate the sense of smell into the realm of medical diagnosis. With continuing developments in pattern recognition, mass spectrometry, and electronic nose technology, we are embarking on a tremendous frontier of metabolic and microbial knowledge gleaned from the volatile headspace of stool.
ReFeReNCes1 Hippocrates, Potter P. Hippocrates, Vol. 9: Coan Prenotions-
Anatomical and Minor Clinical Writings. Massachusetts: Harvard University Press, 2010: 265
2 Buljubasic F, Buchbauer G. The scent of human diseases: A review on specific volatile organic compounds as diagnostic biomarkers. Flavour Fragr J 2015; 30: 5-25 [DOI: 10.1002/ffj.3219]
3 Wilson AD, Baietto M. Advances in electronic-nose technologies developed for biomedical applications. Sensors (Basel) 2011; 11: 1105-1176 [PMID: 22346620 DOI: 10.3390/s110101105]
4 Pauling L, Robinson AB, Teranishi R, Cary P. Quantitative analysis of urine vapor and breath by gas-liquid partition chromatography. Proc Natl Acad Sci USA 1971; 68: 2374-2376 [PMID: 5289873]
5 Williams H, Pembroke A. Sniffer dogs in the melanoma clinic? Lancet 1989; 1: 734 [PMID: 2564551]
6 Sonoda H, Kohnoe S, Yamazato T, Satoh Y, Morizono G, Shikata
K, Morita M, Watanabe A, Morita M, Kakeji Y, Inoue F, Maehara Y. Colorectal cancer screening with odour material by canine scent detection. Gut 2011; 60: 814-819 [PMID: 21282130 DOI: 10.1136/gut.2010.218305]
7 McCulloch M, Jezierski T, Broffman M, Hubbard A, Turner K, Janecki T. Diagnostic accuracy of canine scent detection in early- and late-stage lung and breast cancers. Integr Cancer Ther 2006; 5: 30-39 [PMID: 16484712 DOI: 10.1177/1534735405285096]
8 Horvath G, Järverud GA, Järverud S, Horváth I. Human ovarian carcinomas detected by specific odor. Integr Cancer Ther 2008; 7: 76-80 [PMID: 18505901 DOI: 10.1177/1534735408319058]
9 Willis CM, Church SM, Guest CM, Cook WA, McCarthy N, Bransbury AJ, Church MR, Church JC. Olfactory detection of human bladder cancer by dogs: proof of principle study. BMJ 2004; 329: 712 [PMID: 15388612 DOI: 10.1136/bmj.329.7468.712]
10 Hinson AM, Ferrando AA, Wilkerson BM, Stack BC, Bodenner DL. Scent-Trained Canine Prospectively Detects Thyroid Cancer in Human Urine Samples. San Diego, CA: Endocrine Society, 2015
11 Quignon P, Kirkness E, Cadieu E, Touleimat N, Guyon R, Renier C, Hitte C, André C, Fraser C, Galibert F. Comparison of the canine and human olfactory receptor gene repertoires. Genome Biol 2003; 4: R80 [PMID: 14659017]
12 Burdette SD, Bernstein JM. Does the nose know? The odiferous diagnosis of Clostridium difficile-associated diarrhea. Clin Infect Dis 2007; 44: 1142 [PMID: 17366472]
13 Johansen A, Vasishta S, Edison P, Hosein I. Clostridium difficile associated diarrhoea: how good are nurses at identifying the disease? Age Ageing 2002; 31: 487-488 [PMID: 12446303 DOI: 10.1093/ageing/31.6.487]
14 Bomers MK , van Agtmael MA, Luik H, van Veen MC, Vandenbroucke-Grauls CM, Smulders YM. Using a dog’s superior olfactory sensitivity to identify Clostridium difficile in stools and patients: proof of principle study. BMJ 2012; 345: e7396 [PMID: 23241268 DOI: 10.1136/bmj.e7396]
15 Rao K, Berland D, Young C, Walk ST, Newton DW. The nose knows not: poor predictive value of stool sample odor for detection of Clostridium difficile. Clin Infect Dis 2013; 56: 615-616 [PMID: 23166192 DOI: 10.1093/cid/cis974]
16 James AT, Martin AJ. Gas-liquid partition chromatography; the separation and micro-estimation of volatile fatty acids from formic acid to dodecanoic acid. Biochem J 1952; 50: 679-690 [PMID: 14934673]
17 Paul W . Electromagnetic traps for charged and neutral particles. Rev Mod Phys 1990; 62: 531-540 [DOI: 10.1103/RevModPhys.62.531]
18 Paul W, Steinwedel H. Notizen: Ein neues Massenspektrometer ohne Magnetfeld. Zeitschrift für Naturforsch 1953; 8: 448-450 [DOI: 10.1515/zna-1953-0710]
19 Kodogiannis VS, Lygouras JN, Tarczynski A, Chowdrey HS. Artificial odor discrimination system using electronic nose and neural networks for the identification of urinary tract infection. IEEE Trans Inf Technol Biomed 2008; 12: 707-713 [PMID: 19000949 DOI: 10.1109/TITB.2008.917928]
20 Martínez-Lozano P, de la Mora JF. On-line detection of human skin vapors. J Am Soc Mass Spectrom 2009; 20: 1060-1063 [PMID: 19251441 DOI: 10.1016/j.jasms.2009.01.012]
21 Smith D, Spaněl P. Ambient analysis of trace compounds in gaseous media by SIFT-MS. Analyst 2011; 136: 2009-2032 [PMID: 21431189 DOI: 10.1039/c1an15082k]
22 Martínez-Lozano P, de la Mora JF. Electrospray ionization of volatiles in breath. Int J Mass Spectrom 2007; 265: 68-72
23 Arasaradnam RP, Covington JA, Harmston C, Nwokolo CU. Review article: next generation diagnostic modalities in gastroenterology--gas phase volatile compound biomarker detection. Aliment Pharmacol Ther 2014; 39: 780-789 [PMID: 24612215 DOI: 10.1111/apt.12657]
24 Buszewski B, Rudnicka J, Ligor T, Walczak M, Jezierski T, Amann A. Analytical and unconventional methods of cancer detection using odor. TrAC - Trends Anal Chem 2012; 38: 1-12 [DOI: 10.1016/j.trac.2012.03.019]
25 Španěl P, Dryahina K, Smith D. A general method for the
1647 January 28, 2016|Volume 22|Issue 4|WJG|www.wjgnet.com
Chan DK et al . Diagnosing gastrointestinal illnesses using fecal headspace
calculation of absolute trace gas concentrations in air and breath from selected ion flow tube mass spectrometry data. Int J Mass Spectrom 2006; 249-250: 230-239 [DOI: 10.1016/j.ijms.2005.12.024]
26 Tegtmeyer U, Weiss HP. Gas analysis by IMR-MS: a comparison to conventional mass spectrometry. Fresenius J Anal Chem 1993; 347: 263-268 [DOI: 10.1007/BF00323969]
27 Wu C, Siems WF, Hill HH. Secondary electrospray ionization ion mobility spectrometry/mass spectrometry of illicit drugs. Anal Chem 2000; 72: 396-403 [PMID: 10658336 DOI: 10.1021/ac9907235]
28 Zrodnikov Y, Davis CE. The Highs and Lows of FAIMS: Predictions and Future Trends for High Field Asymmetric Waveform Ion Mobility Spectrometry. J Nanomed Nanotechnol 2012; 3: 109e [PMID: 24163785 DOI: 10.4172/2157-7439.1000e109]
29 Oh EH, Song HS, Park TH. Recent advances in electronic and bioelectronic noses and their biomedical applications. Enzyme Microb Technol 2011; 48: 427-437 [PMID: 22113013 DOI: 10.1016/j.enzmictec.2011.04.003]
30 Gardner JW, Bartlett PN. A brief history of electronic noses. Sensors Actuators B Chem 1994; 18: 210-211 [DOI: 10.1016/0925-4005(94)87085-3]
31 Loutfi A, Coradeschi S. Odor Recognition for Intelligent Systems. Intell Syst IEEE 2008; 23: 41-48 [DOI: 10.1109/MIS.2008.11]
32 Boilot P, Hines EL, Gardner JW, Pitt R, John S, Mitchell J, Morgan DW. Classification of bacteria responsible for ENT and eye infections using the Cyranose system. Sensors J 2002; 2: 247-253 [DOI: 10.1109/JSEN.2002.800680]
33 Aronzon A, Hanson CW, Thaler ER. Differentiation between cerebrospinal fluid and serum with electronic nose. Otolaryngol Head Neck Surg 2005; 133: 16-19 [PMID: 16025046 DOI: 10.1016/j.otohns.2005.03.021]
34 Dragonieri S, Schot R, Mertens BJ, Le Cessie S, Gauw SA, Spanevello A, Resta O, Willard NP, Vink TJ, Rabe KF, Bel EH, Sterk PJ. An electronic nose in the discrimination of patients with asthma and controls. J Allergy Clin Immunol 2007; 120: 856-862 [PMID: 17658592 DOI: 10.1016/j.jaci.2007.05.043]
35 de Heer K, van der Schee MP, Zwinderman K, van den Berk IA, Visser CE, van Oers R, Sterk PJ. Electronic nose technology for detection of invasive pulmonary aspergillosis in prolonged chemotherapy-induced neutropenia: a proof-of-principle study. J Clin Microbiol 2013; 51: 1490-1495 [PMID: 23467602 DOI: 10.1128/JCM.02838-12]
36 Dragonieri S, Annema JT, Schot R, van der Schee MP, Spanevello A, Carratú P, Resta O, Rabe KF, Sterk PJ. An electronic nose in the discrimination of patients with non-small cell lung cancer and COPD. Lung Cancer 2009; 64: 166-170 [PMID: 18834643 DOI: 10.1016/j.lungcan.2008.08.008]
37 Greulich T, Hattesohl A, Grabisch A, Koepke J, Schmid S, Noeske S, Nell C, Wencker M, Jörres RA, Vogelmeier CF, Köhler U, Koczulla AR. Detection of obstructive sleep apnoea by an electronic nose. Eur Respir J 2013; 42: 145-155 [PMID: 23100503 DOI: 10.1183/09031936.00091712]
38 Hattesohl AD, Jörres RA, Dressel H, Schmid S, Vogelmeier C, Greulich T, Noeske S, Bals R, Koczulla AR. Discrimination between COPD patients with and without alpha 1-antitrypsin deficiency using an electronic nose. Respirology 2011; 16: 1258-1264 [PMID: 21883674 DOI: 10.1111/j.1440-1843.2011.02047.x]
39 Dragonieri S, van der Schee MP, Massaro T, Schiavulli N, Brinkman P, Pinca A, Carratú P, Spanevello A, Resta O, Musti M, Sterk PJ. An electronic nose distinguishes exhaled breath of patients with Malignant Pleural Mesothelioma from controls. Lung Cancer 2012; 75: 326-331 [PMID: 21924516 DOI: 10.1016/j.lungcan.2011.08.009]
40 Timms C, Thomas PS, Yates DH. Detection of gastro-oesophageal reflux disease (GORD) in patients with obstructive lung disease using exhaled breath profiling. J Breath Res 2012; 6: 016003 [PMID: 22233591 DOI: 10.1088/1752-7155/6/1/016003]
41 de Meij TG, Larbi IB, van der Schee MP, Lentferink YE, Paff T, Terhaar Sive Droste JS, Mulder CJ, van Bodegraven AA, de Boer NK. Electronic nose can discriminate colorectal carcinoma and advanced adenomas by fecal volatile biomarker analysis: proof of principle study. Int J Cancer 2014; 134: 1132-1138 [PMID: 23959518 DOI: 10.1002/ijc.28446]
42 Company T eNose. Revolutionary non-invasive diagnostics for healthcare. Cited 2015, Jul 13. Available from: URL: http://www.enose.nl/products/aeonose/
43 Inc V mHealthcare. Vantage mHealthcare Inc. Cited 2015, Jul 13. Available from: URL: http://vantagemhealthcare.com/
44 M.O.S. A. Electronic Noses. Cited 2015, Jul 13. Available from: URL: http://www.alpha-mos.com/analytical-instruments/heracles-electronic-nose.php
45 de Meij TG, de Boer NK, Benninga MA, Lentferink YE, de Groot EF, van de Velde ME, van Bodegraven AA, van der Schee MP. Faecal gas analysis by electronic nose as novel, non-invasive method for assessment of active and quiescent paediatric inflammatory bowel disease: Proof of principle study. J Crohns Colitis 2014; Epub ahead of print [PMID: 25248313 DOI: 10.1016/j.crohns.2014.09.004]
46 Di Cagno R, Rizzello CG, Gagliardi F, Ricciuti P, Ndagijimana M, Francavilla R, Guerzoni ME, Crecchio C, Gobbetti M, De Angelis M. Different fecal microbiotas and volatile organic compounds in treated and untreated children with celiac disease. Appl Environ Microbiol 2009; 75: 3963-3971 [PMID: 19376912 DOI: 10.1128/AEM.02793-08]
47 de Boer NK, de Meij TG, Oort FA, Ben Larbi I, Mulder CJ, van Bodegraven AA, van der Schee MP. The scent of colorectal cancer: detection by volatile organic compound analysis. Clin Gastroenterol Hepatol 2014; 12: 1085-1089 [PMID: 24823289 DOI: 10.1016/j.cgh.2014.05.005]
48 Shah R, Jones E, Vidart V, Kuppen PJ, Conti JA, Francis NK. Biomarkers for early detection of colorectal cancer and polyps: systematic review. Cancer Epidemiol Biomarkers Prev 2014; 23: 1712-1728 [PMID: 25004920 DOI: 10.1158/1055-9965.EPI-14-0412]
49 Wang C, Li P, Lian A, Sun B, Wang X, Guo L, Chi C, Liu S, Zhao W, Luo S, Guo Z, Zhang Y, Ke C, Ye G, Xu G, Zhang F, Li E. Blood volatile compounds as biomarkers for colorectal cancer. Cancer Biol Ther 2014; 15: 200-206 [PMID: 24100612 DOI: 10.4161/cbt.26723]
50 Peng G, Hakim M, Broza YY, Billan S, Abdah-Bortnyak R, Kuten A, Tisch U, Haick H. Detection of lung, breast, colorectal, and prostate cancers from exhaled breath using a single array of nanosensors. Br J Cancer 2010; 103: 542-551 [PMID: 20648015 DOI: 10.1038/sj.bjc.6605810]
51 Depalma N, Di Lena M, Porcelli F, Travaglio E, Longobardi F, Demarinis Loiotile A, Tedesco G, De Gennaro G, Altomare DF. Detection of colorectal polyps by exhaled VOCs. Preliminary data. Tech Coloproctol 2014; 18: 92-93 [DOI: 10.1007/s10151-013-1096-6]
52 Altomare DF, Di Lena M, Porcelli F, Trizio L, Travaglio E, Tutino M, Dragonieri S, Memeo V, de Gennaro G. Exhaled volatile organic compounds identify patients with colorectal cancer. Br J Surg 2013; 100: 144-150 [PMID: 23212621 DOI: 10.1002/bjs.8942]
53 Tevar FZ, Herrero A, Vidal-De-Miguel G, Bailador G, Criado E, Marquina I, Carmen SA, Sereno M, Raposo CG, Miriam LG, Merino M, Aguayo C, Mario AG, Erdozain JC, Comas C, Mancenido N, Feliu J, Garcia D, Casado E. On-line breath analysis of volatile organic compounds as a method for colorectal cancer detection. J Clin Oncol 2012; 1
54 Silva CL, Passos M, Câmara JS. Investigation of urinary volatile organic metabolites as potential cancer biomarkers by solid-phase microextraction in combination with gas chromatography-mass spectrometry. Br J Cancer 2011; 105: 1894-1904 [PMID: 22085842 DOI: 10.1038/bjc.2011.437]
55 Arasaradnam RP, McFarlane MJ, Ryan-Fisher C, Westenbrink E, Hodges P, Thomas MG, Chambers S, O’Connell N, Bailey C,
1648 January 28, 2016|Volume 22|Issue 4|WJG|www.wjgnet.com
Chan DK et al . Diagnosing gastrointestinal illnesses using fecal headspace
Harmston C, Nwokolo CU, Bardhan KD, Covington JA. Detection of colorectal cancer (CRC) by urinary volatile organic compound analysis. PLoS One 2014; 9: e108750 [PMID: 25268885 DOI: 10.1371/journal.pone.0108750]
56 Shepherd SF, McGuire ND, de Lacy Costello BP, Ewen RJ, Jayasena DH, Vaughan K, Ahmed I, Probert CS, Ratcliffe NM. The use of a gas chromatograph coupled to a metal oxide sensor for rapid assessment of stool samples from irritable bowel syndrome and inflammatory bowel disease patients. J Breath Res 2014; 8: 026001 [PMID: 24674940 DOI: 10.1088/1752-7155/8/2/026001]
57 Ahmed I, Greenwood R, Costello Bde L, Ratcliffe NM, Probert CS. An investigation of fecal volatile organic metabolites in irritable bowel syndrome. PLoS One 2013; 8: e58204 [PMID: 23516449 DOI: 10.1371/journal.pone.0058204]
58 Cauchi M, Fowler DP, Walton C, Turner C, Jia W, Whitehead RN, Griffiths L, Dawson C, Bai H, Waring RH, Ramsden DB, Hunter JO, Cole JA, Bessant C. Application of gas chromatography mass spectrometry (GC-MS) in conjunction with multivariate classification for the diagnosis of gastrointestinal diseases. Metabolomics 2014; 1113-1120 [DOI: 10.1007/s11306-014-0650-1]
59 Walton C, Fowler DP, Turner C, Jia W, Whitehead RN, Griffiths L, Dawson C, Waring RH, Ramsden DB, Cole JA, Cauchi M, Bessant C, Hunter JO. Analysis of volatile organic compounds of bacterial origin in chronic gastrointestinal diseases. Inflamm Bowel Dis 2013; 19: 2069-2078 [PMID: 23867873 DOI: 10.1097/MIB.0b013e31829a91f6]
60 Probert CS, Jones PR, Ratcliffe NM. A novel method for rapidly diagnosing the causes of diarrhoea. Gut 2004; 53: 58-61 [PMID: 14684577]
61 Garner CE, Smith S, de Lacy Costello B, White P, Spencer R, Probert CS, Ratcliffe NM. Volatile organic compounds from feces and their potential for diagnosis of gastrointestinal disease. FASEB J 2007; 21: 1675-1688 [PMID: 17314143 DOI: 10.1096/fj.06-6927com]
62 Tait E, Hill KA, Perry JD, Stanforth SP, Dean JR. Development of a novel method for detection of Clostridium difficile using HS-SPME-GC-MS. J Appl Microbiol 2014; 116: 1010-1019 [PMID: 24320174 DOI: 10.1111/jam.12418]
63 McGuire ND, Ewen RJ, Costello BD, Garner CE, Probert CSJ, Vaughan K, Ratcliffe NM. Towards point of care testing for C. difficile infection by volatile profiling, using the combination of a short multi-capillary gas chromatography column with metal oxide sensor detection. Meas Sci Technol 2014; 25: 065108 [DOI: 10.1088/0957-0233/25/6/065108]
64 Chan DK, Anderson M, Lynch DT, Leggett CL, Lutzke LS, Clemens M, Wang KK. Su1352 Detection of Clostridium difficile-Infected Stool by Electronic-Nose Analysis of Fecal Headspace Volatile Organic Compounds. Gastroenterology 2015; 148: S-483 [DOI: 10.1016/S0016-5085(15)31623-1]
65 Sethi S, Nanda R, Chakraborty T. Clinical application of volatile organic compound analysis for detecting infectious diseases. Clin Microbiol Rev 2013; 26: 462-475 [PMID: 23824368 DOI: 10.1128/CMR.00020-13]
66 Koczulla R, Hattesohl A, Biller H, Hofbauer J, Hohlfeld J, Oeser C, Wirtz H, Jörres RA. [Comparison of four identical electronic noses and three measurement set-ups]. Pneumologie 2011; 65: 465-470 [PMID: 21437859 DOI: 10.1055/s-0030-1256280]
67 Bruins M, Gerritsen JW, van de Sande WWJ, van Belkum A, Bos A. Enabling a transferable calibration model for metal-oxide type electronic noses. Sensors Actuators B Chem 2013; 188: 1187-1195 [DOI: 10.1016/j.snb.2013.08.006]
68 Vignola AM, Chanez P, Chiappara G, Merendino A, Pace E, Rizzo A, la Rocca AM, Bellia V, Bonsignore G, Bousquet J. Transforming growth factor-beta expression in mucosal biopsies in asthma and chronic bronchitis. Am J Respir Crit Care Med 1997; 156: 591-599 [PMID: 9279245 DOI: 10.1111/j.1745-6924.2009.01125.x]
69 De Meij T, Lentferink Y, Van Der Schee M, Pfaff T, Van Bodegraven AA, De Boer NK. Fecal gas analysis by electronic nose of pediatric IBD patients and healthy controls: A pilot study. Gastroenterology 2013; 1: S443
70 De Preter V, Vandermeulen G, Windey K, Vermeire S, Rutgeerts PJ, Verbeke K. Altered colonic metabolite profile in active versus quiescent ulcerative colitis. Gastroenterology 2011; 1: S325-S326 [DOI: 10.1016/S0016-5085(11)61321-8]
71 Al-Kateb H, Cunliffe N, DeLacy Costello B, Probert C, Ratcliffe N. Analysis of faecal volatiles from young children infected with and without rotavirus. Gut 2012; 61: A364-A365 [DOI: 10.1136/gutjnl-2012-302514d.169]
72 Garner CE, Smith S, Bardhan PK, Ratcliffe NM, Probert CS. A pilot study of faecal volatile organic compounds in faeces from cholera patients in Bangladesh to determine their utility in disease diagnosis. Trans R Soc Trop Med Hyg 2009; 103: 1171-1173 [PMID: 19268999 DOI: 10.1016/j.trstmh.2009.02.004]
73 Garner CE, Ewer AK, Elasouad K, Power F, Greenwood R, Ratcliffe NM, Costello Bde L, Probert CS. Analysis of faecal volatile organic compounds in preterm infants who develop necrotising enterocolitis: a pilot study. J Pediatr Gastroenterol Nutr 2009; 49: 559-565 [PMID: 19668005 DOI: 10.1097/MPG.0b013e3181a3bfbc]
74 Raman M, Ahmed I, Gillevet PM, Probert CS, Ratcliffe NM, Smith S, Greenwood R, Sikaroodi M, Lam V, Crotty P, Bailey J, Myers RP, Rioux KP. Fecal microbiome and volatile organic compound metabolome in obese humans with nonalcoholic fatty liver disease. Clin Gastroenterol Hepatol 2013; 11: 868-875.e1-3 [PMID: 23454028 DOI: 10.1016/j.cgh.2013.02.015]
75 Bjarnason J, Prieto G, Bailey J, Raman M, Probert C, Smith S, Rabbani I, Crotty P, Shaheen A, Rioux K. Evaluation of the fecal microbiota and bacteria-associated volatile organic compounds in patients with nonalcoholic fatty liver disease. Can J Gastroenterol 2009; 23
76 Covington JA, Wedlake L, Andreyev J, Ouaret N, Thomas MG, Nwokolo CU, Bardhan KD, Arasaradnam RP. The detection of patients at risk of gastrointestinal toxicity during pelvic radiotherapy by electronic nose and FAIMS: a pilot study. Sensors (Basel) 2012; 12: 13002-13018 [PMID: 23201982 DOI: 10.3390/s121013002]
P- Reviewer: Corso G S- Editor: Ma YJ L- Editor: A E- Editor: Zhang DN
1649 January 28, 2016|Volume 22|Issue 4|WJG|www.wjgnet.com
Chan DK et al . Diagnosing gastrointestinal illnesses using fecal headspace

© 2016 Baishideng Publishing Group Inc. All rights reserved.
Published by Baishideng Publishing Group Inc8226 Regency Drive, Pleasanton, CA 94588, USA
Telephone: +1-925-223-8242Fax: +1-925-223-8243
E-mail: [email protected] Desk: http://www.wjgnet.com/esps/helpdesk.aspx
http://www.wjgnet.com
I S S N 1 0 0 7 - 9 3 2 7
9 7 7 1 0 07 9 3 2 0 45
0 4