Improvement of the Quality of Business Environment Model ...

February 2016
3 英文Main 115447.240803.28.2.17 作業;047
Data Collection Survey on Improvement of Environment
in Varanasi City, Republic of India
Final Report(Main Report)
Republic of IndiaData C
ollection Survey on Improvem
ent of Environm
ent in Varanasi City, R
epublic of India Final Report (M
ain Report)
Japan International Cooperation Agency (JICA)
Kokusai Kogyo Co., Ltd.Sewerage Business Management Centre
February 2016 GEJR
16-032

Exchange Rate (As of July 2015)
1INR = JPY 1.927, 1INR=US$ 0.016

i
Contents
1 Outline of Survey ............................................................................... 1-1
1.1 Background ..................................................................................... 1-1 1.2 Study Purpose .................................................................................. 1-1 1.3 Target Study Area ........................................................................... 1-1 1.4 Members of the Study Team ........................................................... 1-2 1.5 Study Schedule ................................................................................ 1-3 1.6 Study Method .................................................................................. 1-3
2 Overview of Study Area in Varanasi................................................. 2-1
2.1 Location of Study Area ................................................................... 2-1 2.2 Climate ............................................................................................ 2-2 2.3 Population of Study Area ................................................................ 2-3 2.4 River and Drainage .......................................................................... 2-3 2.5 Major Industries .............................................................................. 2-4 2.6 Major Landmarks ............................................................................ 2-5 2.7 Income Level ................................................................................... 2-5
3 Legal Framework for Environmental Management ......................... 3-1
3.1 Legal Framework and Major Policies for Environmental
Management .................................................................................... 3-1 3.1.1 Laws and Regulations for Environmental Management .......................... 3-1 3.1.2 National Policies and Programs ............................................................... 3-2 3.1.3 Individual Laws and Regulations ............................................................. 3-4
3.2 Institutional Framework and Organizations for Environmental
Management .................................................................................... 3-6 3.2.1 Institutional Framework ........................................................................... 3-6 3.2.2 Structure and Functions of Major Institutions in Urban Areas ................ 3-7 3.2.3 Structure and Functions of Major Institutions in Rural Areas ............... 3-16
4 Water and Sanitation Status in Varanasi ......................................... 4-1
4.1 Water Supply ................................................................................... 4-1 4.1.1 Water Sources .......................................................................................... 4-2 4.1.2 Water Treatment System.......................................................................... 4-2 4.1.3 Water Storage System .............................................................................. 4-4 4.1.4 Water Supply System ............................................................................... 4-5 4.1.5 Pipe Connection to Individual household ................................................ 4-5 4.1.6 Financial Condition of Water Supply ...................................................... 4-6

ii
4.1.7 Non Revenue Water ................................................................................. 4-8 4.1.8 Future Water Demand .............................................................................. 4-9 4.1.9 Key Issues ................................................................................................ 4-9
4.2 Sewerage ....................................................................................... 4-10 4.2.1 Wastewater Generation Amount ............................................................ 4-10 4.2.2 Storm Water ........................................................................................... 4-11 4.2.3 Current Sewerage System ...................................................................... 4-12 4.2.4 Sewerage Treatment Plant ..................................................................... 4-14 4.2.5 Structure and Function of Institutions .................................................... 4-25 4.2.6 Future Development Plans ..................................................................... 4-29 4.2.7 Septage Management ............................................................................. 4-30 4.2.8 Key Issues .............................................................................................. 4-30
4.3 Solid Waste Management .............................................................. 4-31 4.3.1 Waste Generation and Waste Composition ........................................... 4-32 4.3.2 Waste Discharge .................................................................................... 4-33 4.3.3 Collection and Transportation ................................................................ 4-35 4.3.4 Final Disposal ........................................................................................ 4-38 4.3.5 Processing Unit ...................................................................................... 4-41 4.3.6 Organizational Structure and Financial Status ....................................... 4-42 4.3.7 Service Level Benchmark for SWM ...................................................... 4-45 4.3.8 Estimation of waste amount to be generated in Varanasi City .............. 4-46 4.3.9 Major Issues Identified .......................................................................... 4-46
4.4 Sanitation Facility Management .................................................... 4-47 4.4.1 Household Latrines ................................................................................ 4-47 4.4.2 Development of Public Toilets .............................................................. 4-49 4.4.3 Toilet Facilities in School ...................................................................... 4-53 4.4.4 Septage Management ............................................................................. 4-54 4.4.5 Key Issues .............................................................................................. 4-54
5 Activities of International Donors .................................................... 5-1
5.1 JICA ................................................................................................. 5-1 5.2 Activities of Other International Donors ......................................... 5-3
6 Public and Institutional Opinion Surveys ........................................ 6-1
6.1 Public Opinion Survey (POS) ......................................................... 6-1 6.1.1 Outline of the Survey Areas and the Survey Schedule ............................ 6-1 6.1.2 Varanasi Municipal Corporation (VMC) ................................................. 6-1 6.1.3 Ram Nagar Municipal Board (RNMB) .................................................. 6-13 6.1.4 Gram Panchayats ................................................................................... 6-23
6.2 Institutional Opinion Survey (IOS) ............................................... 6-33

iii
6.2.1 Outline of the Survey Areas and the Survey Schedule .......................... 6-33 6.2.2 Survey Results ....................................................................................... 6-33
6.3 Summary of Public Opinion Survey ............................................. 6-35 6.3.1 Peoples’ Perceptions of Environmental Problems ................................. 6-35 6.3.2 Water Supply and Wastewater Management ......................................... 6-36 6.3.3 Solid Waste Management ...................................................................... 6-37 6.3.4 Sanitation Facilities ................................................................................ 6-40 6.3.5 IEC Activities ........................................................................................ 6-43 6.3.6 Overall Findings .................................................................................... 6-43
7 Direction of JICA’s Future Cooperation ........................................... 7-1
7.1 Issues to Be Considered in Forming Cooperation Plans ................. 7-1 7.2 Sanitation and Environmental Challenges Faced by Local Authorities
......................................................................................................... 7-3 7.3 Proposal of Cooperation Plan .......................................................... 7-7
【ANNEX】
ANNEX A Questionnaire and Results of Public and Institutional Opinion Surveys
ANNEX B Draft Application Form for Future Technical Cooperation Project

iv
List of Tables Table 1-1 Study team members ............................................................................................. 1-2 Table 1-2 Data collected in the first preparatory work .......................................................... 1-4 Table 1-3 Data collected in the waste management sector .................................................... 1-7 Table 1-4 Data collected in the sanitation facility management sector .................................. 1-8 Table 1-5 Data collected in the water supply and sewerage management sector .................. 1-9 Table 1-6 Data collected in local bodies around Varanasi City ........................................... 1-10 Table 2-1 Population and households in study area ............................................................... 2-3 Table 2-2 Historical architectures .......................................................................................... 2-5 Table 2-3 Population under the poverty line in 2011-2012 in urban and rural area .............. 2-6 Table 3-1 Components of the SBM and supervisory agency ................................................. 3-4 Table 3-2 Roles and responsibilities of major institutions in Varanasi .................................. 3-6 Table 3-3 Revenue of the VMC ............................................................................................. 3-9 Table 3-4 Expenditure of the VMC ....................................................................................... 3-9 Table 3-5 Roles and functions of the concerned institutions ............................................... 3-13 Table 3-6 The numbers of municipal officers ...................................................................... 3-15 Table 3-7 List of major municipal assets ............................................................................. 3-16 Table 3-8 Budget of the surveyed GPs ................................................................................ 3-19 Table 4-1 Water sources for Varanasi .................................................................................... 4-2 Table 4-2 Water quality at water treatment plant (Year 2010) ........................................ 4-3 Table 4-3 Water supply network in Varanasi ........................................................................ 4-5 Table 4-4 Connection to individual households and water meters ........................................ 4-5 Table 4-5 Water tariffs ........................................................................................................... 4-6 Table 4-6 Revenue of Jal Kal for the past five years ............................................................. 4-7 Table 4-7 Expenditures of Jal Kal for the past five years. ..................................................... 4-7 Table 4-8 Non revenue water in Varanasi.............................................................................. 4-8 Table 4-9 Future water demand ............................................................................................. 4-9 Table 4-10 Future population and generation amount of wastewater .................................. 4-11 Table 4-11 Status of sewerage management in Varanasi City ............................................. 4-13 Table 4-12 Effluent discharge standard(NRCD) ............................................................ 4-14 Table 4-13 Main faculties at Dinapur STP .......................................................................... 4-15 Table 4-14 Water quality of Dinapur STP(February To March 2015) ........................... 4-16 Table 4-15 Quality record at DLW STP(July 2015) ....................................................... 4-22 Table 4-16 Specification of pump at Dr. Rajendra Prasad Ghat sewerage pumping station 4-24 Table 4-17 Functions of institutions on sewerage and storm water drainage ...................... 4-25 Table 4-18 Members of Jal Nigam ...................................................................................... 4-26 Table 4-19 Basic SWM indicators ....................................................................................... 4-32 Table 4-20 Waste generation ............................................................................................... 4-32 Table 4-21 Waste composition by category ......................................................................... 4-33 Table 4-22 Physical characteristics of municipal solid waste in Varanasi .......................... 4-33
v
Table 4-23 Collection vehicles owned by the VMC ............................................................ 4-37 Table 4-24 Municipal expenditure of FY2012..................................................................... 4-44 Table 4-25 Service level benchmark data for SWM ............................................................ 4-45 Table 4-26 Forecast of waste amount to be generated in Varanasi City .............................. 4-46 Table 4-27 Percentage of owning latrine facilities at premises in study area(%) ........... 4-48 Table 4-28 Number of public toilets at Ghats (Sulabh International) ........................... 4-50 Table 4-29 Public toilets operated by Sulabh International ................................................. 4-50 Table 4-30 Operators and the number of CTCs ................................................................... 4-51 Table 4-31 CTCs operated by NEDA .................................................................................. 4-51 Table 4-32 CTCs operated by Sulabh International ............................................................. 4-51 Table 4-33 CTCs operated by the Advance Sanitation welfare Society .............................. 4-52 Table 4-34 CTCs operated by Refrogen Suvidha ................................................................ 4-52 Table 4-35 Public schools with/without toilet facilities in Varanasi District ...................... 4-53 Table 4-36 Private schools with/without toilet facilities in Varanasi District ..................... 4-54 Table 5-1 Projects of JICA (Sanitation, Water and Sewerage) ....................................... 5-1 Table 5-2 Projects of World Bank(Sanitation, Water and Sewerage) .............................. 5-3 Table 5-3 Projects of GIZ(Sanitation, Water and Sewerage) ........................................... 5-4 Table 6-1 Survey schedule ..................................................................................................... 6-1 Table 6-2 Household composition (persons) and household annual income (avg.) .............. 6-2 Table 6-3 Religion and social groups .................................................................................... 6-3 Table 6-4 Items needed for urgent improvements ................................................................. 6-3 Table 6-5 Main source of drinking water ............................................................................... 6-4 Table 6-6 Supply frequency of drinking water ...................................................................... 6-4 Table 6-7 Water use for drinking and other domestic purposes (avg. litters per day) ........... 6-5 Table 6-8 Water charges for drinking and other domestic purposes (Rs./year/household) ... 6-5 Table 6-9 Wastewater management ....................................................................................... 6-6 Table 6-10 Conditions of road side drains ............................................................................. 6-6 Table 6-11 Does your household receive collection service(s) of any kind? ......................... 6-6 Table 6-12 How is the waste collected? ................................................................................. 6-7 Table 6-13 Who collects the waste? ...................................................................................... 6-7 Table 6-14 How often is your wastes collected? ................................................................... 6-8 Table 6-15 Are you satisfied with the collection service? ..................................................... 6-8 Table 6-16 Is there someone who comes around to collect or buy reusable or recyclable
materials? ...................................................................................................................... 6-8 Table 6-17 Do you take recyclable materials to shops for refund or sale? ............................ 6-9 Table 6-18 Are you using kitchen waste and/or garden waste for compost? ......................... 6-9 Table 6-19 Do you own a latrine? .......................................................................................... 6-9 Table 6-20 Where do you most frequently go to defecate? ................................................. 6-10 Table 6-21 Types of IHHLs ................................................................................................. 6-10 Table 6-22 What made you decide to build your latrine? (multiple answers) ..................... 6-11

vi
Table 6-23 Did you receive assistance from any organizations to build your current latrine?6-11 Table 6-24 Has your latrine pit ever been emptied? ............................................................ 6-11 Table 6-25 What do you do with the contents?.................................................................... 6-12 Table 6-26 Have you ever hired someone to empty your pit? ............................................. 6-12 Table 6-27 What hygiene advice have you heard before? (multiple answers) .................... 6-12 Table 6-28 Information source of hygiene advice (multiple answers) ................................. 6-13 Table 6-29 Household composition (persons) and household annual income (avg.) .......... 6-14 Table 6-30 Religion and social groups ................................................................................ 6-14 Table 6-31 Items needed for urgent improvements ............................................................. 6-14 Table 6-32 Main source of drinking water ........................................................................... 6-15 Table 6-33 Supply frequency of drinking water .................................................................. 6-15 Table 6-34 Water use for drinking and other domestic purposes (avg. litters per day) ....... 6-16 Table 6-35 Water charges for drinking and other domestic purposes (Rs./year/household) 6-16 Table 6-36 Wastewater management ................................................................................... 6-16 Table 6-37 Conditions of road side drains ........................................................................... 6-17 Table 6-38 Does your household receive collection service(s) of any kind? ....................... 6-17 Table 6-39 How is the waste collected? ............................................................................... 6-17 Table 6-40 Who collects the waste? .................................................................................... 6-18 Table 6-41 Would you like to receive a collection service? ................................................ 6-18 Table 6-42 Is there someone who comes around to collect or buy reusable or recyclable
materials? .................................................................................................................... 6-19 Table 6-43 Do you take recyclable materials to shops for refund? ...................................... 6-19 Table 6-44 Are you using kitchen waste and/or garden wastes for compost? ..................... 6-19 Table 6-45 Do you own a latrine? ........................................................................................ 6-20 Table 6-46 Where do you most frequently go to defecate? ................................................. 6-20 Table 6-47 Why don’t you own a latrine? (multiple answers) ............................................. 6-20 Table 6-48 Types of IHHLs ................................................................................................. 6-21 Table 6-49 What made you decide to build your latrine? (multiple answers) ..................... 6-21 Table 6-50 Did you receive assistance from any organizations to build your current latrine?6-21 Table 6-51 Has your latrine pit ever been emptied? ............................................................ 6-22 Table 6-52 What hygiene advice have you heard before? (multiple answers) .................... 6-22 Table 6-53 Information source of hygiene advice (multiple answers) ................................. 6-22 Table 6-54 Household composition (persons) and household annual income (avg.) .......... 6-23 Table 6-55 Religion and social groups ................................................................................ 6-24 Table 6-56 Items needed for urgent improvement ............................................................... 6-24 Table 6-57 Main source of drinking water ........................................................................... 6-25 Table 6-58 Supply frequency of drinking water .................................................................. 6-25 Table 6-59 Water use for drinking and other domestic purposes (avg. litters per day) ....... 6-25 Table 6-60 Water charges for drinking and other domestic purposes (Rs./year/household) 6-26 Table 6-61 Wastewater management ................................................................................... 6-26

vii
Table 6-62 Does your household receive collection service(s) of any kind? ....................... 6-27 Table 6-63 Would you like to receive a collection service? ................................................ 6-27 Table 6-64 Is there someone who comes around to collect or buy reusable or recyclable
materials? .................................................................................................................... 6-28 Table 6-65 Do you take recyclable materials to shops for refund or sale? .......................... 6-28 Table 6-66 Are you using kitchen waste and/or garden waste for compost? ....................... 6-28 Table 6-67 Do you own a latrine? ........................................................................................ 6-29 Table 6-68 Where do you most frequently go to defecate? ................................................. 6-29 Table 6-69 Why don’t you own a latrine? (multiple answer) .............................................. 6-29 Table 6-70 Types of IHHLs ................................................................................................. 6-30 Table 6-71 What made you decide to build your latrine? (multiple answers) ..................... 6-30 Table 6-72 Did you receive assistance from any organization to build your current latrine?6-30 Table 6-73 Has your latrine pit ever been emptied? ............................................................ 6-31 Table 6-74 What do you do with the contents?.................................................................... 6-31 Table 6-75 Have you ever hired someone to empty your pit? ............................................. 6-32 Table 6-76 What hygiene advice have you heard before? (multiple answers) .................... 6-32 Table 6-77 Information source of hygiene advice (multiple answers) ................................. 6-33 Table 6-78 Survey schedule ................................................................................................. 6-33 Table 6-79 Do you receive collection service(s) of any kind? ............................................. 6-34 Table 6-80 How is the waste collected? ............................................................................... 6-34 Table 6-81 Who collects the waste? .................................................................................... 6-34 Table 6-82 How often is your waste collected? ................................................................... 6-34 Table 6-83 Are you satisfied with the collection service? ................................................... 6-34 Table 6-84 How do you think litter can be reduced in the area? (multiple answers) ........... 6-35 Table 6-85 Is there someone who comes around to collect or buy reusable or recyclable
materials? .................................................................................................................... 6-35 Table 6-86 Do you take recyclable materials to shops for refund or sale? .......................... 6-35 Table 6-87 Items needed for urgent improvement ............................................................... 6-36 Table 6-88 Main source of drinking water ........................................................................... 6-36 Table 6-89 Wastewater management ................................................................................... 6-37 Table 6-90 Do you receive collection service(s) of any kind? ............................................. 6-38 Table 6-91 Who collects the waste? .................................................................................... 6-38 Table 6-92 Is there someone who comes around to collect or buy reusable or recyclable
materials? .................................................................................................................... 6-39 Table 6-93 Do you take recyclable materials to shops for refund or sale? .......................... 6-39 Table 6-94 Are you using kitchen waste and/or garden waste for compost? ....................... 6-39 Table 6-95 Do you receive collection service(s) of any kind? ............................................. 6-40 Table 6-96 Who collects the waste? .................................................................................... 6-40 Table 6-97 Is there someone who comes around to collect or buy reusable and recyclable
materials? .................................................................................................................... 6-40

viii
Table 6-98 Do you own a latrine? ........................................................................................ 6-41 Table 6-99 Where do you most frequently go to defecate? ................................................. 6-41 Table 6-100 Did you receive assistance from any organization to build your current latrine?6-42 Table 6-101 Has your latrine pit ever been emptied? .......................................................... 6-42 Table 6-102 What do you do with the contents?.................................................................. 6-43 Table 6-103 Information source of hygiene advice (multiple answers) ............................... 6-43 Table 7-1 Location-Sector wise key issues and a proposed cooperation plan ....................... 7-4 Table 7-2 Future Cooperation Plan ........................................................................................ 7-7

ix
List of Figures Figure 1-1 Study area in urban and rural area ........................................................................ 1-2 Figure 1-2 Schedule of study ................................................................................................. 1-3 Figure 2-1 Location of Varanasi District ............................................................................... 2-1 Figure 2-2 Location of study areas ........................................................................................ 2-2 Figure 2-3 Temperature and rainfall in Varanasi ................................................................... 2-2 Figure 2-4 Rivers in Varanasi City ........................................................................................ 2-4 Figure 2-5 Industrial structure in Varanasi District ............................................................... 2-5 Figure 3-1 Organizational structure of the VMC ................................................................... 3-8 Figure 3-2 Organizational structure of Jal Kal ..................................................................... 3-10 Figure 3-3 Organizational structure of VDA ....................................................................... 3-11 Figure 3-4 Organizational structure of DUDA .................................................................... 3-12 Figure 3-5 The relationship between the RNMB and the district and state administrations 3-14 Figure 3-6 Organizational chart of Dept. of Panchayat Raj ................................................. 3-17 Figure 3-7 Inter-organizational relationship between Block Development Office and
district-level institutions .............................................................................................. 3-18 Figure 3-8 Organizational structure of Block Development Office ..................................... 3-19 Figure 4-1 Water supply zone and water treatment plant ...................................................... 4-1 Figure 4-2 Picture showing submerged road by flooding(July 2014) ............................ 4-11 Figure 4-3 Sewage zone in Varanasi .................................................................................... 4-12 Figure 4-4 Sewerage System in Varanasi and STP .............................................................. 4-13 Figure 4-5 Treatment process at Dinapur STP ..................................................................... 4-15 Figure 4-6 General layout of Dinapur STP .......................................................................... 4-16 Figure 4-7 Layout of Bhagwanpur STP ............................................................................... 4-20 Figure 4-8 Layout of DLW STP .......................................................................................... 4-22 Figure 4-9 Organization chart for Ganga Pollution Prevention Unit, UP Jal Nigam in
Varanasi zone .............................................................................................................. 4-28 Figure 4-10 Organization chart for C&DS, UP Jal Nigam .................................................. 4-29 Figure 4-11 JICA Assisted Ganga Action Project in Varanasi ............................................ 4-30 Figure 4-12 Location of disposal sites ................................................................................. 4-39 Figure 4-13 Organizational structure of the VMC ............................................................... 4-43 Figure 4-14 Types of latrine facilities used in study areas(%) ....................................... 4-48 Figure 6-1 Localities where POS was conducted .................................................................. 6-1

x
Abbreviation
ADO Assistant Development Officer
AMRUT Atal Mission for Rejuvenation and Urban Transformation
ANM Auxiliary Nurse Midwife
ARV Annual Rental Value of the Property
ASHA Accredited Social Health Activist
ASP Activated Sludge Process
BDO Block Development Office
BHU Banaras Hindu University
BOD Biochemical Oxygen Demand
C&DS Construction and Design Services
CBO Community-based Organization
CDP City Development Plan
CFAR Centre for Advocacy and Research
COD Chemical Oxygen Demand
CPCB Central Pollution Control Board
CPHEEO Central Public Health and Environment Engineering Organization
CRSP Central Rural Sanitation Program
CSP City Sanitation Plan
CSR Corporate Social Responsibility
CT Census Town
CTC Community Toilet Complex
DEWATS Decentralized Wastewater Treatment System
DLW Diesel Locomotive Works
DO Dissolved Oxygen
DOSE Department of School Education
DPR Detailed Project Report
DPRO District Panchayat Raj Officer
DUDA District Urban Development Authority
FS Feasibility Study
GAP Ganga Action Plan
GIZ Deutsche Gesellschaft für Internationale Zusammenarbeit
GM General Manager
GOI Government of India
GP Gram Panchayat
GPO Gram Panchayat Officer
GS Gram Sachiv
IC/R Inception Report
IDP Institutional Development Program
IEC Information, Education and Communication
IHHL Individual Household Latrine
IMF International Monetary Fund
JICA Japan International Cooperation Agency
JNNURM Jawaharlal Nehru National Urban Renewal Mission
MBBR Moving Bed Bio Reactor
MC Municipal Commissioner

xi
MGNREGA Mahatma Gandhi National Rural Employment Guarantee Act
MLA Member of Legislative Assembly
MLD Millions Liter Daily
MLSS Mixed Liquor Suspended Solids
MODWS Ministry of Drinking Water and Sanitation
MOEF Ministry of Environment and Forest and Climate Change
MOUD Ministry of Urban Development
MOWCD Ministry of Women and Child Development
MOWRGR Ministry of Water Resources, River Development and Ganga Rejuvenation
MP Member of Parliament
MSW Municipal Solid Waste
NBA Nirmal Bharat Abhiyan/ Total Sanitation Campaign
NEDA Non-Conventional Energy Development Agency
NGO Non-governmental Organization
NGRBA National Ganga River Basin Authority
NMCG National Mission for Clean Ganga
NRCP National River Conservation Plan
NRW Non-Revenue Water
NTU Nephelometric Turbidity Unit
NULM National Urban Livelihood Mission
NUSP National Urban Sanitation Plan
OBC Other Backward Class
OD Open Defecation
ODA Official Development Assistance
PAC Poly Aluminum Chloride
PP Pilot Project
PPP Public Private Partnership
PRI Panchayat Raj Institution
PTA Parent-Teacher Association
RDF Refuse Derived Fuel
RNMB Ramnagar Municipal Board
SBA (SBM) Swachh Bharat Abhiyan (Mission)/ Clean India Mission
SC Scheduled Caste
SCADA Supervisory Control and Data Acquisition SHG Self-help Group
SLB Service Level Benchmarking
SNUSP Support to the National Urban Sanitation Policy SPCB State Pollution Control Board SS Suspended Solid
SSS State Sanitation Strategy
ST Scheduled Tribe
ST Statutory Towns
STP Sewage Treatment Plant
SUDA State Urban Development Agency
SVI Sludge Volume Index
SWM Solid Waste Management
TA Technical Assistance

xii
TKM Toyota Kirloskar Motor
TSC Total Sanitation Campaign
TSDF Treatment Storage Disposal Facility
TSS Total Suspended Solid
UP Uttar Pradesh State
UPJN UP Jal Nigam
UPPCB Uttar Pradesh Pollution Control Board
UPSRCA Uttar Pradesh State Ganga River Conservation Agency
VDA Varanasi Development Authority
VDO Village Development Officer
VJK Varanasi Jal Kal
VMC Varanasi Municipal Corporation
WACS Waste Amount and Composition Survey
WP Waste Picker
1 crore 10,000,000
1 lakh 100,000

Data Collection Survey on Improvement Japan International Cooperation Agency of Environment in Varanasi City, Republic of India Kokusai Kogyo Co., Ltd. Sewerage Business Management Centre
1-1
1 Outline of Survey
1.1 Background
After the late 1980s, the government of India (GoI) has been making significant efforts to improve the sanitation environment. The new Prime Minister, Narendra Modi set sanitation issues as one of the most prioritized issues to be tackled, and then established the Swachh Bharat Mission (SBM) to improve the sanitation environment in India. Yet, it has still been challenging for India – a country with a significantly large population (1.3 billion) and land area – to implement a sanitation project in all regions at once due to its financial constraints. Under these circumstances, the international donors, such as the World Bank, have continuously provided support technically and financially.
In India, the Japan International Cooperation Agency (JICA) has implemented several projects to improve the sanitation in the Ganga River basin for years, such as the “Yamuna Action Plan Project (I)” in 1992, the “Yamuna Action Plan Project (II)” in 2003, and the “Yamuna Action Plan Project (III)” in 2011. In addition, in order to improve the water quality of the Ganga River, JICA has supported the “Ganga Action Plan (Varanasi)” with the organizations responsible in India since 2005.
In the Declaration for the Japan-India Special Strategic and Global Partnership, which was made in September 2014, the improvement of water quality for the Ganga was mentioned as an issue to be promoted under the Japanese ODA scheme. Also, later in December 2015, under Japan and India Vision 20251, Prime Minister Abe expressed his intention to support India's efforts such as ''Clean India'' and ''Smart City'' by sharing its advanced skills and technologies and through active mobilisation of Japanese public and private sector involvement, including Official Development Assistance (ODA).
In this situation, JICA has decided to conduct the “Data Collection Survey on Improvement of Environment in Varanasi City, Republic of India” with the aim to further narrow down local needs and subsequently form a technical cooperation project, which would enable synergistic effects with other ODA-loan projects.
1.2 Study Purpose
This study aims to understand the current situation and challenges lying in water environment management as well as sanitation facility management, including water and sewerage, in Varanasi City. It also aims to assess the possibility of new technical cooperation projects. During this study, a seminar is held in Delhi to introduce the experience that Japan has in the sanitation field. In addition, the study supports to organize the India and Japan seminar which is held in Varanasi under the Preparatory Survey on Ganga Rejuvenation Project.
1.3 Target Study Area
This study selected target study areas from both urban and rural bodies in the Varanasi area. From the urban area, the Varanasi Municipal Corporation (VMC) and Ramnagar Municipal Board are selected, while in the rural area, the three GPs of Suzabad, Sirgorbardhanpur, and Shivdhaspur in the Kashi Vidya Peeth Block are chosen based on the three criteria listed below. In the 2011
1 For details, please visit http://www.mofa.go.jp/s_sa/sw/in/page3e_000432.html (English)

Data Collection Survey on Improvement Japan International Cooperation Agency of Environment in Varanasi City, Republic of India Kokusai Kogyo Co., Ltd. Sewerage Business Management Centre
1-2
Census, these GPs are classified as urbanized areas called “census towns” which have been experiencing rapid urbanization. It is assumed that these GPs have been facing the same issues with the cities; and therefore, there is a possibility that Japanese technology can be utilized to solve similar urban issues in GPs. The criteria for selection are as follows:
1) The target local body shall be located nearby the VMC
2) The target local body shall have high needs in the environmental sector
3) There is a high possibility that Japanese technologies can be applied to solve the issues in the target local body
Source: JICA Study Team
Figure 1-1 Study area in urban and rural area
1.4 Members of the Study Team
The study team consists of the following members:
Table 1-1 Study team members
Position Name
Leader / Sanitation Facility Management Mr. Ichiro KONO
Sewerage Facility and Operation Management
Mr. Takehiko KAWAI
Water Supply Operation Management/Seminar Preparation Support
Ms. Maiko FUKUTOMI
Waste Management Ms. Misa OISHI
Target Study Area

Data Collection Survey on Improvement Japan International Cooperation Agency of Environment in Varanasi City, Republic of India Kokusai Kogyo Co., Ltd. Sewerage Business Management Centre
1-3
1.5 Study Schedule
This study started from July 2015 and ended in February 2016. The first field survey was conducted to clarify the needs in the sanitation field to identify the target sectors. In the second field survey, further investigation was held in the target sectors. The third and fourth surveys were dedicated to discussing the possibility for JICA’s technical cooperation with related organizations on the Indian side in each target sector based on the collected data. The final report of this study was submitted at the end of February in 2016.
Figure 1-2 Schedule of study
1.6 Study Method
This study consists of three phases. The activities taken in each phase are shown in the following diagram.
YearMonth 7 8 9 10 11 12 1 2 3
Study in India
Study in Japan
Report
Study Purpose
20162015
3rd Study 4th Study2nd Study1st Study
1st Phase
seminar
1st Study 2nd Study 3rd Study 4th Study 5th Study
IC/R P/R DF/R F/R
2nd Phase 3rd Phase
Phase 1
• Period:Begining of July -Begining of August 2015• Time of Study:The first Preparatory Work/first Field Study/2nd Preparatory Work
• Purpose:To identify target sectors
Phase 2
• Period:Late August-Late November 2015• Time of Study:The second field study/ third preparatory work/ third field study
• Purpose:To conduct detailed surveys on target sectors
Phase 3
• Period:Begining of December 2015-Mid March 2016• Time of Study:The fourth preparatory work/fourth field study/fifth preparatory work
• Purpose:To investigate specific needs for technical cooepration

Data Collection Survey on Improvement Japan International Cooperation Agency of Environment in Varanasi City, Republic of India Kokusai Kogyo Co., Ltd. Sewerage Business Management Centre
1-4
A. 1st Preparatory Work in Japan (Early July)
A.1 Data Collection and Study on the Water Environment Management
The first preparatory work aimed to collect three categories of data, namely a) city profile of Varanasi, b) summary of water sector management including sewerage management in Varanasi, and c) basic information of target GPs and sanitation facilities. This preparatory work has been done based on the literature review and Internet research. The data that could not be obtained during the first preparatory work was collected in the first field study.
Table 1-2 Data collected in the first preparatory work
Items Organization to study / Source
Study Method
(a) City Profile of Varanasi
【Basic Information】 Population and area by ward, Income level,
Major industries and locations, Electrification rates, Rivers and lakes, Water systems, River basin environment, Religion, Tourism, etc
【Institution and Legal System】 Legal system taken by the central, state and
municipal government, Individual law, Environmental standards, Sewer discharge standard, Degree of legal enforcement, Tariffs for water supply and sewerage services, Laws related to land acquisition
Central Pollution Control Board (CPCB) under Ministry of Environment and Forest (MoEF)
Department of Urban Development, UP Gov’t.
Municipal Corporation of Varanasi (MCV)
JICA Project Report
Literature Review/ Internet
(b) Summary of Water Sector Management in Varanasi
【Basic Information】 Sewerage Management-Coverage of sewer
system in the city, Issues concerned with upstream and downstream, maintenance, effects from ODA loan projects and challenges to materialize sustainable management, etc
Water supply management-service areas, water sources, capacity to develop new water sources, coverage of water supply services, capacity of water treatment facilities, (septic) drain fields, service population, average water supply amount per day, duration of services, percentage of unaccounted water, percentage of meter installations, number of staff, maintenance, quality of water, water pressure, challenges in water supply sectors
【Institution and Legal System】 Monitoring system of NMCG、UPSGRCA、UP
Jal Nigam, MCV, etc, Information of staff and duties, Awareness of policy makers for existing problems, Operation goals
Actions taken by central and local governments on water supply and sewerage facilities management, maintenance costs of water supply and sewerage facilities, water tariffs, sewage charges, collection system of
Central Public Health and Environment Engineering Organization (CPHEEO) under Ministry of Urban Development (MoUD)
National Mission for Clean Ganga (NMCG) under National Ganga River Basin Authority (NGRBA)
Uttar Pradesh State Ganga River Conservation Agency (UPSRCA)
Uttar Pradesh Jal Nigam
MCV
Jawharlal Nehru National Urban Renewal Mission
CPCB
Department of Panchayat Raj, U.P. Gov’t
The National Ganga River Basin Project by World
Literature Review/ Internet
Data Collection Survey on Improvement Japan International Cooperation Agency of Environment in Varanasi City, Republic of India Kokusai Kogyo Co., Ltd. Sewerage Business Management Centre
1-5
property tax and rate, subsidies for installing sanitation facilities and maintenance, microfinance
【Study items related to three target sectors】 Water pollution source and pollution level
Overview of sanitation facilities
Overview of waste collection / transportation
Additionally, donor activities related to the three activities above should be studied
Bank
JICA Project Report
(c) Basic Information of Target GPs
【Basic Information】 Population and area by ward, Income level,
Major industry and its location, electrification rates, rivers and lakes, water system, river basin environment, religion, Tourism, etc
【Institution and Legal System】 Legal system in rural area
【General overview on sanitation facility sector】 Status of sanitation infrastructure development
-water supply and sewerage system-, installation rate of latrines at individual households, open defecation rate, index for public health, awareness raising for sanitation and environmental education, community activities
2011 Census
Department of Panchayat Raj, U.P. Gov’t
JICA Project Report
Literature Review/ Internet
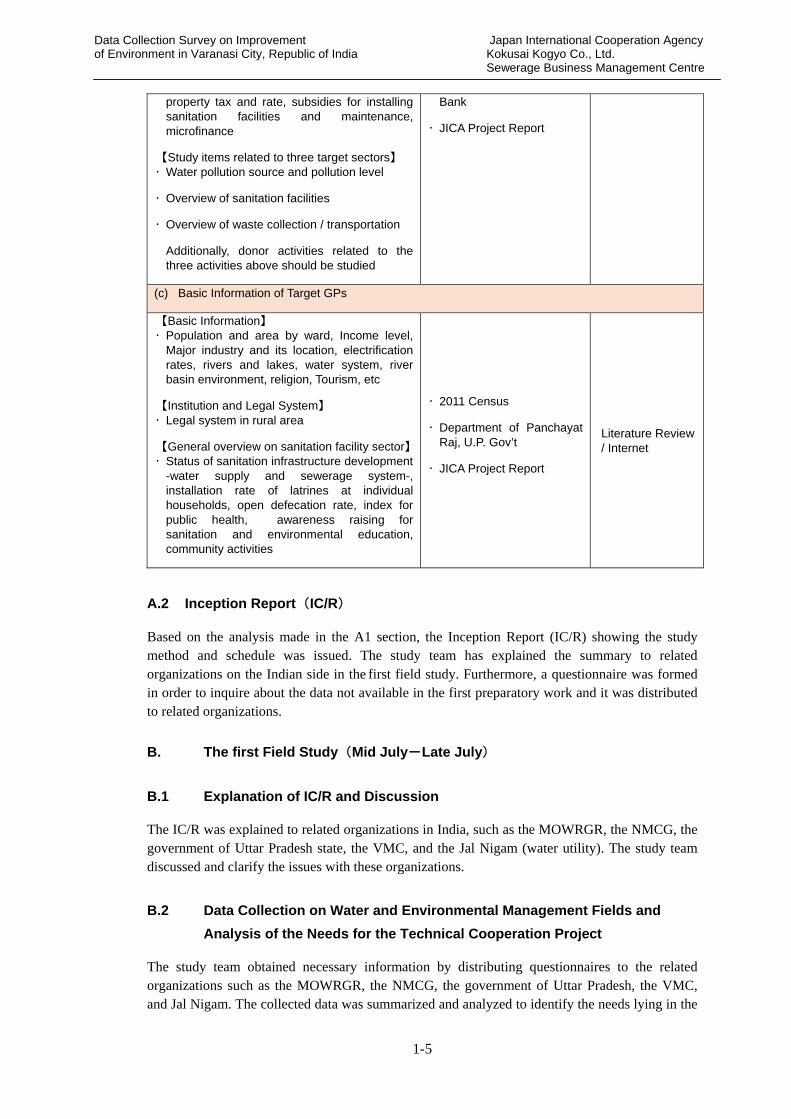
A.2 Inception Report(IC/R)
Based on the analysis made in the A1 section, the Inception Report (IC/R) showing the study method and schedule was issued. The study team has explained the summary to related organizations on the Indian side in the first field study. Furthermore, a questionnaire was formed in order to inquire about the data not available in the first preparatory work and it was distributed to related organizations.
B. The first Field Study(Mid July-Late July)
B.1 Explanation of IC/R and Discussion
The IC/R was explained to related organizations in India, such as the MOWRGR, the NMCG, the government of Uttar Pradesh state, the VMC, and the Jal Nigam (water utility). The study team discussed and clarify the issues with these organizations.
B.2 Data Collection on Water and Environmental Management Fields and
Analysis of the Needs for the Technical Cooperation Project
The study team obtained necessary information by distributing questionnaires to the related organizations such as the MOWRGR, the NMCG, the government of Uttar Pradesh, the VMC, and Jal Nigam. The collected data was summarized and analyzed to identify the needs lying in the

Data Collection Survey on Improvement Japan International Cooperation Agency of Environment in Varanasi City, Republic of India Kokusai Kogyo Co., Ltd. Sewerage Business Management Centre
1-6
areas of water and environmental management.
B.3 Preparatory Work for the First Seminar Regarding Sanitation Facilities
The first seminar was held in Delhi where governmental organizations, NGOs, and intellectuals are located in early September. This seminar aimed to introduce Japanese experience and technologies in improving sanitation as well as awareness raising activities in both India and Japan to discuss the needs for sanitation facility management. During the first field study, the study team set the seminar date, venue, and program. Also, invitation letters was sent to participants such as guest speakers, government officials, and NGOs.
C. The Second Preparatory Work in Japan (Early August)
C.1 Progress Report
The study team summarized the results of the first field survey into a progress report. The progress report clarified the sectors to be focused on by assessing the needs for JICA’s technical cooperation and described the reasons. The progress report also proposed target GPs and their selection criteria.
C.2 Examine Additional Information to be Collected and Determine the Direction
of Study for the Second Field Study
Based on the progress report, the study team discussed the schedule and direction of study for the second field study with JICA. The direction of study and contents for the second field study was incorporated into the progress report.
D. The second Field Study (Late August - Late September)
D.1 Presentation and Discussion of Progress Report
The study team explained the contents of the progress report to the related organizations in India and discussed the direction of study as well as schedule.
D.2 Additional Data Collection Survey for Target Sectors
The study team conducted a survey on target sectors to obtain necessary data. It was presumed that the following information would be needed in each target sector.
D.2.1 Waste Management Sector
The following information was collected in the waste management sector. The detailed plan was finalized based on the results of the first field study.

Data Collection Survey on Improvement Japan International Cooperation Agency of Environment in Varanasi City, Republic of India Kokusai Kogyo Co., Ltd. Sewerage Business Management Centre
1-7
Table 1-3 Data collected in the waste management sector
Items Organizations to study / Source
Method
Institutional Framework and Financial Status of the Waste Management Sector
・ Institutional Structure and Roles
・ Number of Staff and Capability
・ Budgets and Cost Distribution
・ Outsourcing to Private Sector
Varanasi Municipal Corporation(VMC),
Commissioner,
Health Dept/ Engineering Dept.
Interview by study team and local consultants
Intermediate Treatment
・ Situation of intermediate treatment such as composting
Same as above Same as above
Recycling Companies
・ Type of recyclables and price
・ Type of recycling companies
Recycling companies introduced by the VMC
Same as above
Waste Amount and Composition Survey
・ Waste generation amount per capita/ day
・ Waste Composition
Waste management Dept and other related depts. (Health Dept./ Engineering Dept.) of the VMC
Refer to existing survey results / Interview by local consultants
Waste collection (including time and motion survey)
・ Type of collection trucks, duration of use, and number of trucks
・ Maintenance of collection trucks
・ Collection efficiency (T&M survey)
・ Collection cost
Collection company(as of November 2014, the VMC is collecting waste on behalf of collection companies)
Interview by the study team and local consultants
Final disposal site
・ Incoming waste amount to the disposal site
・ Presence of waste picker
・ Disposal fee and payer
・ Environment of surrounding area
Management group at waste disposal site
Same as above
Public opinion survey (POS) for households and business entity
・ Opinions for current waste management and satisfactory level of citizens
・ Waste discharge manner and needs for waste collection service
Urban Area : 50 households in old city along the river, 50 households in city center, 10 business entities including hotel, restaurant, market and others
Same as above
D.2.2 Sanitation Facility Management Sector
The following survey was scheduled in the sanitation facility management field. As for the study in Varanasi City, the survey was conducted to supplement information missing in “the Data Collection Survey on Sanitation Facilities (Latrines) in India in 2014”.

Data Collection Survey on Improvement Japan International Cooperation Agency of Environment in Varanasi City, Republic of India Kokusai Kogyo Co., Ltd. Sewerage Business Management Centre
1-8
Table 1-4 Data collected in the sanitation facility management sector
Items Organizations to study / Source
Method
Policy to promote latrines
・ Availability of public documents, promotion materials, educational documents
・ Subsidy system and users
Administration Dept.
(Department of Urban Development-a state agency- is in charge of urban areas, whereas the Department of Panchayat Raj-a state agency- is responsible for rural areas)
A survey to be conducted to supplement the “JICA Data Collection Survey on Sanitation Facilities (latrines) in India” and also to obtain additional information
POS2
・ Satisfactory level for sanitation facilities
・ Satisfactory level for Ghats
Urban Area:50 households in old city along the river, 50 households in city center
Interview by study team and local consultants
Needs Analysis on Sanitation Facility
・ Necessity for sanitation facility development
・ Challenges for sanitation facility development
・ Public awareness and citizen’s behavioral pattern
・ Factors inhibiting the use of latrines
Same as above Study team will analyze the needs based on the POS
Installation Status of Sanitation Facilities
・ Public toilets
・ Community toilets
・ Individual household toilets
The VMC Engineering Department
State Organization
Department of Panchayat Raj
A survey to be conducted to supplement the JICA “Data Collection Survey on Sanitation Facilities (Latrines) in India” and also to obtain additional information
Sludge Management
・ Existence of maintenance group(s)
・ Condition of sludge withdrawal
The VMC Engineering Department
Sludge withdrawal companies
Interview by study team and local consultants
Sanitation facility at schools
・ Condition of sanitation facilities
・ Health education
Schools Same as above
Public Awareness Raising
・ Method for public awareness raising
・ Method for public awareness raising
Department of Panchayat Raj
NGO
CBO (SHG)
Same as above
Religion and Sanitation Facility
・ Perspective on religion and sanitation
Laws of Manu
Discussion notes of Clericals regarding Ganga Manthan which was established by the NMCG
Additional literature review by referring to the “JICA Data Collection Survey on
Sanitation Facilities (Latrines) in India”
2In urban area, the POS for the sanitation facility sector was conducted at the same timing of the POS for waste management sector, adding the relevant questions. As for rural area, the POS for 150 households was implemented separately.

Data Collection Survey on Improvement Japan International Cooperation Agency of Environment in Varanasi City, Republic of India Kokusai Kogyo Co., Ltd. Sewerage Business Management Centre
1-9
Items Organizations to study / Source
Method
Activities by the Private Sector
・ Microfinance, public group activities such as NGOs using a subsidy system
・ Division of roles between public and private sectors
NGO
Private sector
A survey to be conducted to supplement the JICA “Data Collection Survey on
Sanitation Facilities (Latrines) in India” and also to obtain additional information
Animal Waste Management (water buffalos and stray dogs)
・ Cleaning activities by local government
・ Actions for reducing animal waste
Administration Dept. of local government
Interview by the study team and local consultants
Activities of Public Health Worker and Assistant Nurse
・ Contents of health education
・ Maintenance and Management for sanitation facility
Related Dept. of National Health Mission (Rural/Urban)
Public Health Worker
Assistant Nurse
Same as above
D.2.3 Water Supply and Sewerage Management Sector
The following survey was conducted in the water supply and sewerage management sector. In this sector, a supplemental survey was conducted to obtain the information lacking in the “JICA Integrated Pollution Abatement and River Basin Management Project for Ganga Basin” which was implemented from 2003 to 2005.
Table 1-5 Data collected in the water supply and sewerage management sector
Items Organizations to study / Source
Method
Survey on Water Supply Operation Management
・Current situation of the responsible organization(Capacity of staff, maintenance system, outsourcing to private companies, activities to improve energy efficiency, water pipe network)
・Maintenance condition at water treatment sites and distribution facilities
・Existence of operation management plan for water sector
・Demand forecast and facility development
Varanasi Jal Santhan (Jalkal)
Uttar Pradesh Jal Nigam
Interview by the study team and local consultants
Survey on unaccounted water
・Existence of countermeasures and plans
・Implementation of countermeasures
・Actual loss of water amount caused by unaccounted water(leakage / pipe network)
・Commercial loss caused by unaccounted water(Meter installation / meter reading)
・Data compiling(Drawing of Pipe network, household data)
・Water pipe clogging
Varanasi Jal Santhan (Jalkal)
Uttar Pradesh Jal Nigam
Same as above
Survey on Public Awareness Raising and PR activities
・Water tariffs, meter reading system, client registry, awareness
Varanasi Jal Santhan (Jalkal)
Same as above

Data Collection Survey on Improvement Japan International Cooperation Agency of Environment in Varanasi City, Republic of India Kokusai Kogyo Co., Ltd. Sewerage Business Management Centre
1-10
raising activities for conserving water
・Activities by local consultants and NGOs (Organization name, performance record, customer information)
Uttar Pradesh Jal Nigam
NGOs
Survey on Sewer Management
・Sewer pipe clogging
・Level of hazardous materials
・Treatment of sludge, sales, agricultural applications
・ Use of maintenance equipment (e.g. Cameras, measuring instruments for gas concentration)and existence of maintenance companies
Uttar Pradesh Jal Nigam
Varanasi Jal Santhan (Jalkal)
Uttar Pradesh Pollution Control Board (UPPCB)
Same as above
Survey on the financial condition for water supply and sewer management sectors in Varanasi City
・Water supply:Service population, tariffs (household / business), meter installation rate, unaccounted water rate, tariff collection rates, annual operation cost, revenue, long-term loans payable
・Sewer:service population、tariff for sewer service、tariff collection system, tariff collection rates, sludge withdrawal fee, annual operation cost, long-term loans payable
Varanasi Jal Sathan (Jalkal)
Uttar Pradesh Jal Nigam
Same as above
D.3 Data Collection and Analysis on Sanitation Facility Management Sector in
Target Local Bodies
The following survey was conducted in the target local bodies. The data was collected not to overlap with the data collected in the survey of the sanitation facility management sector as mentioned in D.2.2.
Table 1-6 Data collected in local bodies around Varanasi City
Items Organizations to study / Source
Method
Sanitation Facility Management
Administrative capabilities of rural and urban local bodies
・ Administrative structure of rural local bodies at GP levels, sub-district levels and district levels
・ Administrative structure of urban local bodies
・ Number of administrative /technical officers and capability, waste management, technical level of sewer treatment
District Development Office, Block Development Office, under Department of Panchayat Raj, Nagar Panchayat UP Gov’t Target GPs
Interview by the study team and local consultants
Installation of sanitation facility and maintenance
・ Individual household latrine
・ Community / public toilet
Block Development Office, under Department of Panchayat Raj, UP Gov’t Target GPs
Same as above
Policy to promote installation of latrines
・ Utilization of subsidies for governmental projects
・ Projects to support NGO activities
・ Projects to support other donors
Block Development Office, under Department of Panchayat Raj, UP Gov’t
Target GPs
Same as above
Public awareness raising for sanitation
・ Community activities by female groups, NGOs, other donors, public health workers
NGO/ Other donors
SHGs of Target GPs
Depts. of National Health
Same as above

Data Collection Survey on Improvement Japan International Cooperation Agency of Environment in Varanasi City, Republic of India Kokusai Kogyo Co., Ltd. Sewerage Business Management Centre
1-11
and assistant nurses, etc
・ School activities
Mission (Rural/Urban)
Public health workers and assistant nurses
School staff, Parents and teachers association
Activities by the private sector
・ Microfinance, activities of civic organizations (e.g. NGOs) based on subsidies
・ Division of roles between public sector and private sector
NGO
Private sector
A survey to be conducted to supplement the JICA Data Collection Survey on
Sanitation Facilities (Latrines) in India and also to obtain additional information
POS for sanitation facility
・ Percentage of sanitation facilities in use
・ Satisfactory level for sanitation facilities
Total 150 households (50 households from the three GPs (50 households from each)
Interview by the study team and local consultants
Other issues related to the environment / public health
Administrative capabilities of rural and urban local bodies
・ Administrative structure of rural local bodies at GP levels, Sub-district levels and District levels
・ Administrative structure of urban local bodies
・ Number of administrative /technical officers and capability, waste management, technical level of sewer treatment
District Development Office, Block Development Office, under Department of Panchayat Raj, Nagar Panchayat UP Gov’t Target GPs
Interview by the study team and local consultants
Projects related to waste management
・ Current circumstances on waste collection/ treatment
・ In case the waste collection / treatment service is provided, the same data collection survey as D.3.1 will be conducted.
・ POS
Target GPs Block Development Office, under Department of Panchayat Raj, UP Gov’t
Total 150households (50 households from the three GPs (50 households from each)
Same as above
Projects related to sewer management
・ Current circumstances of sewer treatment and development
・ Budgets of sewer treatment
・ Existence of development plan
・ Existence of subsidy system
Target GPs Block Development Office, under Department of Panchayat Raj, UP Gov’t
Same as above
D.4 Identification of the Needs in Each Target Sector
The study team identified the challenges lying in the target sectors and the needs for technical cooperation, and exchanged opinions with related organizations regarding the direction of

Data Collection Survey on Improvement Japan International Cooperation Agency of Environment in Varanasi City, Republic of India Kokusai Kogyo Co., Ltd. Sewerage Business Management Centre
1-12
technical cooperation.
D.5 Implementation of the First Seminar
The first seminar was held in early September in Delhi. The logistics of the seminar was handled by the study team.
E. The Third Preparatory Work in Japan (October)
E.1 Data Collection on Technologies and Experience in Japan which
contribute to solving challenges lying in the target sectors in India
The study team extracted lessons from the experiences of Japanese municipalities and enterprises in the target sectors, which would be applicable to solve the issues in Varanasi City and local bodies. The information referred to in this preparatory work was as follows:
・ “Seiyu-Renaissance” issued by the Ministry of Land, Infrastructure, Transport and
Tourism
・ Awareness raising and education activities on sanitation facilities managed by the Ministry
of Health, Labour, and Welfare, the Ministry of Education, Culture, Sports, Science and
Technology, and the Ministry of the Environment .
・ Activities taken by the Kyoto municipality regarding beautification of tourist sites,
sanitation facility management, and sewer management
E.2 Direction of Technical Cooperation (Draft)
Based on the second field study, the study team further narrowed down the needs of JICA’s technical cooperation and firstly suggested the direction of cooperation to JICA as a draft basis. The draft proposal included the reasons to form technical cooperation projects, cooperation purpose, cooperation framework, pre-conditions for cooperation, important assumptions, and promotion activities. Three proposals for each target sector were presented.
E.3 Discussion on Study Policy for the Third Phase
Based on the discussion with JICA, the study team made a study plan and policy for the 3rd phase.
F. The Third Field Study(November)
F.1 Explain the Study Results and Narrow down the Needs for Technical
Cooperation
The study team explained the results of the study so far, which included the needs for technical cooperation in target sectors, and showed the study policy and schedule for the third field study to the Indian side. Based on this summary, the study team discussed with the Indian side to further narrow down the needs; that is, they strived to further specify the desired details and direction of the technical cooperation project to be proposed (see F.2 below).

Data Collection Survey on Improvement Japan International Cooperation Agency of Environment in Varanasi City, Republic of India Kokusai Kogyo Co., Ltd. Sewerage Business Management Centre
1-13
F.2 Presentation of Draft Proposal for Technical Cooperation
The draft proposal showing the direction of technical cooperation was presented to the Indian side. The opinions and responses of the Indian side obtained in this meeting was reflected into the draft proposal.
F.3 Cooperation for the India-Japan Seminar in the Varanasi City
The study team cooperated for organizing the India-Japan seminar in Varanasi City, which was hosted by the team of preparatory survey on Ganga rejuvenation project. In the seminar, the study team explained the study details as well as provided study progress.
G. The Fourth Preparatory Work in Japan(December)
G.1 Preparation of Draft Final Report and Discussion on the Direction of
Technical Cooperation
The study team has prepared a draft final report based on the third field study, and further narrowed down the direction of technical cooperation through discussions with JICA.
H. The Fourth Field Study(Early January in 2016)
H.1 Presentation of Draft Final Report and Discussion
The study team presented the draft final report to the related organizations of the Indian side and gained approval on the report.
I. The Fifth Preparatory Work in Japan(February in 2016)
I.1 Submission of Final Report
The study team summarized the results of the study and finalize the study report.

Data Collection Survey on Improvement Japan International Cooperation Agency of Environment in Varanasi City, Republic of India Kokusai Kogyo Co., Ltd. Sewerage Business Management Centre
2-1
2 Overview of Study Area in Varanasi
2.1 Location of Study Area
Varanasi City and other study areas are located in the Varanasi District of Uttar Pradesh (UP) State, which lies in the Northern part of India. Varanasi City, the capital city of the District, is located in the south-east of the District, facing Ramnagar City on the other side of the south bank of the Ganga River. As for the three GPs, all of them are located around Varanasi City.
Figure 2-1 Location of Varanasi District

Data Collection Survey on Improvement Japan International Cooperation Agency of Environment in Varanasi City, Republic of India Kokusai Kogyo Co., Ltd. Sewerage Business Management Centre
2-2
Source: The JICA Study Team(Location of GPs is not in scale)
Figure 2-2 Location of study areas
2.2 Climate
The Varanasi area experiences a humid subtropical climate with large variations in temperatures between summer and winter. The dry season starts from April to June with the temperature being over 40 degrees Celsius, whereas the temperature goes down below 10 degrees Celsius during the winter season from November to January. The rainy season starts from July and continues until October with the monthly average rainfall being 309.9 mm in July, which is the highest level of rainfall over the period.
Source: Data extracted from the website of World Meteorological Organization
Figure 2-3 Temperature and rainfall in Varanasi

Data Collection Survey on Improvement Japan International Cooperation Agency of Environment in Varanasi City, Republic of India Kokusai Kogyo Co., Ltd. Sewerage Business Management Centre
2-3
2.3 Population of Study Area
According to the 2011 Census, Varanasi City has a population of 1,198,491, which is the largest population of all urban local bodies in the Varanasi district, while Ramnagar City, the second largest urban body, has a population of 49,132. At the GP level, Suzabad, Sirgorbardhanpur, and Shivdhaspur have populations of 15,384, 11,350, and 16,405 respectively. The table below shows the summary of populations and households in each study area.
Table 2-1 Population and households in study area
Type of City Total Male Female
Household Population Population % Population %
Varanasi City Municipal
Corporation 190,835 1,198,491 635,140 53.0 563,351 47.0
Ramnagar City Municipal
Board 7,729 49,132 26,071 53.1 23,061 46.9
Shivdhaspur GP 2,614 16,405 8,616 52.5 7,789 47.5
Sir
Gorbardhanpur GP 1,708 11,350 6,053 53.3 5,297 46.7
Suzabad GP 2,514 15,384 8,239 53.6 7,145 46.4
Source: 2011 Census
2.4 River and Drainage
Varanasi City is located on the bank of the Ganga River, which flows from the Himalayas in a generally southeasterly direction to the Bay of Bengal, but flows in a northerly direction through Varanasi. Two tributaries join the Ganga River in Varanasi. One is the Varuna River, a major tributary that flows from the northern part of the city; and the other is the Assi River, a small stream located in the south of the city. In Varanasi City, both of the rivers have an important function as natural drainage. Most of the rainwater drained into these rivers will eventually converge into the Ganga River.

Data Collection Survey on Improvement Japan International Cooperation Agency of Environment in Varanasi City, Republic of India Kokusai Kogyo Co., Ltd. Sewerage Business Management Centre
2-4
Source: The JICA Study Team
Figure 2-4 Rivers in Varanasi City
2.5 Major Industries
According to the “Human Development Report for Uttar Pradesh in 2007”, a major industry in the Varanasi District is the service (tertiary) industry, accounting for 53.2% of Net District Domestic Product of the Varanasi district in 2004. As being a sacred city for Hinduism and other religions, the city attracts more than one million pilgrims as well as twenty thousand tourists over the year. This contributes to the flourishing service industries such as tourism and related businesses. Following the service industry, the secondary industry which is represented by weaving and manufacturing of silk products accounts for 31.2% of overall industry and is represented by the primary industries such as agriculture have a share of 15.7%.

Data Collection Survey on Improvement Japan International Cooperation Agency of Environment in Varanasi City, Republic of India Kokusai Kogyo Co., Ltd. Sewerage Business Management Centre
2-5
Source:Human Development Report of Uttar Pradesh in 2007
Figure 2-5 Industrial structure in Varanasi District
2.6 Major Landmarks
Being one of the oldest and most sacred cities in India, the Varanasi City has been a major tourist destination. The city holds a number of historical and religious landmarks such as temples and ghats along the Ganga river which attract many tourists throughout the year. Following table shows major landmarks in the Varanasi City.
Table 2-2 Historical architectures
Type of Architecture
Ghats Ghats are steps that lead down to the Ganga River. In Varanasi City, more than 80 ghats are located along the river.
Temples In Varanasi, more than 2000 temples exist in the city. Most of them are located along the Ganga River.
Kunds Kunds are a type of architecture associated with religious rituals. Most kunds are found in the temple complexes or along the ghats.
Banaras Hindu University (BHU)
The BHU was established as a national university in 1917 and has been one of the largest residential universities in India. It is located in the south of the city and has more than 20,000 students.
Source : City Sanitation Plan in 2011
2.7 Income Level
In the Varanasi district, annual income per capita in 2004-2005 was estimated to be Rs 6,027 according to the “Human Development Report for Uttar Pradesh in 2007”3. Considering the fact that the annual income per capita in India in the same period was Rs 19,297, it is understood that
3 http://hdr.undp.org/sites/default/files/india_uttar_pradesh_2007.pdf

Data Collection Survey on Improvement Japan International Cooperation Agency of Environment in Varanasi City, Republic of India Kokusai Kogyo Co., Ltd. Sewerage Business Management Centre
2-6
the income level of Varanasi is approximately one-third of Indian average.
Using the poverty line as a measure, the Planning commission reported that the population under the poverty line (2011-2012) in the UP state was 30.4% in urban area and 26.06% in rural area. Compared the figures with the Indian average of 13.7% in urban area and 25.7 % in rural area, the percentage of people under the poverty line in the UP state is particularly high in urban area.
Table 2-3 Population under the poverty line in 2011-2012 in urban and rural area
No of persons (Thousands)
% of persons Poverty Line(Rs)
All India Urban 53,125 13.70 1000.00
Rural 216,658 25.70 816.00
UP State Urban 11,884 30.40 941.00
Rural 47,935 26.06 768.00
Source: Planning Commission 2013

Data Collection Survey on Improvement Japan International Cooperation Agency of Environment in Varanasi City, Republic of India Kokusai Kogyo Co., Ltd. Sewerage Business Management Centre
3-1
3 Legal Framework for Environmental Management
3.1 Legal Framework and Major Policies for Environmental Management
3.1.1 Laws and Regulations for Environmental Management
It is clear that the state governments had played a major role in environmental management and pollution control after Independence. Laws and regulations at the central level have been adopted only since the United Nations Conference on the Human Environment at Stockholm in 1972. For example, after the conference, a series of laws and regulations, i.e. The Water (Prevention and Control of Pollution) Act, 1974, The Water (Prevention and Control of Pollution) Cess Act, 1977, The Air (Prevention and Control of Pollution) Act, 1981 and The Environment (Protection) Act, 1986 were enacted.
In this section, as fundamental laws and regulations for environmental management, the Constitution (42nd Amendment), The Environment (Protection) Act and The Environment (Protection) Rules will be explained.
a. The Constitution (Forty Second Amendment)
The amendment clearly states in Article 48-A that “the State shall Endeavour to protect and improve the environment and to safeguard the forests and wildlife of the country”. Further, a new provision, Article 51-A, in the form of “Fundamental Duties” was also incorporated by the 42nd Amendment. According to the sub-clause (g) of Art. 51-A, “it shall be the duty of every citizen of India to protect and improve the natural environment including forests, lakes, rivers and wildlife and to have compassion for living creatures”. The above two provisions impose two-fold responsibilities. On the one hand, it gives directive to the State for protection and improvement of environment, and on the other hand, it casts/imposes a duty on every citizen to help in the preservation of the natural environment.
From the environmental-management point of view, allocation of legislative authority is very important. The constitution of India deals exhaustively with legislative powers pertaining to environmental law. The legislative powers under the scheme of the constitution are divided into three lists viz., the Union List or List, the State List and the Concurrent List. The sectors which are covered under this study, namely (i) water supply and wastewater management, (ii) solid waste management and (iii) sanitation facilities come under the State List.
b. The Environment (Protection) Act
It was enacted in 1986 with the objective of providing for the protection and improvement of the environment. It empowers the Central Government to establish authorities charged with the mandate of preventing environmental pollution in all its forms and to tackle specific environmental problems that are peculiar to different parts of the country. The Act was last amended in 1991.
c. The Environment (Protection) Rules
The rules enacted in 1986 and amended in 2003 are based on the Environmental (Protection) Act. The rules specify, for example, effluent standards from the sewerage treatment plants depending

Data Collection Survey on Improvement Japan International Cooperation Agency of Environment in Varanasi City, Republic of India Kokusai Kogyo Co., Ltd. Sewerage Business Management Centre
3-2
on each effluent stream, i.e. inland surface water, irrigation facilities, public sewer and ocean. In addition, the effluent standards of industrial wastewater from factories, etc. are specified in these rules.
3.1.2 National Policies and Programs
a. The 12th Five Year Plan
The 12th Five Year Plan (2012-2017) sets its objective as “Faster, More Inclusive and Sustainable Growth” and targets an average economic growth rate of 8.0% during the period. The plan, which covers entire sectors, consists of 24 chapters4. As for the sanitation sector, firstly it is clearly stated that a PPP (public-private partnership) shall be positively looked on for financing sanitation infrastructure, especially in the urban areas in the chapter of “Financing the plan”. Then in the chapter of “Water”, it is clearly stated that “No Water Scheme Will be Sanctioned without a Sewerage Component, Which Joins the Dots with Pollution of Rivers and Waterways” by reflecting the strong concern towards river pollution from wastewater. In another related chapter “Environment, Forestry and Wildlife”, the following monitorable objectives are set for the water and sanitation issues:
Clean 80 per cent of critically polluted stretches in rivers by 2017 and 100 percent by 2020.
Promote recycling and reusing treated sewage in urban projects such as sanitation, landscaping, central air conditioning and so on.
In addition, the new initiative named “Enhancement of Sewage Treatment Capacity” is introduced in the same chapter. The new initiative clearly states that while the National River Conservation Plan (NRCP) and Jawaharlal Nehru National Urban Renewal Mission (JNNURM)5 continue to play important roles for financing infrastructure development, the state government shall play active roles to enhance capacities of local governments who operate and maintain developed infrastructure6.
b. National Urban Sanitation Policy: NUSP
With the aim of improving the sanitation situation in urban areas, the Government of India (GoI) sanctioned a policy paper prepared by the Ministry of Urban Development (MoUD) as the National Urban Sanitation Policy (NUSP). This document outlines the following aspirational sanitation vision for Indian cities (MOUD 2008):
“All Indian cities and towns should become totally sanitised, healthy and liveable and ensure and sustain good public health and environmental outcomes for all their citizens with a special focus on hygienic and affordable sanitation facilities for the urban poor and women.”
4 The five-year plan is compiled in three volumes. The first volume consists of 11 chapters namely 1. Twelfth Plan: An Overview, 2. Macroeconomic Framework, 3. Financing the Plan, 4. Sustainable Development, 5. Water, 6. Land Issues, 7. Environment, Forestry and Wildlife, 8. Science and Technology, 9. Innovation, 10. Governance and 11. Regional Equality. The second volume consists of eight chapters namely 12. Agriculture, 13. Industry, 14. Energy, 15. Transport, 16. Communication, 17. Rural Development, 18. Urban Development and 19. Other Priority Sectors. The third volume consists of five chapters namely 20. Health, 21. Education, 22. Employment and Skill Development, 23. Women’s Agency and Child Rights and 24. Social Inclusion. 5 Under the Modi Administration, JNNURM is restructured and renamed as Atal Mission for Rejuvenation and Urban Transformation (AMRUT). Basically as same as JNNURM, AMRUT continues to provide funds with Urban Local Authorities to develop urban infrastructure including water and sanitation sector. 6 As for the sanitation facilities, it is better to refer the section explained Swachh Bharat Mission (SBM).

Data Collection Survey on Improvement Japan International Cooperation Agency of Environment in Varanasi City, Republic of India Kokusai Kogyo Co., Ltd. Sewerage Business Management Centre
3-3
In order to achieve the vision of NUSP, the policy sets the overall goal as “to transform Urban India into community-driven, totally sanitized, healthy and liveable cities and towns” through generating awareness to trigger behavior change, creating open defecation free cities, and taking an integrated city-wide sanitation approach. In line with the vision and policy goals, the state government shall formulate a State Sanitation Strategy (SSS)7 and the major cities shall draw up a City Sanitation Plan (CSP).
c. National River Conservation Plan (NRCP)
The river conservation program in the country was initiated with the launching of the Ganga Action Plan (GAP) in 1985. The Ganga Action Plan was expanded to cover other rivers under the National River Conservation Plan (NRCP) in the year 1995. In order to improve water quality of rivers, pollution abatement schemes such as construction of sewerage treatment plants in cities along the rivers have been implemented8.
d. Jawaharlal Nehru National Urban Renewal Mission(JNNURM) and Atal Mission for Rejuvenation and Urban Transformation(AMRUT)
The JNNURM started in 2005 under the supervision of MOUD in order to invest in urban infrastructure for modernization of urban cities with the budgetary allocation of US$ 20 billion for the seven years till 2012. The JNNURM continued until March 2014, and from then onward the new scheme named as Atal Mission for Rejuvenation and Urban Transformation (AMRUT) under the Modi administration provides funds for urban infrastructure development in place of the JNNURM. The AMRUT plans to provide more than 500 urban local bodies including medium and small-sized ones with funds of US$ 7 million for the five years from FY2015. Thrust areas of both missions are urban sanitation such as water supply and sewerage facilities, urban transportation and urban re-development.
e. Swachh Bharat Mission (SBM)
Prevalence of open defecation is still a big challenge for rural sanitation in India, and by acknowledging the urgency of the issue, the GoI has been making efforts to eradicate it through centrally-sponsored programs such as Central Rural Sanitation Programed (CRSP), Total Sanitation Campaign (TSC) and Nirmal Bharat Abhiyan (NBA) since as early as mid-1980s. Despite such efforts by the GoI, open defecation remains stubbornly widespread in India. The new Modi Administration took up the issue seriously and initiated the new program called SBM. Unlike the CRSP, the TSC and the NBA that target only rural sanitation, SBM consists of two sub-missions, i.e. the SBM (Rural) for rural sanitation and the SBM (Urban) for urban sanitation, in particular, eradication of open defecation in urban slums. Major components of the SBM and the supervisory agencies of each component are as follows.
7 Not many states have formulated SSS yet, but according to MOUD (http://moud.gov.in/sites/upload_files/moud/files/List_Of_SSS_Cities.pdf) Uttar Pradesh is one of the states that formulated the draft SSS. However, the draft SSS of U.P. is not publicized on the web. 8 Rejuvenation of the Ganga gained so much attention culturally as well as politically. For this purpose, National Ganga River Basin Authority (NGRBA) was established in 2009. An implementing wing of NGRBA, National Mission for Clean Ganga (NMCG) is an implementing agency of JICA’s Yen Loan Programs in this sector.

Data Collection Survey on Improvement Japan International Cooperation Agency of Environment in Varanasi City, Republic of India Kokusai Kogyo Co., Ltd. Sewerage Business Management Centre
3-4
Table 3-1 Components of the SBM and supervisory agency
Components Supervisory Agency
Urban Local Bodies Rural Local Bodies
Individual Household Latrines MOUD MODWS
School Latrines DOSE DOSE
Anganwadi (Nursery) Latrines MOWCD MOWCD
Solid and Liquid Waste Management
MOUD MODWS
Community Toilet Complex MOUD MODWS
DOSE: Department of School Education, under Ministry of Human Resource MOWCD:Ministry of Women Child and Education
3.1.3 Individual Laws and Regulations
a. Prevention of Water Pollution
a.1 The Water (Prevention and Control of Pollution) Act
The Water (Prevention and Control of Pollution) Act was enacted in 1974 and amended in 1988 to provide for the prevention and control of water pollution and to maintain or restore the wholesomeness of water in the country. The Act sets more than 60 effluent standards for each different industry.
a.2 The Water (Prevention and Control of Pollution) Rules
The rules formulated in 1975 are in accordance with the Water (Prevention and Control of Pollution) Act. The roles and responsibilities of the Central Pollution Control Board (CPCB) are detailed in the rules.
a.3 The Water (Prevention and Control of Pollution) Cess Act
The Water (Prevention and Control of Pollution) Cess Act was enacted in 1977, to provide for the levy and collection of a cess on water consumed by persons operating and carrying on certain types of industrial activities. This cess is collected with a view to augment the resources of the Central Board and the State Boards for the prevention and control of water pollution constituted under the Water (Prevention and Control of Pollution) Act, 1974. The Act was last amended in 2003.
b. Solid Waste Management
In India, waste is categorized into three types; Municipal Solid Waste (MSW), Hazardous Waste and Bio-Medical Waste.
b.1 The Municipal Solid Wastes (Management and Handling) Rules
Under the Municipal Solid Waste (Management & Handling) Rules, every municipal authority is to be responsible for collection, segregation, storage, transportation, processing and disposal of municipal solid waste. The major points are as follows

Data Collection Survey on Improvement Japan International Cooperation Agency of Environment in Varanasi City, Republic of India Kokusai Kogyo Co., Ltd. Sewerage Business Management Centre
3-5
Collection and Separation at Source:
Local authorities shall collect waste from households, institutions and collection points. Special attention shall be given to segregate SWM and other waste such as hazardous and bio-medical waste. Also, SWM shall be segregated into biodegradable, recyclables and non-biodegradable.
Local authorities shall place collection bins along streets. Biodegradable waste shall be processed in order to reduce its final disposed volume at
the final disposal site.
Final Disposal:
Affects to ground water shall be deeply considered for the selection of final disposal sites.
Waste shall be covered immediately or at the end of each working day with a minimum 10 cm of soil. Also, pollution by leachate shall be prevented by proper management.
A non-permeable lining system at the base and walls of waste disposal area(s) shall be constructed.
Effluent generated shall be treated and discharged as per relevant norms, namely Environment (Protection) Rules, 1986.
Water quality as well as ambient air quality at the vicinity shall be monitored. Biogas generated shall be appropriately used. The post-closure care, including monitoring, of landfill site(s) shall be conducted for
at least fifteen years.
b.2 The Hazardous Wastes (Management and Handling) Rules
Hazardous Waste Management (Management and Handling) Rules are enacted to ensure the following: safe handling, generation, processing, treatment, packaging, storage, transportation, reprocessing, collection, conversion, and offering for sale, destruction and disposal of Hazardous Waste. These Rules came into effect in the year 1989 and were amended later in the years 2000, 2003 and with final the enactment of the Hazardous Waste (Management, Handling and Trans-boundary Movement) Rules in 2008, which superseded former enactments.
The Rules lay down corresponding duties of various authorities such as the MoEF, CPCB, state governments, etc. While the identification of hazardous waste and approval of imports and exports of such waste are responsibilities of MoEF, categorization of hazardous waste and formation of standards for safe handling and disposal are responsibilities of the CPCB. state governments shall identify the proposed sites for Treatment Storage Disposal Facility (TSDF), while the State Pollution Control Board (SPCB) shall prepare the inventory of hazardous waste in each state.
b.3 The Bio-Medical Waste (Management and Handling) Rules
Bio-medical Waste (Management & Handling) Rules were enacted in 1998 and amended in 2003 by MoEF under the Environment (Protection) Act, 1986. These rules apply to all persons who generate, collect, receive, store, transport, treat, dispose or handle bio-medical waste in any form.

Data Collection Survey on Improvement Japan International Cooperation Agency of Environment in Varanasi City, Republic of India Kokusai Kogyo Co., Ltd. Sewerage Business Management Centre
3-6
b.4 The Plastics Manufacture, Sale and Usage Rules
The Plastics Manufacture, Sale and Usage Rules were enacted in 1999 and amended in 2003. The
Rules regulate plastic packaging for food and restrict thin plastic bags.
b.5 The Batteries (Management and Handling) Rules
The Batteries (Management and Handling) Rules have been enacted since 2000. The Rules lay down the duties of every manufacturer, importer, re-conditioner, assembler, dealer, recycler, auctioneer, consumer and bulk consumer involved in manufacture, processing, sale, purchase and use of batteries or components thereof.
b.6 e-Waste (Management and Handling) Rules
The e-waste (Management & Handling) Rules were enacted in 2011 and amended in 2015. The e-waste Rules place the main responsibility of e-waste management on the producers of the electrical and electronic equipment by introducing the concept of “extended producer responsibility”. The producers shall establish a system for recycling their own products.
3.2 Institutional Framework and Organizations for Environmental Management
3.2.1 Institutional Framework
The names and the responsibilities of major institutions and organizations engaged in environmental management in Varanasi are summarized in the table below. As for Jal Kal, the interview with the officials reveals that although it was formally merged into VMC, it functions quite independently in terms of its finance as well as personnel affairs as of September 2015.
Table 3-2 Roles and responsibilities of major institutions in Varanasi
Names Major responsibilities
State-level
UP Pollution Control Board (UPPCB)
Pollution control and monitoring, especially river water quality monitoring, and regulating industries.
State Urban Development Agency(SUDA)
The highest-level policy-making and monitoring agency for the urban areas of the state. Responsibilities for providing overall guidance to the District Urban Development Authority (DUDA) for implementation of community development program.
UP Jal Nigam (UPJN)
Water supply and sewerage including design and construction of water supply, sewerage networks and treatment plants. In the last two decades, ‘pollution control of rivers’ has become one of their primary areas of focus.
City-level
Varanasi Jal Kal (VJK)
Nodal agency for water supply in the city. Key functions include O&M of water supply and sewerage assets. Jal Kal proposes tariffs and collects revenues. However, tariffs need to be approved by UP Jal Nigam as well as the state government.
Varanasi Municipal Corporation (VMC)
Nodal agency for municipal service delivery and O&M. Its key functions are: ・ Primary collection of solid waste

Data Collection Survey on Improvement Japan International Cooperation Agency of Environment in Varanasi City, Republic of India Kokusai Kogyo Co., Ltd. Sewerage Business Management Centre
3-7
・ Maintenance of storm water drains
・ Maintenance of internal roads
・ Allotment of trade licenses under the Prevention of food Adulteration Act
・ Collection of property tax
・ O&M of internal sewers and community toilets
・ Management of Ghats
・ Construction of community toilets
Varanasi Development Authority (VDA)
Responsible for preparing spatial master plans for land use and development of new areas as well as provision of housing and necessary infrastructure.
District Urban Development Authority (DUDA)
Implementing agency for plans prepared by SUDA. Responsible for the field work relating to community development, focusing on the development of slum communities, construction of community toilets, assistance in construction of individual household latrines, raising awareness, etc.
Source: City Sanitation Plan in 2011
3.2.2 Structure and Functions of Major Institutions in Urban Areas
a. Varanasi Municipal Corporation (VMC)
a.1 Background
The Varanasi Municipal Corporation was established on 24th January, 1959 under the Uttar Pradesh Municipal Corporation Act of 1959 as a Nagar Mahapalika. In 1994, it was converted into a Municipal Corporation under the U.P. Government Act -2. It falls under the department of Urban Development. The 90 wards of the city are grouped into five different zones. At present, the total area under the VMC is 79.79 Sq. Km. with a total population of 1,198,491 as per 2011 Census. The total length of road administered by the VMC is 1170 km.
a.2 Organizational Structure of the VMC
A municipal commissioner is the highest-rank administrator as well as an executive officer who is responsible for implementing policies and programs decided at the municipal assembly, unlike the mayor who does not have any executing authority. The state government appoints a municipal commissioner.
The organizational structure of the VMC is as shown in the figure below. The Public Health Department is responsible for solid waste management. Under the Chief Health Officer, the top of the department, 4 Zonal Sanitary Officers, 12 Sanitary Inspectors, 34 Sanitary Supervisors and 2,600 sanitary workers carry out day-to-day waste collection activities. Though the Public Health Department is also responsible for food hygiene in the city, waste collection mainly done by 2,600 sanitary workers is indeed the department’s prime work.

Data Collection Survey on Improvement Japan International Cooperation Agency of Environment in Varanasi City, Republic of India Kokusai Kogyo Co., Ltd. Sewerage Business Management Centre
3-8
Source: The interview by the study team in September 2015
Figure 3-1 Organizational structure of the VMC
a.3 Financial Status of the VMC
The table below shows the revenue of the VMC from FY2008 to FY2012. Total revenue of FY2012, Rs. 20.8 billion, consists of tax revenue (14%), non-tax revenue (44%) and assigned revenue and grants (42%). Although water and sewage charges amount to approximately 60% of non-tax revenue, these charges are directly collected and used by Jal Kal, and the Account Department of the VMC is unclear about this. In addition, it is worth noting here that though sewage taxes and charges are regulated as 25% of water taxes and charges, only approximately 10% of them are collected due to limited capacity of collection, etc.

Data Collection Survey on Improvement Japan International Cooperation Agency of Environment in Varanasi City, Republic of India Kokusai Kogyo Co., Ltd. Sewerage Business Management Centre
3-9
Table 3-3 Revenue of the VMC9
Unit: Lahks Rs
Table 3-4 Expenditure of the VMC
Unit: Lahks Rs
9 The figures are based on the City Development Plan. Details are checked by the study team during the interview with the officers of VMC.
2008 2009 2010 2011 2012 %
Tax RevenueProperty Tax 1,186 1,358 1,384 2,500 2,600Consolidated Tax 133 138 234 408 408
Sub Total 1,319 1,496 1,618 2,908 3,008 14%Non Tax Revenue
Rent from Municipal Properties 170 196 147 695 905Building Permit fees 347 576 917 1,100 2,200Fees from licenses 13 13 15 22 22Road cutting fees 96 450 849 1,000 1,200Water Taxes and charges 1,616 1,582 1,692 3,515 3,865Sewage Taxes and charges 142 251 331 328 340Others 76 111 153 558 577
Sub Total 2,460 3,179 4,104 7,218 9,109 44%Assigned Revenue and Grants
Genral Programs 28 4 2,282 750 750Life Insurance for State Gov. Employee 19 18 4 30 30Education Grant 6 24 10 38 40Other State Gov. Grant 154 -710 206 300 300Family Planning 70 50 90 80 100State Finance Commission 3,738 4,196 5,317 6,300 7,500
Sub Total 4,015 3,582 7,909 7,498 8,720 42%
Total 7,794 8,257 13,631 17,624 20,837 100%
Item of RevenueFiscal Year
2008 2009 2010 2011 2012 %Salaries
Finance and Revenue Department 432 464 561 725 635General Administration 243 285 323 443 396Public Works 363 393 471 642 605Public Health Department 2,990 3,014 3,254 4,740 4,505Other Department 428 222 140 160 150Pension, PF and others 659 826 859 1,600 2,000Water Works (Jalkal) 1,242 0 2,073 853 2,155
Sub Total 6,357 5,204 7,681 9,163 10,446 54%Operation and Maintenance
General Administration 373 320 1,044 3,538 5,470Public Works 117 120 148 225 210Education, Sports and youth welfare 1 1 1 6 6Public Health Department 47 25 12 446 426Solid Waste Management 210 197 215 212 212Zonal & Other Department 74 69 49 128 121Water Works(Jal Kal) 920 0 2,714 74 2,458
Sub Total 1,742 732 4,183 4,629 8,903 46%
Total 8,099 5,936 11,864 13,792 19,349 100%
ItemFiscal Year

Data Collection Survey on Improvement Japan International Cooperation Agency of Environment in Varanasi City, Republic of India Kokusai Kogyo Co., Ltd. Sewerage Business Management Centre
3-10
For the above five years, expenditures have not exceeded revenues. In case of FY2012, more than 50% was used for salaries, and among salaries paid by each department, the amount paid by the Public Health Department (Rs 4.5 hundred million), which employs more than 2,600 sanitary workers, is remarkably large. On the contrary, only Rs 0.2 hundred million is used for operation and maintenance of solid waste management, reflecting the fact that mechanization is not in place yet. Also, Rs 2.5 hundred million is used for operation and maintenance of water supply and sewerage management, though this amount is expensed from their own financial sources.
b. Varanasi Jal Kal (VJK)
The Varanasi Jalkal was dissolved from the VMC in 1974, by a mandate in one of the World Bank schemes, in order to avail funds for improvement in water supply facilities. Later in 2010, it merged with the VMC, continuing to undertake responsibility for water supply and sewerage discharge. Though it continues to have a large amount of autonomy with regards to administrative and financial functions, the Municipal Commissioner is responsible for its performance.
b.1 Organizational Structure of Jal Kal
The organizational structure of Jal Kal is as shown in the figure below.
Source: The interview by the study team in September 2015
Figure 3-2 Organizational structure of Jal Kal
b.2 Roles and Functions of Jal Kal
UP Jal Nigam is responsible for constructing water supply and sewerage infrastructure, the ownership of which is then transferred to Jal Kal. As such Jal Kal is not (and has not been) responsible for planning and/or construction of new infrastructure. The private sector is involved in the operation and maintenance of the tube wells and vehicles, and cleaning works of campuses through service contracts for certain areas only.
Some of its functions are:
Draw water from the Ganga River and from 167 tube wells Provide water supply and undertake operation and maintenance of water supply
network Undertake operation and maintenance of sewerage network (Except STP) Construct new water supply and sewer lines at micro level

Data Collection Survey on Improvement Japan International Cooperation Agency of Environment in Varanasi City, Republic of India Kokusai Kogyo Co., Ltd. Sewerage Business Management Centre
3-11
Solely authorized to collect taxes and user charges for water supply and sewerage Address complaints regarding its services
b.3 Challenges
Jal Kal has faced the following challenges:
The utility has no master development plan nor does it have an annual report or a management information system.
The department is very weak in finances, as the amount of water and sewerage taxes are very low and collection efficiency is also very low.
It faces public resistance in increasing taxes. Due to weak finances, it cannot afford to pay its electricity bills. These are being paid
by the VMC on its behalf on a regular basis. The department levies taxes as well as water and sewerage charges on the users, based
on the Annual Rental Value (ARV) of properties worked out by the VMC. As the collection efficiency is low, it is difficult to meet the revenue expenditures as well. This causes major issues in operations and management of the systems.
c. Varanasi Development Authority (VDA)
The VDA has physical jurisdiction over the VMC area and an additional peripheral belt of 8 km from the VMC boundary. It falls under the department of Housing and Urban Planning of the UP state government. The VDA is responsible for planning of service provision regarding water and sanitation facilities in new development area, issuance of a construction permission of new buildings, and monitoring on construction progress.
c.1 Organizational Structure of VDA
The organizational structure of VDA is shown in the figure below.
FinancingPlanningEngineeringAdministration
Chairman
Vice Chairman
Secretry Executive EngineerAssisting Town Development
Finance
Additional Secretary
Assistant Engineer Accounts
Joint. Secretary Junior Engineer
Senior Draughtman
Assistant Accounts
Deputy Collector
Under Secretary
Tracer
Surveyor Accountant
Cashier
Source: City Sanitation Plan in 2011
Figure 3-3 Organizational structure of VDA

Data Collection Survey on Improvement Japan International Cooperation Agency of Environment in Varanasi City, Republic of India Kokusai Kogyo Co., Ltd. Sewerage Business Management Centre
3-12
c.2 Roles and Functions of VDA
The VDA undertakes all the activities related to land use, zoning, development, implementation of DCRs, and providing building permission. It also prepares a detailed plan for the city at an interval of every 10 years. It also has to make sure that all regulations and building by laws are being adhered to.
The infrastructure creation for water and sewerage in the new developed colonies is done by the VDA.
d. District Urban Development Authority (DUDA)
The District Magistrate is the chairman of DUDA. His responsibility is coordination to avoid functional overlaps amongst various agencies. The VMC has representatives in the member body of DUDA, so overlaps are taken care of during project sanctioning.
DUDA falls under the State Urban Development Authority (SUDA) and SUDA is playing a role as funding agency to distribute the fund to each DUDA for implementing various projects.
d.1 Organizational Structure of DUDA
The organizational structure of DUDA is shown in the figure below.
District Magistrate (Chairman)
Elected Reps. of all Local Bodies
Executive Officers of all Local Bodies
Executive Engineer Jal Nigam
Additional MNA (Secretary)
Chief Medical Officer
Lead District Manager
Project Officer
Assistant Project Officer
Polytechnic Principal
Junior Engineer
Accountants
Grade Ⅳ officer
Source: City Sanitation Plan in 2011
Figure 3-4 Organizational structure of DUDA
d.2 Role and Responsibility of DUDA
The District Urban Development Authority (DUDA), under the State Urban Development Authority (SUDA), was created in the context of implementation and monitoring of various centrally sponsored Programs, namely Urban Basic Services for the Poor.
The role of DUDA consists of carrying out those programs of both social and construction fields. The social programs are conducted under the National Urban Livelihood Mission (NULM)10, including trainings to generate employment opportunities, accessing loans from financial institutions, and supporting formulation of self-help groups. The construction programs are
10 http://nulm.gov.in/

Data Collection Survey on Improvement Japan International Cooperation Agency of Environment in Varanasi City, Republic of India Kokusai Kogyo Co., Ltd. Sewerage Business Management Centre
3-13
implemented to improve the slum environment, including the improvement of squatter houses, providing low cost housings for urban poor, and providing electric tricycle and interlocking pavement for pedestrian paths.
Some of its important functions are to:
Execute various government schemes for urban development and employment generation
Create urban infrastructure, including water supply Undertake tasks related to urban infrastructure to generate local employment Construct community toilets and link it to sewer lines etc. Sewers are laid according to
plans made by the VMC. Sewerage is generally not done by DUDA but currently 28 slums are provided with
sewer lines by hiring agencies like Jal Nigam.
As for its finances, funds are available to DUDA under various schemes from the government. These funds are the only source of income and DUDA does not have any independent source of income.
e. Roles and Functions of the Concerned Institutions
Roles and functions of the concerned institutions are summarized in the table below.
Table 3-5 Roles and functions of the concerned institutions
State Level City Level Sector Description UPPCB SUDA UPJN Jalkal VMC VDA DUDAWater Supply
Plan, Design, Construction
○
Maintenance ○ HH Connection ○ User Charge ○
Sanitation HH Septic Tank ○ Design Approval
○
HH Discharge Approval
○
Community Toilet
○ ○
Public Toilet ○ User Charge ○
Sewerage Plan, Design, Construction
○ 〇*1 〇*2
HH Connection ○ Operation & Maintenance
○
Manhole ○ Sewerage Treatment Plant
○
Disposal ○ ○ Storm Water Drainage
Plan, Design, Construction
○ 〇*1 〇*2
Operation & Maintenance
○

Data Collection Survey on Improvement Japan International Cooperation Agency of Environment in Varanasi City, Republic of India Kokusai Kogyo Co., Ltd. Sewerage Business Management Centre
3-14
Solid Waste Management
Plant Design 〇*3 Storage ○ Transportation ○ Sorting Process ○
*1:Newly developed area、*2:for urban poor*3:by Construction and Design Service of Jal Nigam
Source: Based on City Sanitation Plan in 2011, details are confirmed from officials in Varanasi
f. Ramnagar Municipal Board (RNMB)
f.1 Outline of the RNMB
The RNMB is one of three urban local bodies located in the Varanasi District. The urban local bodies are classified into three types depending on the population size. The first category is the ‘Municipal Corporation’ in the metropolitan cities; the second category is the ‘Municipal Council/ Board’ in the medium and small sized cities, and the third category is the ‘Nagar Panchayat’ in small towns. Thus, the RNMB is classified as the second category; namely, a municipal council/board. The RNMB has population of 49,132, of which 26,071 are males while 23,061 are females as per report released by the 2011 Census.
The RNMB is divided into 25 wards for which elections are held every five years. While the elected members are in charge of city politics, the municipal officers headed by the Executive Officer carry out city administration. As seen in the figure below which shows the relationship between the city and the district and the state administrations, the Executive Officer is responsible to report to the District Collector in the district level and to the Director of Local Government, Department of Urban Development at the state level.
Figure 3-5 The relationship between the RNMB and the district and state administrations

Data Collection Survey on Improvement Japan International Cooperation Agency of Environment in Varanasi City, Republic of India Kokusai Kogyo Co., Ltd. Sewerage Business Management Centre
3-15
As for the number of officers in the municipal office of the RNMB, see the table below.
Table 3-6 The numbers of municipal officers
Name of the post
Sanctioned Posts
Actual numbers
1 Executive officer 1 1
2 Jalkal engineer 1 0
3 Junior engineer 1 1
4 Tax officer 1 0
5 Tax inspector 1 1
6 Head stenographer 4 0
7 Stenographer 7 4
8 Tractor driver 1 1
9 Pipe man 1 1
10 Jalkal mechanic 1 1
11 Pump driver 1 0
12 Pump operator 1 0
13 Pump attendant 1 0
14 Pump cleaner 5 7
15 Gardener 2 2
16 Watchman 4 4
17 Peon (a) 1 1
18 Peon (b) 6 8
19 Jalkal worker 1 1
20 Sanitary inspector 1 1
21 Sanitary zamadar 5 5
22 Tractor cleaner 1 0
23 Sanitation worker 73 40
Source: Hearing from the Executive Officer, RNMB
f.2 Financial Status of the RNMB
The Executive Officer of RNMB, provided us with the following information on the financial status of the RNMB.
Annual expenditure of the RNMB is Rs 5 crore, of which Rs 4 crore are salaries. The remaining Rs 1 crore is spent on actual public services to the citizens.
Annual income of the RNMB is approximately Rs 50 to 60 lakhs, mainly through property tax and water charges/tax. Since the state government prohibit the urban local bodies to levy the Tehbazari, a license fee for regular market vendors, and the Chungi, a license fee for street vendors, currently only half of the Rs 1 crore is met by the RNMB’s own financial source.

Data Collection Survey on Improvement Japan International Cooperation Agency of Environment in Varanasi City, Republic of India Kokusai Kogyo Co., Ltd. Sewerage Business Management Centre
3-16
Table 3-7 List of major municipal assets
Name of assets Unit
1 Tubewells 16
2 Overhead water tanks 6
3 Tractor 3
4 Mini-trucks (lorry) 2
5 Small JCB 1
6 Suction pump 1
7 Water tanker 6
Source: Hearing from the Executive Officer, RNMB
3.2.3 Structure and Functions of Major Institutions in Rural Areas
a. Legal Framework
This study geographically covers two urban local bodies (ULBs), namely the VMC and the RNMB, and three rapidly urbanizing GPs near the VMC, namely Shivdaspur, Suzabad and Sirgorbardhanpur.
As stated in the earlier section, the 73 rd amendment of the Constitution (amendment of Article 243) was passed in 1992 by the Indian Parliament. This amendment declared Panchayats as institutions of self-government. These amendments came into force on April 24, 1993. The major features of the 73rd amendment can be enumerated as follows:
There should be three tiers of Panchayats - District Panchayats; Block Panchayats, i.e. intermediary Panchayats; and Village or Gram Panchayats - in states with over 25 lakh of population (population over 2,500,000). States with less than this population will have only two tiers omitting the intermediary tier.
Panchayats were declared as self-governing institutions (signifying that the status of Panchayats is the same in their respective areas as that of the Union Government at the national level and state governments at the state level).
States were mandated to devolve functions relating to 29 subjects - including agriculture, land reforms, minor irrigation, fisheries, cottage and small-scale industries, rural communications, drinking water, poverty alleviation programs, etc. - to the Panchayats.
Panchayats were mandated to prepare and implement plan(s) for economic development and social justice.
States were asked to constitute a State Finance Commission every five years to determine the Panchayats’ share of state’s financial resources as a matter of entitlement.
Panchayat bodies must have proportionate representation of Scheduled Castes, Scheduled Tribes and women. Such reservations should also apply towards Chairpersons and Deputy Chairpersons of these bodies.
In Uttar Pradesh, the state government brought in Panchayati Raj immediately after independence through the enactment of the UP Panchayat Raj Act, 1947. Following the recommendations of the Balwant Rai Mehta Committee, a three-tier system of Panchayats was established through the

Data Collection Survey on Improvement Japan International Cooperation Agency of Environment in Varanasi City, Republic of India Kokusai Kogyo Co., Ltd. Sewerage Business Management Centre
3-17
enactment of the U.P. Kshettra Samitis and Zilla Parishads Act, 1961 (now, renamed as UP Kshetra panchayats and Zilla Panchayats Adhiniyam, 1961). Following the Constitution (the 73rd Amendment) Act, 1992, in order to bring about conformity with the provisions of the Constitution, the Government of U.P. amended the two Acts named above, through the Uttar Pradesh Panchayat Laws (Amendment) Act, 1994.
b. Organizations and Institutions
b.1 Department of Panchayat Raj, Government of Uttar Pradesh
In Uttar Pradesh, Department of Panchayat Raj is in charge of rural sanitation11. As seen in the organizational chart of the department, the officials, above the director class, administer the activities carried out in the entire GP at the capital city, Lucknow. Below the class, the deputy directors are placed in each of the 18 divisions within U.P. At the district level, District Panchayat Raj Officers supervise the activities carried out in the districts by their subordinates such as assistant development officers at block level and gram sachiev, and safai (sanitation) workers at village level.
Figure 3-6 Organizational chart of Dept. of Panchayat Raj
11 Department of Rural Development implements water scheme in rural areas, but not sanitation programs.

Data Collection Survey on Improvement Japan International Cooperation Agency of Environment in Varanasi City, Republic of India Kokusai Kogyo Co., Ltd. Sewerage Business Management Centre
3-18
b.2 Structure and Institutions at District Level
The Department of Panchayat Raj is a sole responsible agent for rural sanitation, including implementation of the SBM and health service. However, development activities, which may affect rural sanitation such as road and drainage construction, are being carried out by multiple departments. The interrelationship among the departments responsible for rural developments is shown in the figure below. The entire activities are administered by the District Collector.
Figure 3-7 Inter-organizational relationship between Block Development Office and district-level institutions
b.3 Structure and Institutions at Block and Gram Panchayat Level
The organization, which plays an important role for the actual implementation of rural programs, is the Block Development Office. Ninety-three GPs, including the three GPs surveyed - Shivdaspur, Suzabad and Sirgorbardhanpur - belong to the same block, Kashi Vidya Peeth. The block headquarters is located in Shivdaspur.
The organizational structure at the block level as well as GP level is as shown in the figure below. At the block level, six Assistant Development Officers (ADOs) work under the Block Development Officer (BDO). At the GP level, 10 Village Development Officers (VDO) and 10 Gram Panchayat Officers (GPO) - who are equally known as “Gram Sachiev (Village Secretary)” in the field - are responsible for village-level administrative works12. On the engineering front, two engineers and one technical assistant (contract-base) are assigned to the Block Development Office. In addition, there are technical assistants who mainly work at the GP level.
12 Both VDOs and GPOs known as GS at the field carry out the same duties. Usually each GS looks after four to five GPs in U.P.

Data Collection Survey on Improvement Japan International Cooperation Agency of Environment in Varanasi City, Republic of India Kokusai Kogyo Co., Ltd. Sewerage Business Management Centre
3-19
Figure 3-8 Organizational structure of Block Development Office
c. Village Finance
The GPs are endowed with revenue-raising powers, for example through imposing taxes. However, most GPs in the UP State fail to collect the tax revenues. For this reason, the GPs have mainly four revenue sources, i.e. (1) MP fund13; (2) MLA fund14; (3) funds from the State Finance Commission; and (4) funds from the (Central) Finance Commission.
In the all surveyed three GPs (Shivdhaspur, Suzabad and Sirgobardhanpur), the MP/ MLA funds were not available. Thus, the financial source for these GPs is the finance commissions. The budget for each GP from FY2010 to FY 2015 is as shown in the table below.
Table 3-8 Budget of the surveyed GPs
Unit: Rs per Year
Fiscal Year Shivdaspur Suzabad Sirgorbardhanpur
FY2010 N.A. 658,459 423,935
FY2011 1,445,851 1,287,350 1,318,100
FY2012 2,016,217 1,619,420 1,125,196
FY2013 1,859,141 2,170,906 2,071,305
FY2014 2,358,892 2,571,542 2,504,149 Source: Information form Gram Sachiev of each GP
13 MP Local Area Development Scheme enables each Member of Parliament of India (MP) to undertake small developmental works in his/her constituency through the allocated funds. 14 MLA Local Area Development Scheme enables each member of legislative assembly (MLA) to undertake small developmental works in his/her constituency through the allocated funds.

Data Collection Survey on Improvement Japan International Cooperation Agency of Environment in Varanasi City, Republic of India Kokusai Kogyo Co., Ltd. Sewerage Business Management Centre
4-1
4 Water and Sanitation Status in Varanasi
4.1 Water Supply
The water supply system for Varanasi is more than 100 years old and was first constructed in 1892. It was originally designed for a population of 200,000 with a treatment capacity of 33 MLD. Later, the capacity was increased to 92 MLD for a population of 460,000 in 1954.
Originally, the water treatment system used simple sand filter methods but currently it is comprised of rapid sand filters and clear water sump pumps.
Water supply zones and the location of water treatment plant are shown below. The Varuna River crosses from west to east, north of Varanasi. North of the Varuna River is called “Trans Varuna” and south of the Varuna River is called “Cis Varuna” and the water treatment plant is located at the Cis Varuna zone.
Source: City Sanitation Plan in 2011
Figure 4-1 Water supply zone and water treatment plant

Data Collection Survey on Improvement Japan International Cooperation Agency of Environment in Varanasi City, Republic of India Kokusai Kogyo Co., Ltd. Sewerage Business Management Centre
4-2
4.1.1 Water Sources
Surface water from the Ganga River provides around 40% and underground water from various wells provide around 60% of total water supply.
Table 4-1 Water sources for Varanasi
Source Intake Amount (MLD) %
Surface Source Ganga River 125 MLD 37%
Ground Water Tube Well 190 MLD 63%
Mini Tube Well 14 MLD
Hand Pump 10 MLD
Total 339 MLD 100%
Source: Developing Strategy for Reduction of NRW, original data from Jal Kal.
4.1.2 Water Treatment System
As of September 2015, one treatment plant at Bhelupur is in operation and has a capacity of 250 MLD. This plant was constructed in 1994 by UP Jal Nigam and handed over to Jal Kal in 2011. Treatment methods adopted are coagulation sedimentation, rapid sand filters and disinfection by chlorination.
Layout of Water Treatment Plant Inlet for sedimentation basin. A coagulation agent is added to increase sedimentation efficiency. Retention time is two to three hours.
Rapid sand filter tank Rapid sand filter tank after filtering process was over.

Data Collection Survey on Improvement Japan International Cooperation Agency of Environment in Varanasi City, Republic of India Kokusai Kogyo Co., Ltd. Sewerage Business Management Centre
4-3
Building for chlorination disinfection facilitiesWater pump room, which was built 50 years ago
Water quality of the treated water is shown below. However, this is the quality at the treatment plant and it is reported that there are many complaints at the household level that the water quality of tapped water is not so good.
Table 4-2 Water quality at water treatment plant (Year 2010)
Item Regulation
Dry Season Rainy Season
Before Treatment
After Treatment
Before Treatment
After Treatment
Turbidity <2.5NTU 70 NTU 0.4 NTU 1200 NTU 0.466 NTU
pH 7.84 7.5 7.67 7.52
Dissolved Oxygen
>4ppm 4.4 ppm 6.4 ppm 4.1 ppm 6.53 ppm
Source: City Sanitation Plan in 2011
At the RNMB-with a population of 50,000- groundwater, which is extracted from 180 meters deep, is used for water supply. The wells to extract this groundwater were constructed within the jurisdiction of the RMBD office; and water is treated with only chlorine disinfection and stored in an elevated tank, then distributed to the households. Annual water tariffs for individual households are set as low as Rs 120 /Year.
Building for well Chlorinate Disinfection tank

Data Collection Survey on Improvement Japan International Cooperation Agency of Environment in Varanasi City, Republic of India Kokusai Kogyo Co., Ltd. Sewerage Business Management Centre
4-4
Elevated Water Tank in the RNMB
4.1.3 Water Storage System
There are 17 elevated water tanks and six underground water tanks in Varanasi. Total storage volume is 75 MLD and it is not enough to supply the whole area, which has a water demand of 257MLD15. Treated water is pumped to the water tank with water pump facilities which were constructed 100 years ago. The current pumps were installed about 50 years ago and there is no water flow meter installed. Therefore, the exact water volume being pumped was not available and is estimated based on the pump capacity and working hours.
Water Pump Building which was built in 1892Water pump installed inside building which is 50 years old
One of the elevated water tanks in Varanasi
15 City Sanitation Plan in 2011

Data Collection Survey on Improvement Japan International Cooperation Agency of Environment in Varanasi City, Republic of India Kokusai Kogyo Co., Ltd. Sewerage Business Management Centre
4-5
4.1.4 Water Supply System
The diameter of the water supply main is from 250 mm to 1200 mm and it is maintained in good condition with periodical replacement.
But many of the branch lines were installed more than 100 years ago and their condition is bad and many leakages occurred. Furthermore, some of the water supply lines are installed under the river or sewage line. This caused pollution and contamination of the water.
Water supply lines are continuously being replaced with new pipes using JNNURM funds16. Current water supply network lengths are shown below.
Table 4-3 Water supply network in Varanasi
Item Cis Varuna Area
Trans Varuna Area
Total
Existing 182 km 25 km 434 km
New and Replacement Lines 466 km 228 km 694 km
Total 648 km 254 km 902 km
Source: City Development Plan in 2015
4.1.5 Pipe Connection to Individual household
The Following are the percentage of pipe connections and metered connections in Varanasi.
Table 4-4 Connection to individual households and water meters
Connections No od
households
Percentage of Metered Connection
Percentage of Pipe
Connection
Metered Connection
Domestic 79,707
16 From FY2016 onwards, VMC and Jal Nigam plan to implement the following activities under AMRUT.
No Objective Project Name Physical
Components
Change in Service Levels Estimated
Cost Period
Indicator Existing After Crore Rs
1
To achieve
Universal
Coverage
To provide house service
connection Water Pipe
Line HH
Connection
Coverage
Network 67% 85%
75 FY2016~
FY2019 Bridging the Gap in existing
network 71.47
2
To make system
efficient by NRW
reduction
Implementation of SCADA with
MIS Sluice Valve/
Meter, Pipe
line
NRW
deduction58% 30%
2.2 FY2017~
FY2019 Survey, 100% metering and Leak
Detection and repair 151.33
3
To enhance per
capita water
supply
Development of New Water
Sources, strengthening of water
treatment plant, replacement of
rising and distribution main
Water
Sources and
WTP
NRW
deduction58% 20% 169
FY2018~
FY2019
4 To improve
quality of water
Strengthening of lab and online
water quality monitoring system
Lab
Equipment
Water
Quality 96% 98% 0.7
FY2016~
FY2019
Total 469.7

Data Collection Survey on Improvement Japan International Cooperation Agency of Environment in Varanasi City, Republic of India Kokusai Kogyo Co., Ltd. Sewerage Business Management Centre
4-6
Non- Domestic NA
Commercial NA
Industrial 3,161
Total Metered 82,868 60%
Total Non-Metered 54,604 40%
Total Connection 137,472 100% 57%
Total Household 242,150 100%
Source: The Study Team create used the figure in Detailed Project Plan for NRW Reduction
Based on the above record, the percentage of pipe connections is 57 % and 60% of them are metered connections. But the reality is that the most of the meters are not functioning and the reading record also does not exist.
4.1.6 Financial Condition of Water Supply
a. Water Tariff
There are two types of water bills; water tax and water charges. Water tax applies to all households whether water pipes are connected or not. It is 12.5 % of ARV which is decided by VMC. Besides this water tax, households which receive piped water supply are subject to pay water charges based on the following water tariff. Each household should pay either water tax or water charges, whichever is higher.
Table 4-5 Water tariffs
No Annual Rental Value (Rs/year)
Annual Water Charges for 15mm domestic connection (Rs/year)
1 0 - 360 758
2 361-2,000 998
3 2,001 - 3,500 1,477
4 3,501 - 5,000 1,957
5 5,001 and above 2,463
Volumetric Rate per Kilo Liter 3.15 (Rs/KL)
Source: Detailed Project Plan for NRW Reduction
Therefore, water bills are set at a fixed amount based on the value of property and not subject to the water volume which is used.
b. Water Charge Collection System
Water charge was collected as follows:
Water charge is collected once a year between June to September. Water charge should be paid within a month after the bill is issued and a 10 %
discount is applied to payments made within a month. Water bill is delivered directly from the Jal Kal staff who are stationed in zonal
offices. Payment shall be done by cash, check or credit card at the Jal Kal Revenue Collection
Centers which are located at five places within the city.

Data Collection Survey on Improvement Japan International Cooperation Agency of Environment in Varanasi City, Republic of India Kokusai Kogyo Co., Ltd. Sewerage Business Management Centre
4-7
c. Revenue
Jal Kal is collecting water charges and sewage charges (which is 25%17 of water charges) by itself. The demand and collection amount of the past five years are presented below.
Table 4-6 Revenue of Jal Kal for the past five years
Unit: Lahks Rs(100,000 Rs)
Source: Study team based on the figure in City Development Plan in 2015
Collection efficiency of water charges is improving year by year and achieved 87% in 2012. The arrears amount also decreased to Rs 1.145 Million in 2012.
d. Expenditures
Annual expenditures related to water and sewage operations are shown below. Expenditures are covered within the annual revenue. Around 80% of the expenditures are salaries for workers and this indicates almost all the operation and maintenance works are carried out manually. Revenue is insufficient to cover the electricity cost and this cost was borne by the state Government. Furthermore, Jal Kal salaries for managers were also borne by the state government and not included in the table below.
Table 4-7 Expenditures of Jal Kal for the past five years.
Unit: Lakhs Rs(100,000 Rs)
Source: Study team based on the figure in City Development Plan in 2015
17 Figure was collected by interview survey on Sep 2015.
2008 2009 2010 2011 2012Total Demand(請求金額)
Arrears(滞納金) 1,804 1,631 1,524 1,408 1,145Current 1,592 1,846 2,030 2,233 2,482
Sub Total 3,395 3,477 3,554 3,641 3,627Collection(徴収金額)
Arrears(滞納金) 571 652 702 1,200Current 1,381 1,494 1,795 2,152
Sub Total 1,764 1,953 2,146 2,497 3,352
Collection Effc iency(徴収率)Arrears(滞納金) 35% 43% 50% 105%Current 75% 74% 80% 87%
Sub Total 52% 56% 60% 69% 92%
Item of RevenueFiscal Year
2008 2009 2010 2011 2012Income(収入)Rs. Lakhs 1,764 1,953 2,146 2,497 3,352
Expenditure(支出)Salaries (Worker) 1,242 1,468 1,440 1,923 2,777Supplies and Chemicals 178 153 116 109 136General Repairs 150 122 41 83 156Electricity and Energy 170 101 24 19 19Others 646 423 88 303 341
Total Operating Expenses 2,387 2,267 1,710 2,438 3,429
Item of ExpenditureFiscal Year

Data Collection Survey on Improvement Japan International Cooperation Agency of Environment in Varanasi City, Republic of India Kokusai Kogyo Co., Ltd. Sewerage Business Management Centre
4-8
The figures above indicate that even though the collection rate of water related charges is 90%, revenue is still insufficient to cover the actual expenditures. The reasons might be either the water tariff is too low or operation and maintenance works are not efficient. According to an interview survey to Jal Kal in Sep 2015, raising water tariffs is quite difficult due to political constraints.
It is known that the water supply and sewage operations are conducted with strong support by the state government.
4.1.7 Non Revenue Water
A study on non revenue water in Varanasi was conducted through “Developing Strategy for Reduction of NRW” under a World Bank funded project “Capacity Building for Urban Development”. According to the study, over 100 years has passed since water supply facilities in Varanasi were originally constructed. Water flow meters are not installed at water intake or water distribution facilities. So water intake and distribution volume were estimated based on the pump capacity and working hours. Water consumption at each household was also unknown since there are no functional water meters there as well. Therefore, water consumption was estimated based on the sample surveys at 252 households. The study results are shown below and the rate of NRW was concluded as 61%. Physical leakage from old water pipe lines and facilities was concluded as a major cause of NRW.
Currently, the Jal Nigam (Varanasi), in a close collaboration with VMC, plans to replace decrepit water supply lines during FY2016 and FY2019, and to install water meters to each household during FY2017 and FY2019, in order to reduce the NRW ratio by utilizing AMRUT funds1819. For the fundamental improvement of the NRW, ensuring the steady implementation of the above activities is of great importance.
Table 4-8 Non revenue water in Varanasi
Source: Detailed Project Report for NRW Reduction
18 The estimated current NRW ratio of Varanasi is recorded as 58% in the proposal for the AMRUT scheme. 19 The activities under the AMRUT are detailed in the footnote 16.
Amount(MLD)
%
Billed Metered Consumption 0Billed Un-metered Consumtion 124.6 39.0%Unbilled Metered Consumption 0Unbilled Un-Metered Consumption 1.7
Sub Total 126.28 39.5%Unauthorised Consumption 18.0Customer Meter Inaccuracies -Data Handling Errors -Leakage on Trasmission/Distribution Mains
140.3
Leakage and Overflow at storage Tanks -Leakage on Service connections 35.1
Sub Total 193.4 60.5%Total 319.7 100.0%
Revenue Water 39.0%Non Revenue Water 61.0%
AuthorisedConsumption
WaterLosses
SystemInput
Volume
Type of Water

Data Collection Survey on Improvement Japan International Cooperation Agency of Environment in Varanasi City, Republic of India Kokusai Kogyo Co., Ltd. Sewerage Business Management Centre
4-9
4.1.8 Future Water Demand
Future water demand was estimated as follows in the City Sanitation Plan in 2011 and City Development Plan in 2015. The population forecast was quite different between CSP and CDP, so water demand in 2020 is 402 MLD in CSP and 324 MLD in CDP.
Table 4-9 Future water demand
Year City Sanitation Plan
Population Rate for Water Demand Water Demand
2020 2,261,433 150 LPCD x 1.2 for General 55 LPCD x 1.2 for Slum
402 MLD
2030 2,806,759 500 MLD
2040 3,367,900 601 MLD
Year City Development Plan
Population Rate for Water Demand Water Demand
2011 1,423,711
150LPCD x 1.15
-
2014 200 MLD
2021 1,879,397 324 MLD
2041 2,825,756 487 MLD
4.1.9 Key Issues
Key issues in Varanasi for water supply are as follows.
a. Reduction of NRW
As stated before, the rate of NRW is 61% and it is required to be reduced to strengthen the financial situation of Jal Kal. However, a major cause of NRW is physical leakage of water from old water supply networks; there needs to be investment in pipe replacements and facilities renewal. Since UP Jal Nigam is the responsible organization of asset investments, Jal Kal in VMC needs to collaborate with UP Jal Nigam to reduce NRW. Currently, the UP Jal Nigam has been replacing the water pipes by utilizing the national funds from the JNNURM and the AMRUT, which will be a key project to improve the current NRW ratio20.
b. Revision of Water Tariff
The current water tariff is set low for political reasons- and revenue from water bills is not enough to cover expenditure for operation and maintenance works of Jal Kal and much of the costs are covered by state government such as electricity bills and salaries for managers.
The decision of whether this financial support will be continued or not shall be made in accordance with discussion between the state government and the VMC. If the state government ceases financial support in the future, increasing revenue will be essential.
c. Water Source and Quality
The water supply was developed about 100 years ago, and at this moment, 60% of the water source is from underground. Excessive use of groundwater might cause ground settlement and
20 See the footnote 16 for more information about projects to reduce NRW under the AMRUT.

Data Collection Survey on Improvement Japan International Cooperation Agency of Environment in Varanasi City, Republic of India Kokusai Kogyo Co., Ltd. Sewerage Business Management Centre
4-10
contamination of water quality.
Continuous monitoring of water quality for both water treatment plants and selected households is recommended and the future balance of surface water and underground water shall be planned based on the monitoring results.
4.2 Sewerage
The old town of Varanasi was developed along the Ganga River and sits between the Varuna River in the north and the Assi River in the south. Both rivers function as a natural drainage to the Ganga River.
The purpose of the sewerage projects is to provide a better living environment and to maintain the water quality of the Ganga River. The following items will be studied in this chapter:
Development Plan of Sewerage Facilities. Wastewater Generation Amount Rainfall Amount Current Sewage Network Sewage Treatment Plan Septage Management Operation and Maintenance of Sewage Facilities Operation and Maintenance Cost
【Development Plan of Sewerage Facilities】
The Following are the development plans and study reports for sewage facilities.
“Mission Clean Ganga” The Study on Water Quality Management Plan for the Ganga River in the Republic of
India, Sewerage Master Plan for Varanasi City (JICA, 2005) City Sanitation Plan for Varanasi (Municipal Corporation Varanasi, 2011) City Development Plan for Varanasi (Municipal Corporation Varanasi, 2015)
4.2.1 Wastewater Generation Amount
Wastewater which is generated from Varanasi has the following classifications: household wastewater, industrial wastewater, commercial wastewater and tourist wastewater. Generation amounts of wastewater are calculated from the amount of water consumption through these activities.
Wastewater generation amount in Varanasi is calculated as follows:
Wastewater generation amount = Water Supply per person per day (150 lpcd) + Non Revenue Water (15% of 150 lpcd) x 80% = 138 lpcd
The qualities of wastewater are used for designing capacity of STP and these are different depending on the generation sources. It is estimated that 94% of wastewater in Varanasi is from point sources; namely 79% from households and 15% from industrial activities such as dyeing industries21. The remaining 6% of wastewater is estimated to be from non-point sources22 such as 21 A single identifiable source of water pollution such as pipe, drainage, water channel, culvert, well, vehicle, livestock barn, and ship. 22 The pollution source cannot be identified as pollutants are discharged from wide land area such as road, residential area, and agricultural land.

Data Collection Survey on Improvement Japan International Cooperation Agency of Environment in Varanasi City, Republic of India Kokusai Kogyo Co., Ltd. Sewerage Business Management Centre
4-11
agriculture, forests and livestock farming23.
The daily generation amount of wastewater in Varanasi is reported as 233 MLD (233,000 m3 per day) based on the City Sanitation Plan for Varanasi in 2011. 101.8 MLD (43.7%) is treated at STP, 35MLD (15%) is treated on site-such as a septic tank- and 96MLD (41%) is discharged to the river without treatment.
Future population and generation amount of wastewater is calculated as follows.
Table 4-10 Future population and generation amount of wastewater
YR 2030 YR 2045
Population (LAKH) 25.50 29.60
Wastewater (MLD) 390 470
Source: The Study on Water Quality Management Plan for Ganga River in Republic of India, Sewerage Master Plan for Varanasi City (JICA, 2005)
4.2.2 Storm Water
The rainy season is from June to October and annual rainfall is around 680 mm to 1,500 mm. Storm water is drained through drainage pipes to the Varuna and Assi Rivers, and then finally to the Ganga River.
Some parts of Varanasi are susceptible to flooding in the rainy season. Drainage was improved using the JNNURM fund from 2008 till 2011. However, flooding still occurred partly due to a lack of proper operation and maintenance of the drainage system and a lack of proper waste management24.
Figure 4-2 Picture showing submerged road by flooding(July 2014)
23 Uttar Pradesh Jal Nigam, “Detailed Project Report For Rehabilitation/ Upgradation of Existing Sewage Treatment Plants at Dinapur and Bhagwanpur in Varanasi Volume I”, July 2014 24 WEB Page: “FloodList”http://floodlist.com/”

Data Collection Survey on Improvement Japan International Cooperation Agency of Environment in Varanasi City, Republic of India Kokusai Kogyo Co., Ltd. Sewerage Business Management Centre
4-12
4.2.3 Current Sewerage System
The sewage network was originally constructed from 1891 to 1917 and there are three major lines; Main Sewer, Ardely Bazaar Sewer, and Ghat Intercepting sewer. The overall length was 16.52 km. The current overall length of sewage lines is around 400 km and 30% is an underground sewage system.
The following are the sewage management systems in Varanasi indicating collecting zone and individual treatment plan.
Figure 4-3 Sewage zone in Varanasi
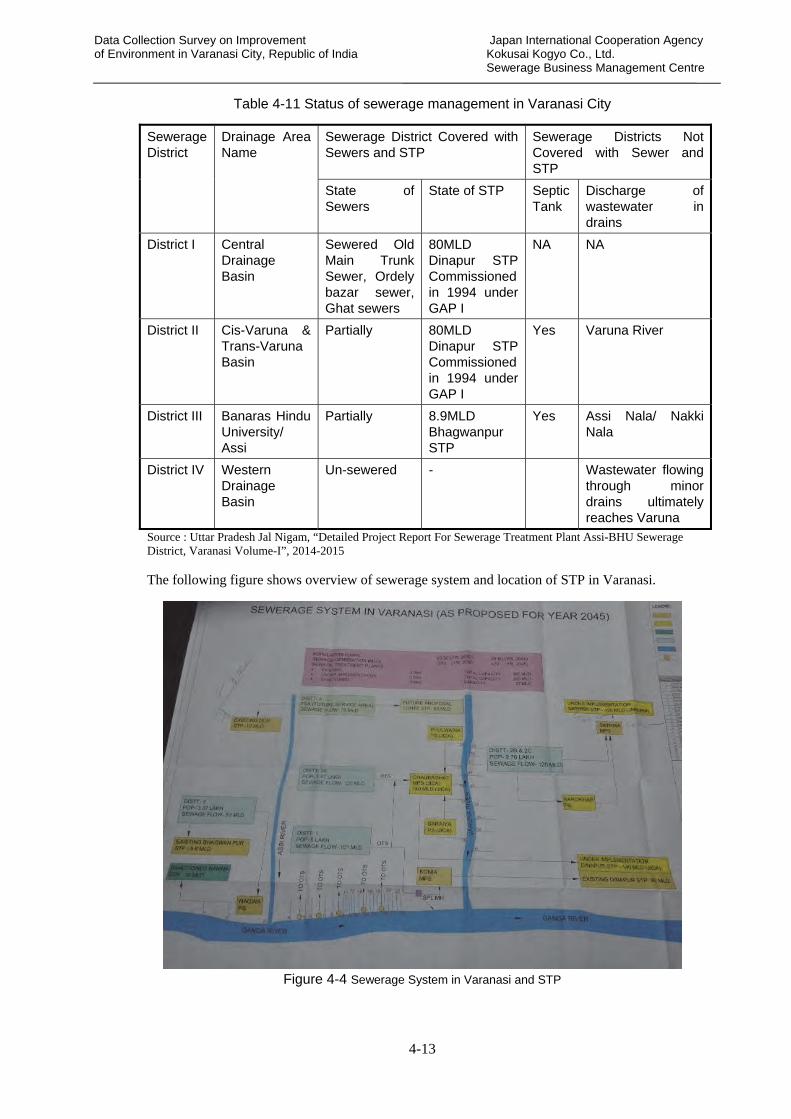
Data Collection Survey on Improvement Japan International Cooperation Agency of Environment in Varanasi City, Republic of India Kokusai Kogyo Co., Ltd. Sewerage Business Management Centre
4-13
Table 4-11 Status of sewerage management in Varanasi City
Sewerage District
Drainage Area Name
Sewerage District Covered with Sewers and STP
Sewerage Districts Not Covered with Sewer and STP
State of Sewers
State of STP Septic Tank
Discharge of wastewater in drains
District I Central Drainage Basin
Sewered Old Main Trunk Sewer, Ordely bazar sewer, Ghat sewers
80MLD Dinapur STP Commissioned in 1994 under GAP I
NA NA
District II Cis-Varuna & Trans-Varuna Basin
Partially 80MLD Dinapur STP Commissioned in 1994 under GAP I
Yes Varuna River
District III Banaras Hindu University/ Assi
Partially 8.9MLD Bhagwanpur STP
Yes Assi Nala/ Nakki Nala
District IV Western Drainage Basin
Un-sewered - Wastewater flowing through minor drains ultimately reaches Varuna
Source : Uttar Pradesh Jal Nigam, “Detailed Project Report For Sewerage Treatment Plant Assi-BHU Sewerage District, Varanasi Volume-I”, 2014-2015 The following figure shows overview of sewerage system and location of STP in Varanasi.
Figure 4-4 Sewerage System in Varanasi and STP

Data Collection Survey on Improvement Japan International Cooperation Agency of Environment in Varanasi City, Republic of India Kokusai Kogyo Co., Ltd. Sewerage Business Management Centre
4-14
4.2.4 Sewerage Treatment Plant
It is reported that the water quality of the Ganga River near Varanasi is BOD 3 to 16 mg/l and DO 7 to 9 mg/l25, which environmental standard shall be less than 3 mg/l and 5 mg/l respectively.
The following are the effluent discharge standards after treatment.
Table 4-12 Effluent discharge standard(NRCD)
Water Quality Item Unit Effluent Discharge Standard
BOD mg/l 20
TSS mg/l 30
Fecal Coliforms MPN/ 100ml Desirable- 1,000 Permissible- 10,000
There are three wastewater treatment plants in Varanasi as follows:
Dinapur STP (80 MLD):Spring Filter + Activated Sludge Treatment
BHU/Bhangwanpur STP (8 MLD+1.8 MLD):Trickling Filter Line and Activated Sludge
Treatment Line
DLW STP (12 MLD):Activated Sludge Treatment
a. Dinapur STP
The Dinapur STP has been operating fully since 1994 and Treatment Capacity is 80 MLD (80,000m3/day). Wastewater from District I and part of District II are treated by Trickling Filters and Activated Sludge methods. Actual inflow of wastewater is around 80 to 85 MLD through 1200mm diameter rising main from Konia Pump Station at south.
The treatment process of 80 MLD Dinapur STP is as follows:
Wastewater is pumped into a wet well Solid waste is removed by bar screen Sand matter is removed at the Grid Camber Volume is measured by parshall flume and then flows into the primary clarifier Suspended solids (SS) are removed by the primary clarifier and then flow into the
Trickling Filter Tank. Further treatment occurs at the Trickling Filter Tank then flows into the Aeration
Tank. Organic matter is digested by the Aeration Tank. Surface mechanical aeration
equipment is used to maintain MLSS (mixed liquor suspended solids) density between 2,500 to 3,500 mg/l and SVI (sludge volume index) between 80 to 120 and then flows into the Final Settling Tank.
Overflow water from the Final Settling tank is discharge to the outside drain. There is no disinfection process.
Sludge settled at the Final Settling Tank goes back to the Aeration Tank as a return sludge and used for digestion argent.
25 Utter Pradesh Jal Nigam, Varanasi, “Detailed Project Report for Providing Secondary Sewers in District III, Varanasi”, December 2014

Data Collection Survey on Improvement Japan International Cooperation Agency of Environment in Varanasi City, Republic of India Kokusai Kogyo Co., Ltd. Sewerage Business Management Centre
4-15
Part of sludge goes back to the Primary Clarifier Tank and flows into the Sludge Digester Tank as Excess Sludge Tank.
Digested sludge flows to a Sledge Drying Bed and Dries with sunshine. Dried sludge is utilised as fertilizer and sold at the price of Rs 115 /m3. Digested gas was utilised for generators as a fuel.
Particulars of Dinapur STP are shown below.
Table 4-13 Main faculties at Dinapur STP
No. Facilities Size Nos
1 Inlet Chamber 1.2×3.0m 1
2 Parshall Flume 1
3 Primary Clarifier φ28.6×H3.5m 3
4 Roughening Trickling Filter φ22.5×H1.0m 3
5 Aeration Tank 20.0×60.0×H4.5m 3
6 Secondary Clarifier φ40.0×H3.5m 3
7 Treated Effluent Pump House 1
8 Sludge Digester 4,800m3 3
9 Gas Holder φ21×H7m 2
10 Sludge Drying Bed 24,500m2 (Total area)
11 Power Generation Room 1
12 Lab. and Admin. Building 1
Figure 4-5 Treatment process at Dinapur STP

Data Collection Survey on Improvement Japan International Cooperation Agency of Environment in Varanasi City, Republic of India Kokusai Kogyo Co., Ltd. Sewerage Business Management Centre
4-16
Figure 4-6 General layout of Dinapur STP
Water quality of Dinapur STP is shown below.
Table 4-14 Water quality of Dinapur STP(February To March 2015)
TSS(㎎/l) BOD3(㎎/l) COD(㎎/l)
Wastewater 528 (396〜602l)
162 (20〜210l)
289 (220〜360)
Treated Water 39.5
(20〜52)
23.7
(20〜30)
101
(88〜132)
There is a renovation plan in which the Trickling Filter Tank will be replaced with an MBBR (moving bed bio reactor), chlorine disinfection process and will be added and to the centrifugal extractor for sludge.
Operation and maintenance of Dinapur STP is done by UP Jal Nigam and the organization is comprised of the following:
One General Manager Two Project Managers 20 Engineers 50 Workers, Operating Staff and Supporting Staff One Chemist and one Helper at the Laboratory
Pictures at Dinapur STP are shown below.

Data Collection Survey on Improvement Japan International Cooperation Agency of Environment in Varanasi City, Republic of India Kokusai Kogyo Co., Ltd. Sewerage Business Management Centre
4-17
Inlet of Wastewater(Wet Well) Screen at Inlet to remove solid waste
Narrow space screen at inlet Chute for solid waste
Primary Clarifier Overflow weir at Primary Clarifier
Roughening Trickling Filter Aeration Tank

Data Collection Survey on Improvement Japan International Cooperation Agency of Environment in Varanasi City, Republic of India Kokusai Kogyo Co., Ltd. Sewerage Business Management Centre
4-18
Surface Aeration Equipment Sludge Circulation Outlet
Outlet of Treated Water Outlet of Treated Water
Outlet of Treated Water Discharge Canal
Sludge Digester Tank Gas Holder

Data Collection Survey on Improvement Japan International Cooperation Agency of Environment in Varanasi City, Republic of India Kokusai Kogyo Co., Ltd. Sewerage Business Management Centre
4-19
Sludge Drying Bed Sludge Drying Bed
Generator House Dual Fuel Engine for Generating Electricity
Control Room for Generator House Repairing Surface Aeration Equipment
b. Bhagwanpur STP
Bhagwanpur STP has been operating since 1994 and there are two lines. One is 8 MLD (8,000m3/day) and the other is 1.8 MLD (1,800 m3/day). Wastewater from District III, BHU (Banaras Hindu University) and Assi areas. The 1.8 MLD line was constructed to treat wastewater for BHU but the line was stopped due to a malfunction of the Roughening Trickling Filter as of 22nd Jul 2015.The 8 MLD line adopted the Activated Sludge Process and Treated water is discharged to the surrounding river and some is used for irrigation. Sludge is utilized as fertilizer for agriculture after drying. Actual inflow is 10 to 12 MLD which exceeds the capacity but quality of inflow wastewater is around 60 to 80 mg/l BOD so the quality of treated water is reported within the discharge regulation.
Treatment process of 8 MLD line is as follows.
Wastewater is pumped into a wet well

Data Collection Survey on Improvement Japan International Cooperation Agency of Environment in Varanasi City, Republic of India Kokusai Kogyo Co., Ltd. Sewerage Business Management Centre
4-20
Solid waste is removed by the bar screen Sand matter is removed by the Grid Camber Volume is measured by parshall flume then flows into the primary clarifier Suspended solids (SS) are removed a by the primary clarifier then flow into Aeration
Tank. Organic matter is digested by the Aeration Tank. Surface mechanical aeration
equipment is used to maintain MLSS (mixed liquor suspended solids) density less than 3000mg/l then flows into the Final Settling Tank.
Overflow water from the Final Settling tank is discharged to the outside drain. There is no disinfection process.
Sludge settled at Final Settling Tank goes back to the Aeration Tank as return sludge and used for digestion argent.
Part of the sludge goes back to the Primary Clarifier Tank and flows into the Sludge Digester Tank as Excess Sludge Tank.
Digested sludge flows to a sludge Drying Bed and Dries with sunshine. Dried sludge is utilised as fertilizer for farmers free of charge.
Organization for this STP is as follows:
One Project Engineer Nine Plant Operators Two Sweepers One Mechanic One Electrician One Lab Technician
As of July 2015, planning for renovation work was in progress.
Figure 4-7 Layout of Bhagwanpur STP
Pictures for Bhagwanpur STP are shown below.

Data Collection Survey on Improvement Japan International Cooperation Agency of Environment in Varanasi City, Republic of India Kokusai Kogyo Co., Ltd. Sewerage Business Management Centre
4-21
Primary Clarifier (stop operation) Roughening Trickling Filter(stop operation)
Inlet Structure (Wet Well) Primary Clarifier
Aeration Tank Secondary Clarifier
Motor for Sludge Mixer at Sludge Digester Sludge Drying Bed

Data Collection Survey on Improvement Japan International Cooperation Agency of Environment in Varanasi City, Republic of India Kokusai Kogyo Co., Ltd. Sewerage Business Management Centre
4-22
c. DLW (Diesel Locomotive Works) STP
DLW STP is the plant which treats wastewater generated from diesel locomotive works and is operated by DLW itself. Capacity of the plant is 12 MLD and treated wastewater is used for irrigation purposes within DLW premises.
The activated sludge method is adopted and the treatment process is as follows:
Wastewater is pumped into a wet well Solid waste is removed by the bar screen Sand matter is removed at the Grid Camber Volume is measured by parshall flume then flows into the primary clarifier Suspended solids (SS) are removed at the primary clarifier then flow into the Aeration
Tank. Organic matter is digested by the Aeration Tank. Surface mechanical aeration
equipment is used to maintain MLSS (mixed liquor suspended solids) density less than 3000mg/l then flows into the Final Settling Tank.
Overflow water from the Final Settling tank is discharged to the outside drain. There is no disinfection process.
Sludge settled at Final Settling Tank goes back to the Aeration Tank as return sludge and is used for digestion argent.
Part of the sludge goes back to the Primary Clarifier Tank and flows into the Sludge Digester Tank as Excess Sludge Tank.
Digested sludge flows to a sludge Drying Bed and Dries with sunshine. Dried sludge is utilised as fertilizer for gardening and so on.
Table 4-15 Quality record at DLW STP(July 2015)
BOD(mg/l) SS (mg/l)
Wastewater 60 〜 70 112 〜 133
Treated Water 9 〜 12 10 〜 13
Discharge Regulation 30 100
Figure 4-8 Layout of DLW STP

Data Collection Survey on Improvement Japan International Cooperation Agency of Environment in Varanasi City, Republic of India Kokusai Kogyo Co., Ltd. Sewerage Business Management Centre
4-23
Pictures of DLW STP are shown below.
Inlet Structure Bar Screen
Grid Chamber Flow Meter(Parshall Flume)
Primary Clarifier Aeration Tank
Secondary Clarifier Sludge Digester
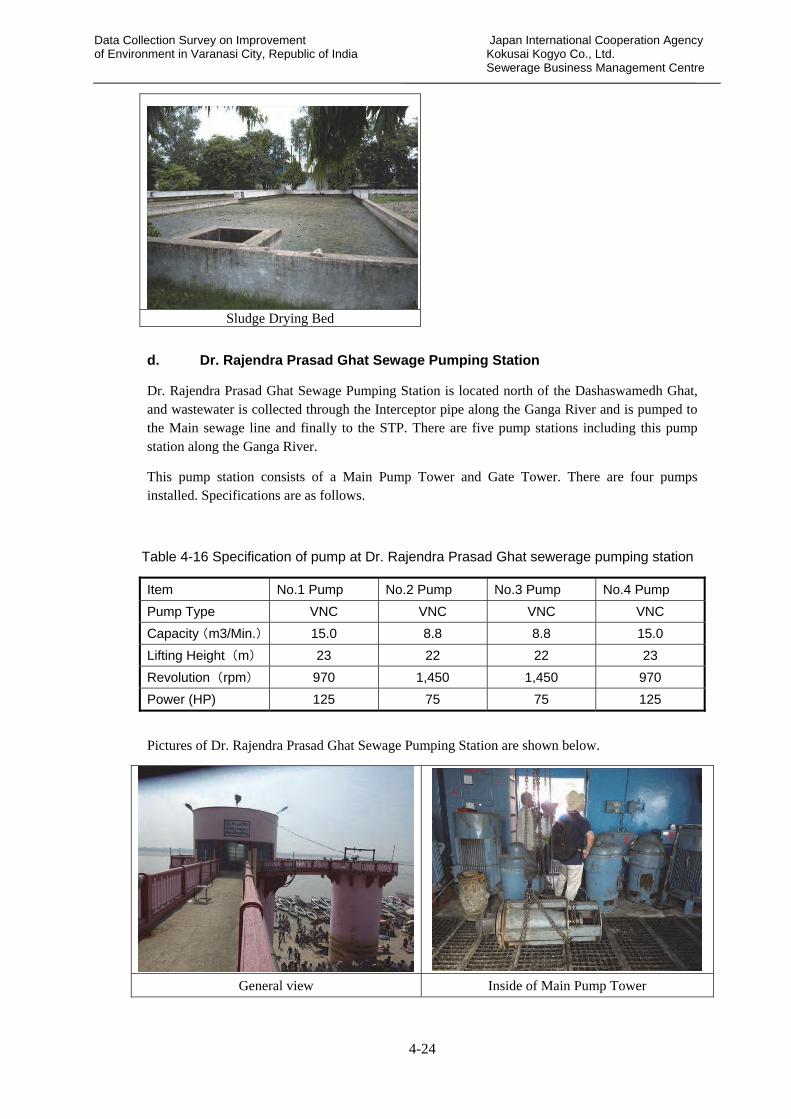
Data Collection Survey on Improvement Japan International Cooperation Agency of Environment in Varanasi City, Republic of India Kokusai Kogyo Co., Ltd. Sewerage Business Management Centre
4-24
Sludge Drying Bed
d. Dr. Rajendra Prasad Ghat Sewage Pumping Station
Dr. Rajendra Prasad Ghat Sewage Pumping Station is located north of the Dashaswamedh Ghat, and wastewater is collected through the Interceptor pipe along the Ganga River and is pumped to the Main sewage line and finally to the STP. There are five pump stations including this pump station along the Ganga River.
This pump station consists of a Main Pump Tower and Gate Tower. There are four pumps installed. Specifications are as follows.
Table 4-16 Specification of pump at Dr. Rajendra Prasad Ghat sewerage pumping station
Item No.1 Pump No.2 Pump No.3 Pump No.4 Pump
Pump Type VNC VNC VNC VNC
Capacity(m3/Min.) 15.0 8.8 8.8 15.0
Lifting Height(m) 23 22 22 23
Revolution(rpm) 970 1,450 1,450 970
Power (HP) 125 75 75 125
Pictures of Dr. Rajendra Prasad Ghat Sewage Pumping Station are shown below.
General view Inside of Main Pump Tower

Data Collection Survey on Improvement Japan International Cooperation Agency of Environment in Varanasi City, Republic of India Kokusai Kogyo Co., Ltd. Sewerage Business Management Centre
4-25
Discharge Pipe at Main Pump Tower Piping at Main Pump Room
Platform of Gate Tower Inside Gate Tower
4.2.5 Structure and Function of Institutions
a. Institutions for Sewage Management
The responsibilities for provision of sewage and storm water drainage within the city have been shared as follows.
The Planning, designing and constructing of sewerage facilities are responsibilities of UP Jal Nigam. Operations and maintenance of sewerage networks, household connections and collection of sewage charges are Jal Kal responsibilities.
But the operation and maintenance of Sewerage treatment Plants (STP) are UP Jal Nigam responsibilities except for the STP at DLW.
On the other hand, storm water drainages are under the VMC responsibilities.
Table 4-17 Functions of institutions on sewerage and storm water drainage
State Level City Level
Sector Description UPPCB SUDA UPJN Jalkal VMC VDA DUDA
Sewage Plan, Design, Construction
○ 〇*1 〇*2
HH Connection ○
Operation & Maintenance
○

Data Collection Survey on Improvement Japan International Cooperation Agency of Environment in Varanasi City, Republic of India Kokusai Kogyo Co., Ltd. Sewerage Business Management Centre
4-26
Manhole ○
Sewerage Treatment Plant
○
Disposal ○ ○
Storm Water Drainage
Plan, Design, Construction
○ 〇*1 〇*2
Operation & Maintenance
○
*1:Newly developed area,*2:for urban poor
a.1 Jal Nigam
In order to supply safe drinking water, a separate department in the name of local government was created in 1949. For this purpose, the Public Health Engineering Department was re-named as the Local Self Government Engineering Department in the same year.
The state government decided to finance sanitation projects to meet increasing demands as well as deal with pressures on providing other civic amenities. It would provide a component of loans, which would be repayable in easy installments to towns which had repayment potential.
In order to supplement the funds, efforts were also made to seek soft term loans from the International Monetary Fund/ World Bank. However, the World Bank put forward a condition that, in order to get soft term loans, it would be essential for the state government to constitute an independent body in the state. This body would be responsible for repayment of loans and execution of projects financed by the Bank.
As a consequence of this condition, the state government promulgated an ordinance in February 1975 and converted the Local Self Government Engineering Department into a corporation by the name of Uttar Pradesh Jal Nigam. This ordinance was subsequently converted into an Act named the Uttar Pradesh Water Supply & Sewerage Act, 1975. In pursuance of this Act, Uttar Pradesh Jal Nigam effectively came into existence from 18th June 1975.
a.2 Member of Jal Nigam
The chairman of Jal Nigam was appointed by the state Government and the head office is located in Lucknow. Overall organization comprised of the following members.
Table 4-18 Members of Jal Nigam
No Designation Available Post 1 Chairman 1
2 Managing Director 1
3 Finance Director 1
4 Chief Engineer I 4
5 Chief Engineer II 9
6 Superintending Engineer 51
7 Manager (E D P cell) 1
8 Ex. Engineer 199
9 System Analyst 2
10 Chief Accounts Officer 1

Data Collection Survey on Improvement Japan International Cooperation Agency of Environment in Varanasi City, Republic of India Kokusai Kogyo Co., Ltd. Sewerage Business Management Centre
4-27
No Designation Available Post 11 Senior Accounts Officer 8
12 Chief Internal Audit Officer 1
13 Financial Analyst 1
14 Law Advisor 1
15 Law Officer 1
16 Manager 1
17 Senior Hydro Geologist 1
18 Junior Hydro Geologist 1
19 Research Officer 2
20 Assistant Engineer 824
21 Accounts Officer 12
22 Assistant Accountants Officer 4
23 Divisional Accountant 253
24 JE 2,110
Total 3,490 Source: City Sanitation Plan in 2011
a.3 Roles of UP Jal Nigam in Varanasi Zone26
There are 15 zonal offices in UP Jal Nigam. The roles of UP Jal Nigam in Varanasi zone are as follows:
To operate and maintain STPs
To collect wastewater on all ghats then transfer the wastewater to Koniya Pump Stations and
then to Dinapur SP.
To plan and construct infrastructure related to water supply and sewage.
To drill tube wells and hand pumps in the cities.
The following organization chart of the UP Jal Nigam in Varanasi zone shows that, under the general manger, there are four executive engineers, who are managing two existing sewerage treatment plants and supervising new sewerage projects in which new STPs are currently under construction.
26 Jal Nigam is the state government organization and has a zonal office in Varanasi.

Data Collection Survey on Improvement Japan International Cooperation Agency of Environment in Varanasi City, Republic of India Kokusai Kogyo Co., Ltd. Sewerage Business Management Centre
4-28
Source: The interview by the study team in September 2015
Figure 4-9 Organization chart for Ganga Pollution Prevention Unit, UP Jal Nigam in Varanasi zone
a.4 Construction and Design Service (C&DS), UP Jal Nigam
The C&DS is a commercial wing of the UP Jal Nigam and was set up in 1989 to diversify the activities of the UP Jal Nigam in the fields of consultancy services, project management, land development and construction of buildings.
As for the solid waste management, the C&DS is conducting basic design and supervision of construction of solid waste treatment plant such as Karsana processing unit in Varanasi.
Under one director heading the entire organization, there are 50 units in all over the UP States and one of these units is located in Varanasi. Currently, one unit general manager and several resident engineers station in Varanasi.

Data Collection Survey on Improvement Japan International Cooperation Agency of Environment in Varanasi City, Republic of India Kokusai Kogyo Co., Ltd. Sewerage Business Management Centre
4-29
Source: The interview by the study team in September 2015
Figure 4-10 Organization chart for C&DS, UP Jal Nigam
b. Financial Conditions
Sewerage charges are collected together with water charges by Jal Kal as stated before but the breakdown of the charges are not known. Operation and maintenance of STPs are done by UP Jal Nigam and the cost is also borne by the state Government.
4.2.6 Future Development Plans
The Following are the future development plans, part of which are currently in progress under the JICA scheme.
1)Under JNNURM;
・Trans Varuna Area:Sewerage branch sewer lines(127km completed)、Sewerage
treatment plant(Goithaha STP、Capacity:120MLD) and pumping station
2)Under JICA:
・Package-1:Assi Interceptor(Completed)、Right bank of the Varuna River: Upstream,
Downstream Interceptor and Rising Main from Package-2 pump station
・Package-2: Three pump stations(Choukaghat P.S., Phulwaria P.S., Saralya P.S.)
・Package-3: Construction of new sewerage treatment plant, Dinapur STP(Capacity:
140MLD)
・Package-4: Rehabilitation of Old Trunk Sewer, UP Jal Nigam has awarded the
contractor under a design-build contract.

Data Collection Survey on Improvement Japan International Cooperation Agency of Environment in Varanasi City, Republic of India Kokusai Kogyo Co., Ltd. Sewerage Business Management Centre
4-30
3)Others
・Pump station downstream of Assi Interceptor and rising main to Ramna STP has been
completed.
The following is a map showing the future sewerage development plan in Varanasi
Source:GAP II Project Team
Figure 4-11 JICA Assisted Ganga Action Project in Varanasi
4.2.7 Septage Management
Sludge is generated from STPs and on site treatment such as septic tanks. Sludge generated at STPs is dried at a dry bed at the STP and then partially utilized for fertilizer for agriculture. Upon the completion of extension of the STP, more sludge will be generated and appropriate septage management shall be required.
Removal of sludge from septic tanks is not regulated and some households have requested the wastewater be extracted when it overflows. Even if Extraction of sludge was carried out, it is not known where to dispose it. Appropriate septage management needs to be applied in the future.
4.2.8 Key Issues
Key issues which need to be addressed for sewerage management are as follows.

Data Collection Survey on Improvement Japan International Cooperation Agency of Environment in Varanasi City, Republic of India Kokusai Kogyo Co., Ltd. Sewerage Business Management Centre
4-31
a. Investigation, Renovation and Renewal of Old Sewage Network
The sewage system in Varanasi is continuously being upgraded through various schemes such as the JNNURM and JICA funds. Once the entire scheme is completed, the sewage system in Varanasi will improve fairly well. On the other hand, branch lines connecting to individual households need to be improved after the main sewage lines are renovated.
b. Construction of New STP
The existing capacity of STPs is not enough and a new STP is going to be constructed. The contract was awarded to the Contractor under design, build and operate basis. The construction work on the site was started after land acquisition problems had been solved.
The proposed site for the new STP is outside the VMC boundaries and located in one GP. The land owner at this GP is opposed to selling land to the Government. Since the STP is a troublesome facility, some special services, such as providing waste collection services, improvement of storm water drainage, and paved roads, shall be considered to give benefits to the residents which agree to construction of the STP.
c. Strengthen Institutional Capacity
The plan, design and construction of STPs are the responsibilities of UP Jal Nigam while maintenance of sewage lines, household connections and collection of sewerage charges are the responsibilities of Jal Kal. But the sewerage charges collected are not enough to cover operation costs or even staff salaries. The state government has supported a big portion of the costs.
Whether to continue supporting the current system by state government or to strengthen city level Government which is through Jal Kal, the state government and the VMC should discuss this further and formulate a plan for future responsibilities27.
4.3 Solid Waste Management
As of August 2015, the VMC directly provides waste collection and disposal services to its citizens. Until 15th May, 2014, all waste management had been outsourced to a private company called A2Z Infrastructure Private Limited, based on the concession agreement. However, due to financial disagreements between the VMC and A2Z, A2Z withdrew from the entire business of solid waste management in Varanasi City.
In the VMC area, in general, the general public and business entities discharge their waste onto the road side nearby, and 2,600 municipal sanitary workers manually collect these heaps of waste on the roads and bring them to the municipal storage depots by tricycle. Then the bulk of waste is loaded onto the dumper trucks and tractors at the municipal storage depots, and then transferred to the final disposal site.
According to the interview with the Additional Commissioner, who visited the VMC on 24th July, 2015, another PPP scheme for solid waste management was underway and the tendering process would start within a week. However, later on 14 September, it was confirmed from the Chief Health Officer of the Health Department that the tendering progress of the new PPP scheme had not started yet.
27 According to the interview with the UP Jal Nigam in November 2015, it was confirmed that the state government would continuously provide financial support for Jal Kal.

Data Collection Survey on Improvement Japan International Cooperation Agency of Environment in Varanasi City, Republic of India Kokusai Kogyo Co., Ltd. Sewerage Business Management Centre
4-32
Table 4-19 Basic SWM indicators
No Indicators Current status
1 Door-to-door collection 0 %
2 Waste generation 600 ton per day
3 Waste collection 480 ton per day
4 Number of containers 120
5 Collection vehicles* 47
6 Collection frequency (trip numbers of secondary collection vehicles)
2-3 trip/day
7 Primary collection worker (sanitary workers) 2,600 persons Source: Based on City Development Plan for Varanasi (2014), detailed information from the Chief Health Officer was added. (Note) *: The figure is the number of dumper trucks and tractors that transfer wastes from the waste storage depots to the disposal site.
4.3.1 Waste Generation and Waste Composition
a. Waste Generation
As seen in the table below, there are a few estimates of the generated amount of waste.
Table 4-20 Waste generation
No Plan/ Report Waste Generation Waste Collection
1 City Sanitation Plan (CSP) 2011 650 ton/day 600 ton/day
2 Detailed Project Report (DPR) for SWM 600 ton/day 480 ton/day
3 City Development Plan (CDP) in 2015 600 ton/day 480 ton/day
Assuming the waste generation is 600 tons per day as estimated in the DPR and the CDP, and waste collection is 480 ton/ day, the waste collection rate is 80%. Then, by dividing 480 ton by the population of 2010, the waste generation amount per day per person is calculated as 460 grams.
The precise amount, however, is unknown since no waste generation or composition surveys at the source has been carried out. Also, although Varanasi receives a huge influx of pilgrims and tourists to the city, the waste generated by them has not been quantified, and therefore the actual generated amount of waste may be a bit more.
b. Waste Composition
The waste composition of the municipal solid waste is given in the table below, according to the CSP. Roadside sweeping is a major category, since the general public and shops generally discharge waste onto the nearby road, and then municipal sanitary workers sweep and collect it.

Data Collection Survey on Improvement Japan International Cooperation Agency of Environment in Varanasi City, Republic of India Kokusai Kogyo Co., Ltd. Sewerage Business Management Centre
4-33
Table 4-21 Waste composition by category
Category Generation Amount (ton/day) Percentage
Commercial Waste 80 ton/day 13 %
Industrial Waste 15 ton/day 3 %
Road Sweeping Waste 450 ton/day 75 %
Clinical Waste 20 tom/day 3 %
Nala Cleaning Waste 10 ton/day 2 %
Construction Waste 25 ton/day 4 %
Total 600 ton/day 100 %
Source: City Sanitation Plan in 2011
Physical characteristics of municipal solid waste in Varanasi is as seen in the table below.
Table 4-22 Physical characteristics of municipal solid waste in Varanasi
Category Percentage Composition Percentage
Biodegradable 51%
Recyclable 15% Paper 33%
Ploythene 26%
Plastics 7%
Glass 6%
Metals 6%
Miscellaneous 23%
Other waste 34%
Source: City Sanitation Plan in 2011
Most of the waste generated comprises of biodegradable, compostable and recyclable material, as seen in the table above. This is due to the high volume of religious paraphernalia and vegetable waste along with the high amount of plastic waste. A small percentage of waste is also comprised of debris and inert material generated from construction, repair and maintenance activities. This waste contains bricks, cement, concrete, stones, tiles, wood, etc. and the storage of waste at the time of its generation is totally neglected. By and large, people deposit construction waste, after salvaging useful material, on the road.
4.3.2 Waste Discharge
Both in the inner and outer parts of the city, the residents discharge their waste onto the nearby road. Municipal sanitary workers sweep the waste to make small heaps every 10 meters, then load the waste to waste carts by using two pieces of wooden plates. Since the inner parts of the city have narrow lanes, the collection work is done manually.

Data Collection Survey on Improvement Japan International Cooperation Agency of Environment in Varanasi City, Republic of India Kokusai Kogyo Co., Ltd. Sewerage Business Management Centre
4-34
Inner part of the city. Discharged waste by residents is swept and gathered to a certain point to make small heaps of waste by sanitary workers.
In some areas, waste carts are placed. The residents discharge waste directly on to the waste carts.
Some shops along the road put out dust bins. Several other shops facing the busy road place the same type of dustbins. This simple effort stopped littering in the area.
Also, the residents in the GP discharge their waste onto the nearby roads and surrounding areas, just like the residents of the VMC do. However, since there are no collection services in the GPs, the villages are full of waste. Vacant lands become temporary disposal sites full of leachates, especially during the rainy season.
Huge heaps of wastes along the unpaved road.
Another huge waste heap along the inner roads to the residential areas.

Data Collection Survey on Improvement Japan International Cooperation Agency of Environment in Varanasi City, Republic of India Kokusai Kogyo Co., Ltd. Sewerage Business Management Centre
4-35
4.3.3 Collection and Transportation
a. Primary Collection
In the VMC area, in general, people discharge their waste onto the nearby road, and municipal sanitary workers manually collect these heaps of wastes on the roads and bring them to the municipal storage depots by tricycle or hand carts.
Primary collection by municipal sanitary workers.
Waste on the roads is scraped by wooden plates and put into a small container. His tricycle is parked in the back of the photo.
Tricycle going to the nearest waste storage depot.
A resident bringing his waste onto a tricycle.
b. Municipal Waste Storage Depots
There are 36 waste storage depots within the city. Collection vehicles such as tricycles, handcarts and tractors bring the waste collected to the nearest depots28. Usually storage depots face busy roads, and the waste accumulated here is loaded onto trucks by the JCB.
Most of the depots are areas just marked by walls and sometimes even without roofs. When it rains, leachates are drained, and also pigs salvage the remaining food waste in many depots. From the viewpoints of sanitation as well as beautification, urgent improvements are necessary for the waste storage system.
During the field survey, the team had a chance to interview to the tractor driver at a depot. He said
28 Basically, a depot is located within one-kilometer distance.

Data Collection Survey on Improvement Japan International Cooperation Agency of Environment in Varanasi City, Republic of India Kokusai Kogyo Co., Ltd. Sewerage Business Management Centre
4-36
he is a contract-based driver who earns Rs 7,700 per month.
Sanitary workers who brought the waste collected to the depot.
Three workers are assisting sanitary workers who bring the waste into the depot. Once the depot becomes full, the waste is transferred to the final disposal site by large trucks.
Storage depots located in front of a zonal office. Sugarcane waste was brought in by a tractor.
Pigs around the depot. They enjoy scavenging food waste.
A steel container placed on the roadside, near one of the storage depots.
A sanitary worker brought the collected waste to a container.
c. Secondary Waste Transportation
The waste brought manually into the municipal waste storage depots will be loaded onto dump trucks by the JCB and transferred to the final disposal site. The waste accumulated in the 4.5 m3 steel container will be transported back and forth by dumper trucks.

Data Collection Survey on Improvement Japan International Cooperation Agency of Environment in Varanasi City, Republic of India Kokusai Kogyo Co., Ltd. Sewerage Business Management Centre
4-37
It took 10 minutes to fill an 8-ton dump truck by JCB.
Primary collection point. Nearby textile mills discharge textile waste to the point.
A empty container came back from the disposal site.
A empty container was placed next to the filled one. Now, the filled one will be trasported to the final disposal site.
Collection vehicles owned by the VMC both in 2010 and in 2015 are listed in the table below. Vehicles procured by the JNNURM funds had been used by A2Z, but after A2Z’s withdrawal from the businesses, most of the vehicles remained neglected at the processing unit in Karsana.
Table 4-23 Collection vehicles owned by the VMC
No Vehicles as of year 2010 as of year 2015
(actually in use)
1 Dump trucks 12 33
2 Compactor vehicles 35 029
3 Dumper trucks with containers 0 14
4 JCBs 3 13
5 Tricycles 800 300
6 Hand carts N.A. 1000
7 Tata Ace (small collection vehicle) 150 32
29 On behalf of compactor vehicles, dump trucks are in use for secondary transportation in order to increase working efficiency to load wastes onto compactor vehicles by wheel excavators.

Data Collection Survey on Improvement Japan International Cooperation Agency of Environment in Varanasi City, Republic of India Kokusai Kogyo Co., Ltd. Sewerage Business Management Centre
4-38
Dumper trucks JCB
Tata Ace for primary collection Large compactor vehicle
4.3.4 Final Disposal
There are no proper disposal sites that have been used more than 10 years by the VMC. It is reported that the VMC continues open dumping to any vacant lands whenever the VMC found them. As for the final disposal site, the City Sanitation Plan (2011) described the situation as follows.
There were three final disposal sites, which are now abandoned. These sites were located in Palang Shahid (10 acres), Nahi ghat (2 acres) and Kabir Math (1 acre). The landfill system is open dumping with gentle slopes. The leachate from the waste at the disposal site may be directly discharged into the Nalla and the Ganga River, thus polluting the river. The present two disposal sites are located along Ramnagar road near Mugal Sarai and at Sir Govardhan near Saint Ravidas Temple. The VMC has only adopted dumping as a method of disposal of the waste as of today.
Also, according to the City Development Plan (2015), there are currently two final disposal sites and one proposed site as seen in the map below.

Data Collection Survey on Improvement Japan International Cooperation Agency of Environment in Varanasi City, Republic of India Kokusai Kogyo Co., Ltd. Sewerage Business Management Centre
4-39
Source: City Development Plan for Varanasi 2041
Figure 4-12 Location of disposal sites
The field survey conducted on 23rd July, 2015 revealed a different situation. It is determined that only the one in Sirgorbardhanpur is under current use, while the one in Ramnagar was closed down a few years ago. Also, the one in Karsana was not the proposed site but the processing unit (closed) for manufacturing compost and RDF.
Disposal site at Sirgobardhanpur
Only one disposal site used by the VMC as of July 2015 is located in an area adjoining the three GPs, namely Sirgobardhanpur, Ramna and Nai Pura Kala. The area was originally bought by the

Data Collection Survey on Improvement Japan International Cooperation Agency of Environment in Varanasi City, Republic of India Kokusai Kogyo Co., Ltd. Sewerage Business Management Centre
4-40
VDA for the purpose of STP construction. The VMC, which had faced difficulty finding a new disposal site, took over the land from the VDA and started using it as a final disposal site. Reflecting these developments, people living nearby raised objections for the unintended use. According to the newspaper article, direct roads to the site within the GPs were blocked by the opposing residents, and therefore the VMC had to go indirectly from the national road and in rainy the season, the flooded roads prevent collection vehicles from reaching the final disposal site30.
The size of the area is 40 acres (approximately 16 ha) which is suitable for medium-term use, but since the waste is simply dumped openly and widely, the negative effects, i.e. ambient air pollution, bad smell, discharge of leachates, generation of insects and germs, etc. are of great concern. Also, as was reiterated earlier, wastes is simply dumped openly, and the site is demarcated by walls only without an office, a truck scale or facility to treat leachates. First of all, the site should be transformed into a sanitary landfill site. Along with the original idea of STP construction, it is possible to transform the site into sanitary landfilling and its leachate to be treated by the newly constructed STP.
The sign board showing the original plan of STP construction
Roads to the final disposal site. The vehicles,unable to go into the site, simply dump waste along the roads.
Raising the ground level of the road to the final disposal site
View of the final disposal site. Waste is dumped openly and widely. No office space.
30 An article of the Times of Inia on 22 July 2015.

Data Collection Survey on Improvement Japan International Cooperation Agency of Environment in Varanasi City, Republic of India Kokusai Kogyo Co., Ltd. Sewerage Business Management Centre
4-41
Waste pickers at the final disposal site. Since the most of the recyclables are collected at the source, they were collecting the remaining, less-valued polythene bags.
Heaps of waste. Polythene is noticeable.
JCB working at the final disposal site. Due to its limited capacity to spread and press earth, JCB is not appropriate here.
Following a dumper truck (container loader) during the time and motion survey
4.3.5 Processing Unit
The Karsana Processing Unit, which started construction in 2010, was funded by JNNURM. It was built by a private company with Rs. 49 crore of JNNURM funds, and its operations have been contracted out to A2Z since July 2014. According to the concerned persons, A2Z had operated the unit only for five to six months and then withdrew from its operation due to financial difficulties, and the unit is currently closed down. By considering the capacity of the unit, approximately 500 tons per day, all the waste of the VMC was supposed to be brought in and processed at this facility.
At this processing unit, recyclables would be screened by large-scale trommels and kitchen waste would be compost. It is assumed that A2Z withdrew from operations since it was unable to cover the operation cost by the profits from the sales of recyclables and compost.
Due to the difficulties (i) to control quality of compost as well as (ii) to find markets for compost, there are hardly any successful cases of a big compost facility. Also, the processing unit functions only to reduce the quantity of waste, and therefore the residual waste generated at the processing unit shall be disposed of at the final disposal site. It is important for the VMC officials to understand the roles and functions of both the processing unit and the final disposal site.

Data Collection Survey on Improvement Japan International Cooperation Agency of Environment in Varanasi City, Republic of India Kokusai Kogyo Co., Ltd. Sewerage Business Management Centre
4-42
Sign board at the processing unit in Karsana. Fund source, JNNURM, is specified.
Truck scale at the entrance. JCB and compactor vehicle lay neglected.
Two processing lines by two trommels directly connected per line.
Points for the final discharge. The finest is used for compost.
4.3.6 Organizational Structure and Financial Status
a. Organizational Structure
The Health Department of the VMC is in charge of SWM in the city. The organizational structure of the VMC along with the number of personnel as of September 2015 is shown in the figure below. The top of the department is the Chief Health Officer and he supervises four zonal sanitary officers just below him. These four zonal sanitary officers supervise 12 sanitary inspectors who supervise 34 sanitary supervisors. At the bottom of the line, 2,600 sanitary workers collect waste and sweep roads in the city six days per week under the supervision of 34 sanitary supervisors.
Out of 2,600 sanitary workers, 2,300 are permanent employees of the VMC. An interview with a sanitary worker revealed that most of them belong to a certain community, and some of their parents also used to work as municipal sanitary workers. They earn approximately Rs 20,000 per month since they are municipal employees. In order to ease financial burdens, out-sourcing is preferred in line with an austere policy, and currently 300 sanitary workers are contract-based. Their salary, approximately Rs 7,000 is much lower than the amount earned by the permanent workers.

Data Collection Survey on Improvement Japan International Cooperation Agency of Environment in Varanasi City, Republic of India Kokusai Kogyo Co., Ltd. Sewerage Business Management Centre
4-43
Figure 4-13 Organizational structure of the VMC
In addition, approximately 25 drivers of heavy machinery and trucks work in this department. As a whole, SWM in the city is extremely labor-intensive.
It is worth noting here that both financial resources as well as human resources are poorly allocated for the final disposal. At the final disposal site, there are no supervisors, no control office, and no truck scale.
b. Financial Status
b.1 Waste Collection Fees
Waste from households is simply discharged onto the nearby roads-even without placing the waste into bags- and municipal sanitary workers sweep and collect the waste as a part of road sweeping. Thus, the general public does not distinctly perceive that they receive the municipal collection services. The VMC tried to levy fees by introducing door-to-door collection through contracting-out SWM works to a private company, but it failed due to the withdrawal of the company as explained later.
As for the waste collection fee actually collected in the past, Rs 60 per household per month is introduced in the CSP while Rs 30 per household per month is introduced in the CDP.
b.2 Cost for SWM
Expenditures of the VMC in FY2012 are as shown in the table below.

Data Collection Survey on Improvement Japan International Cooperation Agency of Environment in Varanasi City, Republic of India Kokusai Kogyo Co., Ltd. Sewerage Business Management Centre
4-44
Table 4-24 Municipal expenditure of FY2012
Items FY2012
(unit: Lahks Rs.)
Percentage
Salaries
Finance and Revenue Dept. 635
General Administration Dept. 396
Public Works Dept. 605
Public Health Dept. 4,505
Other Dept. 150
Pensions and others 2,000
Water Works (Jal Kal) 2,155
Sub Total 10,446 54%
Operation and Maintenance
General Administration Dept. 5,470
Public Works Dept. 210
Education, Sports and Youth Welfare 6
Public Health Dept. 426
Solid Waste Management 212
Zonal Offices and Other Dept. 121
Water Works (Jal Kal) 2,458
Sub Total 8,903 46%
Total 19,349 100%
Source: Based on City Development Plan, details are confirmed by the VMC officials
As seen above, more than 50% was used for salaries, and among salaries paid by each department, the amount paid by the Public Health Department (Rs 4.5 hundred million) that employs more than 2,600 sanitary workers is remarkably large. On the contrary, only Rs 0.2 hundred million is used for operation and maintenance of solid waste management, and it can be assumed that most of that was used for fuel for collection vehicles.
The cost for SWM can be calculated as follows:
(Rs 4.5 hundred million + Rs 0.2 hundred million) ÷ (600to/day×365days)
=Rs 2,146/ton (40$/ ton)
The unit cost for SWM is very expensive as compared with that of other developing countries31,
indicating a remarkably ineffective SWM system in the city.
31 Based on the information as to the unit cost in other developing countries, the cities without sanitary landfilling spend usually USD10 to 20 per tonnage, which is mainly consisted of the collection cost.

Data Collection Survey on Improvement Japan International Cooperation Agency of Environment in Varanasi City, Republic of India Kokusai Kogyo Co., Ltd. Sewerage Business Management Centre
4-45
c. Public Private Partnership
The entire flow of SWM activities, namely waste collection, transfer, processing and final disposal of municipal solid waste has been contracted out to A2Z Waste Management (Varanasi) Pvt. Ltd. on 21st of April 2010, in the form of a concession. They began door-to-door waste collection on a pilot basis in Nariya Ward (no. 32) since May 2010. Then, they increased their coverage areas to five other wards in the city namely Nagwan (no. 8), Nawab Ganj (no. 14), Khojwan (no. 43), Birdopur (no. 53) and Bhadaini (no. 54). They intended to cover the entire city for door-to-door collection, storage, transportation, waste processing and disposal. However, A2Z cancelled its concessional agreement and withdrew from all activities. Currently, the VMC implemented SWM activities by itself.
Also, the VMC plans to privatize SWM once again and it was still in the process of planning as of May 2015.
4.3.7 Service Level Benchmark for SWM
The status of performance indicators for the service level benchmark set by MOUD is shown in
the table below.
Table 4-25 Service level benchmark data for SWM
Source: CSP and CDP
Performance Indicators
Unit As of 2010
As of 2014
Remarks Target set by MOUD
Household Level Coverage % 10.31% 0%
HHs who receive door to door collection services/ Total HHs
100%
Efficiency in Collection of Solid Waste % 54.07% 80%
Based on the estimation of per capita waste generation
100%
Extent of Segregation of MSW
% 0% 0% No segregation 100%
Extent of MSW Recovered
% 0% 0%
Resource recovery by individual collectors is not considered as recovery.
80%
Extent of Scientific Disposal of MSW
% 0% 0% Assume this means sanitary landfilling.
100%
Extent of Cost Recovery
% 0% 0% Revenue demand/ Annual operating cost
100%
Efficiency in Collection of SWM Charges
% NA 0% Revenue collected/ Annual operating cost
80%
Efficiency in Redressal of Customer Complaints
% 66.27% 81% Average for 4 months 90%

Data Collection Survey on Improvement Japan International Cooperation Agency of Environment in Varanasi City, Republic of India Kokusai Kogyo Co., Ltd. Sewerage Business Management Centre
4-46
As seen in the table above, household level coverage measured by the percentage of households receiving door-to-door collection decreased from 10% in 2010 to 0% in 2014. This is because A2Z, who introduced door-to-door collection in the city, withdrew from the operation. Also, the fact that no waste collection fees have been collected also indicates the difficulties to fundamentally improve the entire system.
Also, it is known that most complaints from the citizens are for road sweeping. This indicates the improvement of primary collection is the very first step to improve the sanitary situation in the city as well as to beautify the entire city. The labor management of sanitary workers might be a key for improvements.
Table 4-26 Forecast of waste amount to be generated in Varanasi City
Year City Sanitation Plan
Population Unit Generaton Rate Waste Generation Amount
2010 1,716,100 349 g/person/day 600 ton/day
2025 2,523,700 416 g/person/day 1,050 ton/day
2040 3,367,900 416 g/person/day 1,402 ton/day
Source:City Sanitation Plan in 2011
4.3.8 Estimation of waste amount to be generated in Varanasi City
The “City Sanitation Plan in 2011” provides an estimation of waste generation amount in the future as shown in the table below. It is foreseen that the waste generation unit per capita per day will increase from 349g/person/day in 2010 to 416g/person/day in 2025, which means that total waste generation amount in the city will exceed 1,000 ton per day.
4.3.9 Major Issues Identified
Improvement of the citizen’s waste discharge manners
It is commonly observed that people clean their own house but waste is simply dumped onto the roads in front of their house, assuming sweepers will clean up the dumped waste sooner or later. Surprisingly, waste is just dumped from the dustbins onto the roads without being put into bags, which inevitably attract small insects such as flies and mosquitos as well as bigger animals such as pigs and cows and this makes the entire area unhygienic. Improvement of primary collection, including re-introduction of door-to-door collection, along with improvement of discharge manner by the citizens is the very first step for SWM improvement.
Enhancement of collection capacity and improvement of collection efficiency
In the case of Varanasi, especially in the inner part of the city along the Ghats where many roads are extremely narrow, it is indispensable to carry out primary collection and transportation to the storage depots manually. After that, the secondary collection and transportation from the storage depots to the final disposal site shall be carried out mechanically, in other words, by heavy machinery and vehicles.
As reiterated earlier, there are 2,600 sanitary workers who carry out the primary collection in the city. However, according to the officer in charge, the VMC would need more than 4,000 workers based on the state regulation which stipulates there be 35 sanitary workers per 10,000 people.

Data Collection Survey on Improvement Japan International Cooperation Agency of Environment in Varanasi City, Republic of India Kokusai Kogyo Co., Ltd. Sewerage Business Management Centre
4-47
Apart from the above fact, the manual collection is not only ineffective but also unhygienic. This very nature of manual collection is inevitably linked to caste-based discrimination as well as rights. This complicated situation pushed up the unit cost of waste collection.
It is time for the VMC to initiate mechanization by introducing small collection vehicles and automated tricycles which can enter narrow lanes, along with the improvement of discharge and storage.
Establishment and O&M of Sanitary Landfill Site
The current final disposal site of the VMC is maintained neither in a scientific manner nor in a sanitary manner. The large vacant area is simply demarcated by walls and has no other facilities necessary for the landfill site such as a control office, a truck scale, etc. It was reported that the residents living nearby suffered from dust and littering from the collection vehicles, bad smells, underground water pollution by leachates, etc. impeded collection vehicles from coming into the disposal site. The report concluded that as a result, the city became full of uncollected waste.
Firstly, it is indispensable to establish a disposal site with necessary facilities and to introduce sanitary landfilling. The improvement of the final disposal site is indeed a corner stone for the improvement of the entire SWM system.
Review of Functions of the Processing Unit
The Karsana Processing Unit-with a capacity of treating 500 tons of waste per day- was constructed with the fund from JNNURM. Like many other similar facilities in other countries, the Unit has faced difficulties (i) to control the quality of compost as well as (ii) to find markets for compost. In addition, in case of Varanasi, profitable recyclables are well recycled by individual recyclers, and therefore sales of recyclables segregated at the Unit will be nominal. In other word, it is difficult for any operators to cover the operation cost by gains on sales of segregated recyclables at the Unit. This means that the VMC has to pay a certain cost even if the operation of the Unit is contracted out to a private entity.
The VMC intends to use the Unit as a final disposal site in the future. Here, it is important for the VMC officials to understand the fact that the processing unit functions only to reduce the quantity of waste, and therefore the residual waste generated at the processing unit shall be disposed of at the final disposal site.
4.4 Sanitation Facility Management
4.4.1 Household Latrines
a. Households owning Latrine Facilities
According to the 2011 Census, the percentage of households that have latrine facilities in the study areas was a remarkably high rate at over 85% except for Suzabad GP. In particular, the rate of households owning toilets at premises in Varanasi City was as high as 94.8%, which illustrates that the majority of citizens have access to the toilet facilities in some way. Meanwhile, the percentage in Suzabad GP was quite low at 48.4%, which means that more than 50% of households in Suzabad still openly defecate. The following table shows the penetration rate of household toilets in each study area.

Data Collection Survey on Improvement Japan International Cooperation Agency of Environment in Varanasi City, Republic of India Kokusai Kogyo Co., Ltd. Sewerage Business Management Centre
4-48
Table 4-27 Percentage of owning latrine facilities at premises in study area(%)
Area Number of Households
Households having latrine facility within the premises (%)
Households not having latrine facility within the premises (%)
Varanasi Municipality
190,835 94.8 5.2
Ramnagar Municipality
7,729 86.0 14.0
Sir Gobardhan (GP) 1,708 88.5 11.5
Suzabad (GP) 2,514 48.4 51.6
Shivdaspur (GP) 2,614 89.5 10.5
Source: 2011 Census
The following figure shows the types of latrine facilities used by the households in each study area. In the urban areas, Varanasi City and Ramnagar City, the majority of households that have latrine facilities at the premise use toilets connected to the sewerage system, followed by toilets connected to septic tanks. On the other hand, in the rural area where the three GPs are located, the percentage of households using toilets connected to the sewerage system is quite low and toilets connected to septic tanks are the main type of toilet being used in GPs.
Source: 2011 Census
Figure 4-14 Types of latrine facilities used in study areas(%)
78.169.6
12.54.7
33.2
13.113.6
51.8
28.1
45.8
5.214.0 11.5
51.6
10.5
0%
10%
20%
30%
40%
50%
60%
70%
80%
90%
100%Households nothaving latrinefacility within thepremisesService LatrineNight soil serviced byanimal
Service LatrineNight soil removedby human
Night soil disposedinto open drain
Pit latrine Withoutslab/ open pit
Pit latrine With slab/ventilated improvedpit
Other system

Data Collection Survey on Improvement Japan International Cooperation Agency of Environment in Varanasi City, Republic of India Kokusai Kogyo Co., Ltd. Sewerage Business Management Centre
4-49
b. Progress of SBM in Study Areas
b.1 Urban Area
According to the interview with the VMC, the city started supporting the establishment of latrines at households by using a scheme of SBM Urban which was newly established in 2015. As its activity, the VMC has collected applications from households which desire to set-up latrine facilities at premises and they have selected the candidates.
As of September 2015, 1,930 households applied to this scheme. Through the selection process, those who have newly migrated from other areas or who have been sheltered in Ashrams or temples were disqualified. Subsequently, after confirming that applicants have space and land to construct latrine facilities at premises, 779 households remained as final candidates.32
As a target of 2015, the VMC aims to set-up latrine facilities at 2,000 households in the city in order to achieve the goal set by the SBM Urban. Since the number of households which have received support under SBM Urban is still not sufficient to reach the VMC’s target, additional households will be selected to further increase latrine facilities at households.
b.2 Rural Area
Before the SBM was established in 2014 under the Modi regime, the development of latrine facilities in rural areas had been implemented by several national programs such as the Total Sanitation Campaign (1999) and the Nirmal Bharat Abiyan. Also, under the scheme of the Nirlmal Gram Puraskar (2003), as part of the NBA program, financial incentives were provided to villages which successfully met the criteria.
Under these programs, construction of latrine facilities at households has also proceeded in rural areas of Varanasi. In fact, according to the “Data Collection Survey on Sanitation Facilities (Latrines) in India” which was conducted by the JICA study team in 2014, it was observed by the study team that many latrine facilities at households have been established through the schemes of the TSC and the NBA in several GPs of Varanasi
4.4.2 Development of Public Toilets
This section will explain the situation of public toilets in study areas, particularly in urban areas. Considering the fact that there is only one public toilet existing in Ramnagar City, this section focuses on analyzing the situation of Varanasi City where public toilets are operated on a large scale among the study areas. In Varanasi City, public toilets can be divided into three categories: public toilets along the Ghat, community toilets, and others. The current situation of each type of toilet is shown as follows.
a. Public Toilet
According to the interview with the VMC, public toilets in Varanasi City exist in 12 locations as of September 2015. These public toilets are mainly located along the Ghat at the Ganga River which attracts a number of tourists over the year. The operation of public toilets is solely managed by Sulabh International which was awarded an operation contract from the VMC. Rs 2 per use is
32 For those who do not own the land such as a renter, they can apply to the scheme to establish community toilet complex by creating a responsible group. In order to secure a land for toilet construction, it is now considered to use a land owned by the VMC or donated.

Data Collection Survey on Improvement Japan International Cooperation Agency of Environment in Varanasi City, Republic of India Kokusai Kogyo Co., Ltd. Sewerage Business Management Centre
4-50
collected for the operation and user charge.
Table 4-28 Number of public toilets at Ghats (Sulabh International)
No Location Number of Toilet 1 Assi Ghat 10 2 Chowiki Ghat 10 3 Hanuman Ghat 10 4 Scindiya Ghat 10 5 Manikarnika Ghat 10 6 Dashashwamedh Ghat 20 7 Khrikiya Ghat 5 8 Malviya Brdige 10 8 Raj Ghat 10 10 Prahlad Ghat 10 11 Trilochan Ghat 10 12 Gai Ghat 10 Total 125
Source:City Sanitation Plan 2011
Table 4-29 Public toilets operated by Sulabh International
Public toilets at Ghat Operator of toilet
Entrance(Right: Female, Left: Male) Female toilet
Source :JICA study team
In order to further increase the number of public toilets in the city, the VMC is planning to establish new public toilet facilities under JICA’s “Ganga Action Plan (GAP)” project. In the 1st phase, public toilet facilities have been established in 45 locations of the city of which 35

Data Collection Survey on Improvement Japan International Cooperation Agency of Environment in Varanasi City, Republic of India Kokusai Kogyo Co., Ltd. Sewerage Business Management Centre
4-51
locations are served by the sewerage system and the other 10 locations are connected to septic tanks. The total cost is estimated at Rs 52,000,000 and average construction costs per each location is around Rs 1,160,000. The operator of public toilets was selected under public tender in 2013 in which five contractor candidates joined. However, since Sulabh International was the only contractor which could meet the requirements in terms of experience in operation and maintenance for public toilets, the remaining four contractors were disqualified. In the future, according to the VMC, an additional 40 and 46 public toilet facilities are planned to be constructed in the 2nd and 3rd phases respectively.
b. Community Toilet Complex
From the interview with the VMC, it was confirmed that 90 community toilet complexes exist in the city as of September 2015. These community toilet complexes are operated by four operators, NEDA, Sulabh International, Advance Sanitation welfare Society, and Refrogen Suvidha, based on the contract with the VMC. Rs 30 per month is collected from each household using the toilet as an operation and user charge. The following table shows operators of community toilet complexes, numbers of facilities, and the locations in the city.
Table 4-30 Operators and the number of CTCs
No Operator Number of CTC 1 Sulabh International 71 2 NEDA 12 3 Advance Sanitation welfare Society 3 4 Refrogen Suvidha 4 Total 90
Source: The JICA study team
Table 4-31 CTCs operated by NEDA
No Location Street 1 Durga Kund Kabir Nagar 2 Maldahiya I Maldahiya 3 Maldahiya II Maldahiya 4 Killa Jail Choka Ghat 5 Diwani Kachahari Kachahari 6 Nevada Nevada 7 Town Hall Maidagin 8 Maidagin Maidagin 9 Tahseel Gate Tahseel Sadan 10 Benia Chotopur 11 Shukul Phara Shukulpura 12 Lahartara Chungi Lahartana
Source: JICA Study Team
Table 4-32 CTCs operated by Sulabh International
No Location No Location 1 Machhodari 37 Ranipur 2 Narkatiya Garhi 38 Dyoribir 3 Jalalipura 39 Shiwala 4 Chhohara 40 Shivpurva 5 Dhulligari 41 Bari Gaibi

Data Collection Survey on Improvement Japan International Cooperation Agency of Environment in Varanasi City, Republic of India Kokusai Kogyo Co., Ltd. Sewerage Business Management Centre
4-52
No Location No Location 6 Lat Bhairav 42 Tulsipur 7 Narayanpur 43 Nariya
8 Sadarbazar III 44 Ambeskarpark Barigaibi
9 Digia 45 Mahmoorganj 10 Azad park 46 Nagwan 11 Teliyana 47 Heerapur 12 Roadways Cant 48 Chhoti Piyari 13 Sarnath I 49 Beniya Bagh 14 Sarnath II 50 Pitarkund 15 Mental Hospital 51 Aourrangbad 16 Ardali Bazar 52 Pulkohana 17 Sardar Bazar I 53 Ghasiyari Toal 18 Harhasari 54 Omkareshwar 19 Pishach Mochan 55 Maidagin 20 Sankat Mochan 56 Dhelwariya 21 Karoundi Chaungi 57 Nakkighat 22 Saras Wati Fathak 58 Assi S.T.P. 23 DayaNagar 59 Bhadau Chungi 24 Bundi Parkataghat 60 Maldahiya- II 25 Kabir Chaworaha Hospital 61 Teliyabag 26 Bisheshwarganj 62 Vijay Nagaram 27 I.D.H. 63 Nasdeshar Dhobighat 28 Lahartara 64 Shivpur Harijan Basti 29 Tilbhandeswar 65 Normal School 30 Chamroutiya 66 Roopanpur 31 Karaundi 67 Shivpur 32 Durgakund 68 Senpura 33 Batwapur 69 Maldahiya- I 34 Shankul Dhara Khojwan 70 Ambiya Mandi 35 Sarai Surjan 71 Golgadda 36 Nagwan Harijan Basti
Source: JICA Study Team
Table 4-33 CTCs operated by the Advance Sanitation welfare Society
No Location 1 Kotawali Ladien Poice Station 2 Collectorate
3 Queens College Source: JICA Study Team
Table 4-34 CTCs operated by Refrogen Suvidha
No Location 1 Collectorate (No1) 2 Collectorate (No2) 3 Gilatbazar 4 Suar Badwa
Source: JICA Study Team

Data Collection Survey on Improvement Japan International Cooperation Agency of Environment in Varanasi City, Republic of India Kokusai Kogyo Co., Ltd. Sewerage Business Management Centre
4-53
c. Others
According to the VMC, there are 75 public urinal facilities which have been constructed as well as operated by the VMC. Also, the VMC owns three mobile toilets for the festive occasion.
4.4.3 Toilet Facilities in School
Until now, school toilet facilities in India have been developed through the national schemes such as the TSC as well as the NBA, and the CSR activities by private companies, which is also applicable to the Varanasi area. The following part will illustrate the overview of school toilet facilities in Varanasi.
a. Situation of School Toilet Facilities
According to the NBA Baseline survey in 2012, the percentage of public schools without toilet facilities in the Varanasi district was 3.6% at primary schools and 4.6% at upper primary schools. Interestingly, the percentage of holding toilet facilities tends to increase as the level of education becomes higher as is shown in the fact that 100% of secondary and higher secondary schools in Varanasi district own toilet facilities.
With regard to private school, however, the percentage of school without toilet facilities is lower than the one of public school with the rate varying from 6.6% to 11% among the schools from primary to higher secondary level. This result reveals that public school which has been a target of national support schemes such as NBA tends to have the better environment regarding toilet facilities.
Table 4-35 Public schools with/without toilet facilities in Varanasi District
Category No. of School Total enrollment No. of Toilet No. of
Schools Without toilet
No. of Schools without
toilet (%) Boys Girls Boys Girls
PRIMARY 857 87,867 67,639 1,490 1,020 31 3.62
UPPER PRIMARY
304 27,846 24,507 338 337 14 4.61
SECONDARY 19 4,128 4,121 28 31 0 0.00
HIGHER SECONDARY
18 5,169 5,345 31 27 0 0.00
Total 1,198 125,010 101,612 1,887 1,415 45 3.76
Source: MODWS, NBA Baseline Survey 2012

Data Collection Survey on Improvement Japan International Cooperation Agency of Environment in Varanasi City, Republic of India Kokusai Kogyo Co., Ltd. Sewerage Business Management Centre
4-54
Table 4-36 Private schools with/without toilet facilities in Varanasi District
Category No. of School Total enrollment No. of Toilet
No. of Schools Without Toilet
No. of Schools Without Toilet (%)
Boys Girls Boys Girls
PRIMARY 318 42,242 33,282 225 221 28 8.81
UPPER PRIMARY
182 23,966 20,463 140 147 20 10.99
SECONDARY 61 13,360 12,172 74 80 4 6.56
HIGHER SECONDARY
74 24,948 21,618 105 100 7 9.46
Total 635 104,516 87,535 544 548 59 9.29
Source: Same as above
b. Activities of Private companies
As CSR activity, Toyota Kirloskar Motor Private Ltd (TKM), a subsidiary of Toyota motor corporation Japan, has been supporting to establish toilet facilities in female public schools in India with an aim to improve the study environment for female students. As of September 2015, TKM has constructed total 500 school toilet facilities in Karnataka state, UP state, and Bihar state. In UP state, 125 school toilet facilities in Varanasi area were established33.
4.4.4 Septage Management
In study areas, it is responsibility of individual household to remove sludge in the case using toilets connected to septic tank as well as pit latrine toilet.
However, in reality, there are few cases that households actually practice sludge removal and no proper septage management has been implemented in study areas. The details of septage management status in each study area will be further explained in the Chapter 6 based on the result of the household and business survey.
4.4.5 Key Issues
In the public and institutional opinion surveys, which will be further explained in the Chapter 6, it was revealed that a certain number of households still go open defecation even in urban area where the vast majority of households own toilet facilities. Yet, such situation is expected to be improved near future by the activities of SBM Urban which promotes the establishment of toilet facilities for the urban poor. Similarly, in the rural area, although the percentage of holding toilet facilities at household was presumed at low level, the survey results has shown that nearly 90% of households actually own toilet facilities except Suzabad GP owing to the activities of SBM. Also, the environment of school toilet facilities has been gradually improved through the scheme of NBA and CSR activities. Considering this situation, it can be said that the issue of toilet facilities at household as well as school are expected to be improved continuously.
On the other hand, the issue of septage management has been quite problematic in all study areas as it is hardly practiced despite the fact that the regular sludge withdrawal is a requisite for sustainable use of toilet which is connected to septic tank and pit latrine. Therefore, in order to 33 http://www.autocarpro.in/news-national/toyota-kirloskar-motor-drives-csr-programme-india-9233

Data Collection Survey on Improvement Japan International Cooperation Agency of Environment in Varanasi City, Republic of India Kokusai Kogyo Co., Ltd. Sewerage Business Management Centre
4-55
improve current situation, regulation system should be established to urge households to practice regular sludge withdrawal.
In addition to septage management, the treatment of sludge is another issue to be addressed. Referring to the result of household and business survey, it is found that sludge removed from septic tank or pit latrine is discharged to ponds, open space, and rivers. These facts suggest the necessity to establish treatment facilities as well as regulations for proper septage management.

Data Collection Survey on Improvement Japan International Cooperation Agency of Environment in Varanasi City, Republic of India Kokusai Kogyo Co., Ltd. Sewerage Business Management Centre
5-1
5 Activities of International Donors
In India, JICA and other international donors have conducted a number of projects with a view to improving the issues of sanitation, water and sewerage in Varanasi as well as surrounding areas.
5.1 JICA
Table 5-1 Projects of JICA (Sanitation, Water and Sewerage)
Project Status Implementation Agency
Target Area Project Summary
/ Outcome
Yamuna Action Plan Project(III)
On-going
(2011~)
Delhi Jal Board
Delhi
The project aims to develop as well as improve the sewerage system in Delhi where the Yamna River, a tributary of the Ganga river, is seriously polluted.
Ganga Action Plan Project (Varanasi)
On-going
(2005~) MOEF
Varanasi City in UP State
The project aims to improve the water quality of the Ganga River by enhancing the capacity of the sewerage treatment system In Varanasi, UP state.
Data Collection Survey on Sanitation Facilities (Latrines) in India
Completed (2014-2015)
N/A
Rajasthan State, UP State, and Tamil Nadu State
The project studied the percentage of people using toilets, the environment, and challenges in India to investigate the ways to promote use of toilet. As outcome of the project, cooperation plans to improve the sanitation environment in India were proposed.
Technical Adviser in the Sewerage Sector
Completed
(2011-2014)
CPHEEO (MOUD)
N/A
Consultation service was provided for the operation and management of sewerage systems in India, which improved the capacity of relevant organizations with sewerage management.

Data Collection Survey on Improvement Japan International Cooperation Agency of Environment in Varanasi City, Republic of India Kokusai Kogyo Co., Ltd. Sewerage Business Management Centre
5-2
The Study for Formulation and Revision of Manuals of Sewerage and Sewage Treatment
Completed (2010-2014)
MOUD N/A
Manuals, including pre cautions and trouble shooting methods to maintain sewerage systems were formed.
Integrated Pollution Abatement and River Basin Management Project for Ganga Basin
Completed
(2003-2005)
NRCD
(MOEF)
Four cities (Lucknow, Kanpur, Allahabad, and Varanasi)
A master plan for 2030 was formed to improve water quality of the Ganga River, targeting four cities located at the middle stream of the Ganga River.
Yamuna Action Plan Project(I)
Completed (1992~)
NRCD
(MOEF)
15 cities in the river Yamuna Basin
Sewerage treatment facilities and sanitation facilities were established in target cities with an aim to improve the water quality of the river Yamuna.
Yamuna Action Plan Project(II)
Completed
(2003~)
NRCD
(MOEF)
Delhi and Agura(Sewerage System), Delhi and cities in UP state and Hariana State (Sanitation)
As the main purpose of the project, sewerage treatment facilities were newly established as well as expanded in Delhi and Agra. Also, installation and maintenance of sewer pipes were implemented.
Preparatory Survey on Ganga Rejuvenation Project
On-going
(2015~)
MOWRGR/ NMCG / UPJN
VMC and surrounding five cities
The project aims to improve the water quality in the Ganges river by augmenting sewage collection systems and sewage treatment facilities in target areas, which also expects to improve the living conditions of people who reside in target areas as well as the downstream area.

Data Collection Survey on Improvement Japan International Cooperation Agency of Environment in Varanasi City, Republic of India Kokusai Kogyo Co., Ltd. Sewerage Business Management Centre
5-3
5.2 Activities of Other International Donors
a. World Bank
Table 5-2 Projects of World Bank(Sanitation, Water and Sewerage)
Project Status Implementation Organization
Target Area Project Summary
/ Outcome
Uttar Pradesh Water Sector Restructuring Project Phase 2
On-going (2013-2020)
Uttar Pradesh Irrigation Department, GoUP, Lucknow
UP State
The project aims to achieve capacity development of relevant agencies for improvement of water resource management, modernization of irrigation systems, and enhancement of production efficiency in UP state.
Capacity Development for Urban Development
On-going (2011-2018)
Ministry of Housing and Urban Poverty Alleviation and MOUD
20 states including UP State
The project aims to improve urban management systems and reduce urban poverty. Also, support for policy implementation and organizational reformation will be provided in targeting urban local bodies. The improvement of urban services is identified as one of the project components, and hence base line surveys for improving NRW have been conducted,targeting six cities including Varanasi City.
National Ganga River Basin Project
On-going (2011-2019)
MoEF and Responsible agencies in target 5 states
Five states (Uttarakhand, UP,Bihar, Jharkhand, and West Bengal)
The project aims to develop the organizational capacity of the NGRBA and to invest in the sectors to remove the causes of water pollution of the Ganga River, such as urban and industrial drainage and waste, maintenance for the river bank.
Uttar Pradesh Water Sector Restructuring Project Phase 1
Completed
Uttar Pradesh Irrigation Department, GoUP, Lucknow
UP Sate
In the project a responsible organization, which supervises the water resource management in UP state, was established. A master plan for the Ganga River basin was formed.

Data Collection Survey on Improvement Japan International Cooperation Agency of Environment in Varanasi City, Republic of India Kokusai Kogyo Co., Ltd. Sewerage Business Management Centre
5-4
b. GIZ
Table 5-3 Projects of GIZ(Sanitation, Water and Sewerage)
Project Status Implementation Organization
Target Area Project Summary
/ Outcome
Support to the National Urban Sanitation Policy SNUSP(II)
On-going (2014-2017)
MOUD Several cities to be selected
The project aims to disseminate the knowledge and experience acquired from the SUNSUP I, and support target cities to formulate CSP individually
Support to the National Urban Sanitation Policy SNUSP(I)
Completed MOUD
Six cities (Shimula, Varanasi, Raipur, Nashik, Tirupati, Kochi)
The project supported the formulation of the CSP in the targeting six cities under the MoUD.

Data Collection Survey on Improvement Japan International Cooperation Agency of Environment in Varanasi City, Republic of India Kokusai Kogyo Co., Ltd. Sewerage Business Management Centre
6-1
6 Public and Institutional Opinion Surveys
6.1 Public Opinion Survey (POS)
6.1.1 Outline of the Survey Areas and the Survey Schedule
POSs were conducted in two urban local bodies (ULBs), namely the VMC and the RNMB as well as three rapidly-urbanizing GPs near the VMC, namely Shivdaspur, Suzabad and Sirgorbardhanpur as per the schedule in the table below. The number of sample households is 300 in total, 100 from the VMC, 50 from the RNMB, and 50 each from the three GPs.
Table 6-1 Survey schedule
Date Survey Schedule
2015/09/07 Training for enumerators
2015/09/08 Suzabad GP
2015/09/09 Sirgorbardhanpur GP
2015/09/10 Ram Nagar Municipal Board
2015/09/11 Varanasi Municipal Corporation
2015/09/12 Varanasi Municipal Corporation
2015/09/13 Shivdaspur GP
Figure 6-1 Localities where POS was conducted
6.1.2 Varanasi Municipal Corporation (VMC)
In Varanasi, a total of 100 households, 48 households from areas that were well served by

Data Collection Survey on Improvement Japan International Cooperation Agency of Environment in Varanasi City, Republic of India Kokusai Kogyo Co., Ltd. Sewerage Business Management Centre
6-2
environmental services, namely “Well-served areas” and 52 households from areas that were comparatively less served by environmental services, namely “Less-served areas”, were selected from five municipal zones for the interview survey34. The detailed results are shown below.
a. Basic Household Profiles
The average number of household members is 5.17 persons in the well-served areas and 6.50 persons in the less-served areas. The gender difference of household members was larger in the less-served areas, where male household members outnumbered female household members by 0.5 persons on average.
As for the household economy, the annual income per household in the well-served areas is much larger than in the less-served areas. The gap amounted to Rs 40,000 per year. As for socio-cultural aspects, more than 90% of the interviewed households in the well-served areas are Hindus, while more than 50% of the interviewed households in the less-served areas are Muslim. Also, in both areas, a majority of the households belong to OBCs, but the ratio is larger in the less-served areas.
Table 6-2 Household composition (persons) and household annual income (avg.)
Area with
Number of household members
Male membersFemale
members
Household Annual
Income(Rs.)
Well-served Number 48 48 48 48
Mean 5.17 2.60 2.56 154,625.00
Min 2 1 1 52,000
Max 9 6 6 500,000
Less-served Number 52 52 52 52
Mean 6.50 3.50 3.00 114,134.60
Min 2 1 1 45,000
Max 14 8 11 350,000
Total Number 100 100 100 100
Mean 5.86 3.07 2.79 133,570.00
Min 2 1 1 45,000
Max 14 8 11 500,000
34 Twenty households were selected from each zone, and within each zone, approximately 10 were chosen from “Well-served areas” and the other 10 were chosen from “Less-served areas.” This sampling methodology was decided based on the discussion with the Health Officer of VMC. The field surveyors obtained information on “Well-served areas” and “Less-served areas” from the municipal zonal officers in each five zone.

Data Collection Survey on Improvement Japan International Cooperation Agency of Environment in Varanasi City, Republic of India Kokusai Kogyo Co., Ltd. Sewerage Business Management Centre
6-3
Table 6-3 Religion and social groups
Religion Total Social Groups Total
Area with
Hindu Muslim
General Caste
Other Backward Classes
Scheduled Caste
well-served n 46 2 48 18 28 2 48
% 95.83 4.17 100.00
37.50 58.33 4.17 100.00
less-served n 23 29 52 12 35 5 52
% 44.23 55.77 100.00 23.08 67.31 9.62 100.00
Total n 69 31 100 30 63 7 100
% 69.00 31.00 100.00 30.00 63.00 7.00 100.00
Before asking sector-specific questions such as questions regarding water supply and solid waste management, the interviewees were asked rather general questions regarding their concerns. To answer the question “Which of the following do you think needs urgent improvement? Rank top five items.” The respondents give five points; (5) for the item they think needs the most urgent improvement and give one point (1) for the item they think needs the least urgent improvement. “Electricity/Cooking fuel (2.96 points)”, “Solid Waste (2.46 points)”, and “Drainage/Liquid Waste (1.98 points)” are the top three items in the well-served areas, while “Drinking Water (2.77 points)”, “Drainage /Liquid Waste (2.60 points)” and “Electricity/Cooking fuel (2.48 points) are the top three items in the less-served areas. It became apparent that in case of the VMC, an issue as basic as drinking water occupies the people’s attention in the less-served areas.
Table 6-4 Items needed for urgent improvements
Area with
Drin
king
wa
ter
Acc
ess
roa
d/
Tra
nsp
orta
tion
Dra
ina
ge/
Liq
uid
wa
ste
So
lid w
ast
e
La
trin
e fa
cilit
ies
Ed
uca
tion
fa
cilit
ies
He
alth
faci
litie
s
Ele
ctric
ity/
cook
ing
fue
l
Em
plo
yme
nt
Crim
e/
safe
ty
well-served 1.81 1.60 1.98 2.46 0.35 1.04 0.71 2.96 1.21 0.44
less-served 2.77 1.21 2.60 1.69 0.90 0.62 0.56 2.48 1.31 0.46
Total 2.31 1.40 2.30 2.06 0.64 0.82 0.63 2.71 1.26 0.45
(Note) The respondent ranked five items, giving five (5) points for the item needed most urgent improvement to one (1) point for the item needed least urgent improvement. Then the average points were calculated for each item.
b. Water Supply and Wastewater Management
b.1 Water Supply
As for the main source of drinking water, 60.4% of the households in the well-served areas use “piped water into dwelling” and 12.5% of them use “piped water into yard/plot”. In the well-served areas, more than 70% of the households use piped water, while some use “Tubewell/borehole (22.9%)” and “Unprotected Wells (4.2% )”. In the less-served areas, 42.3% of the households use “piped water into dwelling” and 13.5% of them use “piped water into yard/plot”. In total, approximately half (55.8%) of the households use piped water, while substantial numbers of households use other sources such as “tubewell /borehole (21.2%)” and “public Tab (17.3%)” in the less-served areas.

Data Collection Survey on Improvement Japan International Cooperation Agency of Environment in Varanasi City, Republic of India Kokusai Kogyo Co., Ltd. Sewerage Business Management Centre
6-4
The survey also questions the main water source for domestic purposes. It became clear that the main sources for both drinking and domestic purposes were exactly the same in the well-served areas, while the portion of households that use tubewells /boreholes slightly increased for domestic purposes in the less-served areas.
Table 6-5 Main source of drinking water
Piped water into dwelling
Piped water into yard/ plot
Public tab
Tubewell/
borehole
Protected well
Unprotected well
Total
well-served n 29 6 0 11 0 2 48
% 60.4 12.5 0.0 22.9 0.0 4.2 100.0
less-served n 23 8 5 14 1 1 52
% 44.23 15.38 9.62 26.92 1.92 1.92 100.0
Total n 52 14 5 25 1 3 100
% 52.0 14.0 5.0 25.0 1.0 3.0 100.0
As for the supply frequency of drinking water, all households in the well-served areas answer either “fixed timing daily (72.9%)” or “round the clock (27.1%)”. By utilizing either piped water or own tubewells and boreholes, they are able to be supplied water without any frequency problems.
In the less-served areas too, most of the households were supplied with either “fixed timing daily (65.4%)” or “Round the clock (28.9%)”. However, the fact some answered, either “fixed timing alternate day (3.9%)” or “erratic (1.9%)” indicates a certain portion of households, though small, face a serious problem of water supply frequency in the less-served areas.
Table 6-6 Supply frequency of drinking water
Round the
clock Fixed timing
daily Fixed timing alternate day
Erratic Total
well-served n 13 35 0 0 48
% 27.08 72.92 0.00 0.00 100.00
less-served n 15 34 2 1 52
% 28.85 65.38 3.85 1.92 100.00
Total n 28 69 2 1 100
% 28.00 69.00 2.00 1.00 100.00
Questions about water use for different purposes were raised and the results are shown in the table below. The results are similar for both the well-served areas and the less-served areas. They are listed “for bathing”, “for washing cloths”, “for flushing toilets”, “for cleaning utensils” and “for drinking” in order of quantity used.
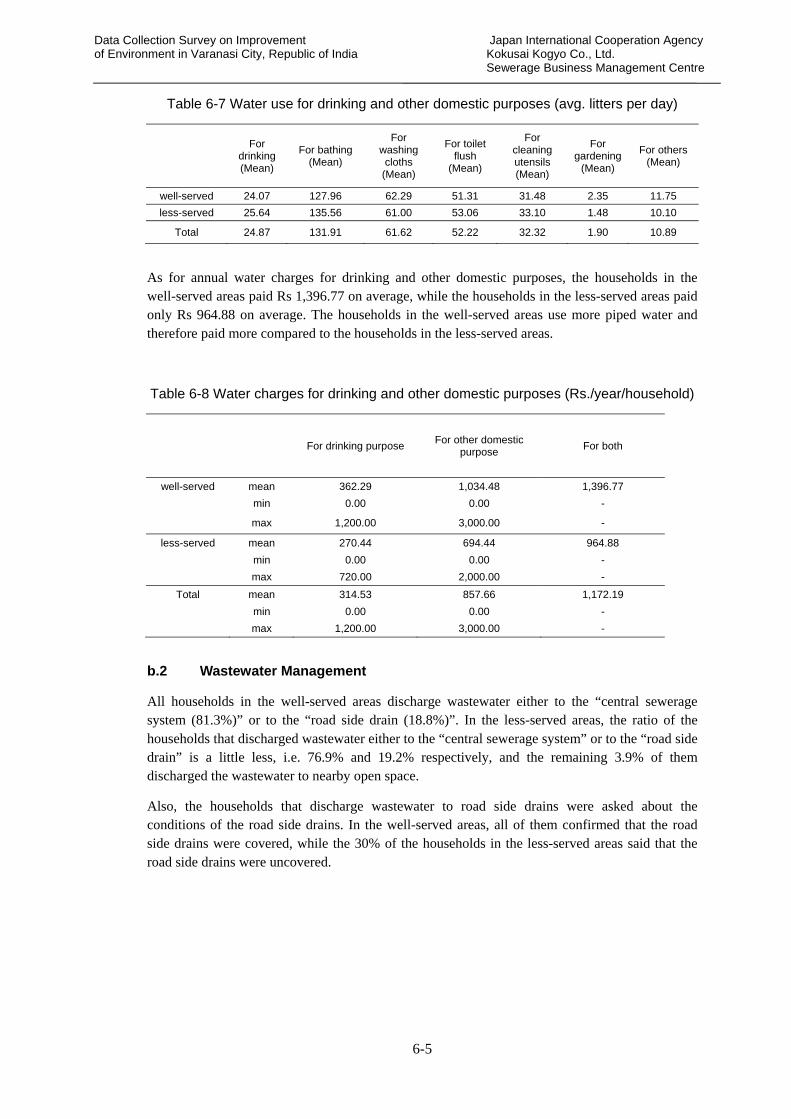
Data Collection Survey on Improvement Japan International Cooperation Agency of Environment in Varanasi City, Republic of India Kokusai Kogyo Co., Ltd. Sewerage Business Management Centre
6-5
Table 6-7 Water use for drinking and other domestic purposes (avg. litters per day)
For drinking (Mean)
For bathing(Mean)
For washing cloths
(Mean)
For toilet flush
(Mean)
For cleaning utensils (Mean)
For gardening
(Mean)
For others(Mean)
well-served 24.07 127.96 62.29 51.31 31.48 2.35 11.75
less-served 25.64 135.56 61.00 53.06 33.10 1.48 10.10
Total 24.87 131.91 61.62 52.22 32.32 1.90 10.89
As for annual water charges for drinking and other domestic purposes, the households in the well-served areas paid Rs 1,396.77 on average, while the households in the less-served areas paid only Rs 964.88 on average. The households in the well-served areas use more piped water and therefore paid more compared to the households in the less-served areas.
Table 6-8 Water charges for drinking and other domestic purposes (Rs./year/household)
For drinking purpose
For other domestic purpose
For both
well-served mean 362.29 1,034.48 1,396.77
min 0.00 0.00 -
max 1,200.00 3,000.00 -
less-served mean 270.44 694.44 964.88
min 0.00 0.00 -
max 720.00 2,000.00 -
Total mean 314.53 857.66 1,172.19
min 0.00 0.00 -
max 1,200.00 3,000.00 -
b.2 Wastewater Management
All households in the well-served areas discharge wastewater either to the “central sewerage system (81.3%)” or to the “road side drain (18.8%)”. In the less-served areas, the ratio of the households that discharged wastewater either to the “central sewerage system” or to the “road side drain” is a little less, i.e. 76.9% and 19.2% respectively, and the remaining 3.9% of them discharged the wastewater to nearby open space.
Also, the households that discharge wastewater to road side drains were asked about the conditions of the road side drains. In the well-served areas, all of them confirmed that the road side drains were covered, while the 30% of the households in the less-served areas said that the road side drains were uncovered.

Data Collection Survey on Improvement Japan International Cooperation Agency of Environment in Varanasi City, Republic of India Kokusai Kogyo Co., Ltd. Sewerage Business Management Centre
6-6
Table 6-9 Wastewater management
Central sewerage
system Road side drain
Nearby open space
Total
well-served n 39 9 0 48
% 81.25 18.75 0.00 100.00
less-served n 40 10 2 52
% 76.92 19.23 3.85 100.00
Total n 79 19 2 100
% 79.00 19.00 2.00 100.00
Table 6-10 Conditions of road side drains
Covered drain Open drain Total
well-served n 9 0 9
% 100.00 0.00 100.00
less-served n 7 3 10
% 70.00 30.00 100.00
Total n 16 3 19
% 84.21 15.79 100.00
c. Solid Waste Management
c.1 Solid Waste Management
To the question, “Does your household receive collection service of any kind?”, 81.3% of the households answered “yes” in the well-served areas, while 73.1% answered “yes” in the less served areas.
Also, to the question, “How is the waste collected?”, approximately half of the respondents in both areas answered “It is placed beside the near-by road side for collection.” Then, “It is placed directly into the waste truck/ hand cart” follows as the next most popular way.
Table 6-11 Does your household receive collection service(s) of any kind?
Yes No Total
well-served n 39 9 48
% 81.25 18.75 100.00
less-served n 38 14 52
% 73.08 26.92 100.00
Total n 77 23 100
% 77.00 23.00 100.00

Data Collection Survey on Improvement Japan International Cooperation Agency of Environment in Varanasi City, Republic of India Kokusai Kogyo Co., Ltd. Sewerage Business Management Centre
6-7
Table 6-12 How is the waste collected?
Place it beside the
near-by road side for
collection
Place it to a designated
collection point
Place it onto an open pile of
waste in neighbor
Place it directory to waste truck/
hand cart
Handed it directly to
waste collectors
Total
well-served N 19 2 0 16 2 39
% 48.72 5.13 0.00 41.03 5.13 100.00
less-served N 20 0 3 14 1 38
% 52.63 0.00 7.89 36.84 2.63 100.00
Total N 39 2 3 30 3 77
% 50.65 2.60 3.90 38.96 3.90 100.00
By responding the question, “Who collects the waste?”, in the well-served areas, 61.5% of the respondents said “local government” collects it, while 35.9% said “individual collectors” collect it. In the less-served areas, both “local government (47.4%)” and “individual collectors (47.4%)” play equally important roles.
Table 6-13 Who collects the waste?
Local
government Private
company Resident's association
Individual collectors
Total
well-served n 24 1 0 14 39
% 61.54 2.56 0.00 35.90 100.00
less-served n 18 0 2 18 38
% 47.37 0.00 5.26 47.37 100.00
Total n 42 1 2 32 77
% 54.55 1.30 2.60 41.56 100.00
As for the collection frequency, the answers in the well-served areas are -listed in order of the number of responses- “daily (76.9%)”, “more than four times per week (15.4%)”, and “two to three times per week (7.7%)”. The frequency in the well-served areas does not fall below “two to three times per week”. In the less-served areas, the answers are -listed in order of the number of responses- “daily (63.2%)”, “two to three times per week (18.4%)”, “more than four times per week (15.8%)” and “once a week (2.6%)”. The frequency is lower in the less-served areas.
The satisfaction level for the collection service is rather high in general, although it is lower in the less-served areas. In the well-served areas, 41.0% of the respondents said “very satisfied” and another 41.0% of them said “reasonably satisfied”, while in the less-served areas, 34.2% of the respondents said “very satisfied”, and another 34.2% said “reasonably satisfied.”

Data Collection Survey on Improvement Japan International Cooperation Agency of Environment in Varanasi City, Republic of India Kokusai Kogyo Co., Ltd. Sewerage Business Management Centre
6-8
Table 6-14 How often is your wastes collected?
Daily
More than four times per
week
Two to three times per
week Once a week Total
well-served n 30 6 3 0 39
% 76.92 15.38 7.69 0.00 100.00
less-served n 24 6 7 1 38
% 63.16 15.79 18.42 2.63 100.00
Total n 54 12 10 1 77
% 70.13 15.58 12.99 1.30 100.00
Table 6-15 Are you satisfied with the collection service?
Very
satisfied Reasonably
satisfied Less than satisfied
Not satisfied at all
Total
well-served n 16 16 3 4 39
% 41.03 41.03 7.69 10.26 100.00
less-served n 13 13 5 7 38
% 34.21 34.21 13.16 18.42 100.00
Total n 29 29 8 11 77
% 37.66 37.66 10.39 14.29 100.00
c.2 Reduce, Reuse and Recycle (3Rs) Activities
By responding to the question, “Is there someone who comes around to collect or buy your reusable and recyclable materials?”, all the respondents, both in the well-served and less-served areas, said “yes”. Also, by answering a related question, “Do you take recyclable materials to shops for refund or sale?”, most of the respondents (more than 96%) in both areas said “no”. These results indicate that itinerant buyers of reusables and recyclables are very active in the VMC, and indeed they are main players for 3Rs activities.
On the contrary to the active 3Rs activities, composting is not at all popular. In fact, not a single household said that they have ever used kitchen and garden waste for composting, indicating zero uptake of the 3R concept with regards to biodegradables.
Table 6-16 Is there someone who comes around to collect or buy reusable or recyclable materials?
Yes Total
well-served n 48 48
% 100.00 100.00
less-served n 52 52
% 100.00 100.00
Total n 100 100
% 100.00 100.00

Data Collection Survey on Improvement Japan International Cooperation Agency of Environment in Varanasi City, Republic of India Kokusai Kogyo Co., Ltd. Sewerage Business Management Centre
6-9
Table 6-17 Do you take recyclable materials to shops for refund or sale?
Yes No Total
well-served n 1 47 48
% 2.08 97.92 100.00
less-served n 2 50 52
% 3.85 96.15 100.00
Total n 3 97 100
% 3.00 97.00 100.00
Table 6-18 Are you using kitchen waste and/or garden waste for compost?
No Total
well-served n 48 48
% 100.00 100.00
less-served n 52 52
% 100.00 100.00
Total n 100 100
% 100.00 100.00
d. Sanitation Facilities
d.1 Individual Household Latrines (IHHLs)
To the question, “Do you own a latrine?”, all the households in the well-served areas said “yes” and in fact all the family members, both male and female as well as children, use their (household) latrine to defecate in the well-served areas. In the less-served areas, 92.3% of the respondents said that they own household latrines, and the remaining 7.7% do not have individual household latrines at their home. Family members of the 7.7% of the households, whether male, female or children, have to resort to defecating in the open.
Table 6-19 Do you own a latrine?
Yes No Total
well-served n 48 0 48
% 100.00 0.00 100.00
less-served n 48 4 52
% 92.31 7.69 100.00
Total n 96 4 100
% 96.00 4.00 100.00

Data Collection Survey on Improvement Japan International Cooperation Agency of Environment in Varanasi City, Republic of India Kokusai Kogyo Co., Ltd. Sewerage Business Management Centre
6-10
Table 6-20 Where do you most frequently go to defecate?
Male members of household
Female members of household
Child members of household
Hou
seho
ld la
trin
e
Pub
lic t
oile
t
OD
- N
ear
hous
e
OD
- fie
ld/ f
ore
st
Hou
seho
ld la
trin
e
Pub
lic t
oile
t
OD
- N
ear
hous
e
OD
- fie
ld/ f
ore
st
No
child
ren
Hou
seho
ld la
trin
e
Pub
lic t
oile
t
OD
- N
ear
hous
e
OD
- fie
ld/ f
ore
st
well-served n 48 0 0 0 48 0 0 0 25 23 0 0 0
% 100.00 0.00 0.00 0.00 100.00 0.00 0.00 0.00 52.08 47.92 0.00 0.00 0.00
less-served n 47 1 1 3 47 1 1 3 19 27 1 3 2
% 90.38 1.92 1.92 5.77 90.38 1.92 1.92 5.77 36.54 51.92 1.92 5.77 3.85
Total n 95 1 1 3 95 1 1 3 44 50 1 3 2
% 95.00 1.00 1.00 3.00 95.00 1.00 1.00 3.00 44.00 50.00 1.00 3.00 2.00
As for the types of IHHLs, “latrine connected to piped sewer system (93.8%)” was the most popular in the well-served areas, followed by ”latrine connected to septic tank (6.3%)”. In the less-served areas, “latrine connected to piped sewer system (78.7%)” was also the most popular, though the figure is a bit less compared to the well-served areas. Next, “latrine connected to improved pit with slab (10.6%)”, “latrine connected to septic tank (6.4%)” and “latrine discharged to road, drain (4.3%) follows. It became clear that a small fraction of households discharged black water directly to road and drains in the less-served areas.
Table 6-21 Types of IHHLs
Latrine connected to piped sewer
system
Latrine connected to septic tank
Latrine connected to
improved pit with slab
Latrine discharged to
road, drain, etc Total
well-served n 45 3 0 0 48
% 93.75 6.25 0.00 0.00 100.00
less-served n 37 3 5 2 47
% 78.72 6.38 10.64 4.26 100.00
Total n 82 6 5 2 95
% 86.32 6.32 5.26 2.11 100.00
What compelled the households with IHHLs decide to build their own latrines was also surveyed, and “privacy/ security for female members” was listed as a prime reason both in the well-served and less-served areas. Then, “construction of new house” and “children become physically mature” follows.
Also, whether they have received assistance from any organizations to build their current latrine was asked, and 97.9% of the respondents in the well-served areas and 100% of them in the less-served areas said “no.” So, in the VMC areas, it is common to build IHHLs with one’s own financial resources.

Data Collection Survey on Improvement Japan International Cooperation Agency of Environment in Varanasi City, Republic of India Kokusai Kogyo Co., Ltd. Sewerage Business Management Centre
6-11
Table 6-22 What made you decide to build your latrine? (multiple answers)
subsidies
Someone told me I had to
Had enough money to build
Sick/old relatives
Privacy/ security for
female members
Pregnancy of female members
Children become physically mature
Construction of new
house
Event (wedding, funeral,
etc)
well-served 2 6 3 7 39 2 13 17 3
less-served 0 3 5 8 34 6 15 11 1
Total 2 9 8 15 73 8 28 28 4
Table 6-23 Did you receive assistance from any organizations to build your current latrine?
No Don't know Total
well-served n 47 1 48
% 97.92 2.08 100.00
less-served n 47 0 47
% 100.00 0.00 100.00
Total n 94 1 95
% 98.95 1.05 100.00
d.2 Sludge Disposal
To the question “Has your latrine pit ever been emptied?”, five out of 82 households who own latrines connected to a piped sewer system and one out of six households who own latrines connected to septic tanks answered yes. So in total, only six of the surveyed households have had their latrine pits emptied before35. To the households who have emptied their latrine pits, a further question “what do you do with the contents?” was asked, and the results are “dump in the river/ pond/ canal (1)”, “empty pit contents into new hole (2)” and “don’t know (3)”.
Table 6-24 Has your latrine pit ever been emptied?
Yes No
Not applicable
Total
Latrine connected to piped sewer systemn 5 50 27 82
% 6.10 60.98 32.93 100.00
Latrine connected to septic tank n 1 5 0 6
% 16.67 83.33 0.00 100.00
Latrine connected to improved pit with slab
n 0 5 0 5
% 0.00 100.00 0.00 100.00
Latrine- discharged to road, drain, etc n 0 0 2 2
35The table shows that only 29 households considered that they do not need to empty pits. This can be
interpreted that some households who connected to sewerage still use septic tanks and only supernatant liquid is discharged to sewerage. Also, it might be too difficult for some respondents to clearly understand the latrine types of their households and their treatment method of black water.

Data Collection Survey on Improvement Japan International Cooperation Agency of Environment in Varanasi City, Republic of India Kokusai Kogyo Co., Ltd. Sewerage Business Management Centre
6-12
Yes No
Not applicable
Total
% 0.00 0.00 100.00 100.00
Total n 6 60 29 95
% 6.32 63.16 30.53 100.00
Table 6-25 What do you do with the contents?
Dumped in the river/ pond/
canal
Empty pit contents into
new hole Don't know Total
well-served n 1 2 0 3
% 33.33 66.67 0.00 100.00
less-served n 0 0 3 3
% 0.00 0.00 100.00 100.00
Total n 1 2 3 6
% 16.67 33.33 50.00 100.00
Table 6-26 Have you ever hired someone to empty your pit?
Yes No Total
well-served n 2 1 3
% 66.67 33.33 100.00
less-served n 3 0 3
% 100.00 0.00 100.00
Total n 5 1 6
% 83.33 16.67 100.00
e. IEC Activities
Regarding sanitation education and communication, the answers to the question, “What hygiene advice have you heard before?” in the well-served areas are “drink safe water (30)”, “use a latrine (24)”, “wash hands with soap (23)” and “good food hygiene (13), in order of the numbers of responses. In the less-served areas, the answers in order of the numbers of responses are “use a latrine (32)”, “wash hands with soap (24)”, “drink safe water (23)” and “wash hands (14)”.
Table 6-27 What hygiene advice have you heard before? (multiple answers)
Non
e
Use
a la
trin
e
Drin
k sa
fe
wat
er
Sto
re w
ate
r sa
fely
Was
h ha
nds
Was
h ha
nds
with
soa
p
Goo
d fo
od
hygi
ene
Was
tew
ater
/st
agna
nt
wat
er
man
agem
ent
Saf
e di
spos
al o
f ba
bies
' fa
eces
well-served n 7 24 30 7 9 23 13 1 0
less-served n 6 32 23 3 14 24 9 0 1
Total n 13 56 53 10 23 47 22 1 1

Data Collection Survey on Improvement Japan International Cooperation Agency of Environment in Varanasi City, Republic of India Kokusai Kogyo Co., Ltd. Sewerage Business Management Centre
6-13
The survey also inquires into the information source of hygiene advice. The answers in the well-served areas are “billboard advertisement (45)”, “radio (15)”, “relative (14)”, “poster/ picture (12)” and “neighbour (11)” in order of the numbers of responses. In the less-served areas, the answers are “billboard advertisement (46)”, “radio (17)”, “neighbour (20)” and “NGO/ agency worker (10)”. The results revealed that while billboard advertisements and radio are popular in both areas, NGO/ agency is another important source for the less-served areas.
Table 6-28 Information source of hygiene advice (multiple answers)
Vill
age
chie
f
Nei
ghbo
ur
Gov
ernm
ent
of
ficer
AS
HA
(M
idw
ife)
AN
M
(Nur
se)
Ang
anw
adi
wor
ker
Rel
ativ
e
Sch
ools
/ T
each
ers
Rel
igio
us
lead
ers
Lead
ers
of
cast
e-ba
sed
asso
ciat
ion
well-served n 4 11 8 0 0 7 14 6 0 1
less-served n 3 20 5 2 1 9 5 7 1 0
Total n 7 31 13 2 1 16 19 13 1 1
Uni
on
lead
ers
NG
O/
Age
ncy
wor
ker
Rad
io
Pos
ter/
P
ictu
re
Bill
boar
d ad
vert
isem
ent
Tel
evi
sio
n
adve
rtis
eme
nt
Com
mun
ity
mee
ting
Hea
lth
Cen
tre/
D
ispe
nsar
y
Ang
anw
adi
well-served n 4 6 15 12 45 1 6 0 1
less-served n 4 10 17 7 46 0 3 0 0
Total n 8 16 32 19 91 1 9 0 1
6.1.3 Ram Nagar Municipal Board (RNMB)
In the RNMB, a medium-sized urban local body, 38 households in the wards located in the inner parts and 12 households in the wards located in the outer parts were interviewed, totaling 50 households. The detailed results are shown below.
a. Basic Household Profiles
The average number of household members is 5.82 persons in the inner areas and 5.58 persons in the outer areas. The gender difference of household members was larger in the outer areas, where male household members outnumbered female household members by 0.42 persons on average. As for household economics, the difference of household annual incomes in the inner areas and in the outer areas is negligible, and the average amount of the 50 households surveyed is Rs 136,740. Religiously Hindu is dominant, while the majority of the households belong to Other Backward Classes with regard to socio-economic status.

Data Collection Survey on Improvement Japan International Cooperation Agency of Environment in Varanasi City, Republic of India Kokusai Kogyo Co., Ltd. Sewerage Business Management Centre
6-14
Table 6-29 Household composition (persons) and household annual income (avg.)
Wards
Number of household members
Male membersFemale
members
Household Annual Income
(Rs)
Inner Number 38 38 38 38
Mean 5.82 2.97 2.84 135,526.30
Min 3 1 1 45,000
Max 11 7 6 400,000
Outer Number 12 12 12 12
Mean 5.58 3.00 2.58 140,583.30
Min 3 2 1 45,000
Max 9 6 6 520,000
Total Number 50 50 50 50
Mean 5.76 2.98 2.78 136,740.00
Min 3 1 1 45,000
Max 11 7 6 520,000
Table 6-30 Religion and social groups
Religion Social Group Total
Wards Hindu Muslim General Caste
Other Backward Classes
Scheduled Caste
Inner n 37 1 9 28 1 38
% 97.37 2.63 23.68 73.68 2.63 100.00
Outer n 12 0 3 3 6 12
% 100.00 0.00 25.00 25.00 50.00 100.00
Total n 49 1 12 31 7 50
% 98.00 2.00 24.00 62.00 14.00 100.00
Before asking sector-specific questions such as questions regarding water supply and solid waste management, the interviewees were asked rather general questions regarding their concerns. To answer the question “Which of the following do you think needs urgent improvement? Rank the top five items.”, the interviewees gave five points (5) for the items they think needs the most urgent improvement and give one point (1) for the item they think needs the least urgent improvement. “Electricity/Cooking fuel (2.58 points)”, “Solid Waste (2.58 points)”, and “Drainage/Liquid Waste (1.74 points)” are the top three items in the inner areas, while, “Drainage /Liquid Waste (2.67 points)”, “Drinking Water (2.58 points)”and “Solid Waste (2.08 points) are the top three items in the outer areas.
Table 6-31 Items needed for urgent improvements
War
ds
Drin
king
wa
ter
Acc
ess
roa
d/
Tra
nsp
orta
tion
Dra
ina
ge/ L
iqu
id
wa
ste
So
lid w
ast
e
La
trin
e fa
cilit
ies
Ed
uca
tion
fa
cilit
ies
He
alth
faci
litie
s
Ele
ctric
ity/
cook
ing
fue
l
Em
plo
yme
nt
op
port
uniti
es
Cri
me
/ saf
ety
Inner 1.45 1.21 1.74 2.58 0.84 1.00 0.63 2.58 1.71 0.47
Outer 2.58 0.92 2.67 2.08 1.75 1.33 0.33 1.83 1.42 0.00
Total 1.72 1.14 1.96 2.46 1.06 1.08 0.56 2.40 1.64 0.36
(Note) The respondent ranked five items, giving five (5) points for the item needed most urgent improvement to one (1) point for the item needed least urgent improvement. Then the average points were calculated for each item.

Data Collection Survey on Improvement Japan International Cooperation Agency of Environment in Varanasi City, Republic of India Kokusai Kogyo Co., Ltd. Sewerage Business Management Centre
6-15
b. Water Supply and Wastewater Management
b.1 Water Supply
As for the main source of drinking water, in the RNMB, 46.0% of the households use “piped water into dwelling” and 40.0% of them use “piped water into yard/plot”. In total, more than 80% of the households use the piped water. Approximately 40% of the households in the outer areas use public water sources, though. The survey also questions the main water source for domestic purposes. It became clear that the main sources for both drinking and domestic purposes were exactly the same in the case of the RNMB.
Table 6-32 Main source of drinking water
Piped water into dwelling
Piped water into yard/ plot
Public tab Tubewell/ borehole
Total
Inner n 19 18 0 1 38
% 50.00 47.37 0.00 2.63 100.00
Outer n 4 2 4 2 12
% 33.33 16.67 33.33 16.67 100.00
Total n 23 20 4 3 50
% 46.00 40.00 8.00 6.00 100.00
As for the supply frequency of drinking water, many households using piped water (approximately 80% of the total households) answered “fixed timing daily”, while some, although only a fraction of the entire households, answered “fixed timing alternate day”. Three households, those who answered “round the clock”, are all deep well users.
Table 6-33 Supply frequency of drinking water
Round the clock Fixed timing daily
Fixed timing alternate day
Total
Inner n 1 33 4 38
% 2.63 86.84 10.53 100.00
Outer n 2 7 3 12
% 16.67 58.33 25.00 100.00
Total n 3 40 7 50
% 6.00 80.00 14.00 100.00
Water use for different purposes was also obtained as seen in the table below. As for annual water charges for drinking and other domestic purposes, the households in the inner areas paid Rs 786.21 on average, while the households in the outer areas paid only Rs 374.63 on average. The households in the inner areas use more piped water and therefore paid more while households concentrated in the outer areas used public water sources and deep wells and therefore paid less. In addition, it is worth noting here that the water charges for the piped water in the RNMB is fixed much less than that in the VMC, and thus the average amount paid by the respondents in the RNMB is much less, nearly half of the amount paid by the respondents in the VMC.

Data Collection Survey on Improvement Japan International Cooperation Agency of Environment in Varanasi City, Republic of India Kokusai Kogyo Co., Ltd. Sewerage Business Management Centre
6-16
Table 6-34 Water use for drinking and other domestic purposes (avg. litters per day)
For drinking For bathing
For washing cloths
For toilet flush
For cleaning utensils
For gardening
For others
Inner 23.43 128.16 59.08 50.58 35.84 2.18 12.32
Outer 24.42 135.00 52.50 22.08 31.50 4.17 13.50
Total 23.67 129.80 57.50 43.74 34.80 2.66 12.60
Table 6-35 Water charges for drinking and other domestic purposes (Rs./year/household)
For drinking purpose
For other domestic purpose
For both
Inner mean 190.66 595.55 786.21
min 20 75 -
max 1200 2700 -
Outer mean 90.88 283.75 374.63
min 20 40 -
max 300 1500 -
Total mean 173.30 541.33 714.63
min 20 40 -
max 1200 2700 -
b.2 Wastewater Management
Approximately 80% of the households in the inner areas discharge wastewater to a “central sewerage system” while less than 20% of the households in the outer areas do likewise. In the inner areas, the remaining households discharge wastewater to “road side drains”, while in the outer areas, the remaining households discharge not only to “road side drains” but also to either “nearby open space” or “nearby water bodies”.
In addition, the households that discharge wastewater to roadside drains were asked about the road side drain conditions. In the inner areas, all of them confirmed that the road side drains were covered, while 50% of the households in the outer areas said that the road side drain was uncovered.
Table 6-36 Wastewater management
Central sewerage
system Road side drain
Nearby open space
Nearby water bodies
Total
Inner n 31 7 0 0 38
% 81.58 18.42 0.00 0.00 100.00
Outer n 2 4 4 2 12
% 16.67 33.33 33.33 16.67 100.00
Total n 33 11 4 2 50
% 66.00 22.00 8.00 4.00 100.00

Data Collection Survey on Improvement Japan International Cooperation Agency of Environment in Varanasi City, Republic of India Kokusai Kogyo Co., Ltd. Sewerage Business Management Centre
6-17
Table 6-37 Conditions of road side drains
Covered drain Open drain Total
Inner n 7 0 7
% 100.00 0.00 100.00
Outer n 2 2 4
% 50.00 50.00 100.00
Total n 9 2 11
% 81.82 18.18 100.00
c. Solid Waste Management
c.1 Solid Waste Management
To the question, “Does your household receive collection service(s) of any kind?”, 16 (42.11%) households in the inner areas answered “yes”, while only one household answered “yes” in the outer areas. Also, from the question, “Who collects the waste?”, it became apparent that “individual collectors” are very active in supplementing the limited collection service by the RNMB. In other words, unlike the VMC, the RNMB, although it is an urban local body, does not provide collection services for all the municipal areas, and therefore the public uses the services provided by the individual collectors depending on their needs.
Table 6-38 Does your household receive collection service(s) of any kind?
Yes No Total
Inner n 16 22 38
% 42.11 57.89 100.00
Outer n 1 11 12
% 8.33 91.67 100.00
Total n 17 33 50
% 34.00 66.00 100.00
Table 6-39 How is the waste collected?
Place it beside the near-by road
side for collection Total
Inner n 16 16
% 100.00 100.00
Outer n 1 1
% 100.00 100.00
Total n 17 17
% 100.00 100.00

Data Collection Survey on Improvement Japan International Cooperation Agency of Environment in Varanasi City, Republic of India Kokusai Kogyo Co., Ltd. Sewerage Business Management Centre
6-18
Table 6-40 Who collects the waste?
Local
government Individual collectors
Total
Inner n 4 12 16
% 25.00 75.00 100.00
Outer n 0 1 1
% 0.00 100.00 100.00
Total n 4 13 17
% 23.53 76.47 100.00
The demand for collection services among 33 households who do not receive any collection services was also inquired about. Twenty six (26) out of 33 households said that they would like to receive the service only if it is free and seven (7) of them said that they would like to receive it even if they have to pay. Further, the amount they are willing to pay for the collection service was asked to those seven households. On average, they are willing to pay Rs 35 per month for the collection service.
Table 6-41 Would you like to receive a collection service?
Yes, if it is free
Yes, even we need to pay
Total
Inner n 18 4 22
% 81.82 18.18 100.00
Outer n 8 3 11
% 72.73 27.27 100.00
Total n 26 7 33
% 78.79 21.21 100.00
c.2 Reduce, Reuse and Recycle (3Rs) Activities
To the question, “Is there someone who comes around to collect or buy your reusable and recyclable materials?”, all the respondents, both in the inner and outer areas said “yes”. Also, by answering a related question, “Do you take recyclable materials to shops for refund or sale?”, most of the respondents (more than 86%) said “no”. These results indicate that itinerant buyers of reusables and recyclables are very active in the RNMB as well, and indeed they are main players for 3Rs activities.
On the contrary to the active 3R activities, composting is not at all popular in the RNMB as in the case with the VMC. In fact, not a single household said that they has ever used kitchen or garden waste for composting, indicating zero 3R activities for biodegradables.

Data Collection Survey on Improvement Japan International Cooperation Agency of Environment in Varanasi City, Republic of India Kokusai Kogyo Co., Ltd. Sewerage Business Management Centre
6-19
Table 6-42 Is there someone who comes around to collect or buy reusable or recyclable materials?
Yes Total
Inner n 38 38
% 100.00 100.00
Outer n 12 12
% 100.00 100.00
Total n 50 50
% 100.00 100.00
Table 6-43 Do you take recyclable materials to shops for refund?
Yes No
Don't know
Total
Inner n 5 33 0 38
% 13.16 86.84 0.00 100.00
Outer n 1 10 1 12
% 8.33 83.33 8.33 100.00
Total n 6 43 1 50
% 12.00 86.00 2.00 100.00
Table 6-44 Are you using kitchen waste and/or garden wastes for compost?
No Total
Inner n 38 38
% 100.00 100.00
Outer n 12 12
% 100.00 100.00
Total n 50 50
% 100.00 100.00
d. Sanitation Facilities
d.1 Individual Household Latrines (IHHLs)
As for the IHHLs, more than 90% of the households in the inner areas have their own latrines at home, while only 30% of the households in the outer areas have them at home. This result reveals that there is a certain pocket even within the urban local bodies where lacks IHHLs. As seen in the table below, family members of the households that lack access to IHHLs have to resort to defecate in open, and they raised the issues of construction costs as a major reason for not-having IHHLs.

Data Collection Survey on Improvement Japan International Cooperation Agency of Environment in Varanasi City, Republic of India Kokusai Kogyo Co., Ltd. Sewerage Business Management Centre
6-20
Table 6-45 Do you own a latrine?
Yes No Total
Inner n 36 2 38
% 94.74 5.26 100.00
Outer n 4 8 12
% 33.33 66.67 100.00
Total n 40 10 50
% 80.00 20.00 100.00
Table 6-46 Where do you most frequently go to defecate?
Male members of
household Female members of
household Child members of household
IHHL
OD- Near
house
OD- field/ forest
IHHLOD- Near
house
OD- field/ forest
No child
IHHL OD- Near
house
OD- field/ forest
Inner n 36 0 2 36 0 2 12 23 1 2
% 94.74 0.00 5.26 94.74 0.00 5.26 31.58 60.53 2.63 5.26
Outer n 4 4 4 4 4 4 3 1 5 3
% 33.33 33.33 33.33 33.33 33.33 33.33 25.00 8.33 41.67 25.00
Total n 40 4 6 40 4 6 15 24 6 5
% 80.00 8.00 12.00 80.00 8.00 12.00 30.00 48.00 12.00 10.00
Table 6-47 Why don’t you own a latrine? (multiple answers)
Too expensive/ don't have enough
money
The government has not given us a
subsidy yet
Don’t' have enough space
Other priorities
Inner 2 0 1 0
Outer 6 1 2 1
Total 8 1 3 1
As seen in the table below, “latrine connected to a piped sewer system (67.50%)” was the most popular type of latrine in the RNMB. Most of the remaining households use “latrine connected to septic tank”, while a few have “latrine connected to improved pit with slab”. Also, a few other households, though only a small fraction, discharged black water directly to roads and drains.

Data Collection Survey on Improvement Japan International Cooperation Agency of Environment in Varanasi City, Republic of India Kokusai Kogyo Co., Ltd. Sewerage Business Management Centre
6-21
Table 6-48 Types of IHHLs
Latrine connected to piped sewer
system
Latrine connected to septic tank
Latrine connected to
improved pit with slab
Latrine- discharged to
road, drain, etc Total
Inner n 25 6 3 2 36
% 69.44 16.67 8.33 5.56 100.00
Outer n 2 2 0 0 4
% 50.00 50.00 0.00 0.00 100.00
Total n 27 8 3 2 40
% 67.50 20.00 7.50 5.00 100.00
What made the households with IHHLs decide to build their own latrines was also surveyed, and “privacy/ security for female members” was listed as a prime reason as was the case of the VMC. Next, “children become physically mature” and “construction of new house” follows.
By reflecting on the fact that the centrally-sponsored programs to support construction of IHHLs, i.e. Total Sanitation Champaign and Nirmal Bharat Abiyan, had focused only on the rural areas, no households in the RNMB have ever received any assistance from the governments and NGOs for latrine construction.
Table 6-49 What made you decide to build your latrine? (multiple answers)
Som
eone
to
ld m
e I
had
to
Had
eno
ugh
mon
ey to
bu
ild
Sic
k/ol
d re
lativ
es
Priv
acy
/ se
curit
y fo
r fe
mal
e m
embe
rs
Pre
gnan
cy
of fe
mal
e m
embe
rs
Chi
ldre
n be
com
e p
hys
ica
lly
mat
ure
So
cia
l pr
essu
re
Con
stru
ctio
n of
new
ho
use
Nei
ghbo
ur
got o
ne
Eve
nt
(wed
ding
, fu
nera
l, et
c)
Had
vis
itors
Inner 2 5 8 23 6 16 1 11 1 2 1
Outer 0 0 1 2 0 1 0 2 0 0 0
Total 2 5 9 25 6 17 1 13 1 2 1
Table 6-50 Did you receive assistance from any organizations to build your current latrine?
No Don't know Total
Inner n 36 0 36
% 100.00 0.00 100.00
Outer n 3 1 4
% 75.00 25.00 100.00
Total n 39 1 40
% 97.50 2.50 100.00
d.2 Sludge Disposal
To the question “Has your latrine pit ever been emptied?”, not a single household has ever emptied their latrine pits. As seen in the table shown below, despite the fact that 27 households use latrines connected to a piped sewer system, eight households use latrines connected to septic

Data Collection Survey on Improvement Japan International Cooperation Agency of Environment in Varanasi City, Republic of India Kokusai Kogyo Co., Ltd. Sewerage Business Management Centre
6-22
tanks and only three households use latrines connected to an improved pit with slab and only nine households considered the need to empty pits as seen in the table below. This can be interpreted that some households who are connected to sewerage systems still use septic tanks or pit latrines and only supernatant liquid is discharged to sewerage.
Table 6-51 Has your latrine pit ever been emptied?
No Not applicable Total
Inner n 29 7 36
% 80.56 19.44 100.00
Outer n 2 2 4
% 50.00 50.00 100.00
Total n 31 9 40
% 77.50 22.50 100.00
e. IEC Activities
The survey also enquires about sanitation education and communication. The answers to the question, “What hygiene advice have you heard before?” are “Drink safe water (28)”, “Use a latrine (24)”, “Wash hands with soap (22)” and “Good food hygiene (12) in order of the number of responses.
Table 6-52 What hygiene advice have you heard before? (multiple answers)
Non
e
Use
a la
trin
e
Drin
k sa
fe
wat
er
Sto
re w
ate
r sa
fely
Was
h ha
nds
Was
h ha
nds
with
soa
p
Goo
d fo
od
hygi
ene
Was
tew
ater
/st
agna
nt
wat
er
man
agem
ent
Inner n 6 17 19 6 4 17 11 0
Outer n 2 7 9 2 0 5 1 1
Total n 8 24 28 8 4 22 12 1
The survey further inquires about the information source of hygiene advice. The answers are “Billboard advertisement (40)”, “Anganwadi worker (20)” and “Radio (12)” in order of the numbers of responses. While billboard advertisement and radio are popular in the RNMB as in the VMC, Anganwadi workers are another important source of information for the RNMB.
Table 6-53 Information source of hygiene advice (multiple answers)
Vill
age
chie
f/
Pan
chay
at
mem
bers
Nei
ghbo
ur
Gov
ernm
ent
of
ficer
AS
HA
(M
idw
ife)
AN
M
(Nur
se)
Ang
anw
adi
wor
ker
Rel
ativ
e
Sch
ools
/ T
each
ers
Rel
igio
us
lead
ers
Lead
ers
of
cast
e-ba
sed
asso
ciat
ion
Inner n 0 5 6 1 2 14 2 6 0 0
Outer n 1 2 1 1 3 6 2 0 0 0
Total n 1 7 7 2 5 20 4 6 0 0

Data Collection Survey on Improvement Japan International Cooperation Agency of Environment in Varanasi City, Republic of India Kokusai Kogyo Co., Ltd. Sewerage Business Management Centre
6-23
Uni
on
lead
ers
NG
O/
Age
ncy
wor
ker
Rad
io
Pos
ter/
P
ictu
re
Bill
boar
d ad
vert
isem
ent
Tel
evi
sio
n
adve
rtis
eme
nt
Com
mun
ity
mee
ting
Hea
lth
Cen
tre/
D
ispe
nsar
y
Ang
anw
adi
Inner n 6 6 9 2 31 0 7 1 6
Outer n 1 1 3 0 9 0 0 0 0
Total n 7 7 12 2 40 0 7 1 6
6.1.4 Gram Panchayats
One hundred fifty households in total, fifty each from the three urbanized GPs surrounding the VMC were interviewed. They are Suzabad and Shirgoverdhanpur, located along the Ganga and Shivdaspur, the block headquarter, located a bit far from the River bank. All belong to the Kashi Vidya Peeth Block. The detailed results are shown below.
a. Basic Household Profiles
The average number of household members of each GP varies from 5.88 persons in Shirgoverdhanpur to 6.56 persons in Shivdaspur. The average number of household members for the 150 households is 6.26, indicating the tendency for the average number of household members in rural local bodies to be larger than urban local bodies. Gender differences of household members in the three GPs, where male members outnumber female members by 0.50 persons on average, is wider than the average of the VMC and the RNMB.
As for household economics, the difference of household annual incomes also varies from Rs 80,780 in Suzabad to Rs 147,620 in Shivdaspur, the block headquarter. The average annual income of the three GPs is Rs 110,760, indicating the tendency for annual household incomes to be less in rural local bodies than urban local bodies. Religiously, Hindu is dominant. Regarding socio-economic status, the majority of the households belong to Other Backward Classes.
Table 6-54 Household composition (persons) and household annual income (avg.)
GP
Number of household members
Male membersFemale
members
Household Annual Income
(Rs)
Suzabad Number 50 50 50 50
Mean 6.34 3.54 2.80 80,780
Min 1 0 1 40,000
Max 13 7 6 160,000
Shirgoverdhanpur Number 50 50 50 50
Mean 5.88 3.04 2.84 103,880
Min 2 1 1 40,000
Max 17 8 9 300,000
Shivdaspur Number 50 50 50 50
Mean 6.56 3.56 3.00 147,620
Min 2 1 1 40,000
Max 18 9 9 500,000
Total Number 150 150 150 150
Mean 6.26 3.38 2.88 110,760
Min 1 0 1 40,000
Max 18 9 9 500,000

Data Collection Survey on Improvement Japan International Cooperation Agency of Environment in Varanasi City, Republic of India Kokusai Kogyo Co., Ltd. Sewerage Business Management Centre
6-24
Table 6-55 Religion and social groups
Religion Social Group Total
Hindu Muslim
General Caste
Other Backward Classes
Scheduled Caste
Suzabad n 45 5 3 41 6 50
% 90 10 6 82 12 100
Shirgoverdhanpur n 50 0 4 36 10 50
% 100 0 8 72 20 100
Shivdaspur n 50 0 21 17 12 50
% 100 0 42 34 24 100
Total n 145 5 28 94 28 150
% 96.67 3.33 18.67 62.67 18.67 100
Before asking sector-specific questions such as questions regarding water supply and solid waste management, the interviewees were asked rather general questions regarding their concerns. To answer the question “Which of the followings do you think needs urgent improvement? Rank the top five items.”, the interviewees give five points (5) for the items they think need the most urgent improvement and give one point (1) for the item they think needs the least urgent improvement. In the GPs, “Drainage/Liquid Waste (2.61 points)” “Solid Waste (2.21 points)” and “Electricity/Cooking fuel (1.89 points)” are the top three items. The results reveal that the respondents in GPs, where there is a lack of basic public services, concerns were raised over the basic sanitation services.
Table 6-56 Items needed for urgent improvement
Drin
king
wat
er
Acc
ess
road
/ T
rans
port
atio
n
Dra
inag
e/
Liqu
id w
aste
Sol
id w
aste
Latr
ine
faci
litie
s
Edu
catio
n fa
cilit
ies
Hea
lth fa
cilit
ies
Ele
ctric
ity/
cook
ing
fuel
Em
ploy
men
t op
port
uniti
es
Crim
e/ s
afet
y
Fun
ctio
n of
lo
cal
gove
rnm
ent
Suzabad 1.60 2.68 2.30 1.60 1.52 0.98 0.88 1.52 1.64 0.22 0.00Shirgoverdhan
pur 1.50 1.40 2.74 2.30 1.36 1.20 0.40 1.30 1.86 0.40 0.10
Shivdaspur 1.84 1.56 2.80 2.72 0.50 0.40 0.32 2.86 0.82 0.12 0.04
Total 1.65 1.88 2.61 2.21 1.13 0.86 0.53 1.89 1.44 0.25 0.05
(Note) The respondent ranked five items, giving five (5) points for the item needed most urgent improvement to one (1) point for the item needed least urgent improvement. Then the average points were calculated for each item.
b. Water Supply and Wastewater Management
b.1 Water Supply
As for the main source of drinking water, in the three GPs, 38.67% of the households use “piped water into dwelling” and 36.0 % of them use “piped water into yard/plot”. In total, approximately 75% of the households use the piped water. In addition, there are some households that use tubewells and wells for drinking. The survey also asks about the main water source for domestic purposes. It became clear that the main sources for both drinking and domestic purposes were similar, though some households use public taps and wells slightly more often for domestic purposes.

Data Collection Survey on Improvement Japan International Cooperation Agency of Environment in Varanasi City, Republic of India Kokusai Kogyo Co., Ltd. Sewerage Business Management Centre
6-25
Table 6-57 Main source of drinking water
Pip
ed w
ater
in
to d
wel
ling
Pip
ed w
ater
in
to y
ard/
pl
ot
Pub
lic ta
b
Tub
ewel
l/ bo
reho
le
Pro
tect
ed
wel
l
Unp
rote
cted
w
ell
Pip
ed w
ater
fr
om
neig
hbor
Tot
al
Suzabad n 18 27 2 3 0 0 0 50
% 36.00 54.00 4.00 6.00 0.00 0.00 0.00 100.00
Shirgoverdhanpur n 7 18 1 15 2 6 1 50
% 14.00 36.00 2.00 30.00 4.00 12.00 2.00 100.00
Shivdaspur n 33 9 0 5 0 3 0 50
% 66.00 18.00 0.00 10.00 0.00 6.00 0.00 100.00
Total n 58 54 3 23 2 9 1 150
% 38.67 36.00 2.00 15.33 1.33 6.00 0.67 100.00
As for the supply frequency of drinking water, many households using piped water (approximately 80% of the total households) answer “fixed timing daily”, while some answered either “fixed timing alternate day” or “erratic”. In the GPs, 26% of the households who are supplied water “round the clock” are mainly public tap and well users.
Table 6-58 Supply frequency of drinking water
Round the
clock Fixed timing
daily Fixed timing alternate day
Erratic Total
Suzabad n 9 21 6 14 50
% 18.00 42.00 12.00 28.00 100.00
Shirgoverdhanpur n 23 26 1 0 50
% 46.00 52.00 2.00 0.00 100.00
Shivdaspur n 7 40 1 2 50
% 14.00 80.00 2.00 4.00 100.00
Total n 39 87 8 16 150
% 26.00 58.00 5.33 10.67 100.00
Water use for different purposes was also obtained as seen in the table below. As for annual water charges for drinking and other domestic purposes, it varies from Rs 795.35 for Shivdaspur to Rs 1,127.60 for Suzabad. Due to limited capacity of the GPs, Jal Nigam is in charge of collecting water charges in the GPs. The table below shows that the respondents pay water charges which are comparable to the VMC.
Table 6-59 Water use for drinking and other domestic purposes (avg. litters per day)
For
drinking For
bathingFor washing
cloths For toilet
flush For cleaning
utensils For
gardening For
others
Suzabad 27.79 126.52 59.84 38.56 25.44 2.72 17.16
Shirgoverdhanpur 27.24 126.16 51.74 42.32 29.62 0.70 11.26
Shivdaspur 26.95 149.02 65.66 60.24 36.42 1.88 11.46
Total 27.34 133.90 59.08 47.04 30.49 1.77 13.29

Data Collection Survey on Improvement Japan International Cooperation Agency of Environment in Varanasi City, Republic of India Kokusai Kogyo Co., Ltd. Sewerage Business Management Centre
6-26
Table 6-60 Water charges for drinking and other domestic purposes (Rs./year/household)
For drinking purpose
For other domestic purpose
For both
Suzabad mean 413.39 714.21 1,127.60
min 0 0 -
max 1,800 2,400 -
Shirgoverdhanpur mean 281.45 696.86 978.31
min 0 0 0
max 1,440 3,000 3,000
Shivdaspur mean 293.71 501.63 795.35
min 0 0 -
max 800 1,440 -
Total mean 329.52 637.04 966.56
min 0 0 -
max 1,800 3,000 -
b.2 Wastewater Management
In the three GPs, 42% of the households discharge wastewater to a “central sewerage system” while 28.67% of the households discharge it to “road side drains” and the remaining do so to “nearby open space” or “nearby water bodies”. It is important to understand here that what people mean by “sewerage system” is an “underground drain for wastewater” and they do not necessarily mean a sewer which is connected to the sewerage treatment plants. Wastewater generated in the GPs is ultimately gathered into the lowland lakes and ponds and these water bodies are turned into natural oxidation ponds.
Table 6-61 Wastewater management
Central sewerage
system
Road side drain
Nearby open space
Nearby water bodies
Total
Suzabad n 14 24 5 7 50
% 28.00 48.00 10.00 14.00 100.00
Shirgoverdhanpur n 24 12 9 5 50
% 48.00 24.00 18.00 10.00 100.00
Shivdaspur n 25 7 18 0 50
% 50.00 14.00 36.00 0.00 100.00
Total n 63 43 32 12 150
% 42.00 28.67 21.33 8.00 100.00
c. Solid Waste Management
c.1 Solid Waste Management
To the question, “Does your household receive collection service(s) of any kind?”, 143 households, which are more than 95% of all the households in the three GPs answered “no”.

Data Collection Survey on Improvement Japan International Cooperation Agency of Environment in Varanasi City, Republic of India Kokusai Kogyo Co., Ltd. Sewerage Business Management Centre
6-27
Basically, waste collection service does not exist in the GPs in Uttar Pradesh36.
Table 6-62 Does your household receive collection service(s) of any kind?
Yes No Total
Suzabad n 7 43 50
% 14.00 86.00 100.00
Shirgoverdhanpur n 0 50 50
% 0.00 100.00 100.00
Shivdaspur n 0 50 50
% 0.00 100.00 100.00
Total n 7 143 150
% 4.67 95.33 100.00
The demand for collection services among the 143 households who do not receive any collection services was also inquired about. One hundred three (103) out of 143 households said that they would like to receive the service only if it is free, while 33 of them said that they would like to receive it even if they have to pay. Further, the willingness to pay for the collection service was asked to those 33 households. On average, they are willing to pay Rs 44.39 per month for the collection service.
Table 6-63 Would you like to receive a collection service?
Yes, if it is
free.
Yes, even we need to
pay No Don't know Total
Suzabad n 32 5 3 3 43
% 74.42 11.63 6.98 6.98 100.00
Shirgoverdhanpur n 36 13 0 1 50
% 72.00 26.00 0.00 2.00 100.00
Shivdaspur n 35 15 0 0 50
% 70.00 30.00 0.00 0.00 100.00
Total n 103 33 3 4 143
% 72.03 23.08 2.10 2.80 100.00
c.2 Reduce, Reuse and Recycle (3Rs) Activities
To the question, “Is there someone who comes around to collect or buy your reusable and recyclable materials?”, 142 out of 150 households said “yes”. Also, to a related question, “Do you take recyclable materials to shops for refund or sale?”, 132 households out of 150 said “no”. These results indicate that itinerant buyers of reusables and recyclables are very active even in the GPs just like in the VMC and the RNMB. 3R activities by itinerant buyers based on market principles function well irrespective of people’s environmental consciousness in this region. Contrary to the active 3R activities by itinerant buyers, composting is also not at all popular in the
36 According to the regulations issued by the state government of Uttar Pradesh, a sweeper per revenue village will be assigned. In the surveyed 3GPs, one or two sweepers are assigned and they are engaged in sweeping the central parts of GPs.

Data Collection Survey on Improvement Japan International Cooperation Agency of Environment in Varanasi City, Republic of India Kokusai Kogyo Co., Ltd. Sewerage Business Management Centre
6-28
GPs. In fact, not a single household said that they have ever used kitchen or garden waste for composting, indicating zero 3R activities for biodegradables.
Table 6-64 Is there someone who comes around to collect or buy reusable or recyclable materials?
Yes No
Don't know
Total
Suzabad n 43 6 1 50
% 86.00 12.00 2.00 100.00
Shirgoverdhanpur n 49 1 0 50
% 98.00 2.00 0.00 100.00
Shivdaspur n 50 0 0 50
% 100.00 0.00 0.00 100.00
Total n 142 7 1 150
% 94.67 4.67 0.67 100.00
Table 6-65 Do you take recyclable materials to shops for refund or sale?
Yes No
Don't know
Total
Suzabad n 7 41 2 50
% 14.00 82.00 4.00 100.00
Shirgoverdhanpur n 3 47 0 50
% 6.00 94.00 0.00 100.00
Shivdaspur n 6 44 0 50
% 12.00 88.00 0.00 100.00
Total n 16 132 2 150
% 10.67 88.00 1.33 100.00
Table 6-66 Are you using kitchen waste and/or garden waste for compost?
Yes No Total
Suzabad n 4 46 50
% 8.00 92.00 100.00
Shirgoverdhanpur n 1 49 50
% 2.00 98.00 100.00
Shivdaspur n 0 50 50
% 0.00 100.00 100.00
Total n 5 145 150
% 3.33 96.67 100.00
d. Sanitation Facilities
d.1 Individual Household Latrines (IHHLs)
Thirty-seven households (74%) in Suzabad, 41 households (82%) in Shigoverdhanpur and 46 households (92%) in Shivdaspur have their own latrines at home. These figures are strikingly

Data Collection Survey on Improvement Japan International Cooperation Agency of Environment in Varanasi City, Republic of India Kokusai Kogyo Co., Ltd. Sewerage Business Management Centre
6-29
higher than 27%, the average of GPs in the Varanasi District identified in the 2011 Census.
As seen in the table below, family members of the households that lack access to IHHLs have to resort to defecating in open, and they raised the issue of construction costs as a major reason for not-having IHHLs.
Table 6-67 Do you own a latrine?
Yes No Total
Suzabad n 37 13 50
% 74.00 26.00 100.00
Shirgoverdhanpur n 41 9 50
% 82.00 18.00 100.00
Shivdaspur n 46 4 50
% 92.00 8.00 100.00
Total n 124 26 150
% 82.67 17.33 100.00
Table 6-68 Where do you most frequently go to defecate?
Male members of household
Female members of household
Child members of household
Hou
seho
ld
latr
ine
Pub
lic t
oile
t
OD
- N
ear
hous
e
OD
- fie
ld/
fore
st
Hou
seho
ld
latr
ine
Pub
lic t
oile
t
OD
- N
ear
hous
e
OD
- fie
ld/
fore
st
No
child
ren
Hou
seho
ld
latr
ine
Pub
lic t
oile
t
OD
- N
ear
hous
e
OD
- fie
ld/
fore
st
Suzabad n 36 1 4 8 37 1 4 8 12 30 1 2 5
% 73.47 2.04 8.16 16.33 74.00 2.00 8.00 16.00 24.00 60.00 2.00 4.00 10.00
Shirgover n 41 1 3 5 41 1 3 5 16 25 1 4 4
dhanpur % 82.00 2.00 6.00 10.00 82.00 2.00 6.00 10.00 32.00 50.00 2.00 8.00 8.00
Shivdaspur n 44 0 2 4 45 0 1 4 18 29 0 1 2
% 88.00 0.00 4.00 8.00 90.00 0.00 2.00 8.00 36.00 58.00 0.00 2.00 4.00
Total n 121 2 9 17 123 2 8 17 46 84 2 7 11
% 81.21 1.34 6.04 11.41 82.00 1.33 5.33 11.33 30.67 56.00 1.33 4.67 7.33
Table 6-69 Why don’t you own a latrine? (multiple answer)
Too
exp
ensi
ve/
don'
t hav
e en
ough
mon
ey
The
gov
ern
men
t ha
s no
t giv
en u
s a
subs
idy
yet
No
entit
lem
ent t
o
the
land
Don
’t ha
ve
enou
gh s
pace
Wat
er s
hort
age
/ no
t eno
ugh
wat
er
to p
our
Sat
isfie
d w
ith
curr
ent p
ract
ice
Lack
info
rmat
ion
on w
here
to
purc
hase
, how
to
cons
truc
t etc
Suzabad 11 5 0 3 0 1 2
Shirgoverdhanpur 8 0 1 1 2 0 1
Shivdaspur 3 2 0 3 0 0 0
Total 22 7 1 7 2 1 3
As for the types of IHHLs, as seen in the table below, 36 households have “latrine connected to piped sewer system” while 57 households have “latrine connected to septic tank” and 27 households have “latrine connected to improved pit with slab”. Although only a small fraction (a

Data Collection Survey on Improvement Japan International Cooperation Agency of Environment in Varanasi City, Republic of India Kokusai Kogyo Co., Ltd. Sewerage Business Management Centre
6-30
few households) own “latrine discharged to road, drain, etc.”
Table 6-70 Types of IHHLs
Latrine connected to piped sewer
system
Latrine connected to septic tank
Latrine connected to improved pit
with slab
Latrine- discharged to road, drain,
etc
Total
Suzabad n 7 21 9 0 37
% 18.92 56.76 24.32 0.00 100.00
Shirgoverdhanpur n 13 13 12 3 41
% 31.71 31.71 29.27 7.32 100.00
Shivdaspur n 16 23 6 0 45
% 35.56 51.11 13.33 0.00 100.00
Total n 36 57 27 3 123
% 29.27 46.34 21.95 2.44 100.00
What compelled the households with IHHLs to build their own latrines was also surveyed, and “privacy/ security for female members” was listed as a prime reason as with the case of the VMC and the RNMB. Next, “children become physically mature” and “sick/old relatives” follows.
Reflecting the fact that the centrally-sponsored programs to support construction of IHHLs, i.e. the Total Sanitation Campaign and Nirmal Bharat Abiyan, had supported rural sanitation, approximately 10% in three GPs have received financial assistance for latrine construction from the government. On the other hand, 106 out of 150 households (86.18%) in the surveyed GPs have constructed latrines by themselves without any financial assistance from the government or NGOs.
Table 6-71 What made you decide to build your latrine? (multiple answers)
Pro
gram
was
of
ferin
g su
bsid
ies
Som
eone
told
me
I had
to
Had
eno
ugh
mon
ey to
bui
ld
Sic
k/o
ld r
ela
tives
Priv
acy
/ se
curit
y fo
r fe
mal
e m
embe
rs
Pre
gnan
cy o
f fe
mal
e m
embe
rs
Chi
ldre
n be
com
e
phys
ical
ly m
atur
e
Soc
ial p
ress
ure
Con
stru
ctio
n of
ne
w h
ouse
Eve
nt (
wed
ding
, fu
nera
l, et
c)
Had
vis
itors
from
ou
tsid
e vi
llage
s
Don
't kn
ow
Suzabad 0 4 7 7 23 6 19 4 8 2 1 0
Shirgoverdhanpur 0 4 2 16 31 9 22 1 6 0 1 2
Shivdaspur 4 0 2 10 32 3 10 0 13 2 0 0
Total 4 8 11 33 86 18 51 5 27 4 2 2
Table 6-72 Did you receive assistance from any organization to build your current latrine?
Yes, from
governmentYes, from
NGO No Don't know Total
Suzabad n 1 0 33 3 37
% 2.70 0.00 89.19 8.11 100.00
Shirgoverdhanpur n 6 1 34 0 41
% 14.63 2.44 82.93 0.00 100.00
Shivdaspur n 5 0 39 1 45
% 11.11 0.00 86.67 2.22 100.00
Total n 12 1 106 4 123
% 9.76 0.81 86.18 3.25 100.00

Data Collection Survey on Improvement Japan International Cooperation Agency of Environment in Varanasi City, Republic of India Kokusai Kogyo Co., Ltd. Sewerage Business Management Centre
6-31
d.2 Sludge Disposal
To the question “Has your latrine pit ever been emptied?”, 11 out of 57 households who own a latrine connected to a septic tank and six out of 27 households who own a latrine connected to improved pit with slab have had their latrine pits emptied before. For the households that have emptied their latrine pits, the further question “what do you do with the contents?” was asked, and the prime answers are “empty pit contents into new hole (9)” and “dumped in the river/ pond/ canal (5)”. The answers to the question, “have you ever hired someone to empty your pit?”, reveals that people who belong to certain communities within the Scheduled Caste, i.e. Mehtar, Balmiki, Dom and Chamar, are engaged in sludge disposal.
Table 6-73 Has your latrine pit ever been emptied?
Yes No Not
applicable Don't know Total
Latrine connected to piped sewer system
n 0 25 10 1 36
% 0.00 27.47 100.00 20.00 29.27
Latrine connected to septic tank
n 11 44 0 2 57
% 64.71 48.35 0.00 40.00 46.34
Latrine connected to improved pit with slab
n 6 19 0 2 27
% 35.29 20.88 0.00 40.00 21.95
Latrine- discharged to road, drain, etc.
n 0 3 0 0 3
% 0.00 3.30 0.00 0.00 2.44
Total n 17 91 10 5 123
% 13.82 73.98 8.13 4.07 100.00
Table 6-74 What do you do with the contents?
Spread on field as fertilizer
Dumped in the forest
Dumped in the river/
pond/ canal
Empty pit contents into new
hole
Don't know
Total
Suzabad n 0 0 2 0 0 2
% 0.00 0.00 100.00 0.00 0.00 100.00
Shirgoverdhanpur n 1 1 0 7 0 9
% 11.11 11.11 0.00 77.78 0.00 100.00
Shivdaspur n 0 0 3 2 1 6
% 0.00 0.00 50.00 33.33 16.67 100.00
Total n 1 1 5 9 1 17
% 5.88 5.88 29.41 52.94 5.88 100.00

Data Collection Survey on Improvement Japan International Cooperation Agency of Environment in Varanasi City, Republic of India Kokusai Kogyo Co., Ltd. Sewerage Business Management Centre
6-32
Table 6-75 Have you ever hired someone to empty your pit?
Yes No Total
Suzabad n 1 1 2
% 50.00 50.00 100.00
Shirgoverdhanpur 9 0 9
100.00 0.00 100.00
Shivdaspur n 6 0 6
% 100.00 0.00 100.00
Total n 16 1 17
% 94.12 5.88 100.00
e. IEC Activities
The survey also enquires about sanitation education and communication. The answers to the question, “What hygiene advice have you heard before?” are “Use a latrine (90)”, “Drink safe water (80)” and “Wash hands with soap (73)” in order of the number of responses. Unlike the cases of the VMC and the RNMB, a substantial number of the respondents have accessed sanitation information about latrines in the GPs, reflecting the fact that the centrally sponsored sanitation programs such as the TSC and the NBA have been actively implemented only in the GPs.
Table 6-76 What hygiene advice have you heard before? (multiple answers)
Non
e
Use
a la
trin
e
Drin
k sa
fe
wat
er
Sto
re w
ate
r sa
fely
Was
h ha
nds
Was
h ha
nds
with
soa
p
Goo
d fo
od
hygi
ene
Was
tew
ater
/st
agna
nt
wat
er
man
agem
ent
Suzabad n 8 30 24 11 11 24 8 4
Shirgoverdhanpur n 5 29 27 7 16 24 6 2
Shivdaspur n 4 31 29 1 8 25 8 1
Total n 17 90 80 19 35 73 22 7
The survey further inquires into the information source of hygiene advice. The major answers throughout the three GPs are “billboard advertisement (114)”, “NGO/ agency worker (39)” and “anganwadi worker (38)”. Billboard advertisements are very popular likely due to the above-mentioned national programs, i.e. the TSC and the NBA, which make great use of them. Next, “NGO/ agency worker (39)” and “anganwadi worker (38)” follows. These figures indicate that inter-personal communication through NGO/agency workers and anganwadi workers is much less popular than the billboard advertisements even though it is known that inter-personal communication and information exchange are much more effective for behavior changes.

Data Collection Survey on Improvement Japan International Cooperation Agency of Environment in Varanasi City, Republic of India Kokusai Kogyo Co., Ltd. Sewerage Business Management Centre
6-33
Table 6-77 Information source of hygiene advice (multiple answers)
Vill
age
chie
f/
Pan
chay
at
mem
bers
Nei
ghbo
ur
Gov
ernm
ent
of
ficer
AS
HA
(M
idw
ife)
AN
M
(Nur
se)
Ang
anw
adi
wor
ker
Rel
ativ
e
Sch
ools
/ T
each
ers
Rel
igio
us
lead
ers
Lead
ers
of
cast
e-ba
sed
asso
ciat
ion
Suzabad n 10 9 5 11 4 10 10 10 0 0
Shirgoverdhanpur n 7 14 14 14 11 17 2 9 2 0
Shivdaspur n 8 7 6 5 2 11 4 5 0 0
Total n 25 30 25 30 17 38 16 24 2 0
Uni
on
lead
ers
NG
O/
Age
ncy
wor
ker
Rad
io
Pos
ter/
P
ictu
re
Bill
boar
d ad
vert
ise
men
t T
ele
visi
on
ad
vert
ise
men
t
Com
mun
ity
mee
ting
Hea
lth
Cen
tre/
D
ispe
nsar
y
Ang
anw
adi
Suzabad n 4 11 8 3 30 1 5 6 6
Shirgoverdhanpur n 10 18 10 3 38 1 6 3 6
Shivdaspur n 3 10 17 8 46 1 4 1 2
Total n 17 39 35 14 114 3 15 10 14
6.2 Institutional Opinion Survey (IOS)
6.2.1 Outline of the Survey Areas and the Survey Schedule
Under the IOS, opinions as to waste collection were collected from 10 institutions listed in the table below. The interview survey was carried out both on 14th and 16th September, 2015.
Table 6-78 Survey schedule
Types of business Numbers
Restaurants (large, medium and small) 3
Hotels (large, medium and small) 3
Schools 2
Hindu temple 1
Vegetable market 1
Total 10
6.2.2 Survey Results
a. Solid Waste Management
To the question, “Do you receive collection service(s) of any kind?”, nine out of 10 institutions answered “yes”. Also, answers to the question “how is the waste collected?” reveal that most of them use the collection service provided by the local government, while a few of them use the service provided by a private company or individual collectors, too.

Data Collection Survey on Improvement Japan International Cooperation Agency of Environment in Varanasi City, Republic of India Kokusai Kogyo Co., Ltd. Sewerage Business Management Centre
6-34
Table 6-79 Do you receive collection service(s) of any kind?
Yes No Total
n 9 1 48
% 90.00 10.00 100.00
Table 6-80 How is the waste collected?
Place it beside the near-by road side for
collection
Place it to a designated
collection point
Place it directory to waste truck/
hand cart
Handed it directly to
waste collectors
Don't know Total
n 1 5 1 2 1 10
% 10.00 50.00 10.00 2.00 10.00 100.00
Table 6-81 Who collects the waste?
Local
government Private
company Individual collectors
Total
n 6 1 3 10
% 60.00 10.00 30.00 100.00
As for the collection frequency, most of them said “daily (76.9%)” 37 . Interestingly, the satisfaction level of the collection service is lower among institutions in the VMC than among residents in the VMC. Only 20.0% of the respondents said “very satisfied” and another 30.0% said “reasonably satisfied”.
Table 6-82 How often is your waste collected?
Daily
Less than once a week
Don't know Total
n 8 1 1 10
% 80.00 10.00 10.00 100.00
Table 6-83 Are you satisfied with the collection service?
Very
satisfied Reasonably
satisfied Less than satisfied
Not satisfied at all
Can't say Total
n 2 3 3 1 1 10
% 20.00 30.00 30.00 10.00 10.00 100.00
To the question “How do you think litter can be reduced in the area?”, the most frequently-given answers are “to strengthen laws and regulations, and then “to increase the number of dustbins in the area” follows.
37 The institution answered “less than once a week” uses the service by an individual collector.

Data Collection Survey on Improvement Japan International Cooperation Agency of Environment in Varanasi City, Republic of India Kokusai Kogyo Co., Ltd. Sewerage Business Management Centre
6-35
Table 6-84 How do you think litter can be reduced in the area? (multiple answers)
To strengthen laws and
regulations
To increase the frequency of
waste collection services
To raise people's
awareness
To increase the number of
dustbins in the area
Other (To collect waste
from each household)
Total
n 8 2 3 5 1 19
b. Reduce, Reuse and Recycle (3Rs) Activities
By responding to the question, “Is there someone who comes around to collect or buy your reusable and recyclable materials?”, in contrast to the results of POS, only two organizations answered “yes”. In this area, itinerant buyers of recyclables work actively only in the residential areas. Also, to a related question, “Do you take recyclable materials to shops for refund or sale?”, all the organizations answered “no”.
Table 6-85 Is there someone who comes around to collect or buy reusable or recyclable materials?
Yes No
Don't know
Total
N 2 7 1 10
% 20.00 70.00 10.00 100.00
Table 6-86 Do you take recyclable materials to shops for refund or sale?
No
Don't know
Total
n 9 1 10
% 90.00 10.00 100.00
6.3 Summary of Public Opinion Survey
As a summary of POS, the survey results are rearranged here to illustrate different aspects of the environmental problems caused by differences in the capacity of the three local authorities, i.e. the VMC, the RNMB and the three GPs38.
6.3.1 Peoples’ Perceptions of Environmental Problems
Before comparing the sector-specific problems, differences in perception of environmental issues will be illustrated here. The results to the question “Which of the following do you think needs urgent improvement? Rank the top five items” are compared in the table below. The blue shaded cells show the items which gained more than two points as well as the highest among the three local authorities, i.e. the VMC, the RNMB and the GPs.
The table reveals that while people in the VMC are greatly concerned about drinking water (2.31) and electricity/ cooking fuel (2.71), people in the RNMB are concerned mostly over solid waste (2.46) and people in the GPs are concerned over drainage and liquid waste (2.61). Among the
38 The summary of IOS which focused only on solid waste management was only presented in the pertinent section.

Data Collection Survey on Improvement Japan International Cooperation Agency of Environment in Varanasi City, Republic of India Kokusai Kogyo Co., Ltd. Sewerage Business Management Centre
6-36
sectors targeted under this study (the red shaded cells), every local body- irrespective of urban and rural areas- are fully aware of the needs for urgent improvement over solid waste and drainage/ liquid waste. On the other hand, due to the widely available IHHLs in all three local authorities, the respondents in all three areas do not consider latrine facilities as an issue that needs addressing urgently. As for drinking water, the points differ greatly among local authorities since the water source and water purification technologies differ among them.
Table 6-87 Items needed for urgent improvement
Drin
king
wat
er
Acc
ess
road
/ T
rans
port
atio
n
Dra
inag
e/ L
iqui
d
was
te
Sol
id w
aste
Latr
ine
faci
litie
s
Edu
catio
n fa
cilit
ies
Hea
lth fa
cilit
ies
Ele
ctric
ity/
cook
ing
fuel
Em
ploy
men
t op
port
uniti
es
Crim
e/ s
afet
y
Fun
ctio
n of
loca
l go
vern
men
t
VMC 2.31 1.40 2.30 2.06 0.64 0.82 0.63 2.71 1.26 0.45 0.00
RNMB 1.72 1.14 1.96 2.46 1.06 1.08 0.56 2.40 1.64 0.36 0.00
GPs 1.65 1.88 2.61 2.21 1.13 0.86 0.53 1.89 1.44 0.25 0.05
(Note) The respondent ranked five items, giving five (5) points for the item that needed the most urgent improvement and one (1) point for the item that needed the least urgent improvement. Then the average points were calculated for each item.
6.3.2 Water Supply and Wastewater Management
a. Water Supply
As for the main source of drinking water, 64% of the respondents in the VMC, 86% of the respondents in the RNMB and 75% of the respondents in the GPs utilize either “piped water into dwelling” or “piped water into yard/plot”. The water charge each household pays per year is the highest in the VMC and then in the GPs. The residents in the RNMB enjoy the cheapest water among all39.
While both surface water and groundwater are used and purified at the purification plant and distributed by Jal Kal in case of the VMC, groundwater is used for the RNMB and the three GPs. As might be expected, the distribution network of the VMC is much more extensive than that of the RNMB or the GPs. However, the quality of water is an issue in the VMC, and in fact, some respondents in the VMC use their own deep wells, expressing their dissatisfaction to the water quality of the piped water supplied by the VMC.
Table 6-88 Main source of drinking water
Pip
ed
wat
er in
to
dwel
ling
Pip
ed
wat
er in
to
yard
/ plo
t
Pip
ed
wat
er f
rom
ne
ighb
or
Pub
lic ta
b
Tub
ewel
l/ bo
reho
le
Pro
tect
ed
we
ll
Unp
rote
cte
d w
ell
Tot
al
VMC n 51 13 0 9 22 1 4 100
% 51.00 13.00 0.00 9.00 22.00 1.00 4.00 100.00
RNMB n 23 20 0 4 3 0 0 50
% 46.00 40.00 0.00 8.00 6.00 0.00 0.00 100.00
GPs n 58 54 1 3 23 2 9 150
% 38.67 36.00 0.67 2.00 15.33 1.33 6.00 100.00
39 A part of GPs are supplied water by UP Jal Nigam, and therefore the water charges are not collected by GPs but directly by UP Jal Nigam.

Data Collection Survey on Improvement Japan International Cooperation Agency of Environment in Varanasi City, Republic of India Kokusai Kogyo Co., Ltd. Sewerage Business Management Centre
6-37
b. Wastewater Management
While 79% of the respondents in the VMC discharge wastewater to “central sewerage system”, 66% of the respondents in the RNMB and 42% of the respondents in the three GPs do likewise, indicating the rates decrease as the size of the local authority decreases. What is important here is to distinguish sewerage in the VMC and sewerage in other local authorities. Unlike the sewerage system in the VMC, what people mean by “sewerage system” in the RNMB and the GPs is not sewer which is connected to the sewerage treatment plants but just an “underground drain for wastewater”, and therefore wastewater is not treated.
The households that discharged wastewater either to a “roadside drain” or to a “nearby open space” or to “nearby water bodies” total 21% in the VMC, 34% in the RNMB and 58% in the three GPs. More than 20% of the households in a big city like the VMC and more than a half of the households in the GPs discharge grey water to the ambient environment without treatment.
Table 6-89 Wastewater management
(Central) sewerage
system
Road side drain
Nearby open space
Nearby water bodies
Total
VMC n 79 19 2 0 100
% 79.00 19.00 2.00 0.00 100.00
RNMB n 33 11 4 2 50
% 66.00 22.00 8.00 4.00 100.00
GPs n 63 43 32 12 150
% 42.00 28.67 21.33 8.00 100.00
6.3.3 Solid Waste Management
The results of both POS and IOS are summarized in this section.
a. POS
a.1 Solid Waste Management
Among the sectors researched in this study, i.e. water supply, wastewater management, sanitation facilities and solid waste management, the greatest disparity between local authorities is observed in the sector of solid waste management. To the question “Does your household receive collection service(s) of any kind?”, 77% of the respondents responded yes in the VMC. However, the ratios go down to 34 % in the RNMB and less than 5% in the three GPs.
These figures clearly indicate that only the VMC has resources, i.e. a certain number of sanitation workers, collection vehicles and their drivers, collection equipment, etc., which are needed for providing waste collection services to its citizens. As the RNMB is an urban local authority, though the size is much smaller than the VMC, the municipal board maintains city sanitation by collecting the wastes from the city centers. However, there is no proper system to collect waste within the entire area. As for the GPs, the waste collection service is effectively non-existent40.
40 According to the regulation of UP, revenue villages which constitute GPs are allowed to hire sweepers (a sweeper per revenue village). These sweepers are not in charge of waste collection but of sweeping main roads, though.

Data Collection Survey on Improvement Japan International Cooperation Agency of Environment in Varanasi City, Republic of India Kokusai Kogyo Co., Ltd. Sewerage Business Management Centre
6-38
Table 6-90 Do you receive collection service(s) of any kind?
Yes No Total
VMC n 77 23 100
% 77.00 23.00 100.00
RNMB n 17 33 50
% 34.00 66.00 100.00
GPs n 7 143 150
% 4.67 95.33 100.00
The answers to the question “Who collects the waste?” reveal that the individual collectors are actively engaged in waste collection in both the VMC and the RNMB. What needs to be noted here is the different active roles played by in the VMC and the RNMB. In case of the VMC, although all the survey areas are provided with the municipal collection services, some prefer to utilize services by individual collectors41. On the other hand, in the case of the RNMB, since only the central part of the city is provided with municipal collection services, those who live outside of the municipal service area resort to the service provided by individual collectors.
Table 6-91 Who collects the waste?
Local
governmentPrivate
company Resident's association
Individual collectors
Total
VMC N 42 1 2 32 77
% 54.55 1.30 2.60 41.56 100.00
RNMB N 4 0 0 13 17
% 23.53 0.00 0.00 76.47 100.00
a.2 Reduce, Reuse and Recycle (3Rs) Activities
To the question “Is there someone who comes around to collect or buy your reusable and recyclable materials?”, all the respondents in both the VMC and the RNMB and approximately 95% of the respondents in the three GPs answered “yes”. Also, to a related question, “Do you take recyclable materials to shops for refund or sale?”, most of the households in all three local authorities said “no”. These results indicate that itinerant buyers of reusables and recyclables are very active in all three local authorities. 3R activities by itinerant buyers based on market principles function well irrespective of people’s environmental consciousness in this region. On the contrary to the active 3R activities by itinerant buyers, composting is not at all popular in any of the three local authorities.
41 It is contemplated that individual collectors salvage reusable and recyclable from the wastes they received from households, and the remaining are disposed of at the municipal collection points.

Data Collection Survey on Improvement Japan International Cooperation Agency of Environment in Varanasi City, Republic of India Kokusai Kogyo Co., Ltd. Sewerage Business Management Centre
6-39
Table 6-92 Is there someone who comes around to collect or buy reusable or recyclable materials?
Yes No
Don't know
Total
VMC n 100 0 0 100
% 100.00 0.00 0.00 100.00
RNMB n 50 0 0 50
% 100.00 0.00 0.00 100.00
GPs n 142 7 1 150
% 94.67 4.67 0.67 100.00
Table 6-93 Do you take recyclable materials to shops for refund or sale?
Yes No
Don't know
Total
VMC n 3 97 0 100
% 3.00 97.00 0.00 100.00
RNMB n 6 43 1 50
% 12.00 86.00 2.00 100.00
GPs n 16 132 2 150
% 10.67 88.00 1.33 100.00
Table 6-94 Are you using kitchen waste and/or garden waste for compost?
Yes No
Don't know
Total
VMC n 0 100 0 100
% 0.00 100.00 0.00 100.00
RNMB n 0 50 0 50
% 0.00 100.00 0.00 100.00
GPs n 16 132 2 150
% 10.67 88.00 1.33 100.00
b. IOS
b.1 Solid Waste Management
To the question, “Do you receive collection service(s) of any kind?”, nine out of 10 institutions answered “yes”. Also, answers to the question “How is the waste collected?” reveal that while a few of the organizations, such as hotels and a temples use the service provided by a private company or individual collectors, most of the organizations such as restaurants and schools use the collection service provided by the local government.

Data Collection Survey on Improvement Japan International Cooperation Agency of Environment in Varanasi City, Republic of India Kokusai Kogyo Co., Ltd. Sewerage Business Management Centre
6-40
Table 6-95 Do you receive collection service(s) of any kind?
Yes No Total
Restaurant 3 0 3
Hotel 2 1 3
School 2 0 2
Temple 1 0 1
Vegetable shop 1 0 1
Total 9 1 10
Table 6-96 Who collects the waste?
Local
governmentPrivate
companyIndividual collectors
Total
Restaurant 3 0 1 4
Hotel 0 1 1 2
School 2 0 0 2
Temple 0 0 1 1
Vegetable shop 1 0 0 1
Total 6 1 2 10
b.2 Reduce, Reuse and Recycle (3Rs) Activities
By responding to the question, “Is there someone who comes around to collect or buy your reusable and recyclable materials?”, in contrast to the results of POS, only two hotels answered “yes”42. In this region where composting is not at all prevalent, neither organizations nor individuals are engaged in recycling of organic waste generated from restaurants and vegetable markets.
Table 6-97 Is there someone who comes around to collect or buy reusable and recyclable materials?
Yes No
Don't know
Total
Restaurant 0 3 0 3
Hotel 2 1 0 3
School 0 2 0 2
Temple 0 0 1 1
Vegetable shop 0 1 0 1
Total 2 7 1 10
6.3.4 Sanitation Facilities
a. Individual Household Latrines (IHHLs)
More than 90% of the respondents in the VMC as well as more than 80% of the respondents in both the RNMB and the three GPs have IHHLs. The ownership ratio of IHHLs in these local
42 A big hotel surveyed said they donate recyclables to a local NGO. This is included as one of “yes” to the table titled “Is there someone who comes around to collect or buy reusable and recyclable materials?”.
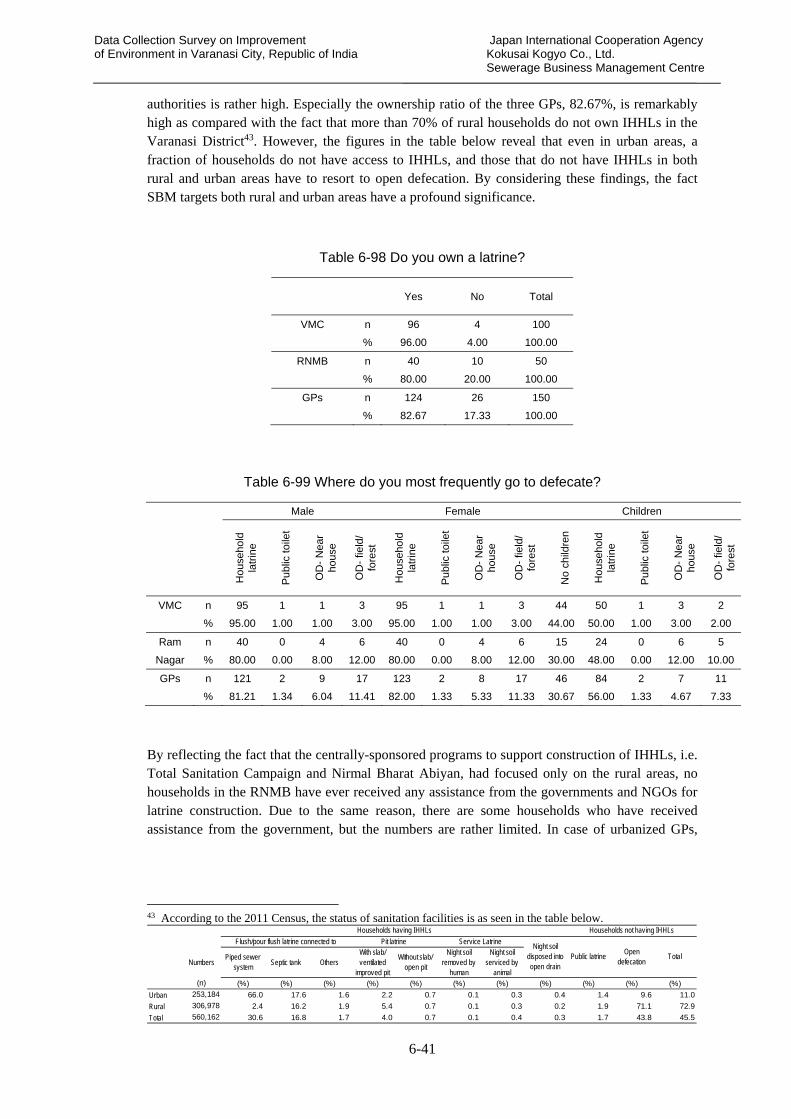
Data Collection Survey on Improvement Japan International Cooperation Agency of Environment in Varanasi City, Republic of India Kokusai Kogyo Co., Ltd. Sewerage Business Management Centre
6-41
authorities is rather high. Especially the ownership ratio of the three GPs, 82.67%, is remarkably high as compared with the fact that more than 70% of rural households do not own IHHLs in the Varanasi District43. However, the figures in the table below reveal that even in urban areas, a fraction of households do not have access to IHHLs, and those that do not have IHHLs in both rural and urban areas have to resort to open defecation. By considering these findings, the fact SBM targets both rural and urban areas have a profound significance.
Table 6-98 Do you own a latrine?
Yes No Total
VMC n 96 4 100
% 96.00 4.00 100.00
RNMB n 40 10 50
% 80.00 20.00 100.00
GPs n 124 26 150
% 82.67 17.33 100.00
Table 6-99 Where do you most frequently go to defecate?
Male Female Children
Hou
seho
ld
latr
ine
Pub
lic t
oile
t
OD
- N
ear
hous
e
OD
- fie
ld/
fore
st
Hou
seho
ld
latr
ine
Pub
lic t
oile
t
OD
- N
ear
hous
e
OD
- fie
ld/
fore
st
No
child
ren
Hou
seho
ld
latr
ine
Pub
lic t
oile
t
OD
- N
ear
hous
e
OD
- fie
ld/
fore
st
VMC n 95 1 1 3 95 1 1 3 44 50 1 3 2
% 95.00 1.00 1.00 3.00 95.00 1.00 1.00 3.00 44.00 50.00 1.00 3.00 2.00
Ram n 40 0 4 6 40 0 4 6 15 24 0 6 5
Nagar % 80.00 0.00 8.00 12.00 80.00 0.00 8.00 12.00 30.00 48.00 0.00 12.00 10.00
GPs n 121 2 9 17 123 2 8 17 46 84 2 7 11
% 81.21 1.34 6.04 11.41 82.00 1.33 5.33 11.33 30.67 56.00 1.33 4.67 7.33
By reflecting the fact that the centrally-sponsored programs to support construction of IHHLs, i.e. Total Sanitation Campaign and Nirmal Bharat Abiyan, had focused only on the rural areas, no households in the RNMB have ever received any assistance from the governments and NGOs for latrine construction. Due to the same reason, there are some households who have received assistance from the government, but the numbers are rather limited. In case of urbanized GPs,
43 According to the 2011 Census, the status of sanitation facilities is as seen in the table below.
NumbersPiped sewer
systemSeptic tank Others
With slab/ventilated
improved pit
Without slab/open pit
Night soilremoved by
human
Night soilserviced by
animal(n) (%) (%) (%) (%) (%) (%) (%) (%) (%) (%) (%)
Urban 253,184 66.0 17.6 1.6 2.2 0.7 0.1 0.3 0.4 1.4 9.6 11.0
Rural 306,978 2.4 16.2 1.9 5.4 0.7 0.1 0.3 0.2 1.9 71.1 72.9
Total 560,162 30.6 16.8 1.7 4.0 0.7 0.1 0.4 0.3 1.7 43.8 45.5
Households having IHHLs Households not having IHHLs
Flush/pour flush latrine connected to Pit latrine Service LatrineNight soil
disposed intoopen drain
Public latrineOpen
defecationTotal

Data Collection Survey on Improvement Japan International Cooperation Agency of Environment in Varanasi City, Republic of India Kokusai Kogyo Co., Ltd. Sewerage Business Management Centre
6-42
many households construct IHHLs by themselves because of the sheer necessity44.
Table 6-100 Did you receive assistance from any organization to build your current latrine?
Yes, from
governmentYes, from
NGO No Don't know Total
VMC n 0 0 94 1 95
% 0.00 0.00 98.95 1.05 100.00
RNMB n 0 0 39 1 40
% 0.00 0.00 97.50 2.50 100.00
GPs n 12 1 106 4 123
% 9.76 0.81 86.18 3.25 100.00
b. Sludge Disposal
The question “Has your latrine pit ever been emptied?” was raised to 258 households who own IHHLs at home. The table below summarized the results by the type of IHHLs. The table shows only 12 (16.90%) out of 71 households with a latrine connected to a septic tank, which requires regular desludging, have ever cleaned up tanks. Likewise, only six (17.14%) out of 35 households with a latrine connected to an improved pit, which basically assumes regular desludging, have ever emptied their latrine pits.
Also, for the households who have emptied their latrine pits, the further question “What do you do with the contents?” was asked. As seen in the table below, some households “Dumped contents in the forest” and some others “Dumped contents in the river/ pond/ canal”. By looking at these results, as for sludge management, there are two types of problems, namely “pre-desludging problem”- a problem whether tanks and pits are desludged regularly- and “post-desludging problem”- a problem whether sludge is properly disposed of- and the solutions need to be determined separately for a pre-desludging problem and a post-desludging problem”.
Table 6-101 Has your latrine pit ever been emptied?
Yes No
Not applicable
Don't know Total
Latrine connected to piped sewer system
n 5 93 45 1 144
% 3.47 64.58 31.25 0.69 100.00
Latrine connected to septic tank
n 12 57 0 2 71
% 16.90 80.28 0.00 2.82 100.00
Latrine connected to improved pit with slab
n 6 27 0 2 35
% 17.14 77.14 0 5.71 100
Latrine- served by animal n 0 0 1 0 1
% 0.00 0.00 100.00 0.00 100.00
Latrine- discharged to road, drain, etc.
n 0 5 2 0 7
% 0.00 71.43 28.57 0.00 100.00
Total n 23 182 48 5 258
% 8.91 70.54 18.60 1.94 100.00
44 Many respondents raised “privacy/ security for female members” as a prime reason to decide to build IHHLs. However, not only that but other fundamental factors such as the rate of urbanization (less vacant places to defecate openly), the economic status, e.t.c. seem to strongly affect people’s decisions.

Data Collection Survey on Improvement Japan International Cooperation Agency of Environment in Varanasi City, Republic of India Kokusai Kogyo Co., Ltd. Sewerage Business Management Centre
6-43
Table 6-102 What do you do with the contents?
Spread on field as fertilizer
Dumped in the forest
Dumped in the river/
pond/ canal
Empty pit contents into
new hole Don't know Total
n 1 1 6 11 4 23
% 4.35 4.35 26.09 47.83 17.39 100.00
6.3.5 IEC Activities
The survey also enquires about sanitation education and communication. From the question about the information source of hygiene advice, it became apparent that the major sources are “billboard advertisement (67.49%)”, “radio (21.76%)” and “anganwadi workers (20.39%)”. Billboard advertisement is very popular. This is probably because the above-mentioned national programs, i.e. TSC and NBA, make great use of them. Next, “radio” and “anganwadi workers” follow. For inter-personal communication, which is known as effective for behavior changes, anganwadi workers are and will be key persons.
Table 6-103 Information source of hygiene advice (multiple answers)
Vill
age
chie
f/
Pan
chay
at
mem
bers
Nei
ghbo
ur
Gov
ernm
ent
of
ficer
AS
HA
(M
idw
ife)
AN
M (
Nu
rse)
Ang
anw
adi
wor
ker
Rel
ativ
e
Sch
ools
/ T
each
ers
Rel
igio
us
lead
ers
Lead
ers
of
cast
e-ba
sed
asso
ciat
ion
VMC n 7 31 13 2 1 16 19 13 1 1
RNMB n 1 7 7 2 5 20 4 6 0 0
GPs n 25 30 25 30 17 38 16 24 2 0
Total n 33 68 45 34 23 74 39 43 3 1
% 9.09 18.73 12.40 9.37 6.34 20.39 10.74 11.85 0.83 0.28
Uni
on le
ader
s
NG
O/ A
genc
y w
orke
r
Rad
io
Pos
ter/
Pic
ture
Bill
boar
d ad
vert
isem
ent
Tel
evi
sio
n
adve
rtis
emen
t
Com
mun
ity
mee
ting
Hea
lth C
entr
e/
Dis
pens
ary
Ang
anw
adi
Tot
al
VMC n 8 16 32 19 91 1 9 0 1 104
RNMB n 7 7 12 2 40 0 7 1 6 52
GPs n 17 39 35 14 114 3 15 10 14 207
Total n 32 62 79 35 245 4 31 11 21 363
% 8.82 17.08 21.76 9.64 67.49 1.10 8.54 3.03 5.79 100.0
6.3.6 Overall Findings
The overall findings for four categories, i.e. (i) water supply and wastewater management, (ii) solid waste management, (iii) sanitation facilities and (iv) IEC activities, can be summarized as follows:

Data Collection Survey on Improvement Japan International Cooperation Agency of Environment in Varanasi City, Republic of India Kokusai Kogyo Co., Ltd. Sewerage Business Management Centre
6-44
Water Supply: Not only the extensiveness of the distribution network but also the quality of water depending on water sources are concerns of people.
Wastewater Management: The ratios of the respondents who discharge wastewater to a “central sewerage system” goes down as the size of the local authority becomes smaller. It is important to note here that what people mean by “sewerage system” in the RNMB and the GPs is not a sewer system which connected to the sewerage treatment plants but just an “underground drain for wastewater” and therefore wastewater is not treated.
Solid Waste Management (Households): Among the relevant sectors, the greatest disparity between local authorities is observed in solid waste management. While 77% of the respondents use a collection service in the VMC, only 34% of the respondents in the RNMB and less than 5% of the respondents in the three GPs use such services. As for recycling, itinerant buyers are very active in all three local authorities.
Solid Waste Management (Institutions): Regardless of their business types and sizes, they have received collection services either by municipal workers or individual collectors. The difference from the household-level waste management is the practice of recycling. Recycling is generally inactive among institutions.
Sanitation Facilities: POSs reveal that there are a fraction of households who do not have IHHLs, even in urban areas. SBM (Urban) is going to support this section of people, while SBM (Rural) continues to make efforts to eradicate open defecation in rural areas. The remaining important issue is O&M of the constructed IHHLs, especially sludge management.
IEC: Media approach in collaboration with famous actors and actresses will not be so effective since TV is not at all a major source of hygiene information. Also, by considering the fact that inter-personal communication is more effective for behaviour change, it is advisable to make use of the existing key persons such as anganwadi workers.

Data Collection Survey on Improvement Japan International Cooperation Agency of Environment in Varanasi City, Republic of India Kokusai Kogyo Co., Ltd. Sewerage Business Management Centre
7-1
7 Direction of JICA’s Future Cooperation
This chapter aims to explain the JICA’s future cooperation plan. First, based on the “Issues to be Considered in Forming Cooperation Plans” detailed in the Section 7.1, the current situation faced by local authorities were analyzed and summarized in the Section 7.2. Then, through a series of discussion among stakeholders, a cooperation plan for improving the environment and sanitation in Varanasi City and the surrounding areas was proposed as seen in the section 7.345, and a consensus on the contents of cooperation plan was gained from the Indian side. Along with this plan, both Indian and Japanese side will continuously work on project formulation.
7.1 Issues to Be Considered in Forming Cooperation Plans
a. Coordination with on-going and future Yen-Loan programs
The “Clean Ganga” has been set as one of the major policy goals for the Government of India (GoI). With an aim to reduce the water pollution level of the river, the GoI has implemented several sewerage projects under the Ganga Action Plan in the major cities along the Ganga basin, utilizing support from international donors such as JICA’s Yen-Loan program.
As a policy goal, the new Prime Minister Narendra Modi - who was inaugurated in May 2014, further emphasized the concept of “Clean Ganga”. And subsequently a cooperative effort to achieve “Clean Ganga” was agreed in the Declaration for Japan-India Special Strategic and Global Partnership between the GoI and the Government of Japan (GoJ). In this background, the GoI has been requesting a Yen-loan through the “Ganga Rejuvenation Project” which targets six to eight cities including Varanasi City.
Furthermore, since Varanasi City has signed a letter of intent regarding a partner city cooperation with Kyoto City46, the expectation for further support from the GoJ for Varanasi has been increasing.
In order to maximize the effectiveness of the project outcomes as well as avoid conflicts among JICA’s projects, the future cooperation plans should be formed in line with the objectives of existing and forthcoming Yen-Loan programs, so as to improve the water and sanitation environment in the Varanasi area.
b. Coordination with on-going and future national schemes
The responsible institutions for improvement of the water and sanitation environment in the Varanasi area, such as the VMC and the Jal Nigam have been making efforts to improve the situation not only through the above-mentioned foreign aid but also through the national schemes such as the JNNURM, the AMRUT, and the SBM (Urban).
For example, under the AMRUT scheme, the Jal Nigam, as an implementation agency, is planning to implement several projects by reflecting VMC’s needs with an aim to reduce the NRW ratio of Varanasi from the current level of 58% to the target level of 20%. The projects
45 In Draft Final Report, four cooperation plans were proposed based on the survey results. Through a series of discussion among stakeholders, a single cooperation plan which compiles all the prioritized activities from the four plans is finally proposed. 46 For details, please visit http://www.city.kyoto.lg.jp/sogo/page/0000181665.html (Japanese). No English pages are available.

Data Collection Survey on Improvement Japan International Cooperation Agency of Environment in Varanasi City, Republic of India Kokusai Kogyo Co., Ltd. Sewerage Business Management Centre
7-2
related to reduction of non-revenue water (NRW) ratio include replacement of decrepit water supply lines during FY2016 and FY2019, introduction of SCADA system47, and installation of water meters to each household during FY2017 and FY2019.
While both Jal Nigam and VMC will continue their efforts to improve the sanitation infrastructure in Varanasi by utilizing various national schemes, in addition to the infrastructure development, the capacity development of officials and engineers are essential to actually improve the environmental sanitation in the area. In this regards, the Japanese technical cooperation project, which focuses on the technological transfer and the capacity development of counterparts, can contribute tremendously.
In order to maximize the effectiveness of the project outcome, the future cooperation plan should be formed in line with the objectives of existing and forthcoming activities under various national schemes to improve the water and sanitation environment in the Varanasi area.
c. Cooperation that contributes to improving rural sanitation
It is rather unrealistic to list up both VMC and gram panchayats as implementing agencies from the viewpoint of project implementation48. The reason is because, the local authorities - i) urban local authorities such as Municipal Corporation, and ii) rural local authorities called gram panchayat - are supervised by two different line departments at the state level, as well as two different line ministries at the central level49. However, the sanitation facilities of VMC - i.e. sewerage treatment plants, a final disposal site, and a recycling plant - are all located in the area next to gram panchayats, outside of the VMC boundary. Therefore, with the kind cooperation from the Department of Panchayat Raj and GPs, a cooperation plan shall encompass the activities, which benefit these rural areas.
d. Support of solid waste management
One of the urgent issues to be addressed in Varanasi City is the solid waste management. Varanasi is facing with various solid waste related issues such as waste being scattered around, attracting flies, and being washed into and clogging sewer drains when it rains. All of these problems significantly deteriorate the hygiene level as well as the landscape of the city. Considering the fact that Varanasi City is a famous tourist destination attracting pilgrims from all over India, it is obvious that immediate action is required to improve the city environment.
In doing so, enhancement of basic operations and management in solid waste management is significantly important, and the issues related to waste management need to be solved by changing waste discharge manners, implementing waste collection as well as transportation, and properly managing operations of sanitary landfills at the final disposal sites.
Additionally, issues arising from weak organizational structure have to be addressed as is seen in the absence of any monetary charge for collection of waste, management of as many 2,600 waste collection workers, poor maintenance of equipment, and failure in out-sourcing waste collection services.
47 SCADA (supervisory control and data acquisition) is a system for remote monitoring and control. 48 When the JICA study team visited Varanasi, high-ranked officials such as a divisional commissioner of Varanasi strongly recommend the study team to not list up both urban and rural authorities in a single project, in order to avoid procedural complexity. 49 While the Department of Urban Development at the state level and Ministry of Urban Development at the central level supervises the sanitation activities of urban local authorities, Department of Panchayat Raj at the state level and Ministry of Drinking Water and Sanitation at the central level supervises the rural local authorities.

Data Collection Survey on Improvement Japan International Cooperation Agency of Environment in Varanasi City, Republic of India Kokusai Kogyo Co., Ltd. Sewerage Business Management Centre
7-3
With regard to recyclables - such as PET bottles, aluminum cans, steel cans, used paper and glass bottles - these are almost all 100% collected at the generation source and well-cycled through the market mechanisms. Meanwhile, there is an issue, an intermediate treatment plant, which was constructed under the JNNURM, has been left unoperated.
Considering what has been mentioned above, it is evident that gradual steps have to be taken to establish a sustainable waste management system in Varanasi, through various activities such as; capacity development of the health department of VMC; formulation of improvement plans; identification of prioritized issues; implementation of pilot projects to improve the current situation; and review and revision of the improvement plans. Ultimately, it is expected that project activities will be scaled-up to other areas.
In this sense, it is believed that Japanese experience in supporting waste management systems in overseas countries can be highly utilized to improve the situation in Varanasi.
e. Strengthen the capacity for operation and management of water and sewerage systems
Currently, in Varanasi City, a certain percentage of the ARV is levied as water and sewerage charge, which means that the actual water consumption amount is not reflected into the tariff rate; therefore, the tariff has been set at a significantly low rate. Furthermore, water facilities in Varanasi City, such as water intake plants, water treatment plants, water distribution pumps and distribution networks, are more than 100 years old and hence prone to water leakages. According to the report titled “Developing Strategy for Reduction of Non-Revenue Water in Varanasi” issued by the World Bank, the rate of non-revenue water is approximately 61%.
Lack of revenue, caused by the inadequate tariff rates, significantly damages Jal Kal’s financial status and makes it unable to cover even the electricity costs for operating the water facilities. In the “City Development Plan of Varanasi in 2015”, it is estimated that only 61% of the operation costs would be covered if Jal Kal paid the electricity cost by itself. For this reason, the operation costs of STP such as labor as well as maintenance costs, has currently been 100% born by the state government.
As mentioned above, the VMC has faced many issues in water and sewerage sector as well. In order to tackle these issues, for water sector, the VMC and the Jal Nigam plan infrastructure improvements to improve water quality as well as reduce non-revenue water by utilizing the AMRUT funds. In addition, for the sewerage sector, a capacity development program called the “Institutional Development Programme (IDP)” has been planned under the on-going Yen-Loan program (ID-P164) to improve the capacity of Jal Kal, including improvement of tariff collection rates.
The future cooperation plan should be formed, considering the effective collaboration with such forthcoming activities, and complement such activities to contribute in strengthening the capacity for operation and management of water and sewerage systems.
7.2 Sanitation and Environmental Challenges Faced by Local Authorities
The sanitation and environmental challenges faced by local authorities are analyzed and summarized here, by taking into account the “Issues to be Considered in Forming Cooperation Plans” detailed above.

7-4
Table 7-1 Location-Sector wise key issues and a proposed cooperation plan
Supervised
by
Urban Local Authorities Central Gov’t: Min. of Urban Development (MOUD) State Gov’t: Dept. of Urban Development (DOUD)
Rural Local Authorities Central Gov’t: Min. of Drinking Water and Sanitation (MODWS)
State Gov’t: Dept. of Panchayat Raj (DOPR)
Location
Sector
Municipal Corporation
Surveyed:Varanasi City
Municipal Board Surveyed: Ramnagar Municipal
Board
Gram Panchayat Surveyed: 3GP (Suzabad GP/ Sirgorbardhanpur GP/
Shivdhaspur GP)
Solid Waste Management
(SWM)
Needs:HIGH Implementing Agency:Health Dept. VMC Current Situation and Issues Services such as waste collection, transportation, and final
disposal are provided to citizens. Also, recycling and secondary treatment are taken up. The major challenge is to improve service quality and its efficiency.
Collection/ transportation: no rules regarding waste discharge, insanitary primary collection, and inefficient collection system (cancellation of concession agreement with a private company → labour intensive manual primary collection by 2,600 sanitation workers.)
Final disposal: insanitary final disposal, a need to acquire appropriate land for final disposal (the land planned for STP plant is currently used for disposal site. The site locates outside VMC and borders on GPs.)
Secondary treatment: defunct treatment plant, a need to revise recycling plans
A need to improve the financial status
Needs:LOW Implementing Agency :
Ramnagar Municipal Board Current Situation and Issues Services such as waste
collection and transportation are provided only in the central part of the city, and there are no final disposal sites.
Since the populated city centre is served by SWM service, waste scattering is prevented to a certain degree.
Needs:MEDIUM Implementing Agency:target GPs and DoPR (Varanasi) Current Situation and Issues Basically, no services such as waste collection and
transportation are provided in all GPs. Thus, wastes are disposed onto vacant lands and water bodies. Also, wastes are scattered here and there in many GPs.
Remarks SWM is highly prioritized by the VMC. The SWM sector may contribute in furthering a partnership
between Varanasi City and Kyoto City.
Water and Sewerage
Needs:HIGH Implementing agency:Jal Kal Current situation and issues [Water] High NRW ratio due to leakage from decrepit facilities, i.e.
intake facilities, purification plants, distribution pumps and
Needs:LOW Implementing agency :
Ramnagar Municipal Board Current situation and issues [Water] Water for drinking as well as
Needs:MEDIUM Implementing agency:target GPs and DoPR (Varanasi) Current situation and issues [Water] Although Jal Nigam introduced piped water scheme in
urbanized GPs; thus, households in such GPs enjoy

7-5
distribution pipes that are all built more than 100 years ago. Shortage of employees who have technical knowledge on NRW
reduction. Room for improvement regarding quality of piped water.
[Sewerage] Due to shortage of sewerage facilities, untreated wastewater is
discharged into public water bodies (42% of wastewater is untreated.) → river pollution
Room for improvement regarding sludge management/ reuse of sludge generated at STP and on-site treatment facilities.
[For both water and sewerage] Unsound financial status
Water and sewerage charges are set too low to cover the O&M cost. Also, electricity and salary of some officials are born by the state government. → Highly dependent on the money transferred from the state government.
Room for improvement regarding operation and management STP operation by the UP Jal Nigam
other domestic purposes is supplied from the overhead water tank to individual houses by pipes.
Supplied water is only chlorinated; thus a concern regarding quality remains.
Water charges are set too low to cover the O&M cost.
[Sewerage and wastewater] Due to insufficient sewerage
and facilities to treat wastewater, untreated wastewater is discharged into public water bodies.
household connection, most of the GPs use common deep wells for both drinking and other domestic purposes.
Thanks to the Rural Water Supply Scheme, water availability in rural areas has been improved. However, since no institutional and financial arrangement is done for O&M, the O&M of deep wells are major concerns.
[Sewerage and wastewater] Since water supply has been prioritized and wastewater
management has been neglected over a long period in rural areas, many GPs have faced unsanitary conditions due to water logging of untreated wastewater and water pollution of nearby water bodies.
In most urbanized GPs, sanitation facilities such as household latrines and on-site treatment of black and grey water are commonly used. However, sludge management including the O&M of on-site facilities remain as an issue.
In most GPs, installation of individual household latrines and eradication of open defecation remain as a big challenge.
[For both water and sewerage/ wastewater] One gram sachiev (village secretary) looks after the
administrative works of four to five GPs in Uttar Pradesh. Institutional setting to support the GPs in terms of numbers of officials as well as their capabilities is rather weak.
Level of peoples’ awareness regarding water and sanitation is still insufficient.
High prevalence of open defecation in rural areas.
Remarks
Infrastructure development which contributes in reducing NRW is planned from FY2016 onwards, through AMRUT. However, both Jal Nigam (Varanasi) and Jal Kal do not have enough engineers who have acquired technical knowledge of NRW reduction; therefore, the technical cooperation project which aims to enhance capacities of employees to reduce NRW is highly demanded.
Depending on the progress of Institutional Development Program of the on-going Yen Loan (ID-P164), the need to
Need for a technical cooperation project focusing on wastewater management by on-site treatment facilities is confirmed low, since wastewater in the municipal area will be treated by a new STP planned under ID-P164.
The WB plans a new loan
[Common issues to all GPs in UP] All the challenges faced by the GPs, i.e. solid waste and
liquid waste management (SLWM) and eradication of open defecation through constructing individual household latrines, are all dealt with the SBM (rural). While the responsible agency, the Department of Panchayat Raj (DOPR) of UP, eagerly looks forward to receiving technologically-appropriate and replicable SLWM models, implementing the pilot activities to

7-6
complement the program to a certain extent may be inevitable. Collaboration with and demarcation from the on-going Yen Loan Generally, the estimation of NRW ratio, setting the target
ratio and formation of action plans are included as components of a technical cooperation project which aims to reduce NRW. In this case, all of these were carried out under the WB-financed Capacity Building for Urban Development Project (CBUD Project).
Decrepit water supply lines will be replaced and water meter will be introduced to each household, through AMRUT. → Through collaboration with AMRUT, implementing a technical cooperation to contribute to NRW reduction is of great significance..
Generally, improvement of the O&M system (e.g. preparation of O&M manual); improvement of financial situation through revision of water and sewerage charges; and strengthening fee collection capacities; improvement of other services to citizens, are included as components of a technical cooperation project, which aims to develop organizational capacity of water supply and sewerage boards. However, all of these activities are included in the Institutional Development Program of the on-going Yen Loan (ID-P164). →While the deadline of ID-P164 is only after two years and half, IDP consultants have not been procured yet, and thus it is rather uncertain that all of the activities planned under IPD will be carried out. Under such circumstances, considering a technical cooperation which complements IDP components is of great significance.
Considering a cooperation project, which includes proper management and reuse of sludge, which is produced from sewerage facilities, is of significance.
It is worth including awareness raising activities regarding water conservation in a cooperation plan. However, it shall be carried out only after reviewing the existing similar activities mostly carried out by the central government and UNICEF.
project of USD 210 million to support constructing 3-5 regional landfills to serve up to about 60 urban local authorities in UP. As of Dec. 2015, the plan is still at the concept stage. (As of Dec. 2015, both Varanasi City and Ramnagar Municipal Boards are not targeted.)
develop replicable SLWM models under a cooperation project is of great significance. However, the weak organizations in rural areas are the biggest hindrance for a technical cooperation project.
[Issues for the urbanized GPs neighbouring Varanasi City] Sanitation infrastructure, such as a final disposal site a
recycling plant, and STPs, are located not within VMC area but in the GPs neighbouring Varanasi City. Therefore inappropriate operation and management of these facilities have direct implication to the environmental sanitation of such GPs.
Integrated Environmental Improvement Project for Varanasi (tentative)
Integrated Environmental Improvement Project for Varanasi (tentative)

Data Collection Survey on Improvement Japan International Cooperation Agency of Environment in Varanasi City, Republic of India Kokusai Kogyo Co., Ltd. Sewerage Business Management Centre
7-7
7.3 Proposal of Cooperation Plan
As stated earlier, based on the “Issues to be Considered in Forming Cooperation Plans” detailed in the Section 7.1, as well as the current situation faced by local authorities summarized in the Section 7.2, a cooperation plan for improving the environment and sanitation in Varanasi City and the surrounding areas is proposed as below. Both Indian and Japanese side agreed to the contents so far and will formulate future cooperation project based on this plan.
Table 7-2 Future Cooperation Plan
Project Name Integrated Environmental Improvement Project for Varanasi
Project Site Varanasi City and surrounding areas
Counterparts Dept. of Health and Jal Kal of VMC
Other stakeholders
Central Government: Ministry of Urban Development (MOUD)
Others: Dept. of Urban Development, GoUP/ UP Jal Nigam including C&DS (Construction and Design Service) Section/ Varanasi Office of Dept. of Panchayat Raj, GoUP/ GPs
Project Purpose To enhance capacities of VMC to provide citizens with quality water and sanitation services in a sustainable manner.
Outputs and Activities
Component A: Solid waste management
1. Review of the current solid waste management system in Varanasi To review the current practices as well as existing plans such
as DPR. To conduct various surveys, i.e. waste amount and
composition survey, time and motion survey, recycling market survey, disposal amount survey and public opinion survey.
To carry out waste flow analysis. 2. Capacity enhancement through implementation of the pilot
projects To conduct actual improvement activities in pilot scale for the
following areas; improvement of waste collection and transportation improvement of final disposal site improvement of secondary treatment, i.e. recycling management of waste flow data improvement of waste discharge manner
3. Sharing the experience of pilot projects with other urban local bodies and providing feedbacks to the existing policies and plans. To organize seminars on experience sharing To present the project experience with the state-level
officials as well as the central-level officials in order to mainstream the results of the project
Component B: Sewerage and liquid waste management 1. Review of the current sewerage and liquid waste management
practices in Varanasi

Data Collection Survey on Improvement Japan International Cooperation Agency of Environment in Varanasi City, Republic of India Kokusai Kogyo Co., Ltd. Sewerage Business Management Centre
7-8
To review of the existing plans of sanitation infrastructure development including STP development and to confirm the current status of ongoing projects financed by other donors and various national schemes.
To review ongoing interventions regarding the improvement of sanitation facilities, i.e. Swachh Bharat Mission.→To support formulation of action plans for development of sanitation facilities and their O&M.
2. Enhancement of O&M capacity for sewerage and wastewater infrastructure To consider sustainable O&M system for sewer networks
and public toilets and to formulate and/or revise O&M manuals of such facilities.
To consider sustainable O&M system for public sanitation facilities, i.e. on-site treatment system, wastewater treatment facilities and community toilets, and to conduct the necessary pilot project.
To establish appropriate sludge management system based on the examination of the existing practices as well as the appropriate alternative system including recycling of the sludge.
3. Complement of IDP component of on-going Yen Loan Project (ID-P164)
4. Awareness raising of citizens on public sanitation To expand the public sanitation campaign conducted under
ID-P164. To conduct awareness raising campaign to eradicate open
defecation and to promote use of public toilets. Component C: Water supply system
1. Reduction of non-revenue water (NRW) To review the existing study regarding NRW including the
study financed by the World Bank To formulate an action plan for reduction of NRW To implement pilot projects to reduce water leakage and to
formulate leakage control manuals To estimate the cost for investment necessary for reduction
of NRW as well as its benefits 2. Awareness raising of citizens on water conservation
To conduct awareness raising campaigns to promote water conservation.
Remarks