Data Collection and Resolution - Rutgers...
13
Data Collection and Resolution
Transcript of Data Collection and Resolution - Rutgers...

Data Collection and Resolution
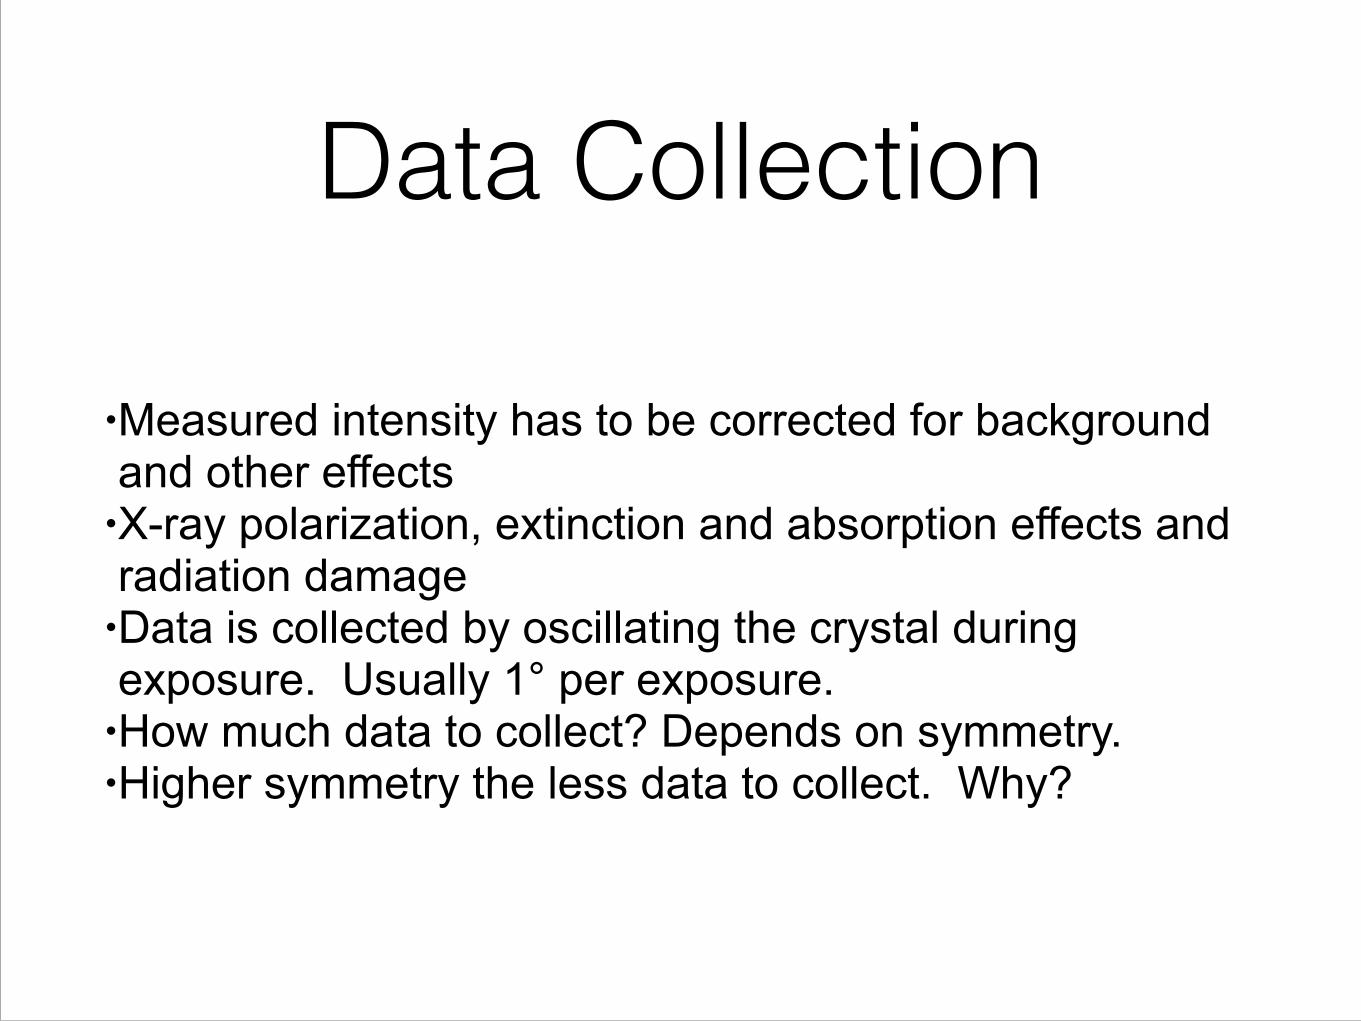
Data Collection
•Measured intensity has to be corrected for background and other effects
•X-ray polarization, extinction and absorption effects and radiation damage
•Data is collected by oscillating the crystal during exposure. Usually 1° per exposure.
•How much data to collect? Depends on symmetry. •Higher symmetry the less data to collect. Why?
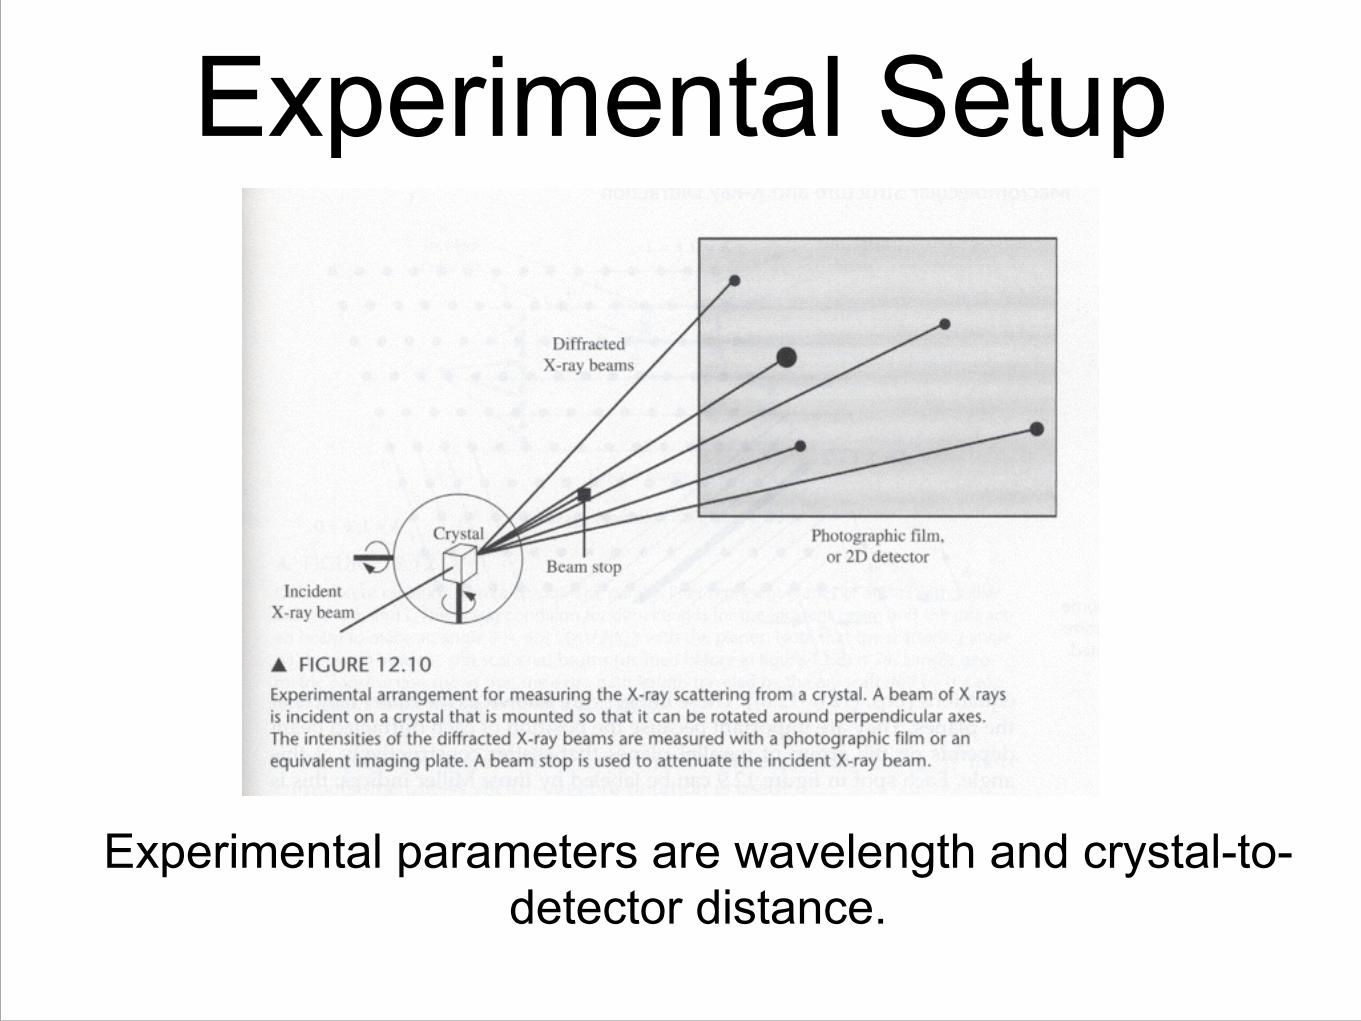
Experimental Setup
Experimental parameters are wavelength and crystal-to-detector distance.
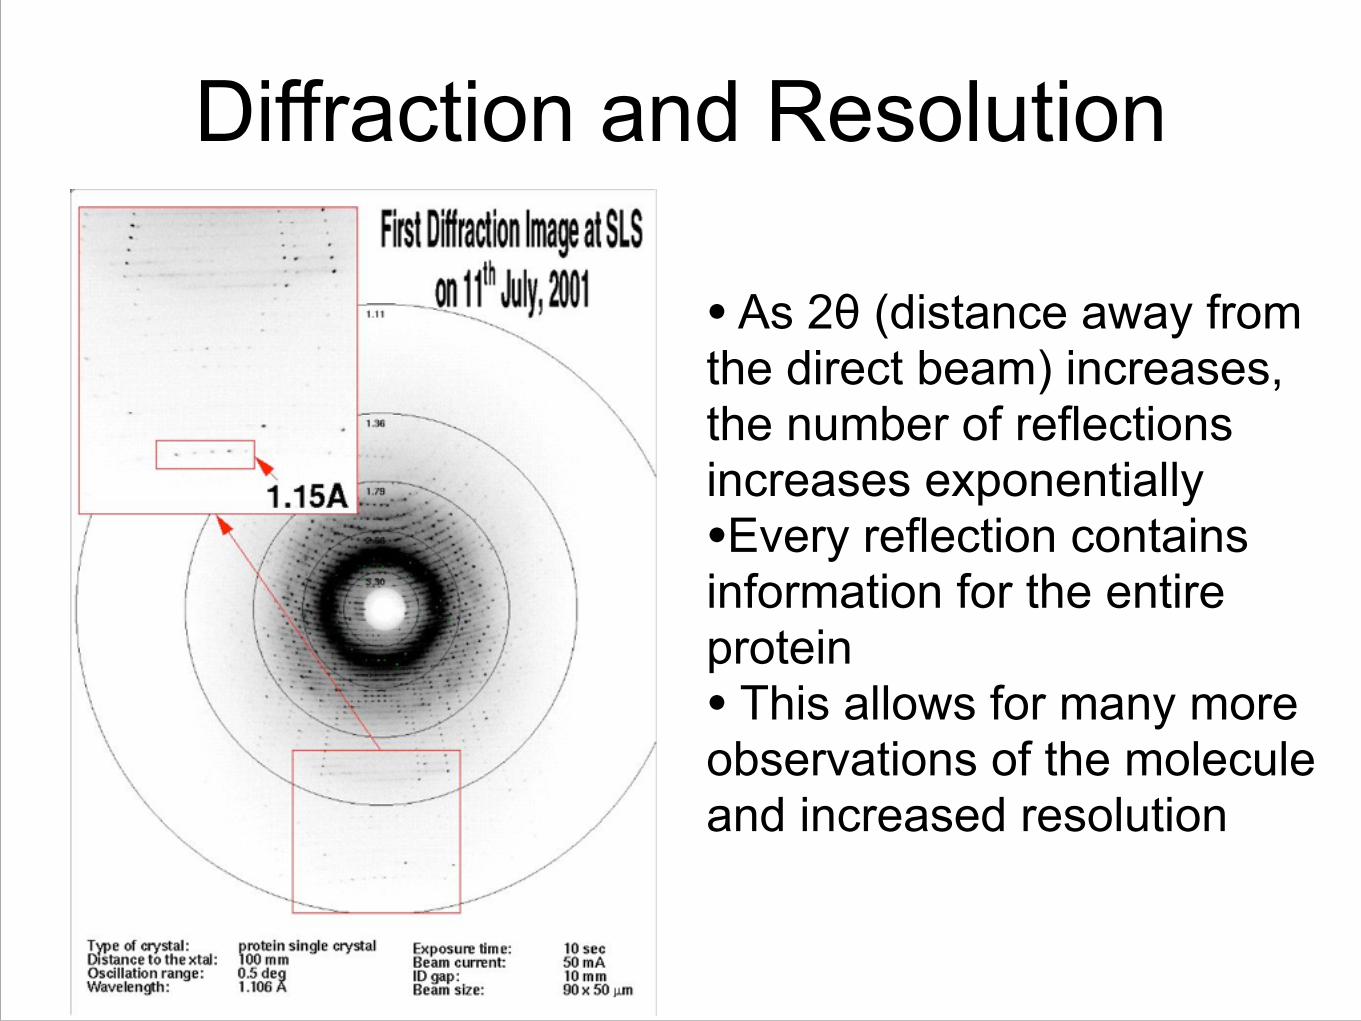
Diffraction and Resolution
• As 2θ (distance away from the direct beam) increases, the number of reflections increases exponentially •Every reflection contains information for the entire protein • This allows for many more observations of the molecule and increased resolution

Intensity of Reflections • For theoretical point scatter (a point that scatters X-rays in
all directions) the intensity of the reflection is the same regardless of angle
• For real atoms the intensity of the reflection is a function of (sinθ)/λ
• Can predict the diffraction pattern if we know the lattice (space group), unit cell dimensions, distance from crystal to detector, orientation of lattice relative to X-ray beam
• BUT the intensity of the reflection depends on the composition and orientation of molecules in the asymmetric unit
• Data collection measure intensity only. Phases need to be estimated.

P212121 A=111, B=173, C=308 90° 90° 90°
P43212 A=78, B=78, C=36 90°,90°,90°
Reciprocal Space
Larger the unit cell the closers the reflections

Monochromatic vs Polychromatic X-rays
Monochromatic
Polychromatic

Mosaic spread•single crystal can be seen as made up of smaller microcrystalline domains that are slightly misaligned with respect to each other. !
•mosaic spread is an angular measure of the misalignment
High Mosaicity Low Mosaicity

Indexing
• Initial estimates of the unit cell dimensions are made from the positions of the reflection and from the physical parameters of the experiment !
• Indexing programs usually work on one oscillation image at a time !
• Unit cell parameters, rotation of the unit cell, mosaicity and crystal-to-detector distance. !
• Measure intensity of the reflection or diffraction spot and the background.
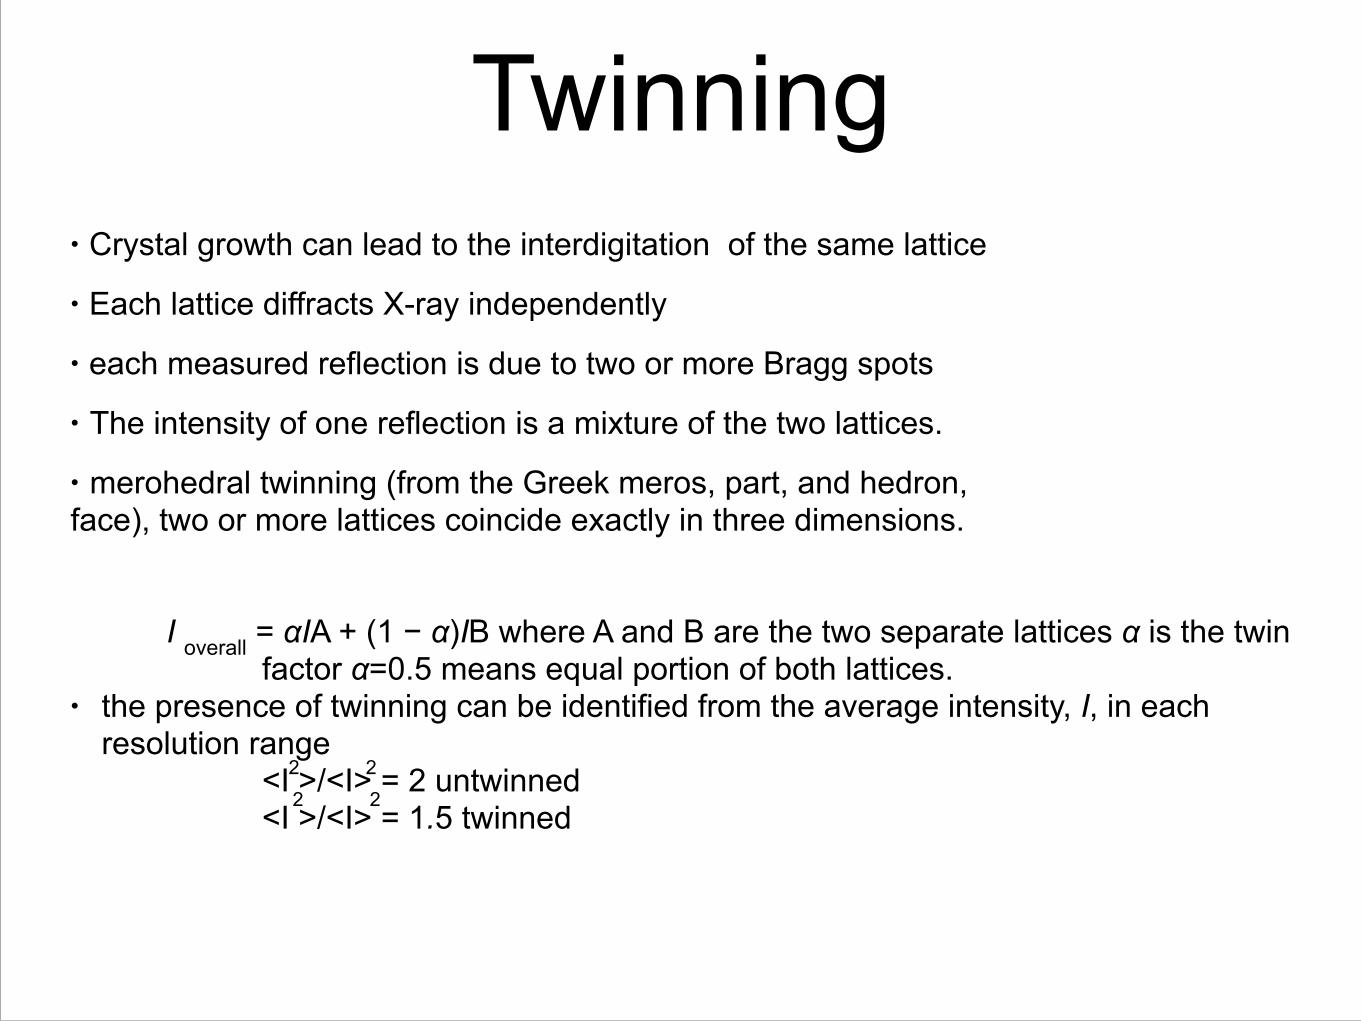
Twinning • Crystal growth can lead to the interdigitation of the same lattice
• Each lattice diffracts X-ray independently
• each measured reflection is due to two or more Bragg spots
• The intensity of one reflection is a mixture of the two lattices.
• merohedral twinning (from the Greek meros, part, and hedron, face), two or more lattices coincide exactly in three dimensions. !! I overall = αIA + (1 − α)IB where A and B are the two separate lattices α is the twin factor α=0.5 means equal portion of both lattices. • the presence of twinning can be identified from the average intensity, I, in each
resolution range <I >/<I> = 2 untwinned <I >/<I> = 1.5 twinned
2 22 2

Twinning

Redundancy and statistics• What is the resolution limit of the data set?
• Determined by the signal to noise of the average reflection in a resolution range. (I/σ)
• Want I/σ≈2 for the highest resolution shell
• During data processing the data is broken down into resolution ranges called shells
• Redundancy is how many times a reflection is recorded
• These are critical parameters for assessing data quality
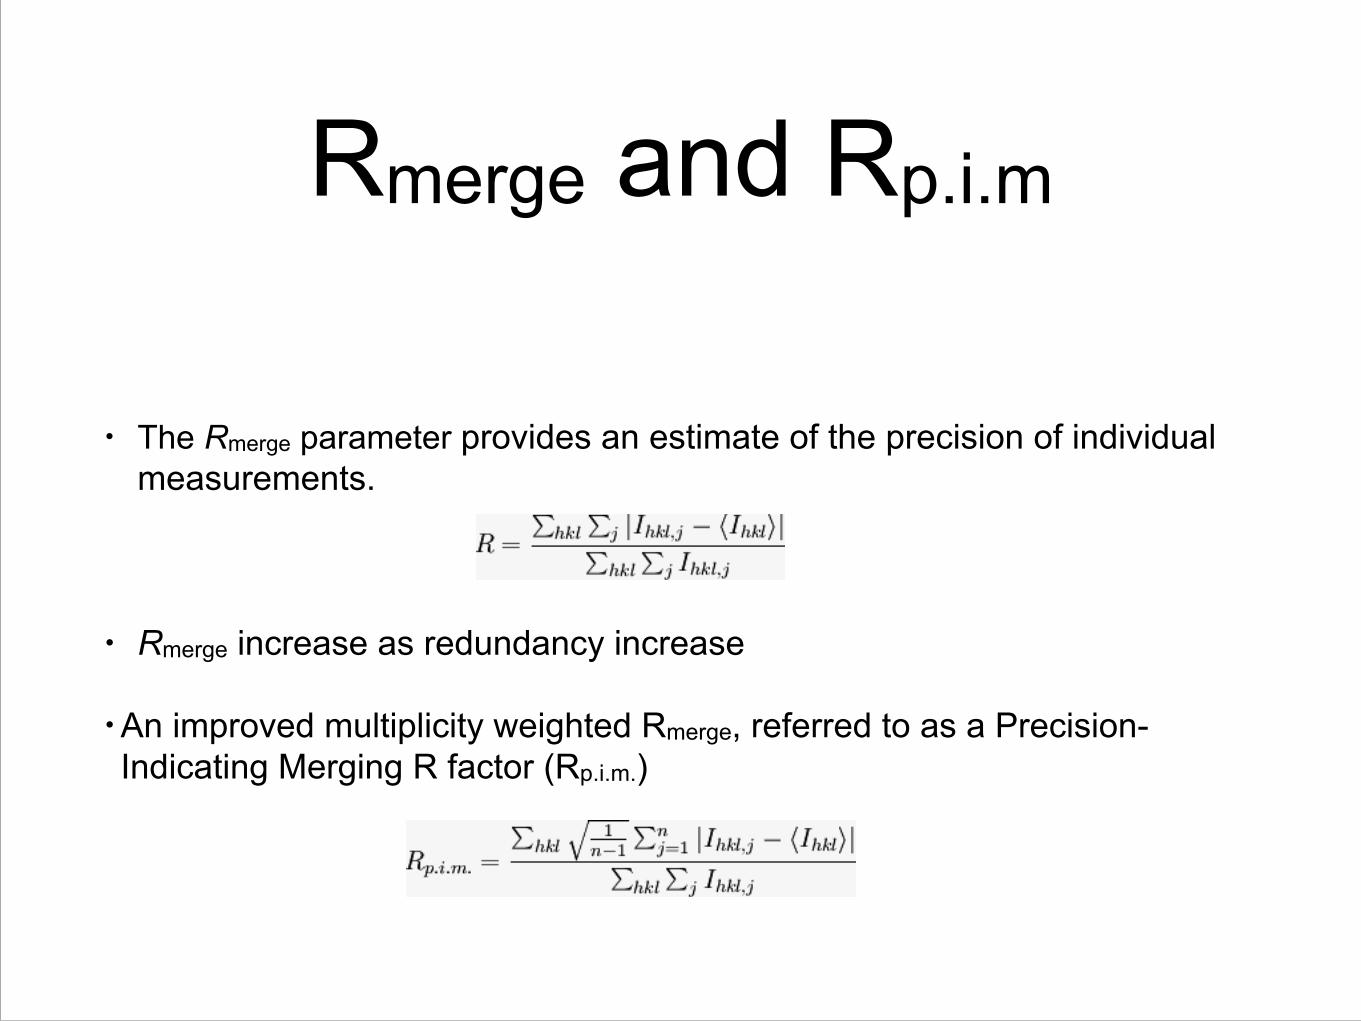
Rmerge and Rp.i.m
• The Rmerge parameter provides an estimate of the precision of individual measurements. !!!
• Rmerge increase as redundancy increase !
•An improved multiplicity weighted Rmerge, referred to as a Precision-Indicating Merging R factor (Rp.i.m.)


![Arnoldi and Lanczos algorithms - ETH Zpeople.inf.ethz.ch/arbenz/ewp/Lnotes/chapter10.pdf · qi are called Arnoldi vectors or Lanczos vectors, respectively, see [6, 1]. The vector](https://static.fdocuments.us/doc/165x107/5b4d8ae07f8b9a696f8b5906/arnoldi-and-lanczos-algorithms-eth-qi-are-called-arnoldi-vectors-or-lanczos.jpg)