Data Cleaning in NM3 - EIVAdownload.eiva.dk/online-training/Data_Cleaning_in_NM3.pdf ·...
24
February, 2012 Data Cleaning in NaviModel3 EIVA POST-PROCESSING SUITE
Transcript of Data Cleaning in NM3 - EIVAdownload.eiva.dk/online-training/Data_Cleaning_in_NM3.pdf ·...

February, 2012
Data Cleaning in NaviModel3 EIVA POST-PROCESSING SUITE
Data Cleaning in NaviModel3
EIVA NaviSuite Software Page 2 of 24 Rev. no. 0, 2012-02-01
Revision History
0 First Edition Lars Dall Various 01/02/2012
Revision Description By Checked Approved Date
Keywords: Hydrographic Surveying, Postprocessing, Data Cleaning
Classification:
Open
Internal
Proprietary
1. INTRODUCTION
Data cleaning can take place within the framework of NaviModel3 due to the fact that the
raw observations are inherent in the DTM. A series of different data cleaning tools have been
implemented:
Manual Cleaning:
o Point Edit 3D Cleaning is a manual cleaning tool, to a large extent identical to
the PlanView cleaning, included in NaviEdit
Semi-Automatic Cleaning:
o Histogram Plane Cleaning is a tool that facilitates cleaning relative to a
polygon-based plane
o Spike Shooting Cleaning is very similar to Histograms Plane Cleaning, except
that the plane is a circle, defined through a single point
Automatic Cleaning:
o S-CAN Cleaning (Score and Components) is a fully automatic cleaning tool,
that has been developed with focus on cleaning of massive multi-beam point
clouds
The cleaning tools can be invoked from different locations:
from the Point Cleaning Toolbox of NaviModel3. The toolbox is activated from the
menu-item 'View - Point Cleaning Toolbox'
with respect to a displayline, that then will form the basis of the so-called structured
cleaning
when loading files during the initial indexing of a model or later on in the modelling
process, relative to a source file
In addition to the built-in cleaning methods, NM3 facilitates the inclusion of dedicated
cleaning tools through the menu-item ‘Tools – Cleaning Plugins – Edit Plugins...’. In this
context, a tool is an executable file that reads a point file (from NM3) and writes back the
(edited) result to the same file and consequently back to NM3, once the dedicated cleaning
has taken place.
Data Cleaning in NaviModel3
EIVA NaviSuite Software Page 3 of 24 Rev. no. 0, 2012-02-01
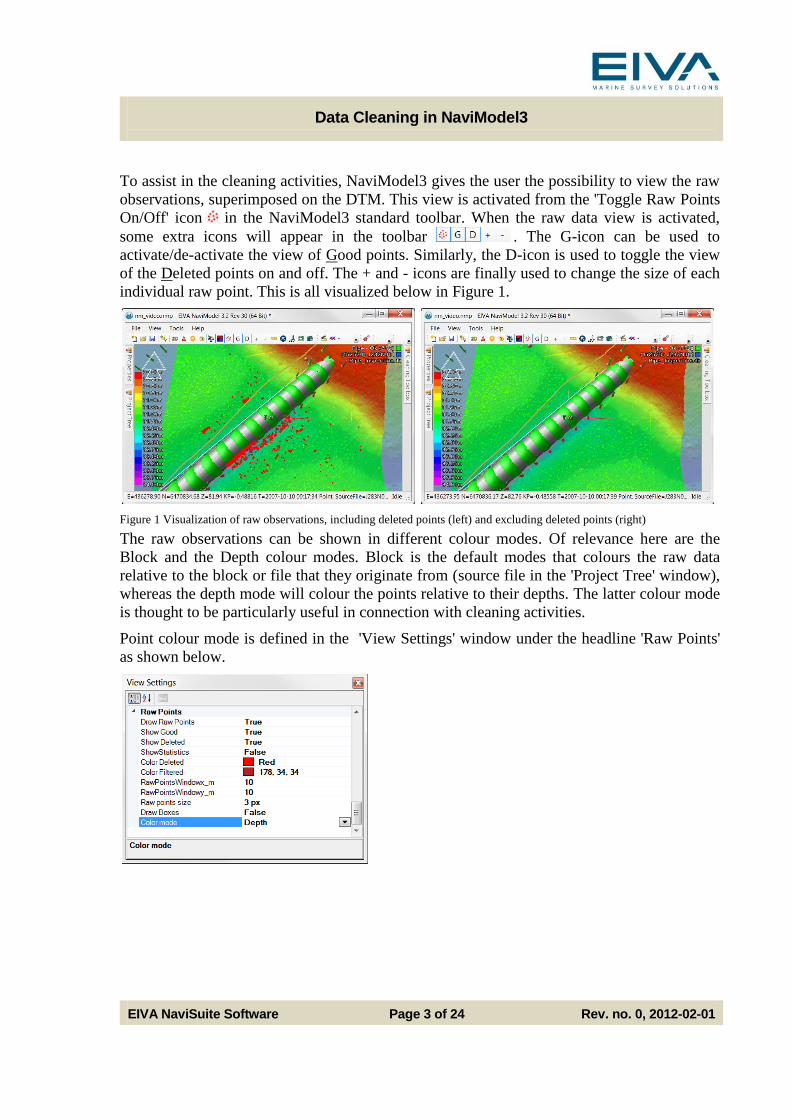
To assist in the cleaning activities, NaviModel3 gives the user the possibility to view the raw
observations, superimposed on the DTM. This view is activated from the 'Toggle Raw Points
On/Off' icon in the NaviModel3 standard toolbar. When the raw data view is activated,
some extra icons will appear in the toolbar . The G-icon can be used to
activate/de-activate the view of Good points. Similarly, the D-icon is used to toggle the view
of the Deleted points on and off. The + and - icons are finally used to change the size of each
individual raw point. This is all visualized below in Figure 1.
Figure 1 Visualization of raw observations, including deleted points (left) and excluding deleted points (right)
The raw observations can be shown in different colour modes. Of relevance here are the
Block and the Depth colour modes. Block is the default modes that colours the raw data
relative to the block or file that they originate from (source file in the 'Project Tree' window),
whereas the depth mode will colour the points relative to their depths. The latter colour mode
is thought to be particularly useful in connection with cleaning activities.
Point colour mode is defined in the 'View Settings' window under the headline 'Raw Points'
as shown below.

Data Cleaning in NaviModel3
EIVA NaviSuite Software Page 4 of 24 Rev. no. 0, 2012-02-01
2. POINT EDIT 3D CLEANING
The ‘Point Edit 3D’ cleaning tool is a conventional manual editing tool that was originally
developed to be used in EIVAs editing software, NaviEdit. By most users it is here employed
on a file-to-file basis. In NM3 however, it is used to clean areas and might therefore include
data from a number of files.
When the Point Edit 3D Cleaning tool is invoked from the Cleaning Toolbox, the user is
prompted to choose selection tool as shown below, left.
The selection tool gives the user the possibility to choose between cleaning relative to a
polygon or to a line. In both cases, the Boundary Object (or 'Line..') can be selected in the
'Project Tree' window, by first selecting the object and then pressing the 'Select Boundary' (or
'..Line') button, that will now reflect the choice performed (see above, right). Alternatively
the user is given the possibility to manually mark out a polygon or a line in order to define
the area to be cleaned.
In both cases (boundary and line), it is furthermore possible to make the cleaning inside or
outside the selection, by enabling or disabling the 'Outside (Invert)' option.
For the line selection based cleaning, the line object will be highlighted. Alternatively the
user is given the opportunity to generate/digitize a line manually. Either way, once the line is
Data Cleaning in NaviModel3
EIVA NaviSuite Software Page 5 of 24 Rev. no. 0, 2012-02-01
selected, the user is supplied with a Corridor Width selection tool. By manipulating the slider
bar or by entering the width values manually, the size of the area relative to the line can be
defined as shown above, left. For the boundary selection based cleaning, the manual
boundary definition is done using the cursor/mouse as shown above, right.
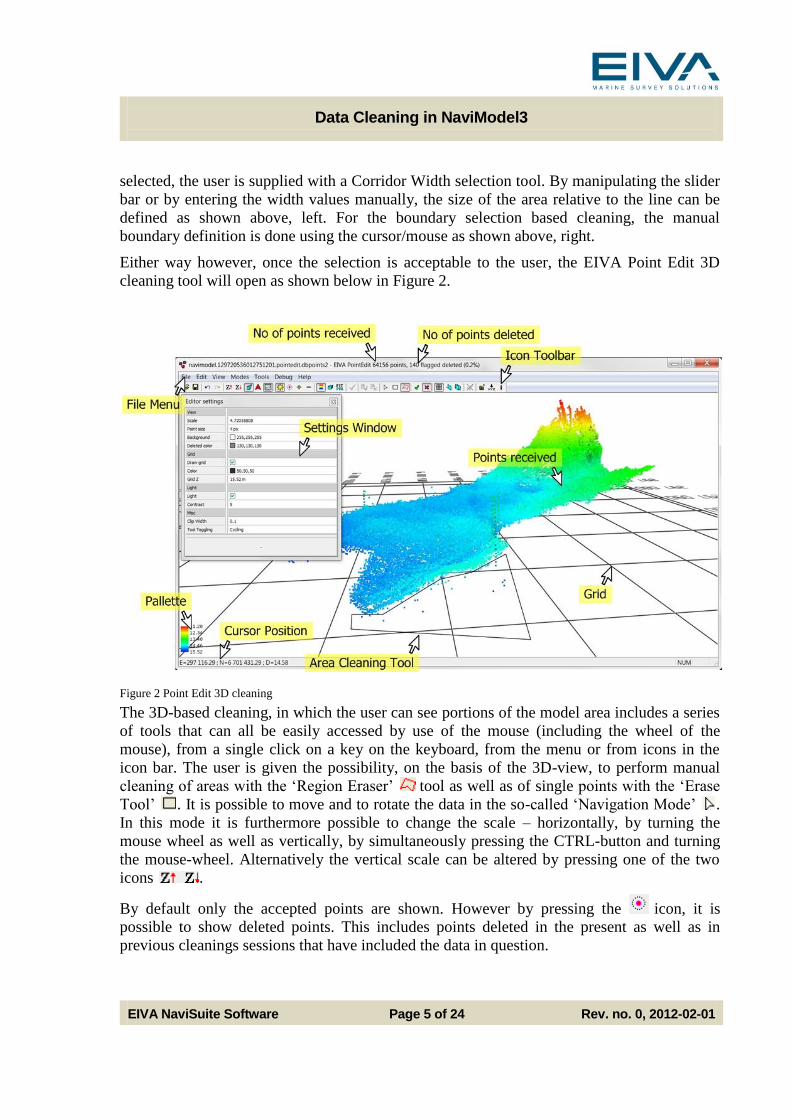
Either way however, once the selection is acceptable to the user, the EIVA Point Edit 3D
cleaning tool will open as shown below in Figure 2.
Figure 2 Point Edit 3D cleaning
The 3D-based cleaning, in which the user can see portions of the model area includes a series
of tools that can all be easily accessed by use of the mouse (including the wheel of the
mouse), from a single click on a key on the keyboard, from the menu or from icons in the
icon bar. The user is given the possibility, on the basis of the 3D-view, to perform manual
cleaning of areas with the ‘Region Eraser’ tool as well as of single points with the ‘Erase
Tool’ . It is possible to move and to rotate the data in the so-called ‘Navigation Mode’ .
In this mode it is furthermore possible to change the scale – horizontally, by turning the
mouse wheel as well as vertically, by simultaneously pressing the CTRL-button and turning
the mouse-wheel. Alternatively the vertical scale can be altered by pressing one of the two
icons .
By default only the accepted points are shown. However by pressing the icon, it is
possible to show deleted points. This includes points deleted in the present as well as in
previous cleanings sessions that have included the data in question.
Data Cleaning in NaviModel3
EIVA NaviSuite Software Page 6 of 24 Rev. no. 0, 2012-02-01
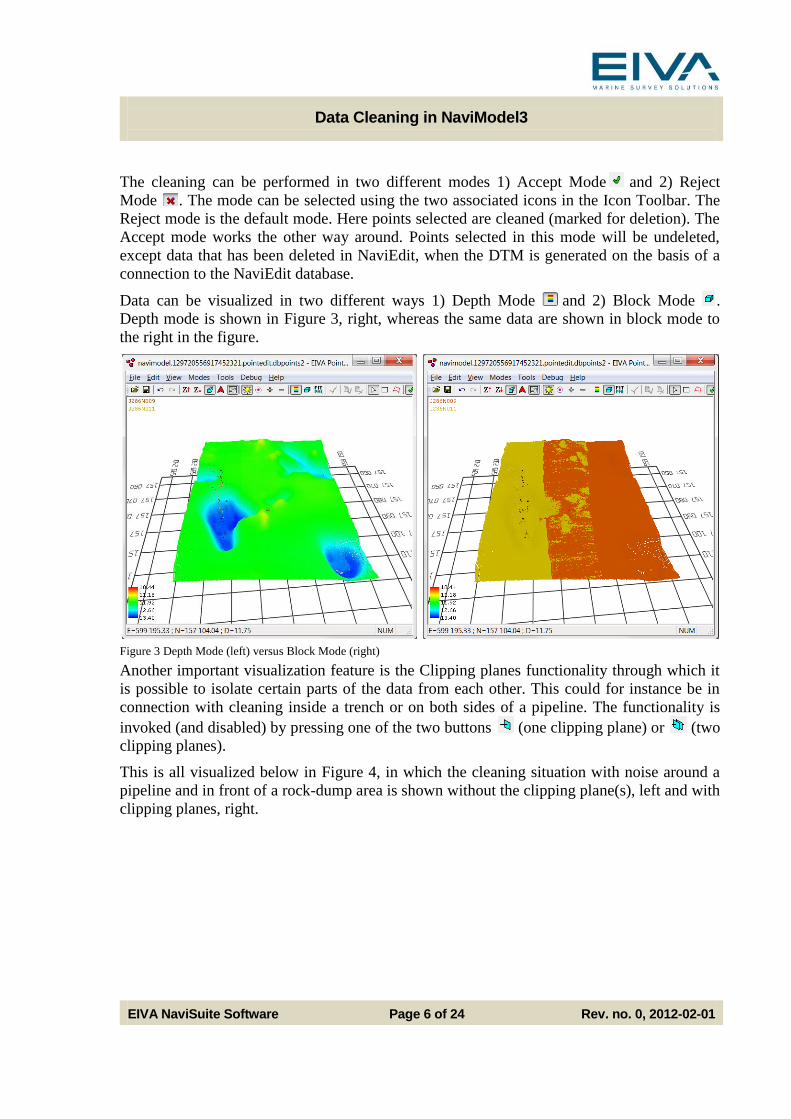
The cleaning can be performed in two different modes 1) Accept Mode and 2) Reject
Mode . The mode can be selected using the two associated icons in the Icon Toolbar. The
Reject mode is the default mode. Here points selected are cleaned (marked for deletion). The
Accept mode works the other way around. Points selected in this mode will be undeleted,
except data that has been deleted in NaviEdit, when the DTM is generated on the basis of a
connection to the NaviEdit database.
Data can be visualized in two different ways 1) Depth Mode and 2) Block Mode .
Depth mode is shown in Figure 3, right, whereas the same data are shown in block mode to
the right in the figure.
Figure 3 Depth Mode (left) versus Block Mode (right)
Another important visualization feature is the Clipping planes functionality through which it
is possible to isolate certain parts of the data from each other. This could for instance be in
connection with cleaning inside a trench or on both sides of a pipeline. The functionality is
invoked (and disabled) by pressing one of the two buttons (one clipping plane) or (two
clipping planes).
This is all visualized below in Figure 4, in which the cleaning situation with noise around a
pipeline and in front of a rock-dump area is shown without the clipping plane(s), left and with
clipping planes, right.

Data Cleaning in NaviModel3
EIVA NaviSuite Software Page 7 of 24 Rev. no. 0, 2012-02-01
Figure 4 Using Clipping Planes
The 3D editor includes a window in which the settings can be defined and visualized (see
Figure 5 above). This comprises the (vertical) scale, the size (in pixels) of the data-points as
well as grid-specific settings and light settings. An important setting is associated with the
‘Tool Toggling’ option. It is possible to choose between ‘Cycling’ and ‘Recent’ options. The
two options are associated with the tools ‘Navigation Mode’, ‘Erase Tool’ and ‘Region
Eraser’. ‘Cycling’ will enable toggling between the three tools in sequence by pressing the
space-bar. ‘Recent’ will toggle between the most recent of the ‘Erase Toll’ and ‘Region
Eraser’ together with ‘Navigation Mode’. The user should in other words choose the ‘Recent’
option if he/she has a clear favourite eraser tool and the ‘Cycling’ option if this is not the
case.
Figure 5 3D Editor Settings
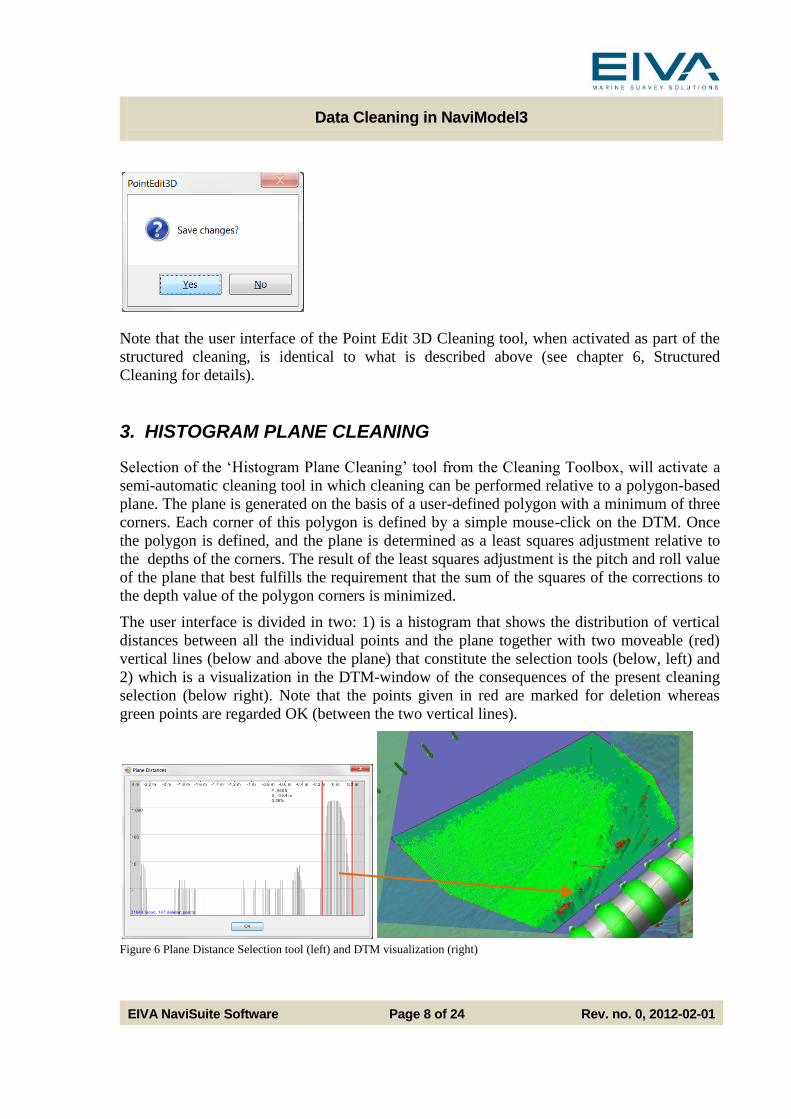
Once the editing is finalized, close the window and choose the ‘Yes’ option when prompted
to save the changes (see below). This will send the edited and cleaned data back to NM3
where a re-indexing of the area in question will take place.
Data Cleaning in NaviModel3
EIVA NaviSuite Software Page 8 of 24 Rev. no. 0, 2012-02-01
Note that the user interface of the Point Edit 3D Cleaning tool, when activated as part of the
structured cleaning, is identical to what is described above (see chapter 6, Structured
Cleaning for details).
3. HISTOGRAM PLANE CLEANING
Selection of the ‘Histogram Plane Cleaning’ tool from the Cleaning Toolbox, will activate a
semi-automatic cleaning tool in which cleaning can be performed relative to a polygon-based
plane. The plane is generated on the basis of a user-defined polygon with a minimum of three
corners. Each corner of this polygon is defined by a simple mouse-click on the DTM. Once
the polygon is defined, and the plane is determined as a least squares adjustment relative to
the depths of the corners. The result of the least squares adjustment is the pitch and roll value
of the plane that best fulfills the requirement that the sum of the squares of the corrections to
the depth value of the polygon corners is minimized.
The user interface is divided in two: 1) is a histogram that shows the distribution of vertical
distances between all the individual points and the plane together with two moveable (red)
vertical lines (below and above the plane) that constitute the selection tools (below, left) and
2) which is a visualization in the DTM-window of the consequences of the present cleaning
selection (below right). Note that the points given in red are marked for deletion whereas
green points are regarded OK (between the two vertical lines).
Figure 6 Plane Distance Selection tool (left) and DTM visualization (right)

Data Cleaning in NaviModel3
EIVA NaviSuite Software Page 9 of 24 Rev. no. 0, 2012-02-01
When first opened, NM3 will, as a guide, give proposed maximum and minimum. In order to
assist on the selection, the X-axis is equipped with units that shows the distance between
points and the plane at the top. At the bottom, the x-axis shows alphanumerically, the number
of accepted points as well as the number of points deleted with the current settings of the
maximum/minimum lines.
The Y-axis, in turn shows the number of points with a given distance to the plane, in a
histogram distribution visualization. The scale of the Y-axis is logarithmic (Log10) by
default, but it is also possible, by right-clicking in the window and choosing the menu-item
'Y-axis..' to change this to a Log2 based logarithmic scale or even to a linear scale. This is
visualized below in Figure 7, that shows identical data as well as cleaning settings with a
Log10 based Y-axis (left) and a linear scale (right).
Figure 7 Y-axis log10 based (left) and linear (right)
Upon completion the selections are accepted by pressing the ‘OK’ button. This action will
send the cleaned data back to NM3 where a re-indexing of the area covered by the plane in
question will take place.
Note that the user interface of the Histogram Plane Cleaning tool, when activated as part of
the structured cleaning, is identical to what is described above (see chapter 6, Structured
Cleaning for details).
4. SPIKE SHOOTING CLEANING
The concept of Spike Shooting cleaning is similar to that of Histograms Plane Cleaning,
except that the plane is a circle defined through a single point. The pitch and roll orientation
of the plane is furthermore determined as a least squares fit of the vertical value of the points
on the perimeter of the circle.

Data Cleaning in NaviModel3
EIVA NaviSuite Software Page 10 of 24 Rev. no. 0, 2012-02-01
The user interface is divided in two: 1) is a histogram that shows the distribution of vertical
distances between all the individual points and the plane together with two moveable (red)
vertical lines (below and above the plane) that constitute the selection tools (above, left) and
2) which is a visualization in the DTM-window of the consequences of the present cleaning
selection (below right).
All other aspects of this cleaning tool, is identical to those associated with the Histogram
Plane Cleaning Tool.
5. S-CAN AUTOMATIC CLEANING
NaviModel3 supports inclusions of dedicated, user-developed plug-ins for cleaning and anti-
noise determination. The S-CAN (SCALGO Combinatorial Anti Noise) cleaning tool is such
a plug-in. It has been developed in corporation with Center for Massive Data Algorithms
(MADALGO) at the University of Aarhus.
The development of the tool focused on automatic cleaning of the densely populated multi-
beam point-clouds, typically associated with pipe line surveys.
The S-CAN algorithm calculates an initial so-called ‘Noise Score’ for each data point in the
data-set, and the user can then easily and interactively clean parts of (or the whole) dataset by
selecting a region of the data and remove points with high noise scores. The S-CAN
algorithm calculates an initial so-called ‘Noise Score’ for each data point in the data-set, and
the user can then easily and interactively clean parts of (or the whole) dataset by selecting a
region of the data and remove points with high noise scores.
The S-CAN is capable of efficiently processing large datasets that do not match the
limitations of internal memory but must reside on disk. The constant movement of data to and
from disc during the cleaning is not a performance bottleneck and the algorithm can therefore
be regarded I/O-efficient. This is ideal in a NaviModel3 environment, since this is exactly the

Data Cleaning in NaviModel3
EIVA NaviSuite Software Page 11 of 24 Rev. no. 0, 2012-02-01
way data is organized, both the model-based data, through the governing Quad Tree
principle, and the raw data-points, with the latter being the subject of the cleaning.
The S-CAN plug-in comes in two different variants:
The Score variant
The Components variant
5.1 The S-CAN Components Variant
The S-CAN Components variant separates input observations into series of observations that
fulfil an internal requirement regarding a maximum tolerable height difference (threshold)
between neighbouring points. The series are termed ‘Surfaces’ in the S-CAN terminology.
The minimum height difference between points in a surface and the neighbours in adjacent
surfaces is consequently higher than the threshold.
The principles of the S-CAN Components variant are visualized below in Figure 8, where
three different threshold values are shown together with the consequences of choosing a
particular threshold for the cleaning.
It appears that a large threshold will separate data into few surfaces with high internal noise
(top right). A small threshold on the other hand will divide the observations into more
surfaces (bottom right).
Figure 8 Principles in the S-CAN Components variant
The first step of the cleaning is initiated by pressing the 'S-CAN Components' button in the
Cleaning Toolbox. The user is now prompted to choose selection tool in a way identical to
what is supported in connection with the Point Edit cleaning tool (described in detail in
chapter 2Point Edit 3D Cleaning above).
Either way however, once the selection is acceptable, the user will be prompted for threshold
value as well as for number of surfaces, as shown below. Appropriate numbers for this would

Data Cleaning in NaviModel3
EIVA NaviSuite Software Page 12 of 24 Rev. no. 0, 2012-02-01
be associated with the nature of the seabed and with the TVU accuracy of the survey system,
for the threshold value, whereas a value of 10 or less is normally adequate for the number of
surfaces.
Pressing the 'OK' button will start the initial determination of the score values as shown
below.
When the determination is completed and the user presses the 'OK' button, storage of the
components patch will take place. This is visualized in the Job List window as shown below,
left. Once the patch is stored, a new entry will appear in the 'Project Tree' window under the
Survey - Regions entry as shown below right.
This entry constitutes the link to the next cleaning step. Right-click on the filtered entry
(Components in the example) and choose between the two menu-items 'Clean Area
(Polygon)' and 'Clean Entire Area Enter' as shown below. Whereas the Clean Area (Polygon)
option will give the user the opportunity to choose to clean only parts of the area (selection

Data Cleaning in NaviModel3
EIVA NaviSuite Software Page 13 of 24 Rev. no. 0, 2012-02-01
with the mouse/cursor), the 'Clean entire area' will initiate the second part of the cleaning
immediately.
Figure 9 S-CAN Components variant, selection of surfaces
At this stage, the largest surfaces, in terms of population, are listed, in sequence, in the user
interface, to enable the user to choose which ones to keep as shown in Figure 9. The
consequences of a selection of a surface or a number of surfaces is at the same time
visualized instantly in the DTM window as shown in the figure to the right. Note that double-
clicking on one of the surfaces in the 'Surfaces' selection window will make NM3 jump and
zoom to its position.
Upon completion the surface selections are accepted by pressing the ‘OK’ button. This action
will send the cleaned data back to NM3 where a re-indexing of the area in question will take
place.
Note that if the user decides that the threshold used will not yield acceptable results for the
cleaning, a new score determination, with a revised threshold must take place.
Data Cleaning in NaviModel3
EIVA NaviSuite Software Page 14 of 24 Rev. no. 0, 2012-02-01
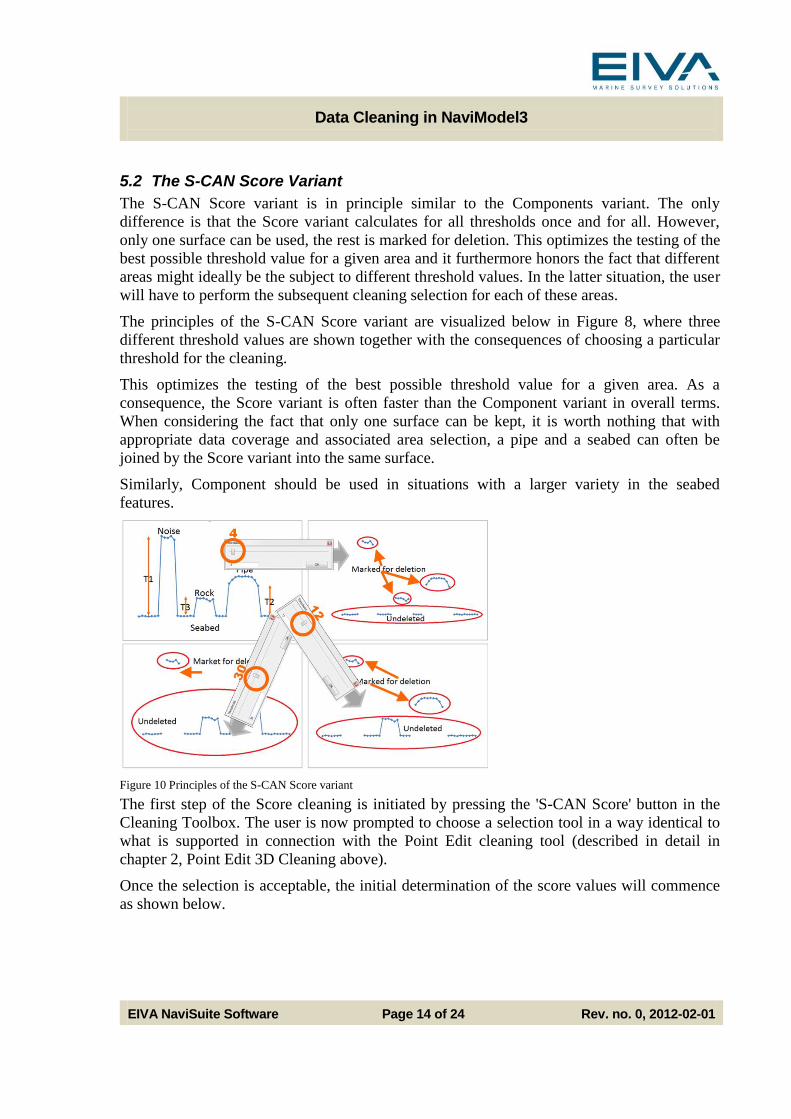
5.2 The S-CAN Score Variant
The S-CAN Score variant is in principle similar to the Components variant. The only
difference is that the Score variant calculates for all thresholds once and for all. However,
only one surface can be used, the rest is marked for deletion. This optimizes the testing of the
best possible threshold value for a given area and it furthermore honors the fact that different
areas might ideally be the subject to different threshold values. In the latter situation, the user
will have to perform the subsequent cleaning selection for each of these areas.
The principles of the S-CAN Score variant are visualized below in Figure 8, where three
different threshold values are shown together with the consequences of choosing a particular
threshold for the cleaning.
This optimizes the testing of the best possible threshold value for a given area. As a
consequence, the Score variant is often faster than the Component variant in overall terms.
When considering the fact that only one surface can be kept, it is worth nothing that with
appropriate data coverage and associated area selection, a pipe and a seabed can often be
joined by the Score variant into the same surface.
Similarly, Component should be used in situations with a larger variety in the seabed
features.
Figure 10 Principles of the S-CAN Score variant
The first step of the Score cleaning is initiated by pressing the 'S-CAN Score' button in the
Cleaning Toolbox. The user is now prompted to choose a selection tool in a way identical to
what is supported in connection with the Point Edit cleaning tool (described in detail in
chapter 2, Point Edit 3D Cleaning above).
Once the selection is acceptable, the initial determination of the score values will commence
as shown below.
Data Cleaning in NaviModel3
EIVA NaviSuite Software Page 15 of 24 Rev. no. 0, 2012-02-01
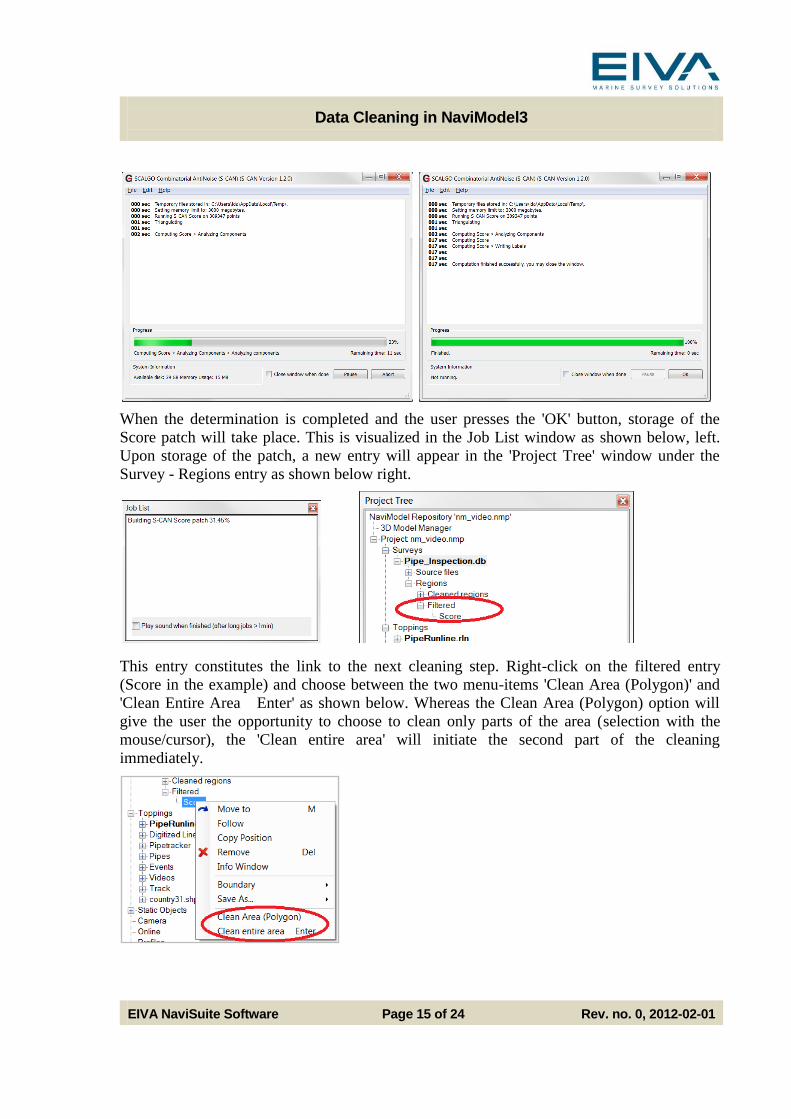
When the determination is completed and the user presses the 'OK' button, storage of the
Score patch will take place. This is visualized in the Job List window as shown below, left.
Upon storage of the patch, a new entry will appear in the 'Project Tree' window under the
Survey - Regions entry as shown below right.
This entry constitutes the link to the next cleaning step. Right-click on the filtered entry
(Score in the example) and choose between the two menu-items 'Clean Area (Polygon)' and
'Clean Entire Area Enter' as shown below. Whereas the Clean Area (Polygon) option will
give the user the opportunity to choose to clean only parts of the area (selection with the
mouse/cursor), the 'Clean entire area' will initiate the second part of the cleaning
immediately.

Data Cleaning in NaviModel3
EIVA NaviSuite Software Page 16 of 24 Rev. no. 0, 2012-02-01
Figure 11 S-CAN Score variant, selection of threshold
When the area selection is performed, the user is presented with a slider, through which it is
possible to define the threshold. This can also be done by manual insertion in the threshold
box as shown in Figure 11. The consequences of a threshold selection is at the same time
visualized instantly in the DTM window as shown in the figure to the right.
Upon completion the threshold selection is accepted by pressing the ‘OK’ button. This will
send the cleaned data back to NM3 where a re-indexing of the area in question will take
place.
Note that, as opposed to what was the case in connection with the Components variant, a re-
determination of the threshold value is never required for the Score variant. The downside of
this is that if it is not possible to find a solution that will remove all undesired data and at the
same time keep all data of relevance, the Components variant must be used.
Most often combining the two variants will yield an optimum solution, with Score being used
as priority 1, because of its effectiveness, and Components used in the remaining, more
complex areas. In many situations, even the manual cleaning tools might be brought into use
as a finishing remedy.
5.3 S-CAN Cleaning During Import of Data
NaviModel3 includes a functionality that allows the user to perform automatic cleaning,
using the S-CAN Score variant, during import of data onto a DTM. The settings to apply can
be defined by pressing the 'Options...' button on the DTM settings dialogue, that constitutes
the first step of the importing.

Data Cleaning in NaviModel3
EIVA NaviSuite Software Page 17 of 24 Rev. no. 0, 2012-02-01
NaviModel3 will start indexing the model, based on the data that is used to generate the
model. Once this has been accomplished, the cleaning process will commence automatically.
NM3 will, line-by-line (or file-by-file), first calculate the score values, line-by-line (or file-
by-file) and then it will apply the score threshold.
Since the cleaning does not take information from overlaps between files into consideration,
the feature must be considered particularly useful in connection with route surveys, with no
overlap between files in the sailing direction.
A special variation of the file-by-file Score cleaning can be conducted from the 'Project Tree'
window, under the Surveys - Source Files entry as shown below. By right-clicking on a
source file and choosing the menu-item Calculate 'S-CAN Score', determination of the initial
score values, associated with the particular source file, will automatically commence.

Data Cleaning in NaviModel3
EIVA NaviSuite Software Page 18 of 24 Rev. no. 0, 2012-02-01
When subsequently choosing the menu-item 'Clean Block', the threshold selection slider bar
will appear, thus enabling the second part of the Score cleaning.
5.4 The S-CAN Control Panel
The S-CAN Control Panel, accessed from the Cleaning Toolbox facilitates the definition of
various settings for the execution of the S-CAN automatic cleaning functionalities. The items
to be defined are:
Location of temporary data is used whenever the data to be cleaned can not be
contained in the RAM of the computer. To optimize the performance, it is
recommended that the temporary/swap file is located on a fast and large storage
medium
Action to take when available space drops below a given threshold is also used to
optimize the performance of S-CAN
Maximum memory use should be used with care. On the one hand side it is important
to have as much capacity assigned for the S-CAN algorithm as possible, however, as
it is stated in the dialogue: the amount allocated ... Should preferably be close to, but
less than the available amount of physical memory... available
6. STRUCTURED CLEANING
Structured Cleaning is initiated from a displayline (.dis) object in the ‘Project Tree’ window.
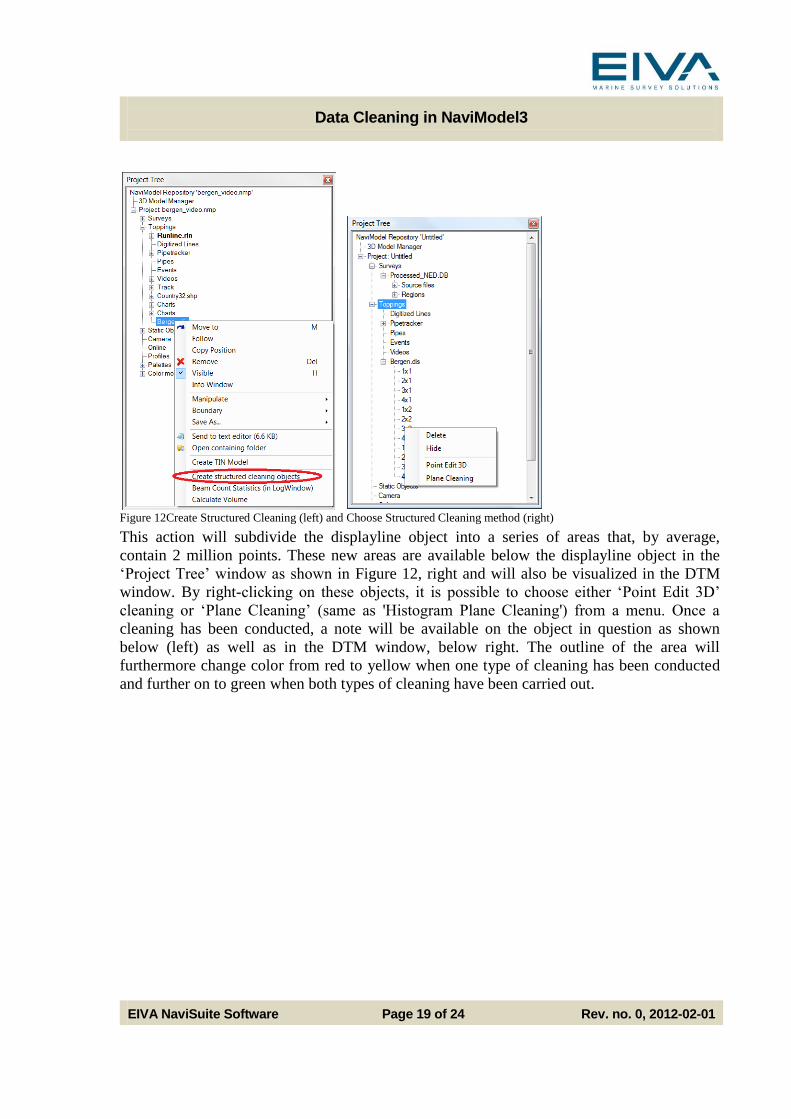
Right-click on the displayline in the window and choose the menu-item ‘Create Structured
Cleaning Objects’ as shown in Figure 12, below left.
Data Cleaning in NaviModel3
EIVA NaviSuite Software Page 19 of 24 Rev. no. 0, 2012-02-01
Figure 12Create Structured Cleaning (left) and Choose Structured Cleaning method (right)
This action will subdivide the displayline object into a series of areas that, by average,
contain 2 million points. These new areas are available below the displayline object in the
‘Project Tree’ window as shown in Figure 12, right and will also be visualized in the DTM
window. By right-clicking on these objects, it is possible to choose either ‘Point Edit 3D’
cleaning or ‘Plane Cleaning’ (same as 'Histogram Plane Cleaning') from a menu. Once a
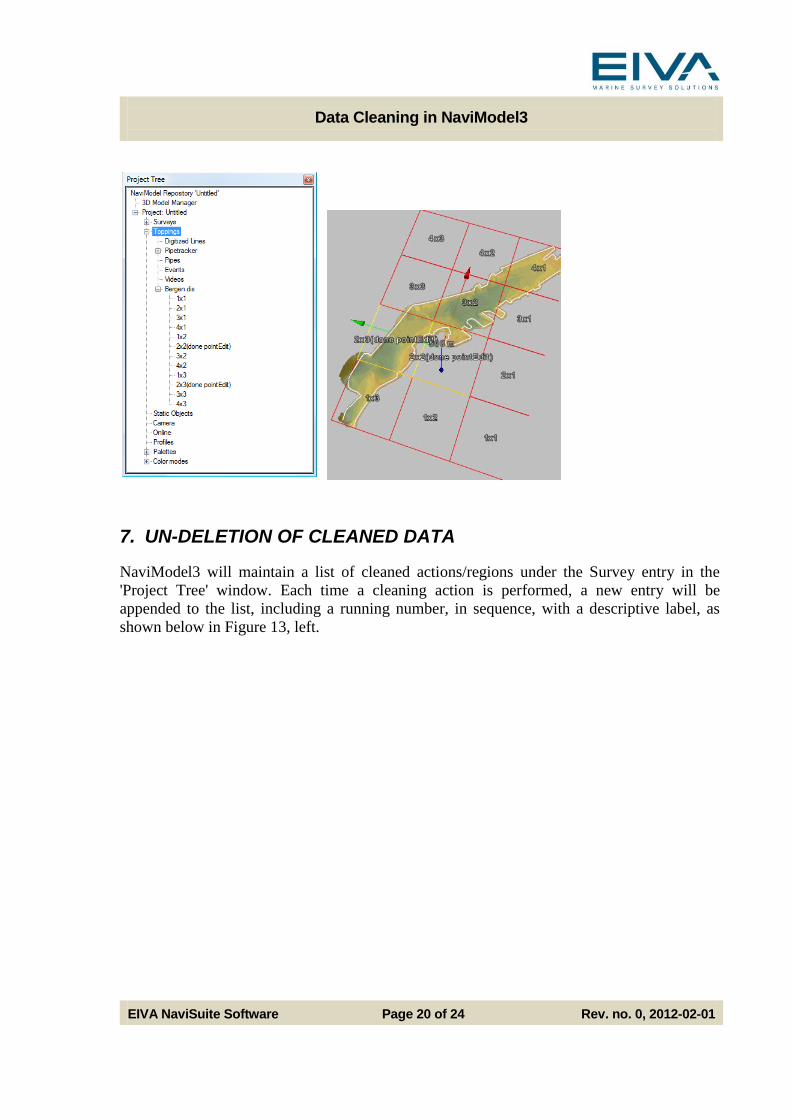
cleaning has been conducted, a note will be available on the object in question as shown
below (left) as well as in the DTM window, below right. The outline of the area will
furthermore change color from red to yellow when one type of cleaning has been conducted
and further on to green when both types of cleaning have been carried out.
Data Cleaning in NaviModel3
EIVA NaviSuite Software Page 20 of 24 Rev. no. 0, 2012-02-01
7. UN-DELETION OF CLEANED DATA
NaviModel3 will maintain a list of cleaned actions/regions under the Survey entry in the
'Project Tree' window. Each time a cleaning action is performed, a new entry will be
appended to the list, including a running number, in sequence, with a descriptive label, as
shown below in Figure 13, left.

Data Cleaning in NaviModel3
EIVA NaviSuite Software Page 21 of 24 Rev. no. 0, 2012-02-01
Figure 13 Housekeeping of the Cleaning Actions, left and visualization of point (Good and Deleted), right
Right-clicking on one of the entries with give the menu shown in the figure, left. From here it
is possible to move to the area in question, by choosing 'Move To'. Once this has been
accomplished, the 'Toggle Raw Points on/off' option in the NaviModel3 Standard Toolbar
will give a good visualization of the raw points, including the deleted ones, associated with
the cleaning action: the latter is visualized in Figure 13, right, in which the deleted points are
shown as black and the accepted ones are visualized relative to their depths.
When highlighting a cleaning entry, the properties will be shown in the 'Properties' window
as shown above. In the example it appears that the cleaned region contains 450646 accepted
points and 11800 deleted ones.
NaviModel3 will in other words not actually delete the raw points when a cleaning action is
conducted. It will merely mark or flag the points as deleted. As a consequence of this, the
software facilitates un-deletion of cleaned points.

Data Cleaning in NaviModel3
EIVA NaviSuite Software Page 22 of 24 Rev. no. 0, 2012-02-01
Figure 14 Deleted/cleaned versus filtered data in the DTM window (left) and definition of colour (right)
In that context a distinguishing between filtered data and cleaned data must be observed.
Filtered data are data that have been cleaned in NaviEdit, prior to being loaded into
NaviModel3, whereas deleted data (or cleaned data) are data that have been cleaned within
NaviModel3. As shown in Figure 14 above, it is possible to visualize whether points have
been the subject of filtering or of cleaning, by changing their view settings in the 'View
Settings' window. In the example, the deleted points are shown as black, whereas the filtered
points have been given the colour 'Firebrick'.
The un-deletion functionalities implemented into NaviModel3 are only associated with the
deleted/cleaned data.
Un-deletion can be performed in different ways:
By deleting the cleaned region entry in the 'Project Tree' window (by using the 'remove'
option)
By choosing one of the un-delete features included in the Cleaning Toolbox ('Undelete
(Polygon)' and 'Undelete Everything...')
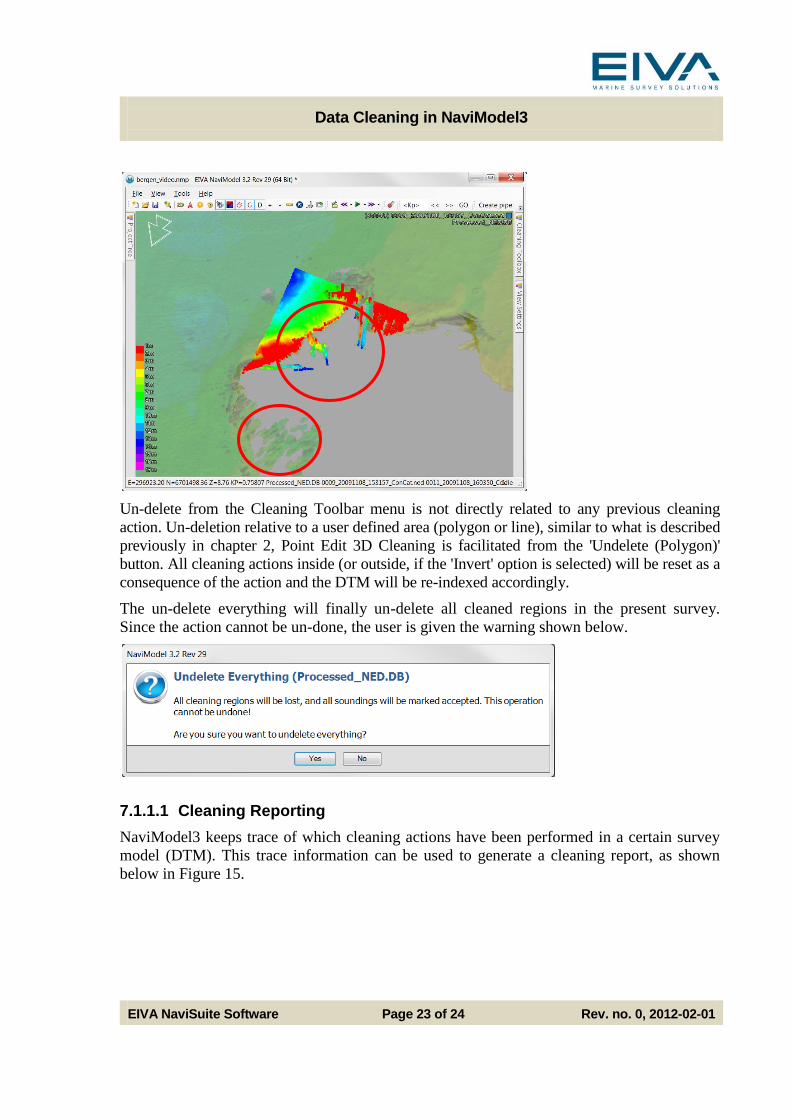
When choosing the first option NaviModel3 will remove the cleaning entry from the 'Project
Tree' window and re-index the DTM with the 'new' data. This is visualized below, in which
the data marked as deleted in Figure 13, has been un-deleted. Observe how not only data that
is shown as raw has been undeleted, but also DTM data in the lower left window has been
recovered (visualized with red circles).
Data Cleaning in NaviModel3
EIVA NaviSuite Software Page 23 of 24 Rev. no. 0, 2012-02-01
Un-delete from the Cleaning Toolbar menu is not directly related to any previous cleaning
action. Un-deletion relative to a user defined area (polygon or line), similar to what is described
previously in chapter 2, Point Edit 3D Cleaning is facilitated from the 'Undelete (Polygon)'
button. All cleaning actions inside (or outside, if the 'Invert' option is selected) will be reset as a
consequence of the action and the DTM will be re-indexed accordingly.
The un-delete everything will finally un-delete all cleaned regions in the present survey.
Since the action cannot be un-done, the user is given the warning shown below.
7.1.1.1 Cleaning Reporting
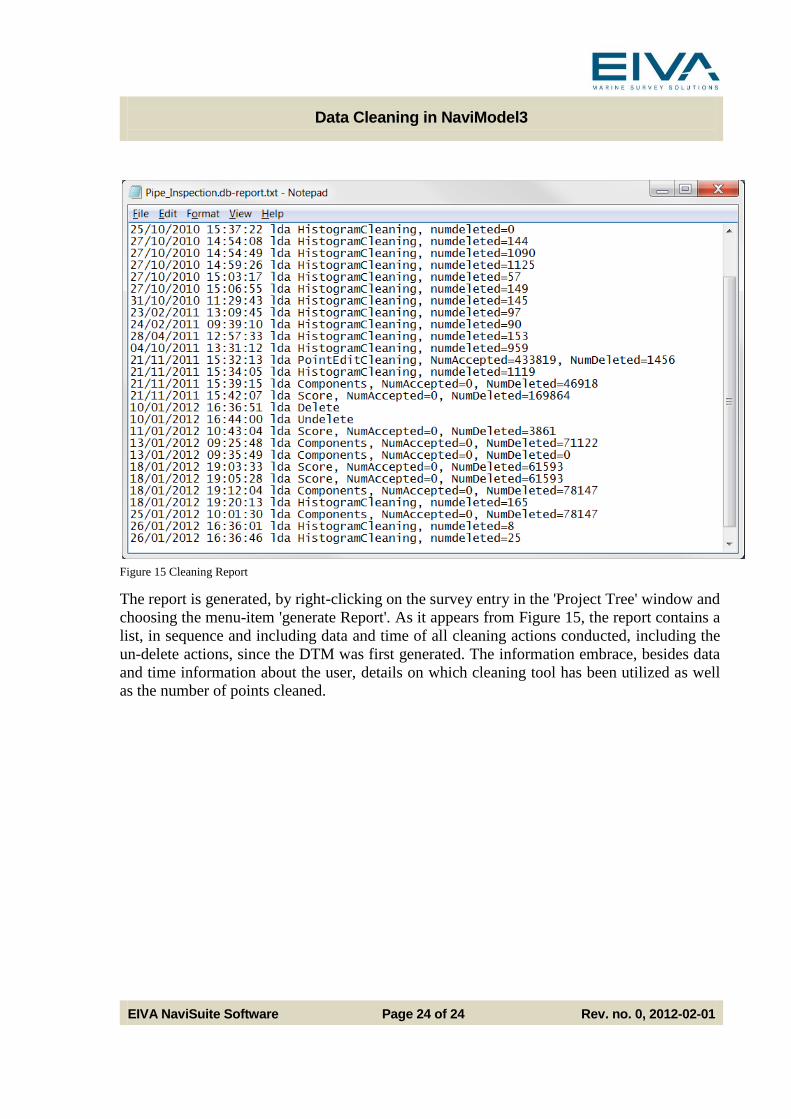
NaviModel3 keeps trace of which cleaning actions have been performed in a certain survey
model (DTM). This trace information can be used to generate a cleaning report, as shown
below in Figure 15.
Data Cleaning in NaviModel3
EIVA NaviSuite Software Page 24 of 24 Rev. no. 0, 2012-02-01
Figure 15 Cleaning Report
The report is generated, by right-clicking on the survey entry in the 'Project Tree' window and
choosing the menu-item 'generate Report'. As it appears from Figure 15, the report contains a
list, in sequence and including data and time of all cleaning actions conducted, including the
un-delete actions, since the DTM was first generated. The information embrace, besides data
and time information about the user, details on which cleaning tool has been utilized as well
as the number of points cleaned.