Data Centre risk inDex - Cushman &...
36
DATA CENTRE RISK INDEX Informing global investment decisions 2013
Transcript of Data Centre risk inDex - Cushman &...

Data Centre risk inDexInforming global investment decisions
2013
Data Centre risk inDex
1
antiCiPatinG risks
Data centre downtime can potentially cost millions in lost revenue and compensation; it can even threaten the livelihood of a business by causing irreparable damage to its reputation. The Data Centre Risk Index assesses various macro level risks – physical, economic and social, that could cause a threat to service continuity and uptime.
2012 will be remembered, in the US in particular, as the year of Hurricane Sandy. New York and New Jersey saw the worst of the conditions in the US and the cost of damage reached over US$75 billion making it the second-costliest hurricane in US history. Large parts of the East Coast were without power for over a week and as a result many data centres were rendered completely offline as their support infrastructure was also compromised.
Although the Data Centre Risk Index clearly demonstrates that some countries provide a better overall environment for data centres, commercial considerations are typically a key driver, the need to be in a particular territory will often take precedence over the risks highlighted by the Index. By definition, the Data Centre Risk Index allows business decision makers to anticipate the risks and put in place appropriate measures to mitigate and manage accordingly.
The Index is a unique tool, bringing together all the risks and weighting them to create a balanced and comprehensive risk assessment methodology. All our information is sourced from reputable and published third party sources.
The Data Centre Risk Index ranks countries according to a number of risk factors that would affect a typical data centre operation.
The Index is designed to assist companies in making strategic investment and operational decisions about where to locate their data, whether it be server rack deployments or the creation of brand new facilities. Each country has its own risk profile which should be reviewed against the commercial opportunity, business requirement and the company’s preference for risk aversion.
2013
2
ChanGes for the 2013 Data Centre risk inDex
New PartNer.
In this third release of the Index, hurleypalmerflatt and Cushman & Wakefield have teamed with Source8. Source8 are a recognised leading consultancy practise in IT infrastructure and security. Their experience in providing specific end to end services to support the strategy, planning, design and implementation of technical infrastructure, is a valuable addition to the team.
Data aNalysis & review:
information sources:Countries, risks and weightings remain as per the 2012 index. In respect of the information sources we constantly monitor the best possible third party information. Consequently for the 2013 edition we have drawn additional available intelligence from Eurostat and PwC.
Data Centre risk inDex
3
What the inDex ComPrises
tHe risKs. The Data Centre Risk Index identifies the top risks likely to affect the successful operation of a data centre, and applies an individual weighting to those risks to create a balanced view and ranking of the thirty selected countries.
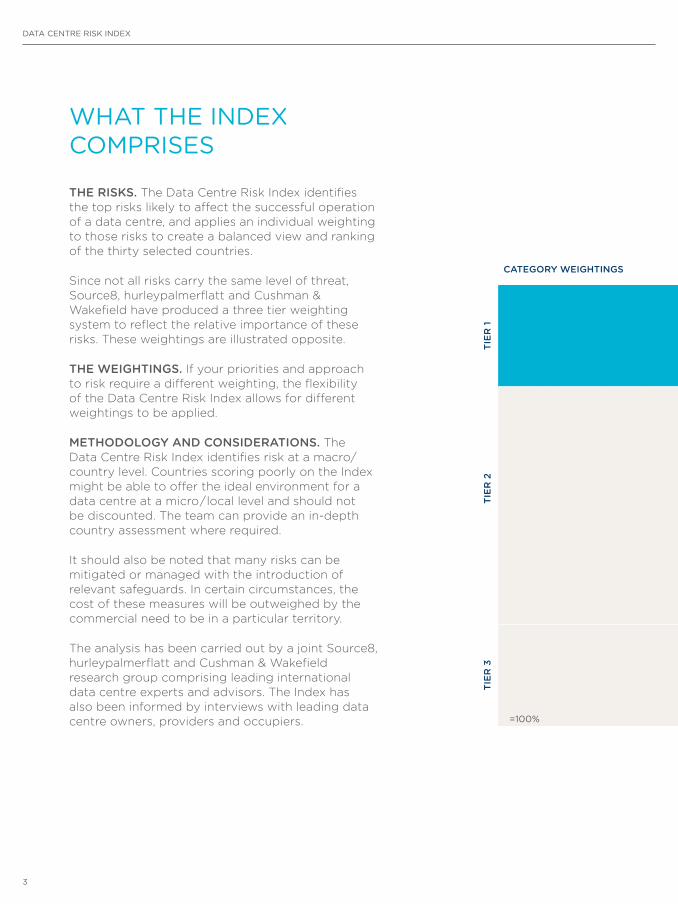
Since not all risks carry the same level of threat, Source8, hurleypalmerflatt and Cushman & Wakefield have produced a three tier weighting system to reflect the relative importance of these risks. These weightings are illustrated opposite.
tHe weigHtiNgs. If your priorities and approach to risk require a different weighting, the flexibility of the Data Centre Risk Index allows for different weightings to be applied.
MetHoDology aND coNsiDeratioNs. The Data Centre Risk Index identifies risk at a macro/country level. Countries scoring poorly on the Index might be able to offer the ideal environment for a data centre at a micro / local level and should not be discounted. The team can provide an in-depth country assessment where required.
It should also be noted that many risks can be mitigated or managed with the introduction of relevant safeguards. In certain circumstances, the cost of these measures will be outweighed by the commercial need to be in a particular territory.
The analysis has been carried out by a joint Source8, hurleypalmerflatt and Cushman & Wakefield research group comprising leading international data centre experts and advisors. The Index has also been informed by interviews with leading data centre owners, providers and occupiers.
category weigHtiNgs sUB-category weigHtiNgs
tier
1
33%
Energy – cost per kWh Source: Eurostat, C&W, HPF
33%
International internal bandwidth – mbps Source: ITU, Source8
60% 33%
Ease of doing business Source: World Bank
tier
2
12%
Corporation tax Source: Deloitte, PwC
8%
Labour – cost of labour / hour Source: EIU
20%
Political stability Source: EIU
10%
Sustainability – % energy from alternatives Source: International Energy Agency
25%
Natural disasters Source: Maplecroft
10%
Population education level Source: Barrow-Lee
35% 15%
Energy security Source: Maplecroft
tier
3
25%
GDP per capita Source: EIU
25%
Inflation Source: EIU
=100% 5% 50%
Water – availability per capita Source: Food and Agriculture Organization of the United Nations

2013
4
category weigHtiNgs sUB-category weigHtiNgs
tier
1
33%
Energy – cost per kWh Source: Eurostat, C&W, HPF
33%
International internal bandwidth – mbps Source: ITU, Source8
60% 33%
Ease of doing business Source: World Bank
tier
2
12%
Corporation tax Source: Deloitte, PwC
8%
Labour – cost of labour / hour Source: EIU
20%
Political stability Source: EIU
10%
Sustainability – % energy from alternatives Source: International Energy Agency
25%
Natural disasters Source: Maplecroft
10%
Population education level Source: Barrow-Lee
35% 15%
Energy security Source: Maplecroft
tier
3
25%
GDP per capita Source: EIU
25%
Inflation Source: EIU
=100% 5% 50%
Water – availability per capita Source: Food and Agriculture Organization of the United Nations

Data Centre risk inDex
Data Centre risk maP
low risk
medium risk
high risk
Rank
Keys
1
5
30
27

tHe coUNtries. Source8, hurleypalmerflatt and Cushman & Wakefield have selected thirty countries for the Data Centre Risk Index, representing established data centre locations, emerging markets and a mix of key regional centres.
The Index is based on a flexible risk assessment methodology and it can be applied to any country in the world.
20
24
4
2
7
3
106
9
8
1114
12
13
19
18
15
16
2621
17
23
22
25
29
28
Data Centre risk inDex
7
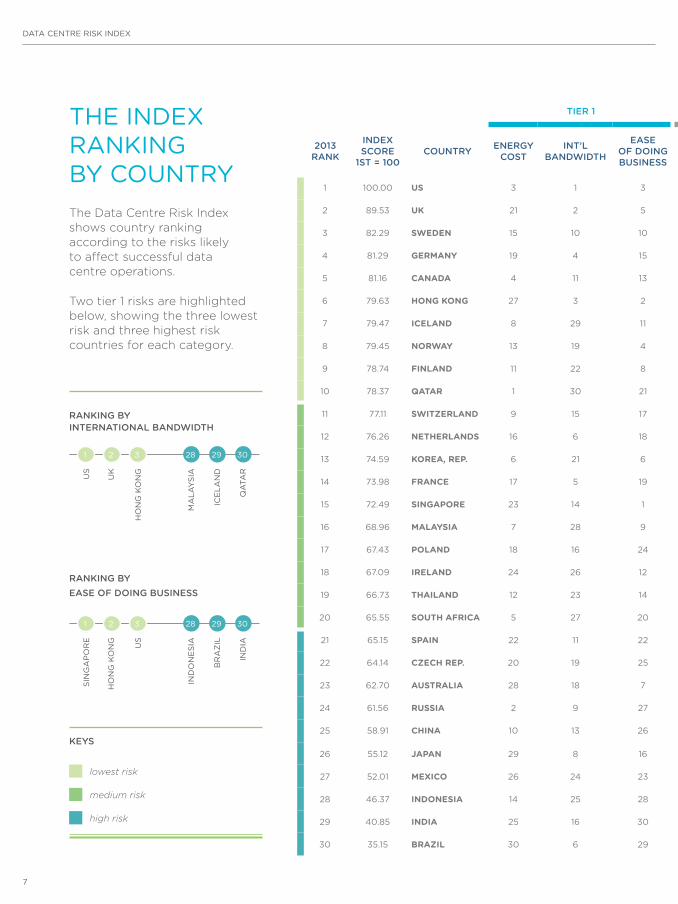
the inDex rankinG by CountryThe Data Centre Risk Index shows country ranking according to the risks likely to affect successful data centre operations.
Two tier 1 risks are highlighted below, showing the three lowest risk and three highest risk countries for each category.
tier 1 tier 2 tier 3
2013 raNK
iNDex score
1st = 100coUNtry eNergy
costiNt’l
BaNDwiDtH
ease oF DoiNg BUsiNess
corPo-ratioN
tax
cost oF laBoUr
Political staBility
sUstaiN-aBility
NatUral Disaster
eDUca-tioN
eNergysecU-rity
gDP Per
caPita
iNFla-tioN
water availaBilty
2012 raNK
Posi-tioN
cHaNge
1 100.00 US 3 1 3 30 18 20 20 29 1 17 8 10 11 1 0
2 89.53 UK 21 2 5 12 16 15 26 12 13 23 17 17 21 2 0
3 82.29 Sweden 15 10 10 11 26 3 4 3 9 15 6 4 9 8 5
4 81.29 Germany 19 4 15 25 25 8 15 9 16 20 15 10 24 3 -1
5 81.16 Canada 4 11 13 19 20 2 10 23 2 1 7 5 2 5 0
6 79.63 HonG KonG 27 3 2 4 9 10 28 16 23 29 5 22 22 7 1
7 79.47 ICeland 8 29 11 8 21 20 1 18 7 8 14 24 1 4 -3
8 79.45 norway 13 19 4 19 30 1 3 15 12 6 2 3 3 12 4
9 78.74 FInland 11 22 8 13 24 3 7 1 15 30 12 20 7 9 0
10 78.37 Qatar 1 30 21 2 28 12 30 2 19 7 1 8 30 6 -4
11 77.11 SwItzerland 9 15 17 1 29 5 9 13 18 11 3 1 13 10 -1
12 76.26 netHerlandS 16 6 18 15 22 10 23 5 10 16 11 16 15 14 2
13 74.59 Korea, rep. 6 21 6 13 13 19 12 20 8 26 19 12 19 13 0
14 73.98 FranCe 17 5 19 27 23 20 17 10 20 18 16 12 18 11 -3
15 72.49 SInGapore 23 14 1 5 14 17 29 4 17 22 9 26 29 17 2
16 68.96 malaySIa 7 28 9 15 8 26 22 19 26 3 25 7 8 19 3
17 67.43 poland 18 16 24 6 10 13 18 7 21 24 22 21 25 22 5
18 67.09 Ireland 24 26 12 3 19 15 24 14 6 21 13 6 10 16 -2
19 66.73 tHaIland 12 23 14 8 3 29 8 22 22 14 28 18 14 15 -4
20 65.55 SoUtH aFrICa 5 27 20 19 7 29 13 8 30 10 26 29 28 18 -2
21 65.15 SpaIn 22 11 22 22 15 24 14 11 10 25 18 14 20 21 0
22 64.14 CzeCH rep. 20 19 25 6 12 7 19 6 24 12 20 19 27 25 3
23 62.70 aUStralIa 28 18 7 22 27 6 21 21 5 2 4 8 6 23 0
24 61.56 rUSSIa 2 9 27 8 6 26 27 24 4 5 21 27 5 24 0
25 58.91 CHIna 10 13 26 15 5 18 11 25 27 13 27 15 23 26 1
26 55.12 Japan 29 8 16 29 17 8 25 30 3 27 10 2 17 20 -6
27 52.01 mexICo 26 24 23 22 2 25 16 27 14 9 24 22 16 27 0
28 46.37 IndoneSIa 14 25 28 15 1 28 5 26 29 4 29 25 12 28 0
29 40.85 IndIa 25 16 30 28 4 13 6 28 28 28 30 30 26 29 0
30 35.15 BrazIl 30 6 29 26 11 23 2 17 25 19 23 28 4 30 0
raNKiNg By iNterNatioNal BaNDwiDtH
raNKiNg By ease oF DoiNg BUsiNess
lowest risk
medium risk
high risk
Keys
sin
Ga
Po
re
us
inD
on
esi
am
ala
ysi
a
ho
nG
ko
nG
uk
br
az
iliC
ela
nD
us
ho
nG
ko
nG
inD
iaq
ata
r
1
1
28
28
2
2
29
29
3
3
30
30

2013
8
tier 1 tier 2 tier 3
2013 raNK
iNDex score
1st = 100coUNtry eNergy
costiNt’l
BaNDwiDtH
ease oF DoiNg BUsiNess
corPo-ratioN
tax
cost oF laBoUr
Political staBility
sUstaiN-aBility
NatUral Disaster
eDUca-tioN
eNergysecU-rity
gDP Per
caPita
iNFla-tioN
water availaBilty
2012 raNK
Posi-tioN
cHaNge
1 100.00 US 3 1 3 30 18 20 20 29 1 17 8 10 11 1 0
2 89.53 UK 21 2 5 12 16 15 26 12 13 23 17 17 21 2 0
3 82.29 Sweden 15 10 10 11 26 3 4 3 9 15 6 4 9 8 5
4 81.29 Germany 19 4 15 25 25 8 15 9 16 20 15 10 24 3 -1
5 81.16 Canada 4 11 13 19 20 2 10 23 2 1 7 5 2 5 0
6 79.63 HonG KonG 27 3 2 4 9 10 28 16 23 29 5 22 22 7 1
7 79.47 ICeland 8 29 11 8 21 20 1 18 7 8 14 24 1 4 -3
8 79.45 norway 13 19 4 19 30 1 3 15 12 6 2 3 3 12 4
9 78.74 FInland 11 22 8 13 24 3 7 1 15 30 12 20 7 9 0
10 78.37 Qatar 1 30 21 2 28 12 30 2 19 7 1 8 30 6 -4
11 77.11 SwItzerland 9 15 17 1 29 5 9 13 18 11 3 1 13 10 -1
12 76.26 netHerlandS 16 6 18 15 22 10 23 5 10 16 11 16 15 14 2
13 74.59 Korea, rep. 6 21 6 13 13 19 12 20 8 26 19 12 19 13 0
14 73.98 FranCe 17 5 19 27 23 20 17 10 20 18 16 12 18 11 -3
15 72.49 SInGapore 23 14 1 5 14 17 29 4 17 22 9 26 29 17 2
16 68.96 malaySIa 7 28 9 15 8 26 22 19 26 3 25 7 8 19 3
17 67.43 poland 18 16 24 6 10 13 18 7 21 24 22 21 25 22 5
18 67.09 Ireland 24 26 12 3 19 15 24 14 6 21 13 6 10 16 -2
19 66.73 tHaIland 12 23 14 8 3 29 8 22 22 14 28 18 14 15 -4
20 65.55 SoUtH aFrICa 5 27 20 19 7 29 13 8 30 10 26 29 28 18 -2
21 65.15 SpaIn 22 11 22 22 15 24 14 11 10 25 18 14 20 21 0
22 64.14 CzeCH rep. 20 19 25 6 12 7 19 6 24 12 20 19 27 25 3
23 62.70 aUStralIa 28 18 7 22 27 6 21 21 5 2 4 8 6 23 0
24 61.56 rUSSIa 2 9 27 8 6 26 27 24 4 5 21 27 5 24 0
25 58.91 CHIna 10 13 26 15 5 18 11 25 27 13 27 15 23 26 1
26 55.12 Japan 29 8 16 29 17 8 25 30 3 27 10 2 17 20 -6
27 52.01 mexICo 26 24 23 22 2 25 16 27 14 9 24 22 16 27 0
28 46.37 IndoneSIa 14 25 28 15 1 28 5 26 29 4 29 25 12 28 0
29 40.85 IndIa 25 16 30 28 4 13 6 28 28 28 30 30 26 29 0
30 35.15 BrazIl 30 6 29 26 11 23 2 17 25 19 23 28 4 30 0
Data Centre risk inDex
9
reGional hiGhliGhts: emea
ecoNoMy. Europe's sovereign debt crisis remains perhaps the biggest risk facing the global economy – particularly as it affects confidence – but the euro zone is potentially in a stronger position now than it has been for some time, despite Cypriot woes. The huge social and financial impacts of a euro collapse have been recognised and there is a somewhat greater confidence that a longer term solution can be found.
Generating jobs and growth will be an increasing focus for European policymakers, but an overall solution to the debt crisis will still require ongoing austerity, albeit probably at a slower pace than in 2012. The European Central Bank (ECB) is now playing a central role in placating markets through various interventions and this has restored some confidence to deal with Europe’s underlying structural issues going forward. On the risk side adverse fallout from elections in both Italy and Germany this year may impair progress made thus far.
Nevertheless, while significant downside risks remain, a “muddle through," rather than a breakup of the Euro zone is increasingly the expected outcome.
MarKet. Despite the uncertainty, the data centre community has adopted a positive stance, albeit with a good dose of realism. Demand for colocation space and managed services has continued reflective of wider IT industry growth at a global level. Established players continue to invest and dominate market share but innovation in design and a better understanding of the industry and data centres as an asset class is seeing more investment by new entrants. However occupier demand remains conservative and well below peak activity prior to the financial crisis – a function of both limited capital budgets but also efficiencies in technology. The result is that the big wholesale deals are now the exception to the norm.
Despite the economic environment, data centre demand has remained steady. Power and infrastructure policies at a country level will be increasingly important in the medium term and will have a direct effect on future data centre deployment decision-making involving significant capital spend by enterprise customers.

2013
10
We remain of the opinion that we expressed in our 2012 edition that companies still need to continue to invest in IT to enhance internal systems and remain competitive in their market place. This is underpinned by the continued technological developments, the exponential increase in data and device adoption rates. We will therefore continue to see a proliferation of new or expanded data centres in the major economic hubs and an increasing number of parties wanting to gain product or financial exposure to the industry.
coNNectivity. Europe is expected to experience strong investment in international telecommunications infrastructure heavily driven by increased internet usage encouraged by the commercial deployment of 4G mobile networks and super-fast internet projects. Business will continue moving applications and data to private cloud services hosted remotely and with increasing confidence will move less critical services to the public cloud. This will also increase the demand for data network connectivity and related data centre space within these markets.
The accelerated development of the telecommunications market in Africa will continue, driven mainly by demand for mobile telephony & related services, enabled by further improvement in international connectivity with new submarine cables (BRICS, WASACE, and Saex) expected to go live in the region in 2013/14. However, the limited availability of dedicated ICT infrastructure to support business will inhibit economic development of the region, and an opportunity for service providers that are willing to invest in improving inland data network services and data centre facilities exists.
The Arab Spring not only affected the political landscape of the Middle East but also produced a dramatic impact on the telecommunication sector, in particular the visibility and upsurge in use of social media, mobile usage and market liberalisation initiated in some countries. The telecoms infrastructure varies enormously from country to country in terms of coverage and capability, and during 2013 this difference is expected to grow rather than decline, with areas such as Israel and Persian Gulf benefiting from new submarine cables such as Jonah, Tamares North and GBICS.
tHe “wHolo” MarKet. Reflecting the weaker demand trends mentioned above, providers are now positioning themselves to secure whatever market share they can. Traditionally the market saw two distinct segments – colocation (or retail) and wholesale. What is abundantly clear is that this distinction is now being diluted and irrespective of the requirement the pool of providers available for a given deployment has widened in terms of the provision of space and adjusting their product sets.
There are still differences and vendor selling points need to be acknowledged such as connectivity and availability of managed services – to that extent pricing differentials still exist when acquiring space and power. However there remains a consistent downward pressure on pricing and increased competition which has ensured that in the majority of mature markets, the occupier remains in a reasonably strong negotiating position.

Data Centre risk inDex
11
oPeratioNal cost FocUs. In our 2012 Risk Index we raised the issue of occupiers seeking to reduce their operational costs. This remains a priority for all and the data centre industry remains focused on this issue across the board. It is absolutely important that when assessing needs or selling an offering that close attention is paid to the Total Cost of Ownership, particularly for long term commitments. We would therefore encourage the industry going forward to openly discuss, as best as possible, the lifecycle costs and contractual liabilities of their current and future data centre operations. In turn this will support quicker, more transparent negotiations, business approvals and by definition speed up deployment time.
Power secUrity/UNit PriciNg. Energy pricing and availability remains crucial to organisations' data centre deployment and this is one area that the mature data centre markets are lagging behind other European locations particularly the Scandinavian countries which have been successful in securing some large date centre deployments. The UK, France and others are facing a generation supply gap and clear strategy and investment policy is required from their respective governments.

2013
12
A number of organisations are considering how to use their standby generating infrastructure as an input to the power grid and how the payment mechanisms available impact the overall total cost of ownership. We expect to see further developments in 2013 in this area as organisations seek opportunities make the installations more efficient.
January 2013 also saw the commencement of Phase 3 of the EU Emission Trading Scheme which affects organisations operating in the EU which have generating plant with a thermal input above 20MW in aggregate. Put simply a data centre with 4No 2,000kW generators would fall into the scheme. Many operators are not aware of this legislation nor that financial penalties apply.
It will be interesting to see how organisations respond to this legislation over the year.
coNclUsioN. We remain of the opinion that the continued development of IT products and with the exponential creation of data, that the demand for data centres and their services will continue to grow in the EMEA region. The mature markets will continue to dominate in the immediate future but we expect to see the outlying markets in Northern and Eastern Europe continue to secure opportunities, albeit from a low base.
The power debate, in respect of power security, sustainability and unit pricing is set to run until the likes of the UK, France and Germany make clear commitments to the electricity generation infrastructure. If they do not, Scandinavia , powered predominantly by hydro, will become an increasingly attractive location, providing the necessary investment is made in improving the connectivity to the wider continent and North America.
We anticipate continued investment and opportunity developments in Africa albeit from a low and restricted base. The continent represents a potentially substantial prize to those that are prepared to invest in the region across all subsets of ICT services although there are clear risks that need to be managed and mitigated.

Data Centre risk inDex
13
gerMaNy (ranked 4th)
a major world economy and a major data centre hub. taxation and labour costs are high but its high ranking stems from its high internet bandwidth capacity, low rate of inflation and stable political system. however energy costs have risen over the last 12 months which has seen Germany fall one place to fourth.
FraNce (ranked 14th)
although france represents one of emea’s largest and most established data centre locations, it remains outside of the top ten because of its low score for ease of doing business, high taxation, labour costs, high levels of industrial action and political instability.
czecH rePUBlic (ranked 22nd)
an improvement in the comparative cost of energy has seen the Czech republic rise three places. the Czech republic continues to score less well in the key categories of international bandwidth and ease of doing business, resulting in an overall low table position.
FiNlaND (ranked 9th)
finland’s limited investment in international bandwidth has seen it remain in the same position as last year whilst most other nordic countries have all moved up the rankings. it is ranked as being at the lowest risk of natural disasters and considered politically stable. its continued reliance on energy from russia still results in the lowest ranking for energy security.
Country hiGhliGhts: emea

2013
14
NetHerlaNDs (ranked 12th)
a fall in the cost of labour has seen the netherlands, considered the connectivity gateway to mainland europe, has supported a rise of 2 places in this years ranking. it is at low risk from a natural disaster point of view and is considered politically stable but is held back by a low ease of doing business score relative to the other countries in the index.
irelaND (ranked 18th)
even though ireland is home to a number of large data centres and benefits from a low corporation tax rate, a fall in the ease of doing business has caused an overall fall in the rankings. Combined with comparatively high labour costs and energy sees ireland remain in the bottom half of the table.
icelaND (ranked 7th)
Previously the highest ranked nordic country, iceland has now fallen three places and been overtaken by sweden. high labour costs and no rise in the capacity of international bandwidth have had a negative impact. Connectivity should however be greatly improved when the emerald undersea cable connecting the us, Canada, uk and iceland is completed.
Norway (ranked 8th)
the second largest increase in rankings has seen norway move into the top 10 mainly thanks to its strong political stability and high ease of doing business. norway has a high availability of natural resources and a very high percentage of energy is produced from renewable sources. for these reasons we are beginning to see increased investment in the data centre market.

Data Centre risk inDex
15
Qatar (ranked 10th)
qatar's telecoms regulator, ictqatar, has outlined an ambitious plan to expand the country's iCt sector in the next five years, including a commitment to invest $500 million to accelerate the deployment of a nationwide fibre-to-the-home broadband network. this combined with the presence of a number of well developed data centres facilities suggest that qatar is potentially a place to watch for the future.
soUtH aFrica (ranked 20th)
Data Centre operators are running out of space and power in africa due to the massive increase in data usage. While the international bandwidth availability offered by new submarine cables is improving, the cost and availability of power and lack of skilled manpower remains a major issue, with local companies and operators investing in new measures to reduce energy use and waste.
rUssia (ranked 24th)
remaining in the same position as last year, russia’s abundance of water and energy reserves, energy security and low power pricing are still being offset by the difficulties in the ease of doing business, political instability and high rate of inflation.
PolaND (ranked 17th)
together with sweden, Poland has moved the furthest up the index this year by moving up 5 places. this has been helped by the low level of corporation taxation, cost of labour and the low risk of natural disaster. a comparatively low increase in the cost of energy was also the key in Poland’s rise up the table. With several large organisations moving back office operations to the country this may further improve its attractiveness in the medium term.
2013
16
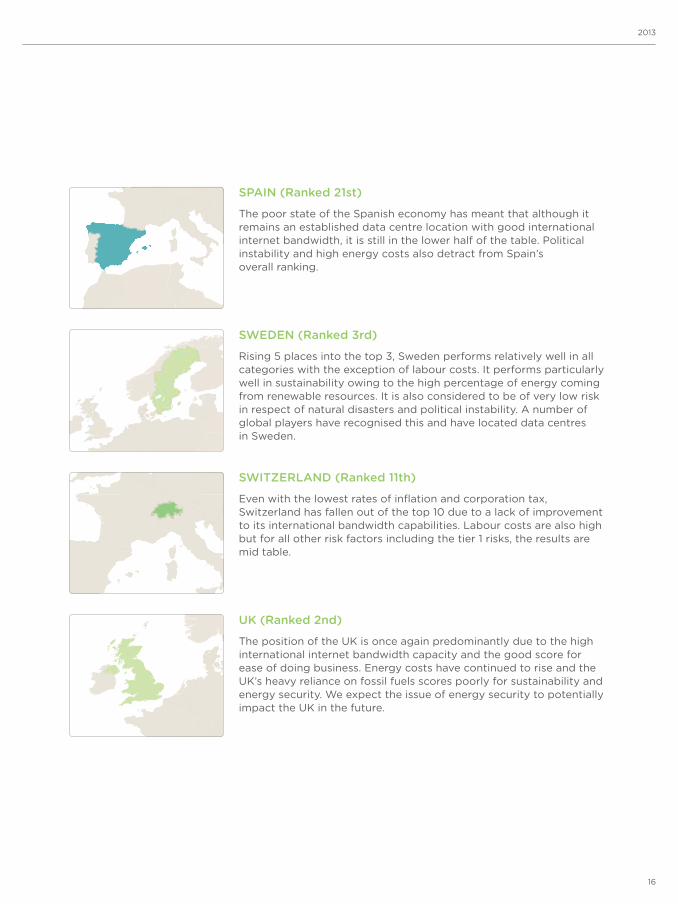
switzerlaND (ranked 11th)
even with the lowest rates of inflation and corporation tax, switzerland has fallen out of the top 10 due to a lack of improvement to its international bandwidth capabilities. labour costs are also high but for all other risk factors including the tier 1 risks, the results are mid table.
sweDeN (ranked 3rd)
rising 5 places into the top 3, sweden performs relatively well in all categories with the exception of labour costs. it performs particularly well in sustainability owing to the high percentage of energy coming from renewable resources. it is also considered to be of very low risk in respect of natural disasters and political instability. a number of global players have recognised this and have located data centres in sweden.
sPaiN (ranked 21st)
the poor state of the spanish economy has meant that although it remains an established data centre location with good international internet bandwidth, it is still in the lower half of the table. Political instability and high energy costs also detract from spain’s overall ranking.
UK (ranked 2nd)
the position of the uk is once again predominantly due to the high international internet bandwidth capacity and the good score for ease of doing business. energy costs have continued to rise and the uk’s heavy reliance on fossil fuels scores poorly for sustainability and energy security. We expect the issue of energy security to potentially impact the uk in the future.
Data Centre risk inDex
17
reGional hiGhliGhts: aPaC
ecoNoMy. Asia’s economies continued to see growth throughout 2012 and projected growth for 2013 remains buoyant. China’s 2012 full-year growth of 7.8% in 2012 beat government estimates and has helped sustain growth across the region. Economies such as Taiwan, South Korea and Japan have all turned a corner and ended 2012 on positive note. Japan’s macroeconomic conditions have not completely recovered but the government stimulus package and increased exports indicate definite improvements. The ASEAN economies continued to show growth, with resilient consumer spending and stronger exports fueling this advancement.
MarKet. The Asian data centre market continues to be a varied and challenging market. Hong Kong and Singapore remain as the main international hubs seeing significant take-up from multi-national corporates as well as a high concentration of global data centre operators. Australia and Japan are the other main established markets in the region, both mainly spurred by internal demand and local operators. China has remained a big focus for operators and end-users in the region with many looking at their strategies for entering or growing in the country.
The APAC region is expected to continue expanding their data centre demand, driven by the economic dynamism of the region and the businesses' reliance on IT systems and the cloud. Traditional hubs such as Singapore, Hong Kong, Tokyo and Sydney are expected to remain the favoured locations for multinationals operating in the region; however, most local businesses are expected to look for in-country data centres that are geographically close to their main areas of operation rather than regional hubs.
Generally the penetration and sophistication of ICT services and infrastructure is significantly higher in northern Asia; however, southern Asian markets such as Indonesia, Malaysia, Singapore and Thailand have witnessed a steady and significant demand for data centre space, driven by their economic growth and BPO businesses, with the total data centre capacity in the four countries reportedly expected to increase by over 50% in the next five years.
The region is expected to see accelerated growth and investment opportunities, both in the mature hubs and the emerging markets. Harnessing the opportunity, delivering the right product and breaking through barriers to entry will be key to both provider and occupier.

2013
18
coNNectivity. Although Asia and the Pacific include 60% of the world’s population, only around 25% of its residents had access to the Internet in 2012. This provides enormous potential for growth, as well as substantial and sustained demand to upgrade the ICT infrastructure supporting consumer and business data usage, including national and international networks and data centre space.
The Asia Pacific Gateway (APG) cable is on target for completion in Q3 2014, when 10,000 km of international fibre optic cable system will link Malaysia to Korea and Japan with seven branches to other Asian countries, including Hong Kong, Singapore, Taiwan and Korea. The spread and capacity of APG will make it one of the most strategically important cables in the region and will reshape the connectivity of the region as well as improving cable resilience. Australia’s fibre infrastructure will also continue to improve with increased connectivity to Singapore once ASC and APX-West are operational in 2014 and to the US with APX-West in 2015.
eMergiNg MarKets. The positive growth forecasts for the ASEAN economies will likely lead to continued growth in developing data centre markets such as Thailand, Indonesia and Malaysia. The majority of the operators in these markets are local incumbents and developers but the landscape is changing as the global data centre operator market sees the lack of competitive supply and strong macroeconomic indicators that should continue to spur demand. We can expect some global operators to enter these markets through both the acquisition of local data centre operators and direct deployment of capital.
FocUs oN cHiNa. China’s strict regulations continue to be a barrier to entry for many global data centre operators but we expect that the strong demand will encourage operators to work through these issues to enter the market. Data centre supply is still led by incumbent providers, but foreign end-users are increasingly pushing the market for carrier neutral solutions with global operating standards and by definition increasing the opportunities for new entrants into the market. The majority of data centre supply is located in metropolitan Shanghai and Beijing, but cities such as Guangzhou, Chengdu and Shenzhen are also seeing healthy growth. Interestingly Shanghai is currently hampered by severe power shortages which could lead to supply constraints in the short to medium term, therefore promoting the Tier 2 cities into the thought process.

Data Centre risk inDex
19
cHalleNges. The Asian data centre market is not without challenges, for both the operator community and end-users. In many markets operators must work within local government restrictions to find suitable properties which make the site sourcing process difficult at times. Markets such as Hong Kong suffer from a lack of suitable industrial supply and therefore we expect there to be data centre supply shortages in the short to medium term unless the local government allocates more land for data centre use.
For foreign end-users the challenge is to find a data centre operating partner who can offer the same operating standards that the rest of the organisation’s infrastructure adheres to. As per our 2012 report, many local data centre operators are still struggling to efficiently and effectively operate their facilities. Therefore there continue to be opportunities for established operators to enter new markets either through partnerships, acquisition or directly.
The Asian data centre market is significantly more opaque than western markets. True market pricing has yet to be established in any market. For the time being the operator community is able to monopolise on the lack of quality data but as the market becomes more developed, pricing will become more transparent and we do expect to see more standardized market pricing in the medium term.
coNclUsioN. The Asian data centre market is characterised by significant growth and opportunity. As this growth has happened quickly the operator market is still catching up to provide quality run facilities to meet the high demand. It is an interesting time for the Asian market and the next few years should see big changes to the data centre landscape as connectivity investment bears fruit and global operators establish their Asian bases, expand their footprints and challenge the current market standards.

2013
20

Data Centre risk inDex
21
aUstralia (ranked 23rd)
When compared to the rest of the aPaC region, australia suffers from comparatively high power and labour costs, this coupled with limited new investment in the international bandwidth to date has seen it remain in 23rd place. With the investment in new subsea cables connecting asia and us coming on line we expect that it will improve its ranking over the next two years. the carbon tax introduced in June 2012 has increased the cost of fossil fuels and is hoped to bring a 100% renewable grid by 2030.
iNDia (ranked 29th)
the retail data centre market has continued to grow with operators beginning to build out larger tier-iii facilities. the opportunities for growth are substantial but the ease of doing business is still a barrier. Power security still remains a significant risk stemming from the lack of diversity of energy imports and increasing reliance on imported oil making it still the highest risk country in the aPaC region. however despite these challenges, the perspective remains that long-term india will be an attractive investment opportunity.
cHiNa (ranked 25th)
businesses are investing heavily in the Chinese data centre market, which is expected to grow by 20% annually over the next 5 years. obtaining the correct licensing to operate is still creating a barrier to entry leading to most foreign investors having to partner with a local business or developer.
HoNg KoNg (ranked 6th)
hong kong's role as a leading business centre in the asia-Pacific region owes much to its advanced telecommunications infrastructure, which facilitates domestic and international communications by voice or data. the data centre sector has been growing fast in recent years and it will continue to increase. the local Government is committing to fostering hong kong as the prime location for data centres in asia Pacific but land is at a premium.
iNDoNesia (ranked 28th)
once again ranked as the country with the lowest cost of labour, indonesia has seen its ranking and international bandwidth increase, rising 3 places overall. Whilst energy supply and costs has remained competitive on the international scale, ease of doing business, and the rate of inflation are considered a high risk which had a detrimental effect on its ranking.
Country hiGhliGhts: aPaC

2013
22
JaPaN (ranked 26th)
Japan has seen the biggest increase in risk of all the countries for 2013 falling 6 places compared to last year's index. international bandwidth remains a strength and is continually improving with the launch of new submarine cables but natural disasters such as 2011’s earthquake has had a detrimental effect on the price and security of power.
siNgaPore (ranked 15th)
rising 2 places from the 2012 index, improvements in the cost of power, and a strong score in respect of ease of doing business are making the singapore market a very attractive investment for data centre organisations. We are seeing significant investment in the market from many organisations. the comparatively high cost of labour and high rate of inflation has kept singapore out of the top 10 locations.
soUtH Korea (ranked 13th)
an increase in its comparatively low energy costs and a rise in corporation tax have seen south korea fall two places this year. the country is also deemed to be at high risk from natural disasters such as floods and typhoons, political instability and energy security. south korea has been on a drive to improve its data centres market which has come off the back of rise in its international bandwidth.
Malaysia (ranked 16th)
a comparatively low increase in the cost of power and a rise in the ease of doing business category has seen malaysia rise three places in this year’s ranking. the metrics that continue to negatively impact the country’s development are the high risk associated with political instability, the relatively poor international bandwidth and the low percentage of the population having completed tertiary education. alongside other asian countries malaysia is very attractive to the data centre market as an established bPo destination.
tHailaND (ranked 19th)
the increase in the cost of power, poor internet bandwidth and high risk of political instability has seen thailand fall down the rankings. the telecommunications industry in thailand is beginning to enjoy some growth which could lead to further investment in infrastructure in the coming years.

Data Centre risk inDex
23
reGional hiGhliGhts: ameriCas
ecoNoMy. The US economy continues to expand, although in the fits-and-starts growth pattern that has prevailed over the past several years and is likely to persist into 2014. The effects of the government budget sequestration will likely be a drag on immediate growth in 2013, but uncertainty about the fiscal deficit in the US is diminishing and will likely continue to do so. The perspectives on uncertainty over the Euro Zone are also improving, albeit steadily. Consumer and business alike are exuding cautious optimism, with confidence levels climbing and corporate profits remaining strong. Most importantly, the US housing market is now in a fully fledged recovery that will only gain strength heading into 2014 as years of pent-up demand being a critical trigger for stronger job creation.
The Canadian economy, having felt the impacts of a slowing export market to the US and Europe in Q2 2012, is expected to see some growth. Canada has proven to be a strong and stable economy even in challenging global economic times. Stable banking, strong consumer spending, and a solid economic outlook are all making Canada a preferred location for foreign investors seeking safety and growth. Improving scenes in Europe and the US bodes well for renewed momentum.
While somewhat slower than recent years, growth in Latin America economies will once again outpace that of their regional neighbours to the north. Brazil has recently showed signs of recovering from its recent period of stagnation. With the Football World Cup set to be held in the country in 2014, a swell of public and private infrastructure investment will also contribute to quick re-acceleration of the Brazilian economy.
MarKet. Many of the top data centre markets in the US struggled with sporadic leasing volume in 2012, mirroring economic uncertainty. While data centre market fundamentals were generally strong, the result was increasingly competitive pricing and healthy supply levels anticipating better than actual demand. That imbalance is now diminishing as tenant activity in major markets is showing renewed vigour in 2013, particularly in the San Francisco Bay Area and
Supported by more stable economies, the North American hubs will continue to see development and expansion of operations but secondary markets will provide increasing competition. South America is predicted to experience solid growth as IT adoption rates rise and the investment in communications infrastructure improves access to the continent.

2013
24
Northern Virginia This is a likely precursor to a trend that is expected to proliferate across most US markets going forward, as delayed requirements and demand move from the sidelines into the decision-making phase supporting the continued persual of the outsourcing model.
Consequently, the US construction pipeline continues to be robust with most established data centre markets seeing variable levels of new supply. Interestingly emerging data centre markets including Portland, Las Vegas and Phoenix have seen proportionally higher levels. Locations like Oregon have seen a high volume of user-builds, with giants like Facebook, Apple and Google all recently constructing facilities in the state. Consequently, national pricing continues to see downward pressure despite strong demand, predicated in part by the emergence of the “wholo” market referenced earlier in our EMEA commentary.
Brazil is still the primary data centre destination in South America as it encompasses the largest population and the best connectivity. South America is slowly starting to see a move towards a “wholesale” model – which had not existed previously – as companies begin to move to take advantage of the growth in the southern hemisphere. We expect the steady stream of announced expansions and new facilities in the continent’s capital cities to continue as corporate and domestic IT absorption improves.
The top tier data centre market in Canada is the Greater Toronto Area (GTA), which makes up the majority of the Canadian market, although demand has been strong in all major Canadian metros for some time. Retail colocation supply remains limited, particularly outside of the GTA, and the
development and investment into wholesale product and powered shells has not yet hit the Canadian market in a significant way. Recent new supply and planned developments are helping to provide more choices in under-built markets, with market demand being driven by enterprise users upgrading and consolidating facilities, colocation providers expanding, and technology providers expanding their global applications.
coNNectivity. The US continues to be, by far, the largest and best served country in terms of ICT infrastructure in general and connectivity in particular. In terms of international connectivity, the relative maturity of the US and European markets is reflected in the fact that during the last 10 years there have been relatively low investment in submarine cable infrastructure. Conversely, and despite the potential demand, plans for new transpacific cables connecting the USA with Russia, Japan or other countries remain unclear mainly due to the enormous cost. Connectivity with Latin America, however, is expected to increase significantly during 2013/14.
Latin America’s communications markets offers one of the industry’s highest potential growth opportunities within the region and is projected to lead the global expansion in communication services over the next few years. A combination of economic growth, rising consumer demand and regulatory changes should continue to foster competitive dynamics and the growth of usage and revenues. Consequently, governments and their regulators are eager to create the favourable conditions necessary, drawing on lessons learnt from more mature markets.

Data Centre risk inDex
25
Driven by Brazil’s economic dynamism and Asian hunger for commodities in the region, Latin America is experiencing a wave of submarine fibre-optic cable construction. The AMX-1 System will connect 7 countries with 11 landing points through the east coast and is expected to be operational in 2013, while Seabras-1 will create a direct route between New York and Sao Paulo in Brazil. In addition, Brazil plans to build a 6,000-km submarine cable to Angola and there are planned connections to provide access to 21 African countries by the second half of 2014. This inflow of capacity will enhance the attractiveness of Brazil and surrounding countries from a data centre perspective. An example is the USD$150m investment that Google announced for a data centre facility in Chile, expected to be online in 2013, to serve the demand of the southern zone.
Us still NUMBer oNe. Robust demand along the entire spectrum of third-party data centre providers – spanning the wholesale, colocation, managed services and cloud segments – has fuelled strong market fundamentals and a rapid evolution of data centre markets in the US. The rapid adoption of technology and its impact on data centre real estate shows no sign of slowing as the increase of internet and mobile device users, e-commerce, and compliance and regulatory requirements for health care and financial verticals continue to drive growth.
Enterprise and corporate users are also facing a critical point-in-time evaluation of their data centre needs in an environment of ever-decreasing IT budgets. Capital expenditures and operating expenses are being squeezed at the same time that increased redundancy, security and accessibility of network and critical systems are being required. This is prompting strong demand for colocation data centres, as public and private cloud-based storage and backup providers emerge as viable solutions for outsourcing although organizations continue to struggle with security and access issues.

2013
26
oPeratioNal cost FocUs. The largest data centre requirements continue to focus on the cost of power and low taxation environments as the two most important variables in their site selection algorithms. While mega-users such as Facebook and Amazon are seeking low cost venues, more latency-driven users are still focused on the major markets. US cities are now cognizant of the great economic tax base created by data centres and are competing with other locations offering substantial tax abatements. States too are in the mix with many passing legislation to be more attractive to data centre operators seeking the lowest total cost of ownership (TCO), including eliminating sales tax on construction, operation costs (electricity, water), and equipment, including servers, to attract these big users.
More generally, we may also begin to see the emergence of a trend of providers moving away from the raised floor environment to one whereby racks are set directly on slabs. The growing acceptance of this design allows the cost for infrastructure to be reduced at no real loss of operational effectiveness. If this trend builds momentum, the emerging markets may be in a better place to press for a cost advantage.
HUrricaNe saNDy. Hurricane Sandy had a dramatic impact on the US data centre market, the affects of which were not just limited to the New York metro area. Many users are still sorting out the impact – both on their deployment decisions and on their operational needs – but several trends are beginning to emerge in the aftermath of the storm. Geographic diversity of redundant and backup locations are being given stronger scrutiny. Additionally, colocation demand from enterprise and corporate users who experienced significant downtime in their in-house data centres and server rooms is expected to rise significantly.
coNclUsioN. The underlying fundamentals of data centre real estate will remain positive over the next couple of years. In some US markets, there are several large builds coming online simultaneously. While there are concerns there may be a short-term potential oversupply in the US, the opposite is the case in Latin America. Irrespective of the varying supply dynamics within the region, demand is anticipated to remain strong in the medium term.
Debt availability is still, however, primarily limited to proven executors in the multi-tenant data centre industry and less freely loaned to speculative builders. This lending discipline is expected to continue, and many industry analysts do not expect to see an oversupply as a result of speculative data centre builds. Naturally, market pricing tends to have the greatest fluctuations and competitiveness where there are the greatest number of competitors. Secondary and maturing markets are however gaining attention and may be the healthiest on a short term basis with more secure pricing fundamentals.
Building on the above, Canada perhaps has the potential to meet the aspirations of both investors and users, with solid market and risk fundamentals. There is an anticipation that the data centre real estate market in Canada will accelerate as more investment and development is attracted from the US and Europe.
Data Centre risk inDex
27
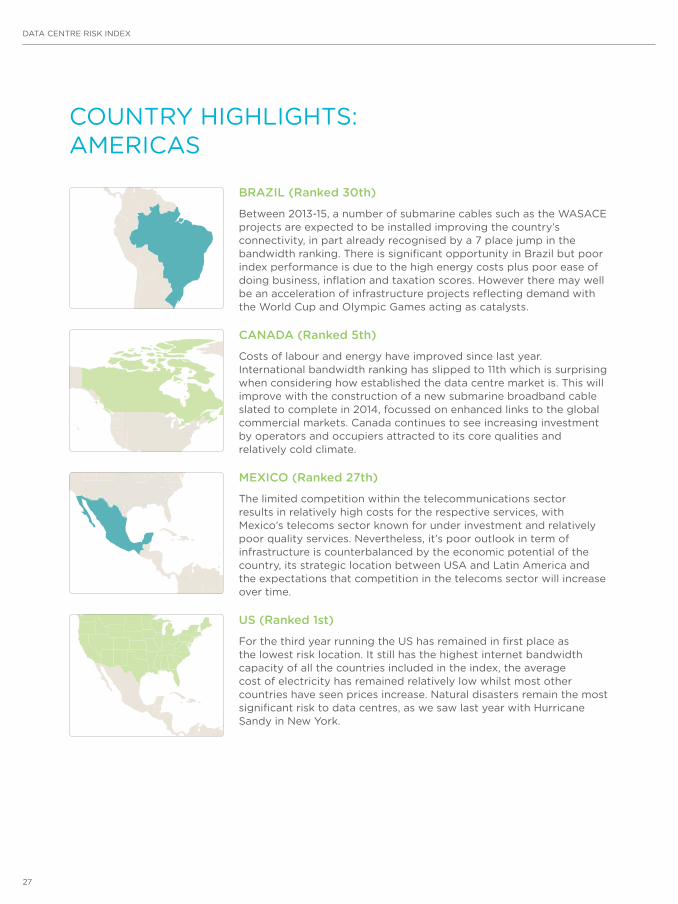
caNaDa (ranked 5th)
Costs of labour and energy have improved since last year. international bandwidth ranking has slipped to 11th which is surprising when considering how established the data centre market is. this will improve with the construction of a new submarine broadband cable slated to complete in 2014, focussed on enhanced links to the global commercial markets. Canada continues to see increasing investment by operators and occupiers attracted to its core qualities and relatively cold climate.
Mexico (ranked 27th)
the limited competition within the telecommunications sector results in relatively high costs for the respective services, with mexico’s telecoms sector known for under investment and relatively poor quality services. nevertheless, it’s poor outlook in term of infrastructure is counterbalanced by the economic potential of the country, its strategic location between usa and latin america and the expectations that competition in the telecoms sector will increase over time.
Brazil (ranked 30th)
between 2013-15, a number of submarine cables such as the WasaCe projects are expected to be installed improving the country’s connectivity, in part already recognised by a 7 place jump in the bandwidth ranking. there is significant opportunity in brazil but poor index performance is due to the high energy costs plus poor ease of doing business, inflation and taxation scores. however there may well be an acceleration of infrastructure projects reflecting demand with the World Cup and olympic Games acting as catalysts.
Us (ranked 1st)
for the third year running the us has remained in first place as the lowest risk location. it still has the highest internet bandwidth capacity of all the countries included in the index, the average cost of electricity has remained relatively low whilst most other countries have seen prices increase. natural disasters remain the most significant risk to data centres, as we saw last year with hurricane sandy in new york.
Country hiGhliGhts: ameriCas


Data Centre risk inDex
ContaCts: hurleypalmerflatt
For 40 years hurleypalmerflatt has successfully delivered mechanical and electrical engineering consultancy and associated services that bring buildings to life. We provide a multi-disciplinary engineering consultancy service. We have become trusted advisors to many global organisations, given our expertise in data centre engineering and energy and sustainability.
Our clients receive totally integrated engineering solutions from over 350 specialists in building services engineering, energy and sustainability, building structures and surveying and IT consultancy.
Headquartered in London we have offices in New York, Singapore, Bangalore, Sydney, UAE as well as Leeds and Glasgow in the UK. From this global position we are able to deliver excellence in data centre environments wherever our clients choose to locate.
For further information, please contact:
stePHeN wHatliNg Executive Director
t. +44 (0) 20 7429 3333 e. stephen.whatling@
hurleypalmerflatt.com
A pursuit of excellence is at the heart of everything we do. We continuously train our staff to enable them to attain the technical, management and creative expertise at the leading edge of engineering.
Our vision is to deliver world class sustainable solutions for the built environment.
Our mission at hurleypalmerflatt is to be clear leaders in the mission critical engineering market for global corporate organisations, be thought leaders in both energy and sustainability and be recognised to deliver the highest standards in engineering design.
hurleypalmerflatt 2 Broken WharfEC4V 3DT London
hurleypalmerflatt.com

2013
30
ContaCts: Cushman & Wakefield
Cushman & Wakefield is the world’s largest privately-held commercial real estate services firm. Founded in 1917, it has 235 offices in 60 countries and more than 15,000 employees. The firm represents a diverse customer base ranging from small businesses to Fortune 500 companies.
tHe Data ceNtre aDvisory groUP. The Cushman & Wakefield Data Centre Advisory Group (DCAG) provides strategic advice and real estate services for technical space and data centres to occupiers, landlords, investors and operators.
The multi disciplined team advises clients of all sizes and industries, providing services such as:
•Strategic Advice: to align clients’ business goals with their technical real estate assets
•Acquisitions & Site Selection: supporting clients’ requirements for acquiring colocation or wholesale space, existing facilities or developing new.
For further information, please contact:
KeitH iNglis Partner
t. +44 (0) 20 7152 5874 e. keith.inglis@
eur.cushwake.com
cUsHMaN & waKeFielD 43/45 Portman SquareW1A 3BG London
cushwake.com
•Lease Negotiations & Tenant Representation: providing services for renewals, regears, relocations and subleasing
•Valuation: undertaking valuations and due diligence reporting for loan security, portfolios, going concerns and M&A
•Project Management: the C&W team has a proven track record of reducing costs and improving efficiencies
•Facilities management:C&W manages more than twenty million square feet of technology space and nine million square feet of raised-floor data centres
•Ancillary Services: The DCAG works in partnership with various complimentary consultants to provide a co-ordinated, holistic and seamless approach to any project allowing the team to incorporate services such as:
i. M&E Design and Engineeringii. Architectsiii. Cost Consultingiv. Power and Connectivityv. Securityvi. Legal Services
exPerieNce aND resoUrces. DCAG has a strong track record of working with data centre occupiers, owners and investors globally. Harnessing the C&W network of offices the DCAG teams work alongside our experienced in-country local teams. Using our collective knowledge, and relationships to leverage and optimise negotiations, we deliver a true value adding service. The DCAG teams in EMEA, Americas and Asia are fully integrated enabling us to provide our clients with multinational requirements, true global coverage.
Data Centre risk inDex
31
ContaCts: source8
Source8 is one of the world’s leading advisors on the implementation of Real Estate, Technology and Risk Management infrastructure and services. Our three core competencies combined with our unique ability to operate securely in both stable and fragile markets enables us to deliver sector specific, fully integrated infrastructure solutions anywhere in the world.
The Source8 Critical Infrastructure Division provides specific end to end services to support the strategy, planning, design and implementation of technical infrastructure and data centres for both business and government clients worldwide. We bring an independent view, and pragmatic, executable advice to ensure that our clients’ technology infrastructure supports their strategic objectives in a secure and commercially robust manner. Our advice and expertise is genuinely unique in that we bring together Technology, Real Estate and Risk Management to provide our clients with fully integrated solutions.
oUr service PortFolio covers:
•Data centre strategy: Source8 offer advisory services to assist business & government clients in the development of their data centre strategy including market assessments, consolidation programmes, location analysis and technology trends
•Demand Management : Source8 offer data centre demand profiling and analysis services
•Due Diligence: Undertaking due diligence and analysis on existing or planned data centre infrastructure, including assessing utilisation and cost
•Technology optimisation: Our Critical Infrastructure Division advise on Data centre optimisation options and approach, including rationalisation, virtualisation and cloud solutions
•Risk Management: Source8 carry out structured threat, vulnerability and risk assessments (TVRA) of data centre locations
•Telecommunications & Connectivity: Analysis of local, national and international fibre connectivity and telecommunications supply
•Technology Sourcing: Source8 provide design and sourcing of technology solutions and suppliers
•Implementation: Source8 project management of new data centres or data centre migrations
For further information, please contact:
aleJaNDro Navarro Director
t. +44 (0) 79 7637 0786 e. [email protected]
source8 5 Hobart Place SW1W 0HULondon
source8.com

2013
32


Disclaimer
In using these data, the following should be noted.
The data series has been prepared based on information which has been collected through our own research as well as information supplied by the client and material available to us from public and other external sources. In respect of all external information, the sources are believed to be reliable (unless stated) and have been used in good faith. However, Cushman & Wakefield LLP, hurleypalmerflatt and Source8 have not verified such information and cannot accept responsibility for their accuracy and completeness, nor for any undisclosed matters that would affect the conclusions we have drawn. Nonetheless, in interpreting the information used, we have had to rely on the validity and accuracy of the data and information sources available to us.
We have taken every possible care in the collation of this data series. The data is believed to be correct at the time of reporting, but may be subject to change during the life of the project and beyond and as new information becomes available. We reserve the right to change data without prior notice in the light of revised market opinion and evidence.
In respect of any formal forecasting used in this project or any used in the background research supporting the opinions and material presented in this project, the following points should be noted and understood:
i. One is assuming that the historic data input to the forecasting process is accurate;ii. The judgement of the forecaster(s) will influence the validity of the results;iii. Unless stated, one is assuming that the market will continue to operate in future as it has in the past, and that its stability will not be disrupted;iv. The forecasting is representative of only one moment in time;v. The reliability of forecasts for the property market are dependent on the accuracy of the input forecasts for the economy as a whole; and vi. The forecasts relate only to the type and quality of property indicated.
In accordance with standard practice, we would confirm that the information is confidential to the parties to whom it is addressed, for their sole use, and for the stated purposes only. No responsibility is accepted to any third party in respect of the whole or any part of its contents. Neither the whole, nor any part of this project or data series, nor any reference thereto, may be included in any document, circular or statement without our written approval of the form and context in which it appears. It may not be reproduced by any means (electronic or otherwise) without prior written consent from Cushman & Wakefield LLP, hurleypalmerflatt and Source8.
Information on assumptions, methodologies or definitions can be obtained from Cushman & Wakefield, London. Cushman & Wakefield LLP, London, October 2008


![INDEX [2014.cimtec-congress.org]2014.cimtec-congress.org/data/image/pdf/Congress_programme.pdf · southampton, southampton, UK; Centre for Disruptive Photonic technologies, nanyang](https://static.fdocuments.us/doc/165x107/5fbea60703ecf8063b57d74a/index-2014cimtec-2014cimtec-southampton-southampton-uk-centre-for-disruptive.jpg)