Data Center Transformation Presentation
22
Data Center Transformation DTS 2011 Meeting Departmental and Constituent Performance Expectations
-
Upload
datacenters -
Category
Documents
-
view
230 -
download
2
Transcript of Data Center Transformation Presentation

Data Center Transformation
DTS 2011Meeting Departmental and Constituent
Performance Expectations
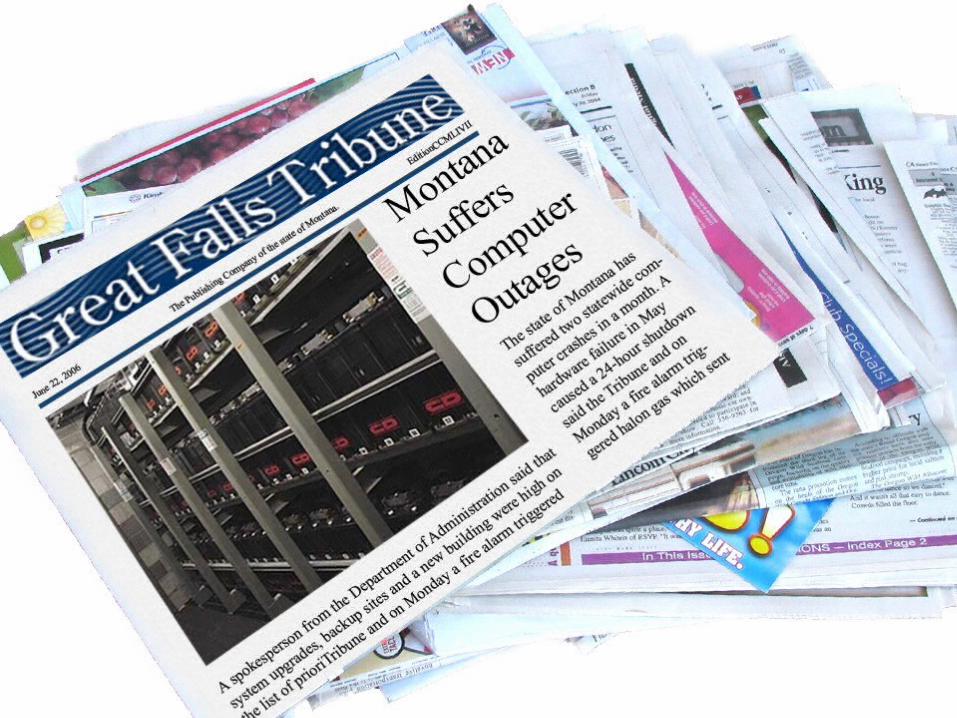
Technology – Expectations versus Reality
• Pull in newspaper image from www.govtech.com/gt/articles/99967
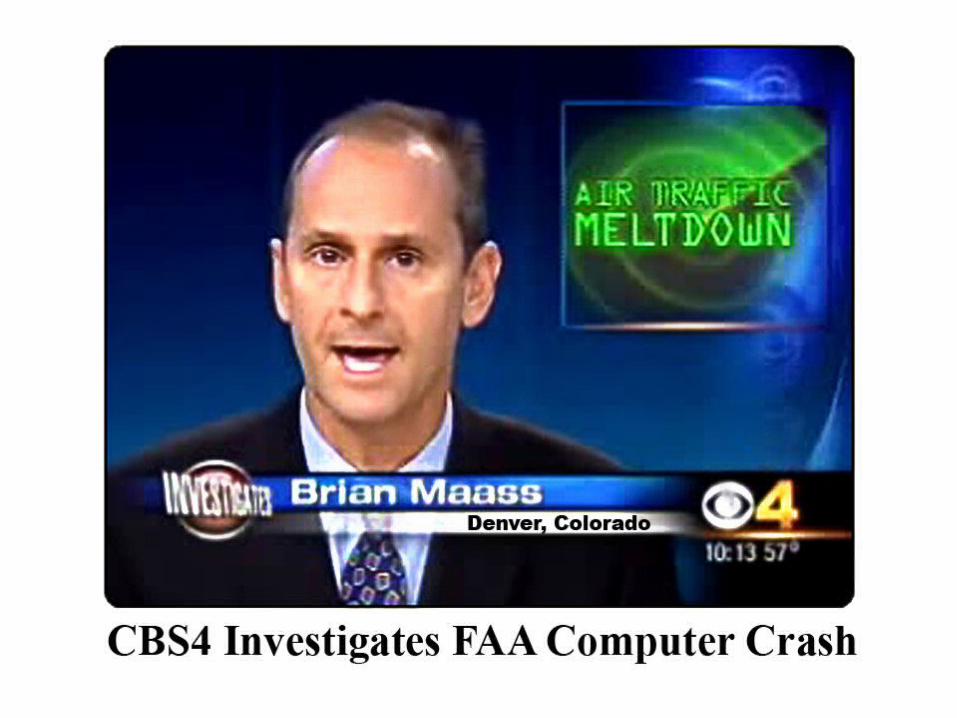
Technology – Expectations versus Reality
• Pull in Newspaper article format from cbs4denver.com/local/local_story_142195219.html

Technology – Expectations versus Reality
• Pull in newspaper article from www.latimes.com/news/local/la-me-airport14aug14,1,3451798,full.story

Technology – Expectations vs, Reality
• Pull in newspaper article from www.gcn.com/print/26_09/43568-1.html


Objectives
• Improve State of California’s Disaster Preparedness
• Leverage Cannery Campus move to establish an architecture for better performance

Availability – The Critical Issue
Cost versus Availability
Availability
Annual Outage
Monthly Outage
Weekly Outage Cost
95% 18.25 days 36 hours 8.4 hours Current Rates
98.5% 7.3 days 14.4 hours 3.4 hours Current Rates
99% 3.7 days 7.2 hours 1.7 hours 2x-4x
99.9% 8.8 hours 43 minutes 10 minutes 2x-4x
99.99% 53 minutes 4.3 minutes 1 minute 2x-4x

Managing for High Availability – From Eyeballs to Data
Data
Processor ApplicationWide AreaNetwork
BuildingNetwork
6 parts performing at 99% = Overall 94.1%
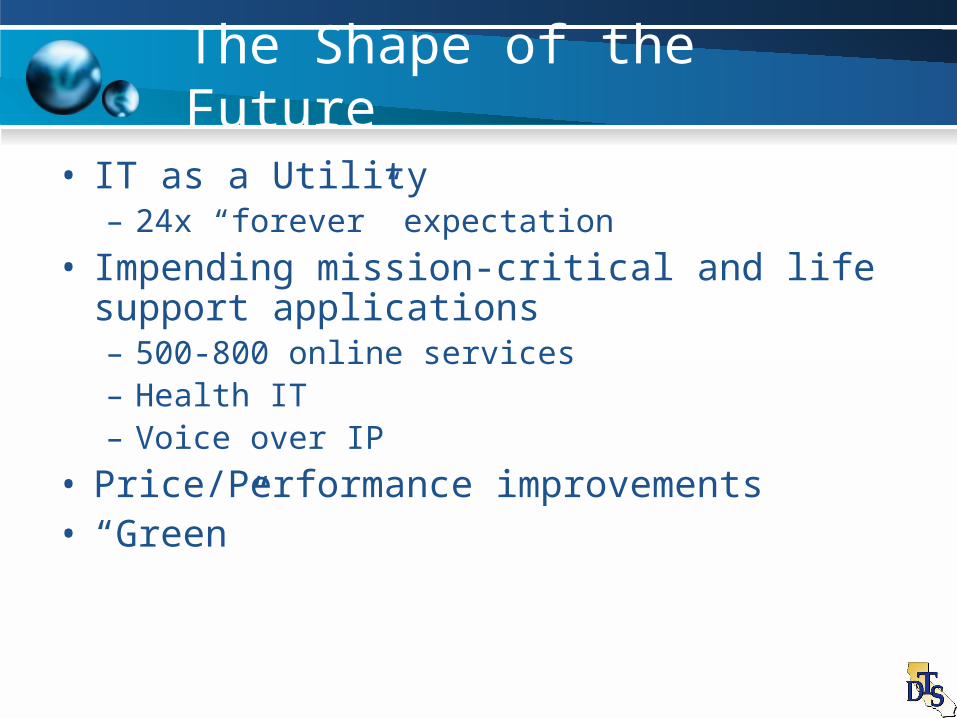
The Shape of the Future
• IT as a Utility– 24x “forever” expectation
• Impending mission-critical and life support applications– 500-800 online services – Health IT– Voice over IP
• Price/Performance improvements• “Green”

DTS Today…..
• Sharing only of mainframe, network backbone and some storage services
• All others are standalone customer specific solutions
• Designed for 98.5% availability for weekday primary shift and 95% for nights and weekends

DTS Today…..
• Disaster Recovery on a case-by-case basis, typically on a 72-hour recovery time (17 out of thousands of applications)
• Stand-alone application solutions make it a challenge to provide higher availability
• Architectures inhibit cost reductions
• Both computing sites in the same flood plain

Getting to 2011
UNIFIED STORAGE SERVICES
NON-MAINFRAME
DR
REMOTELY MANAGEABLEENVIRONMENT
Relocated Cannery
MAINFRAMEDR

Mainframe Disaster Recovery
• Total One-Time Cost - $17.8 million• Value
– 4 hour recovery for all applications– Recovery planning is simplified– Reduced complexity of operations
• No need for offsite tape storage
• Completion - June 2009

Unified Storage Services
• Total One-Time Cost - $29.7 million• Value
– Lower storage costs per unit, translating to eventual rate reductions
– Tiered storage levels– Simplified operation associated with
tape reductions
• Completion – December 2010

Non-Mainframe Disaster Recovery (DR)
• Total One-Time Cost - $18.5 million• Value
– Similar to mainframe – Recovery plans are simplified due to a
platform approach
• Completion – December 2010

Remote Management of Cannery
• Total One-Time Cost - $4 million• Value
– Ability to staff at <20 PYs at new facility– Better coordination of total resources
• Improved recovery response
– Eliminate the need to relocate staff
• Completion – December 2009

Relocated Cannery
• Annual Site Costs – Data Center $6.4 million– Administration $1.1 million – Existing Cannery -$4.6 million – Net Increase $2.9 million
• Value– Consolidated Staff – Computing Site in Different Disaster Region– “Green”
• Completion – December 2010

Cash Management
Projected Total
FY Revenue Expenses Difference
07/08 $ 221,253,938 $ 225,831,446 $ (4,577,507)
08/09 $ 231,613,579 $ 238,437,341 $ (6,823,762)
09/10 $ 243,194,258 $ 244,496,349 $ (1,302,091)
10/11 $ 255,353,970 $ 248,664,320 $ 6,689,651
11/12 $ 268,121,669 $ 248,827,596 $ 19,294,073
12/13 $ 281,527,752 $ 249,034,870 $ 32,492,882

Financial Summary
• Rate considerations – Look for other funding sources
• Assumes 5% annual projected revenue growth
• Assumes 2.5% annual projected expenditure increase

Estimated Total Costs
• Total Project One-Time Costs - $170 million– Facilities Cost - $100 million amortized
over a 30 year mortgage period – Non-Facilities Total Cost - $70 million

Next Steps
• Gather input from stakeholders/customers– Customer Council
• Implement a long term vision within a project oriented process– Support from TSB, control agencies and the Legislature
• Obtain TSB approval