Data call timeline and deliverables. Liselotte Diaz Högberg (ECDC)
36
Preparing for the EARS-Net 2015 data call Liselotte Diaz Högberg, Expert, Surveillance and Response Unit European Centre for Disease Prevention and Control
-
Upload
european-centre-for-disease-prevention-and-control-ecdc -
Category
Health & Medicine
-
view
268 -
download
1
Transcript of Data call timeline and deliverables. Liselotte Diaz Högberg (ECDC)

Preparing for the EARS-Net 2015 data call
Liselotte Diaz Högberg, Expert, Surveillance and Response Unit European Centre for Disease Prevention and Control

1
• Results from 2014 EARS-Net data call
• Preparing for the EARS-Net 2015 data call:
- timeline and outputs
• The future of Acinetobacter spp surveillance
• Improving comparability of S. pneumoniae data

2
0
1
2
3
4
5
6
7
8
9
10
14-20April
21-27April
28 April -4 May
5 -11May
12-18May
19-25May
26 May-1June
2-8 June 9-15June
16-22June
23-29June
30 June -6 July
7-13 July
Nu
mb
er
of
rep
ort
ing
co
un
trie
s
Overview of data call 2014
Active data call
Deadline
Cumulative number of reporting countries
2 3 4 5 6 12 19 28 30

3
Percentage isolates per pathogen, 2013
Data from EARS-Net
E. faecium4%
E. facealis7%
S. pneumoniae7%
S. aureus22%
Acinetobacter spp2%
P. aeruginosa6%
K. pneumoniae10%
E. coli42%
4
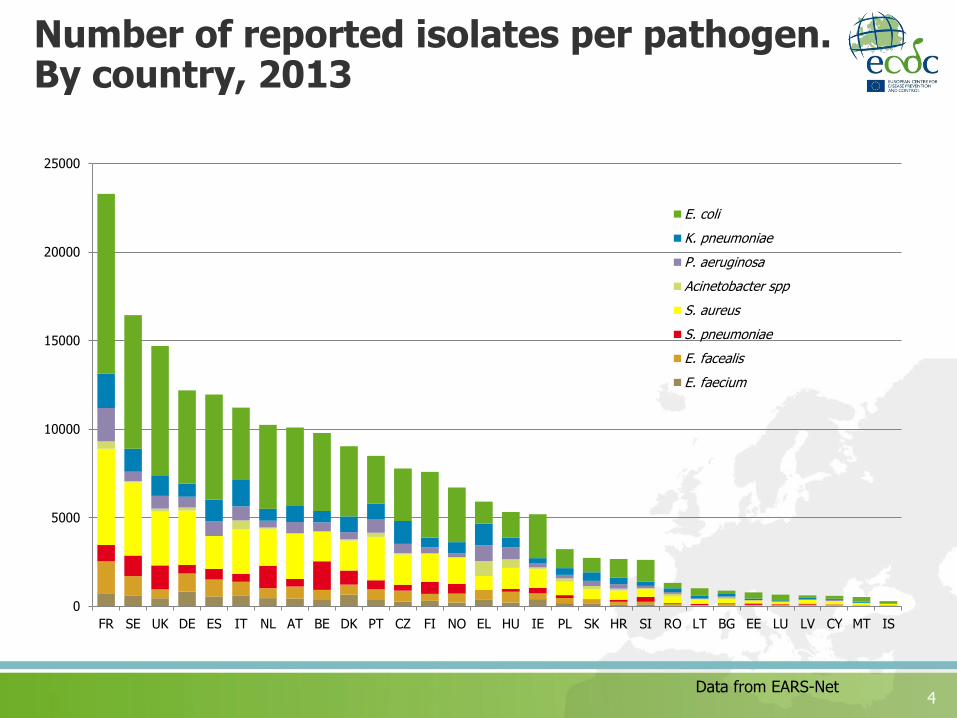
Number of reported isolates per pathogen. By country, 2013
Data from EARS-Net
0
5000
10000
15000
20000
25000
FR SE UK DE ES IT NL AT BE DK PT CZ FI NO EL HU IE PL SK HR SI RO LT BG EE LU LV CY MT IS
E. coli
K. pneumoniae
P. aeruginosa
Acinetobacter spp
S. aureus
S. pneumoniae
E. facealis
E. faecium

5
2014 data call in summary:Reporting completeness
0%
10%
20%
30%
40%
50%
60%
70%
80%
90%
100%
Age Gender Patient type Hospital unit type Date hosp
Data from EARS-Net

6
2014 data call in summary:Reporting completeness
0%
10%
20%
30%
40%
50%
60%
70%
80%
90%
100%
Age Gender Patient type Hospital unit type Date hosp
Mean 66.1 yearsMedian 71 years
Female 44.9%Male 55.1%
Inpatients 86.5%Outpatients 13.5%

7
0%
10%
20%
30%
40%
50%
60%
70%
80%
90%
100%
E. coli K. pneumoniae P. aeruginosa Acinetobacterspp
S. aureus S. pneumoniae Enterococcus
PEDSICU
PEDS
URO
INFECT
OBGYN
ONCOL
SURG
INTMED
ED
ICU
2014 data call in summary:Hospital unit type, by pathogen

8
0%
10%
20%
30%
40%
50%
60%
70%
80%
90%
100%
E. coli K. pneumoniae P. aeruginosa Acinetobacterspp
S. aureus S. pneumoniae Enterococcus
No info
Zone diameter
E-test
Mic
2014 data call in summary:Quantitative susceptibility data, by pathogen

9
Data callData
analysis, report draft
Internal ECDC
approval
MS report approval
Re-analysisFinal ECDC approval
Editing and layout
Timeline 2015: from data call to finalised report
1st
MS data approval
2nd
MS report approval
•Non-negotiable deadline: European Antibiotic Awareness Day on November 18• Two separate MS approval processes: during data call and the report approval
TESSy approval
Deadline 1 July
SeptemberAugust October

Data call outputs 2015
EARS-Net annual report
• online version with country summary sheets • printed version without country sheets (tbc)
Summary for EAAD briefing kit
EARS-Net on-line database
• maps• tables• trend graphs
Published 18
November!

New design for tables and trend analysis results

Background data for all tables and graphs can be downloaded from the ECDC website

Acinetobacter spp pilot surveillance in EARS-Net – experience and way forward

Background
• Concern for increasing AMR problem in Acinetobacter raised at the Joint ARHAI Annual Meeting in Warsaw, 2010
• Survey sent out late 2010 to assess feasibility for surveillance
• Agreed to include as 2-year pilot at 2nd network meeting in 2011
• Data collection completed 2013 and 2014 - time for evaluation
Acinetobacter spp surveillance in EARS-Net

EARS-Net 2010 Acinetobacter Survey summary
• High participation in the survey: response received from 29/30 countries
• Acinetobacter was already included in national AMR surveillance in more than half of the countries, but blood stream isolates constitute a small proportion (<5%) of all isolates in most cases
• A relatively high number of antimicrobials were included in AST panels in more than half of the countries having AST results for Acinetobacter
• Multidrug resistance in Acinetobacter was assessed in >50% of blood stream isolates in 1/4 of the countries
• The importance of Acinetobacter was perceived as “significant “ by 1/3 of the countries, while 1/3 considered Acinetobacter as being of “minor” importance
• 80% of the countries would like Acinetobacter included in EARS-Net
Acinetobacter spp surveillance in EARS-Net

EARS-Net Coordination Group advice regarding feasibility of Acinetobactersurveillance (February 2012)
• Number of isolates will be very low for some countries (blood isolates only)
• Challenges of species identification and susceptibility testing to be carefully considered – only include at spp level
• Limit the antimicrobial groups under surveillance
• Acinetobacter data collected in the HAI-PSS should be reviewed to validate EARS-Net results
Acinetobacter spp surveillance in EARS-Net

Acinetobacter spp: Number of reporting countries (green), 2012 and 2013
2012 2013
Acinetobacter spp surveillance in EARS-Net
18 countries 27 countries

18
Frequency of Acinetobacter spp. as percentage of all bacteria reported to EARS-Net, by country (n:4120), 2013
No data
<1%
1-<2 %
2-<4 %
4-<6 %
6-<8 %
>8 %
Acinetobacter spp surveillance in EARS-Net

19
Relative frequency of Acinetobacter spp. as a percentage of all microorganisms reportedfor HAIs, by country (n=366 isolates), ECDC PPS 2011–2012
* PPS data representativeness was poor in Austria, Croatia, Czech Republic, Estonia, Norway and Romania and very poor in Denmark and Sweden. See table 18 for total number of microorganisms by country.

20
Relative frequency of Acinetobacter spp. as a percentage of all microorganisms reportedfor HAIs, by country (n=366 isolates), ECDC PPS 2011–2012
* PPS data representativeness was poor in Austria, Croatia, Czech Republic, Estonia, Norway and Romania and very poor in Denmark and Sweden. See table 18 for total number of microorganisms by country.
EARS-Net

21
Acinetobacter spp. Percentage (%) of invasive isolates with
resistance to carbapenems, by country, EU/EEA, 2013

22
Percentage of Acinetobacter baumannii isolates non-susceptible to carbapenems in HAIs in acute care hospitals, ECDC PPS 2011-2012
ECDC PPS* PPS data representativeness was poor in Austria, Croatia, Czech Republic, Estonia, Norway and Romania and very poor in Denmark and Sweden. See table 18 for total number of microorganisms by country.

23
Percentage of Acinetobacter baumannii isolates non-susceptible to carbapenems in HAIs in acute care hospitals, ECDC PPS 2011-2012
ECDC PPS
EARS-Net

24
Occurrence of carbapenem-resistant Acinetobacter baumannii (CRAb) (all types of isolates) based on self-assessment by national experts, EuSCAPE project, 38 European countries, March 2013
The stage designations for CRAb should be taken with caution for all 38 participating countries. Most national experts highlighted that the exact epidemiology of CRAb remains uncertain in their country, because at the time of the survey surveillance and reporting of CRAb are not performed routinely in their country, and because only few national reference laboratory structures for CRAb exist in European countries.

25
Occurrence of carbapenem-resistant Acinetobacter baumannii (CRAb) (all types of isolates) based on self-assessment by national experts, EuSCAPE project, 38 European countries, March 2013
The stage designations for CRAb should be taken with caution for all 38 participating countries. Most national experts highlighted that the exact epidemiology of CRAb remains uncertain in their country, because at the time of the survey surveillance and reporting of CRAb are not performed routinely in their country, and because only few national reference laboratory structures for CRAb exist in European countries.
EARS-Net

26
Summary: Reporting capacity
• Number of reporting countries increased from 18 in 2013 to 27 in 2014
• Most isolates had susceptibility information on all three antimicrobial groups under regular surveillance
• Number of reported isolates were in most cases equal to or higher than estimated in 2011
• Number of reported isolates increased in most countries between 2013 and 2014
• Proportion Acinetobacter spp isolates varied between countries, and was especially high in south-eastern countries
• Frequency of Acinetobacter spp is similar as reported from ECDC PPS

27
Summary: Resistance situation
• Large variations in antimicrobial resistance of Acinetobacter spp. isolates in Europe were reported, with generally higher resistance percentages reported from countries in the south of Europe than in the north.
• Carbapenem resistance was common, and in most cases combined with resistance to fluoroquinolones and aminoglycosides.
• Results are difficult to compare between EARS-Net and PPS and EuSCAPE, but shows a similar geographical gradient

28
Suggested way forward:
• Keep surveillance of Acinetobacter spp in EARS-Net in current format:
• Reporting on genus level (i.e., Acinetobacter spp)
• Panel of antimicrobials: fluoroquinolones, aminoglycosides, carbapenems and polymyxins

Presenting penicillin susceptibility data in S. pneumoniae- improving comparability

30
The problem
30
• S. pneumoniae breakpoints for penicillin susceptibility differ depending on clinical guidelines used and site of infection.
• The use of clinical breakpoints differ between countries. Many countries are now changing fro use of CLSI to EUCAST.

31
Penicillin susceptibility in S. pneumoniae: Use of clinical breakpoints for 2012 data
31
EUCAST non-menigitis
14%
EUCAST depending on
site of infection
40%CLSI meningitis
13%
CLSI depending on site
of infection
13%
CLSI oral
13%
Mix
7%
Number of respondents: 14/29 countries

32
Use of clinical guidelines, by year, 2008-2013
0%
10%
20%
30%
40%
50%
60%
70%
80%
90%
100%
2008 2009 2010 2011 2012 2013
CLSI
EUCAST+

33

34
Penicillin susceptibility in S. pneumoniae: Reporting of quantitative information (2013)
0%
10%
20%
30%
40%
50%
60%
70%
80%
90%
100%
AT BE BG CY CZ DE DK EE EL FI FR HR HU IE IS ES LT LU LV MT NL NO PL PT RO SE SI SK UK
No info
Zone diam results %
MIC result%
Gradient strip result %

35
Suggested way forward
Present data according to fixed breakpoints:MIC S <= 0.06 mg/L (R>2 mg/L)
Limit results to non-susceptible (better harmonisation between breakpoints)?
How to achieve this?
1. MS adjust their SIR interpretation before data upload- If not possible, countries can still report data but need to inform ECDC that the set breakpoints are not used
2. ECDC analyse according to reported quantitative data- Reporting of quantitative data must increase to make this
meaningful