15 years of European AMR surveillance in perspective. Liselotte Diaz Högberg (ECDC)
25
EARSS/EARS-Net 1999-2013: 15 years of European AMR surveillance in perspective Liselotte Diaz Högberg, Expert, Surveillance and Response Unit European Centre for Disease Prevention and Control
-
Upload
european-centre-for-disease-prevention-and-control-ecdc -
Category
Health & Medicine
-
view
255 -
download
0
Transcript of 15 years of European AMR surveillance in perspective. Liselotte Diaz Högberg (ECDC)

EARSS/EARS-Net 1999-2013:15 years of European AMR surveillance in perspective
Liselotte Diaz Högberg, Expert, Surveillance and Response Unit European Centre for Disease Prevention and Control
1
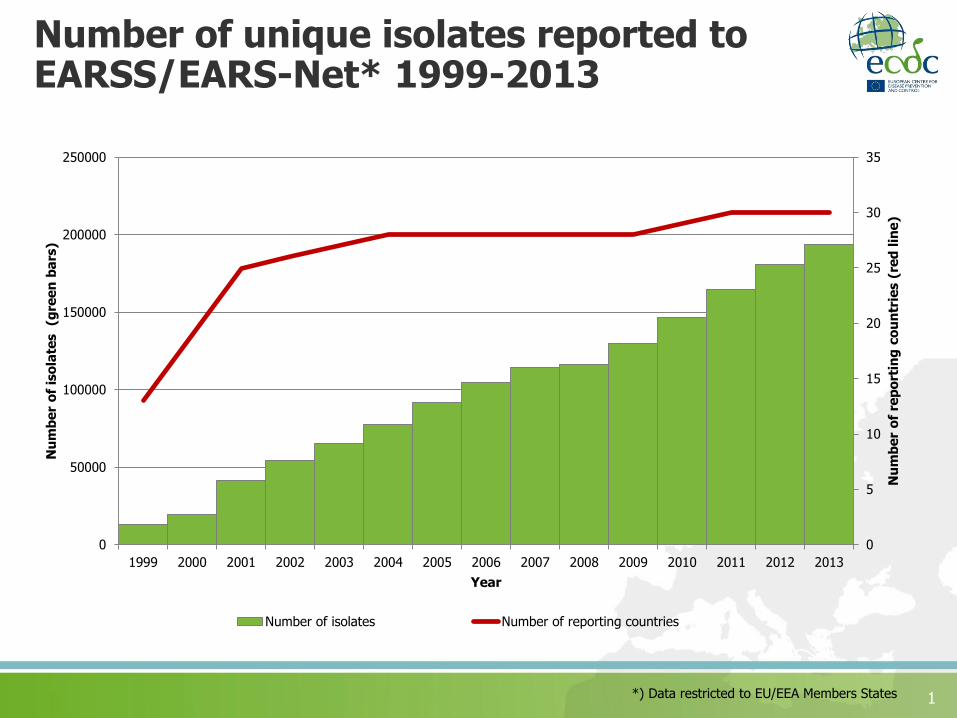
Number of unique isolates reported to EARSS/EARS-Net* 1999-2013
0
5
10
15
20
25
30
35
0
50000
100000
150000
200000
250000
1999 2000 2001 2002 2003 2004 2005 2006 2007 2008 2009 2010 2011 2012 2013
Nu
mb
er
of
rep
ort
ing
co
un
trie
s (
red
lin
e)
Nu
mb
er
of
iso
late
s
(gre
en
ba
rs)
Year
Number of isolates Number of reporting countries
*) Data restricted to EU/EEA Members States

2
Number of unique isolates reported to EARSS/EARS-Net* 1999-2013
0
5
10
15
20
25
30
35
0
50000
100000
150000
200000
250000
1999 2000 2001 2002 2003 2004 2005 2006 2007 2008 2009 2010 2011 2012 2013
Nu
mb
er
of
rep
ort
ing
co
un
trie
s (
red
lin
e)
Nu
mb
er
of
iso
late
s
(gre
en
ba
rs)
Year
Number of isolates Number of reporting countries
*) Data restricted to EU/EEA Members States
> 1 300 000 isolates!
30 countries

3
Number of unique isolates reported to EARSS/EARS-Net,* per pathogen, 1999-2013
Data from EARSS/EARS-Net. Preliminary analysis and results*) Data restricted to EU/EEA Members States
0
20000
40000
60000
80000
100000
120000
140000
160000
180000
200000
1999 2000 2001 2002 2003 2004 2005 2006 2007 2008 2009 2010 2011 2012 2013
Nu
mb
er
of
iso
late
s
Year
S. pneumoniae S. aureus P. aeruginosa K. pneumoniae
E. coli Enterococcus Acinetobacter spp

4
The world is changing: we are getting older
Population pyramid, EU-28, 2001 and 2013
Source: Eurostat
% of total population

5
The world is changing: we are getting older
Median age of population, 2001–13
Source: Eurostat
The median age in the EU-28 increased, on average, by 0.3 years per year during the past 12 years, rising from 38.3 years in 2001 to 41.9 years in 2013. During this period the median age increased in all of the EU Member States.

6
The world is changing: health and health care
Increase in incidence of bacteraemia
Source: CDC/NCHS
Similar increase has been reported from Europe (Skogberg et al 2012, de Kraker et al 2013, Buoza et al 2015 etc)

7
The world is changing: we travel more
International Tourist Arrivals 2000-2014
0
200
400
600
800
1000
1200
2000 2005 2010 2012 2013 2014
Inte
rna
tio
na
l T
ou
rist
Arr
iva
ls (
mil
lio
ns)
Year
World
EU28
Source: World Tourism Organization (UNWTO)

8
EARSS/EARS-Net: Mean age (years) for patients contributing isolates, by pathogen, 2003 -2013
50
52
54
56
58
60
62
64
66
68
70
2003 2004 2005 2006 2007 2008 2009 2010 2011 2012 2013
Me
an
ag
e (
ye
ars
)
E. coli K. pneumoniae P. aeruginosa S. aureus S. pneumoniae Enterococcus
Data from EARSS/EARS-Net. Preliminary analysis and results*) Data restricted to EU/EEA Members States

9
S. pneumoniae by age group and year
48
50
52
54
56
58
60
0%
10%
20%
30%
40%
50%
60%
70%
80%
90%
100%
1999 2000 2001 2002 2003 2004 2005 2006 2007 2008 2009 2010 2011 2012 2013
Me
an
ag
e,
ye
a s
(li
ne
)
Pe
rce
nta
ge
pe
r a
ge
gro
up
(b
ars
)
65 years or older 40 to 65 years 18 to 40 years
5 to18 years Under 5 years Mean
Data from EARSS/EARS-Net. Preliminary analysis and results*) Data restricted to EU/EEA Members States

10
E. coli by age group and year
64
65
66
67
68
69
70
0%
10%
20%
30%
40%
50%
60%
70%
80%
90%
100%
2003 2004 2005 2006 2007 2008 2009 2010 2011 2012 2013
Me
an
a
ge
(li
ne
)
Pe
rce
nta
ge
pe
r a
ge
gro
up
(b
ars
)
65 years or older 40 to 65 years 18 to 40 years
5 to18 years Under 5 years Mean
Data from EARSS/EARS-Net. Preliminary analysis and results*) Data restricted to EU/EEA Members States

11
Changes in age structure in EARSS/EARS-Net data 1998-2013
• Mean age varies between bacteria and year.
• The mean age has increased for all bacteria under EARS-Net surveillance, but the proportional increase has not been the same.
• The increase in mean age among cases contributing S. pneumoniae isolates seems to be partly explained by a decrease in the number of cases among children starting around 2007
• The increase in age among cases contributing E. coli isolates has been more gradual and seems to be partly explained by a gradual increase in elderly cases

12
K. pneumoniae: percentage resistance to fluoroquinolones, aminoglycosides, third-generation cephalosporins and carbapenems (population-weighted EU/EEA mean), by year, 2005-2013
0
5
10
15
20
25
30
35
2005 2006 2007 2008 2009 2010 2011 2012 2013
Pe
rce
nta
ge
re
sis
tan
ce
Fluoroquinolones Third-generation cephalosporins Aminoglycosides Carbapenems
Data from EARSS/EARS-Net. Preliminary analysis and results*) Data restricted to EU/EEA Members States

13
K. pneumoniae: percentage fully susceptible, and percentage resistant to one, two or three antimicrobial groups (population-weighted EU/EEA means),by year, 2005 -2013*
* Analysis restricted to isolates tested for all three antimicrobial groups of fluoroquinolones, aminoglycosides and third-generation cephalosporins
0
10
20
30
40
50
60
70
80
90
2005 2006 2007 2008 2009 2010 2011 2012 2013
Pe
rce
nta
ge
re
sis
tan
ce
Fully susceptible R to one antimicrobial group
R to two antimicrobial groups R to three antimicrobial groups
Data from EARSS/EARS-Net. Preliminary analysis and results*) Data restricted to EU/EEA Members States

14
K. pneumoniae: percentage fully susceptible, and percentage resistant to one, two or three antimicrobial groups (population-weighted EU/EEA means),by year and admission status, 2005 -2013*
Fully susceptible
* Analysis restricted to isolates tested for all three antimicrobial groups of fluoroquinolones, aminoglycosides and third-generation cephalosporins
Resistance to one antimicrobial group
___ Inpatient ____ Outpatient
0
20
40
60
80
100
2005 2006 2007 2008 2009 2010 2011 2012 2013
Perc
enta
ge f
ully
S
0
1
2
3
4
5
6
7
8
9
2005 2006 2007 2008 2009 2010 2011 2012 2013
Perc
enta
ge r
esi
stant
0
2
4
6
8
10
12
2005 2006 2007 2008 2009 2010 2011 2012 2013
Perc
enta
ge r
esi
stant
0
5
10
15
20
25
30
2005 2006 2007 2008 2009 2010 2011 2012 2013
Perc
enta
ge r
esi
stant
Resistance to two antimicrobial groups Resistance to three antimicrobial groups
Data from EARSS/EARS-Net. Preliminary analysis and results*) Data restricted to EU/EEA Members States

15
E. coli: percentage resistance to aminopenicillins, fluoroquinolones, aminoglycosides and third-generation cephalosporins (population-weighted EU/EEA mean), by year, 2005-2013
0
10
20
30
40
50
60
70
2003 2004 2005 2006 2007 2008 2009 2010 2011 2012 2013
Pe
rce
nta
ge
re
sis
tan
ce
Aminopenicillin Fluoroquinolones
Third-generation cephalosporins Aminoglycosides
Carbapenems
Data from EARSS/EARS-Net. Preliminary analysis and results*) Data restricted to EU/EEA Members States

16
E. coli: percentage fully susceptible, and percentage resistant to one, two, three and four antimicrobial groups, by year (population-weighted EU/EEA mean)*
* Analysis restricted to isolates tested for all three antimicrobial groups of aminopenicillins, fluoroquinolones, aminoglycosides and third-generation cephalosporins
0
5
10
15
20
25
30
35
40
45
50
2003 2004 2005 2006 2007 2008 2009 2010 2011 2012 2013
Pe
rce
nta
ge
Fully susceptible R to one antimicrobial group
R to two antimicrobial groups R to three antimicrobial groups
R to four antimicrobial groups
Data from EARSS/EARS-Net. Preliminary analysis and results*) Data restricted to EU/EEA Members States

17
E. coli: percentage fully susceptible, and percentage resistant to one, two or three antimicrobial groups (population-weighted EU/EEA means),by year and admission status, 2005 -2013*
Fully susceptible
* Analysis restricted to isolates tested for all three antimicrobial groups of fluoroquinolones, aminoglycosides and third-generation cephalosporins
Resistance to one antimicrobial group
___ Inpatient ____ Outpatient
Resistance to two antimicrobial groups Resistance to three antimicrobial groups
0
10
20
30
40
50
60
20032004200520062007200820092010201120122013
28
30
32
34
36
38
40
2003 2004 2005 2006 2007 2008 2009 2010 2011 2012 2013
0
5
10
15
20032004200520062007200820092010201120122013
0
2
4
6
8
2003 2004 2005 2006 2007 2008 2009 2010 2011 2012 2013
0
2
4
6
2003 2004 2005 2006 2007 2008 2009 2010 2011 2012 2013
Resistance to four antimicrobial groups
Data from EARSS/EARS-Net. Preliminary analysis and results*) Data restricted to EU/EEA Members States
0
5
10
15
20
25
30
35
2003 2004 2005 2006 2007 2008 2009 2010 2011 2012 2013
Pe
rce
nta
ge
MR
SA
Year
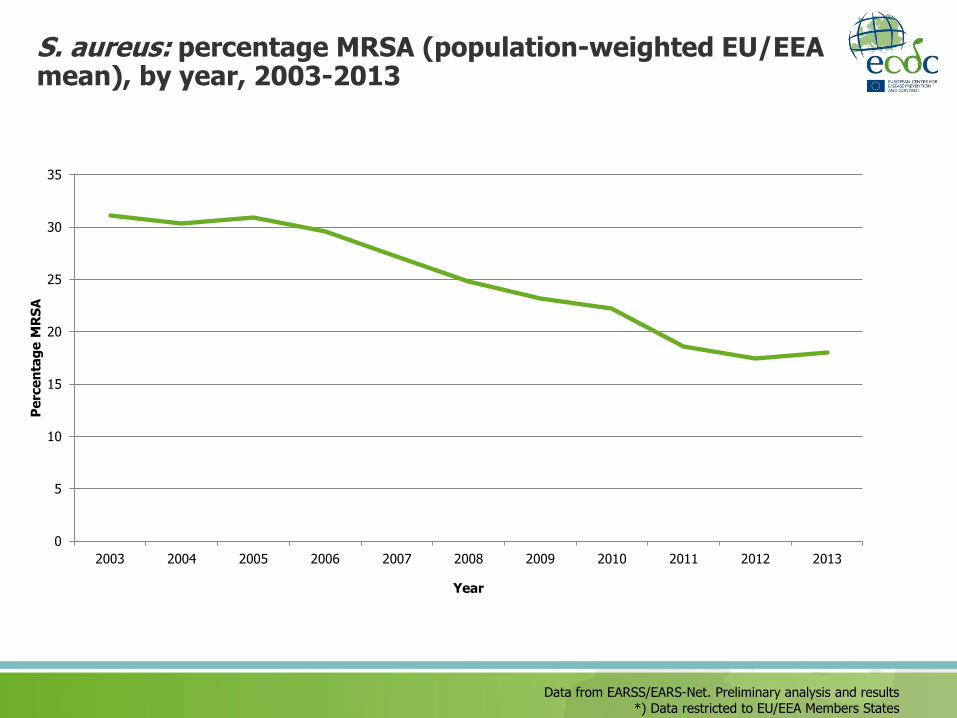
S. aureus: percentage MRSA (population-weighted EU/EEA mean), by year, 2003-2013
Data from EARSS/EARS-Net. Preliminary analysis and results*) Data restricted to EU/EEA Members States

19
S. aureus: MRSA (population-weighted EU/EEA means), by year and admission status, 2005 -2013
0
5
10
15
20
25
30
2003 2004 2005 2006 2007 2008 2009 2010 2011 2012 2013
Pe
rce
nta
ge
MR
SA
Year
Inpatient
Outpatient
Data from EARSS/EARS-Net

20
Summary resistance trends
• There was an increase in resistance for all antimicrobial groups under surveillance for E. coli and K. pneumoniaeduring the period
• The increase was larger for K. pneumoniae compared to E. coli
• In K. pneumoniae the increase was mainly in resistance to three antibiotic groups
• There were larger differences between inpatient and outpatients for K. pneumoniae compared to E. coli
• MRSA decreased during the period, but the decrease was mainly seen among inpatients
21
Thank you for your attention!
Thanks to all laboratories, hospitals and EARSS/EARS-Net network participants contributing data to the network.

22

23

24
Inpatient outpatient
0%
10%
20%
30%
40%
50%
60%
70%
80%
90%
100%
2003 2004 2005 2006 2007 2008 2009 2010 2011 2012 2013
Outpatient
Outpatient