Data Analytics: Transforming Accounting and Auditing...2/5/2019 1 Data Analytics: Transforming...
36
2/5/2019 1 Data Analytics: Transforming Accounting and Auditing IIA Chapter, Topeka KS ‐ Feb. 5, 2019 Pamela J. Schmidt, PhD. Washburn University Please complete an anonymous Research Survey INFORMED CONSENT • Description: The purpose of this research is to inform university curricula on the data analysis needs of Midwest employers. Your participation is greatly appreciated. • Benefits and Risks: We will aggregate and report our findings, which may provide helpful insight into the data analytics practices of businesses in our community. There are no risks associated with this research. • Voluntary & Confidential: All information is reported anonymously in summary form; individuals will not be identified. Participation is voluntary and will remain confidential. To withdraw, please do not return survey form. • Informed Consent: By your completing this survey, you are giving your consent to collect this information for anonymous, research purposes. Researchers: Contact us, if you have any questions about the research project: • Dr. Pamela J. Schmidt, Washburn Univ., [email protected], Ph: 785‐670‐2052 If you are willing to assist us in our research after reviewing consent above, please complete the following survey – online by PC or by Smartphone. Survey Link: https://tinyurl.com/y95h243p
Transcript of Data Analytics: Transforming Accounting and Auditing...2/5/2019 1 Data Analytics: Transforming...
2/5/2019
1
Data Analytics: Transforming Accounting and Auditing
IIA Chapter, Topeka KS ‐ Feb. 5, 2019
Pamela J. Schmidt, PhD. Washburn University
Please complete an anonymous Research Survey
INFORMED CONSENT
• Description: The purpose of this research is to inform university curricula on the data analysis needs of Midwest employers. Your participation is greatly appreciated.
• Benefits and Risks: We will aggregate and report our findings, which may provide helpful insight into the data analytics practices of businesses in our community. There are no risks associated with this research.
• Voluntary & Confidential: All information is reported anonymously in summary form; individuals will not be identified. Participation is voluntary and will remain confidential. To withdraw, please do not return survey form.
• Informed Consent: By your completing this survey, you are giving your consent to collect this information for anonymous, research purposes.
Researchers: Contact us, if you have any questions about the research project:
• Dr. Pamela J. Schmidt, Washburn Univ., [email protected], Ph: 785‐670‐2052
If you are willing to assist us in our research after reviewing consent above, please complete the following survey – online by PC or by Smartphone.
Survey Link: https://tinyurl.com/y95h243p

2/5/2019
2
Why Care about Data Analytics (aka, Big Data)?
Why Care about Data Analytics (aka, Big Data)?At Corporate level:• Business moves fast, must be Agile, Responsive to change• Competitors are learning to find value in Data
As Managers: • Business leaders make decisions: Evidence‐Based Decision Making
• Seek new business opportunities Discovery patterns, trends and insights
In Own Profession: • Seek opportunity, advancement• Avoid obsolescence

2/5/2019
3
Data Analytics: Approaches & Resources
Topics 1. What is ‘Big Data’ and Data Analytics
2. Directions in Business and Accounting Analytics
3. What can auditors expect?
4. How can Auditors prepare, and participate?
5. Data Analyst: Business, Technical Skills & Communication skills
6. Data Visualization
Historical View: Dawn of new “Data Analysis Age”
Image from ACCA & IMA “Big data: its power and perils” Nov. 2013. Access at: www.accaglobal.com/futuresIMA®: Institute of Management Accountants and is the association for accountants and financial professionals in business. ACCA is the Association of Chartered Certified Accountants and is the global body for professional accountants.
2/5/2019
4
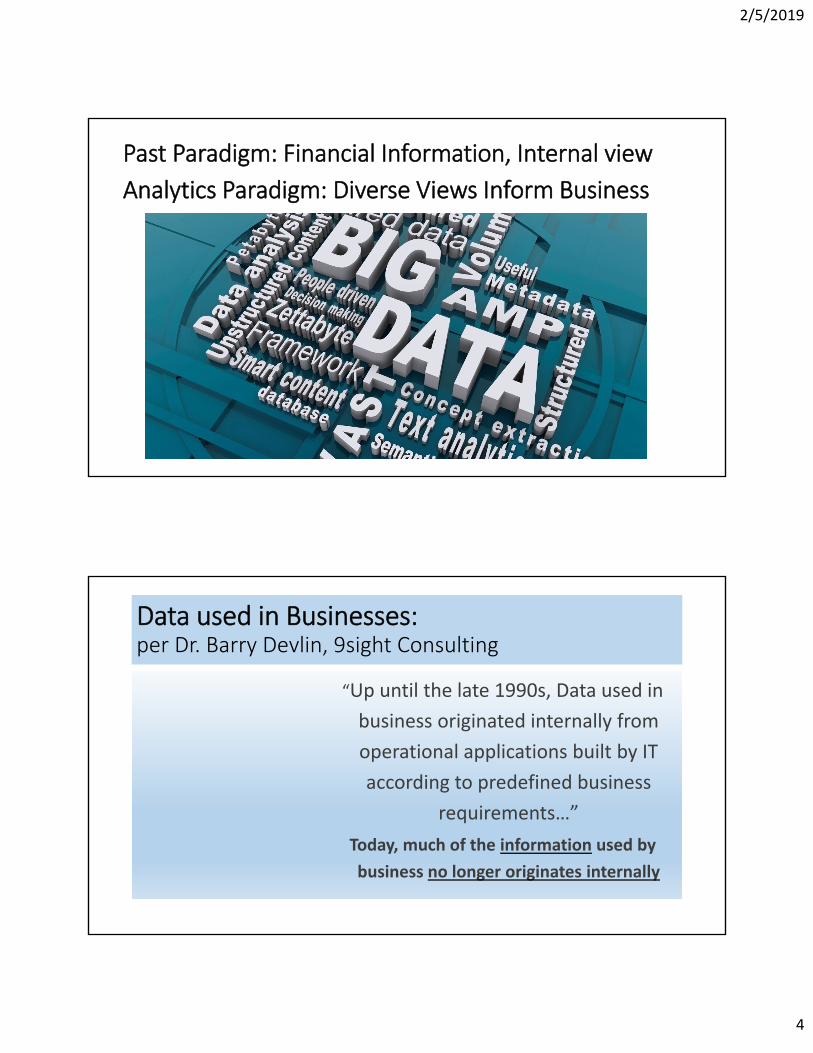
Past Paradigm: Financial Information, Internal view
Analytics Paradigm: Diverse Views Inform Business
Data used in Businesses:per Dr. Barry Devlin, 9sight Consulting
“Up until the late 1990s, Data used in
business originated internally from
operational applications built by IT
according to predefined business
requirements…”
Today, much of the information used by
business no longer originates internally
2/5/2019
5
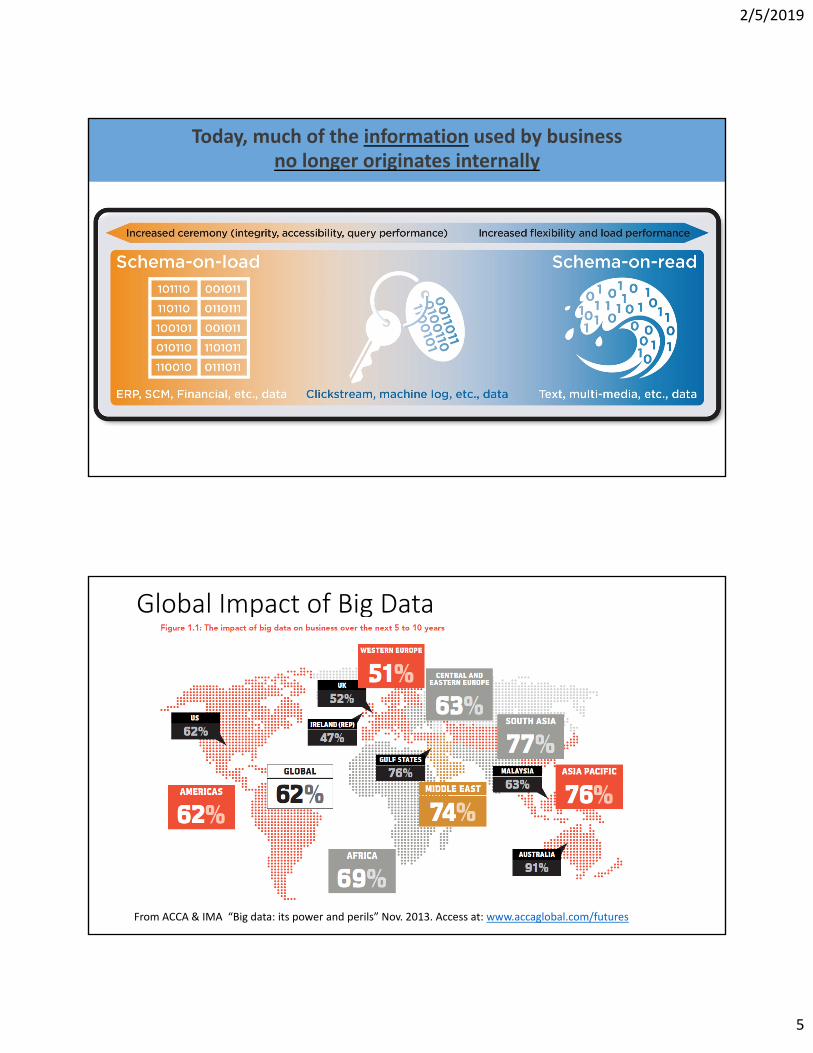
Today, much of the information used by business no longer originates internally
Global Impact of Big Data
From ACCA & IMA “Big data: its power and perils” Nov. 2013. Access at: www.accaglobal.com/futures
2/5/2019
6
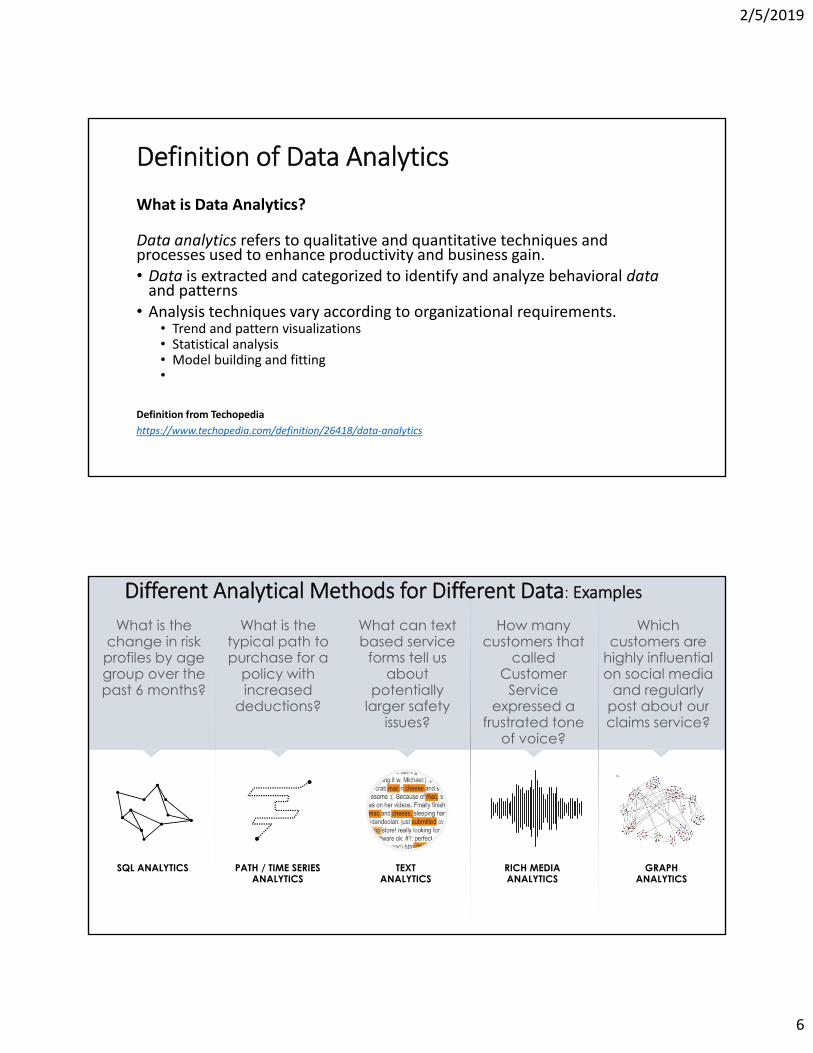
Definition of Data Analytics
What is Data Analytics?
Data analytics refers to qualitative and quantitative techniques and processes used to enhance productivity and business gain. • Data is extracted and categorized to identify and analyze behavioral dataand patterns
• Analysis techniques vary according to organizational requirements.• Trend and pattern visualizations• Statistical analysis• Model building and fitting•
Definition from Techopedia
https://www.techopedia.com/definition/26418/data‐analytics
PATH / TIME SERIESANALYTICS
TEXTANALYTICS
RICH MEDIAANALYTICS
GRAPHANALYTICS
SQL ANALYTICS
What is the change in risk profiles by age group over the past 6 months?
What is the typical path to purchase for a
policy with increased
deductions?
What can text based service
forms tell us about
potentially larger safety
issues?
How many customers that
called Customer
Service expressed a
frustrated tone of voice?
Which customers are
highly influential on social media
and regularly post about our claims service?
Different Analytical Methods for Different Data: Examples
2/5/2019
7
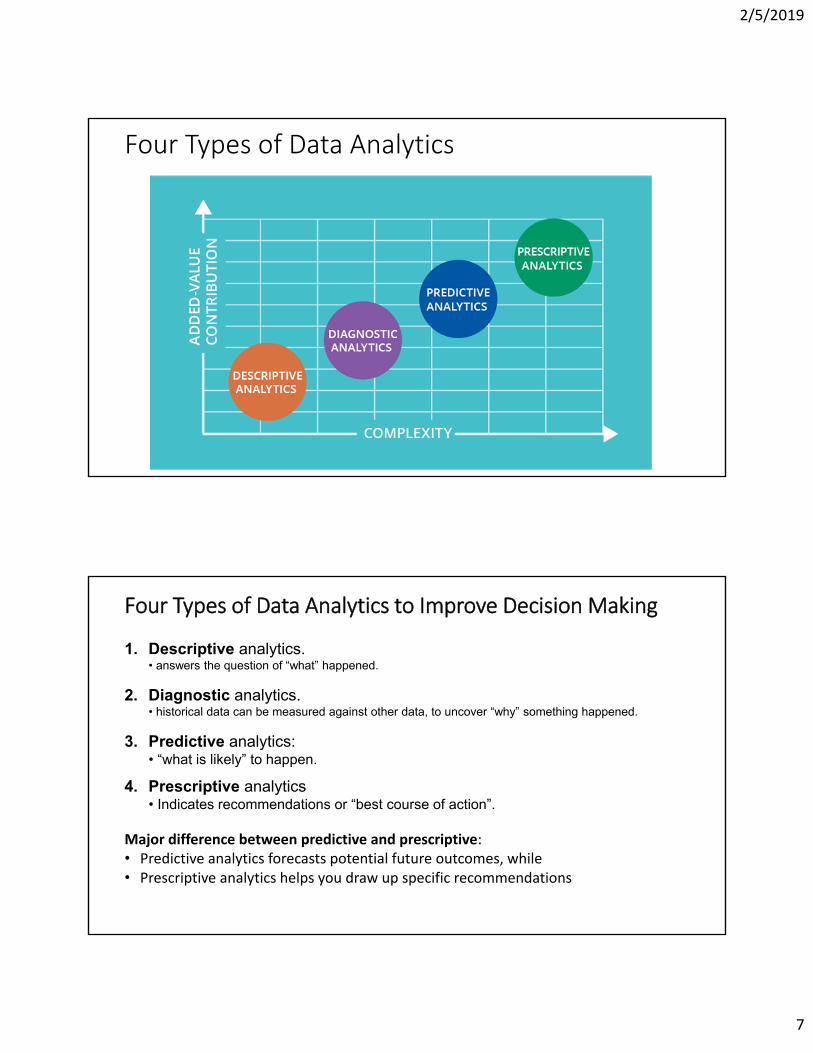
Four Types of Data Analytics
Four Types of Data Analytics to Improve Decision Making
1. Descriptive analytics. • answers the question of “what” happened.
2. Diagnostic analytics. • historical data can be measured against other data, to uncover “why” something happened.
3. Predictive analytics:• “what is likely” to happen.
4. Prescriptive analytics• Indicates recommendations or “best course of action”.
Major difference between predictive and prescriptive: • Predictive analytics forecasts potential future outcomes, while• Prescriptive analytics helps you draw up specific recommendations
2/5/2019
8
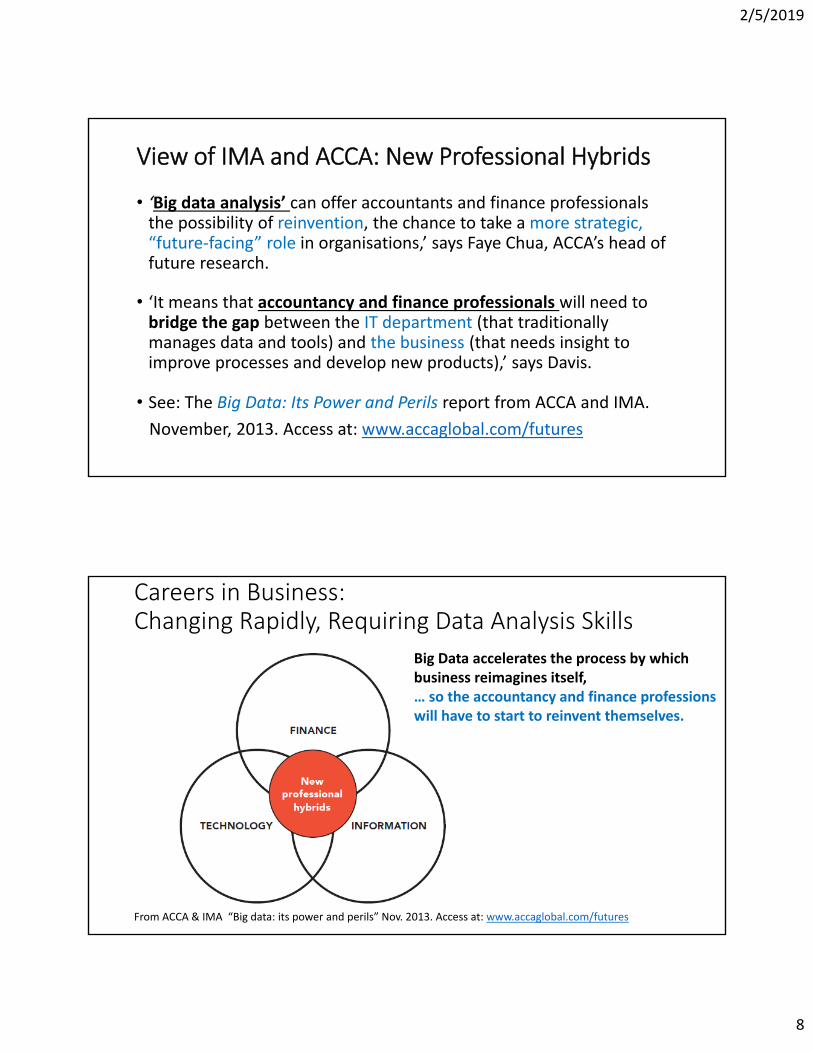
View of IMA and ACCA: New Professional Hybrids
• ‘Big data analysis’ can offer accountants and finance professionals the possibility of reinvention, the chance to take a more strategic, “future‐facing” role in organisations,’ says Faye Chua, ACCA’s head of future research.
• ‘It means that accountancy and finance professionals will need to bridge the gap between the IT department (that traditionally manages data and tools) and the business (that needs insight to improve processes and develop new products),’ says Davis.
• See: The Big Data: Its Power and Perils report from ACCA and IMA.
November, 2013. Access at: www.accaglobal.com/futures
Careers in Business: Changing Rapidly, Requiring Data Analysis Skills
From ACCA & IMA “Big data: its power and perils” Nov. 2013. Access at: www.accaglobal.com/futures
Big Data accelerates the process by which business reimagines itself, … so the accountancy and finance professions will have to start to reinvent themselves.
2/5/2019
9
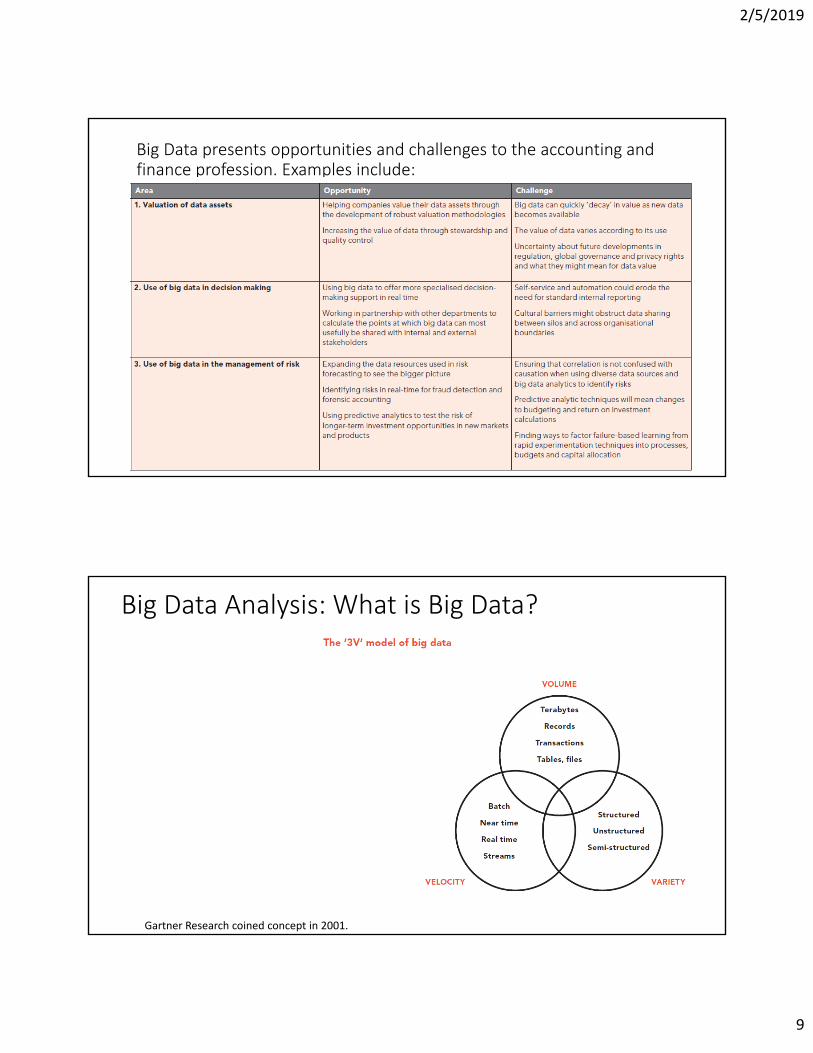
Big Data presents opportunities and challenges to the accounting and finance profession. Examples include:
Big Data Analysis: What is Big Data?
Gartner Research coined concept in 2001.
2/5/2019
10
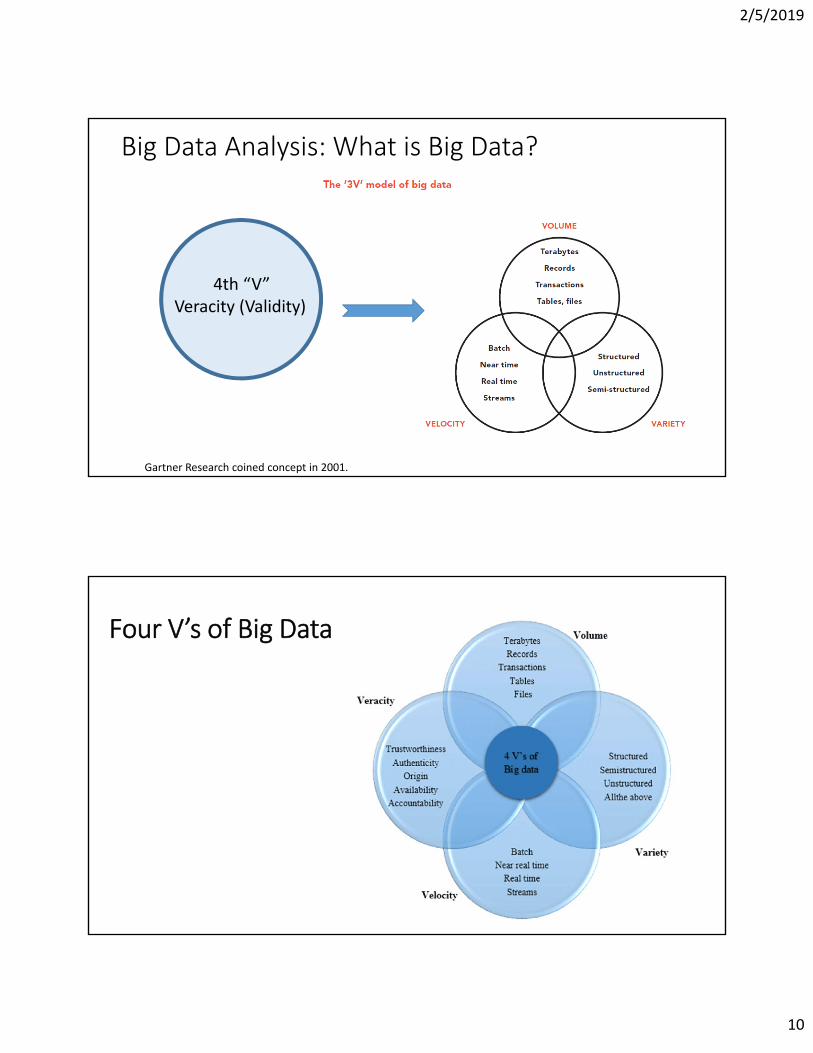
Big Data Analysis: What is Big Data?
4th “V”Veracity (Validity)
Gartner Research coined concept in 2001.
Four V’s of Big Data
2/5/2019
11
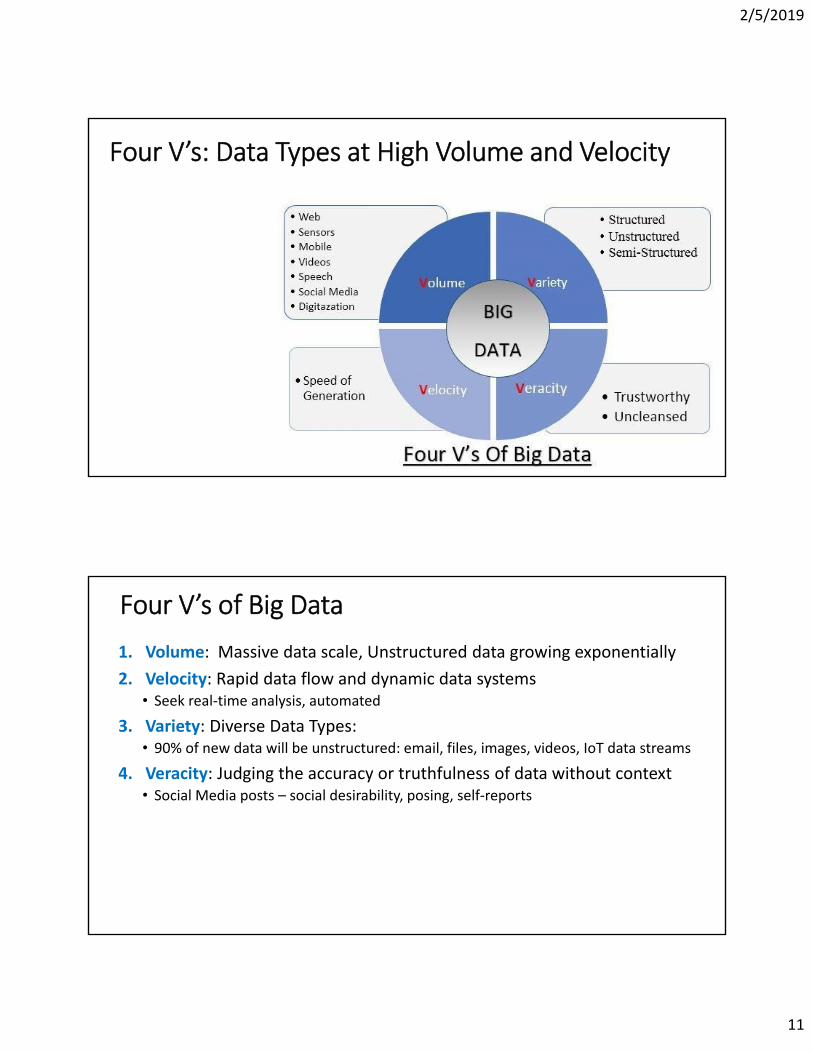
Four V’s: Data Types at High Volume and Velocity
Four V’s of Big Data
1. Volume: Massive data scale, Unstructured data growing exponentially
2. Velocity: Rapid data flow and dynamic data systems • Seek real‐time analysis, automated
3. Variety: Diverse Data Types: • 90% of new data will be unstructured: email, files, images, videos, IoT data streams
4. Veracity: Judging the accuracy or truthfulness of data without context• Social Media posts – social desirability, posing, self‐reports
2/5/2019
12
Four V’s of Big Data
1. Volume: Massive data scale, Unstructured data growing exponentially
2. Velocity: Rapid data flow and dynamic data systems • Seek real‐time analysis, automated
3. Variety: Diverse Data Types: • 90% of new data will be unstructured: email, files, images, videos, IoT data streams
4. Veracity: Judging the accuracy or truthfulness of data without context• Social Media posts – social desirability, posing, self‐reports
5th “V”
How will organizations leverage Big Data to derived VALUE?
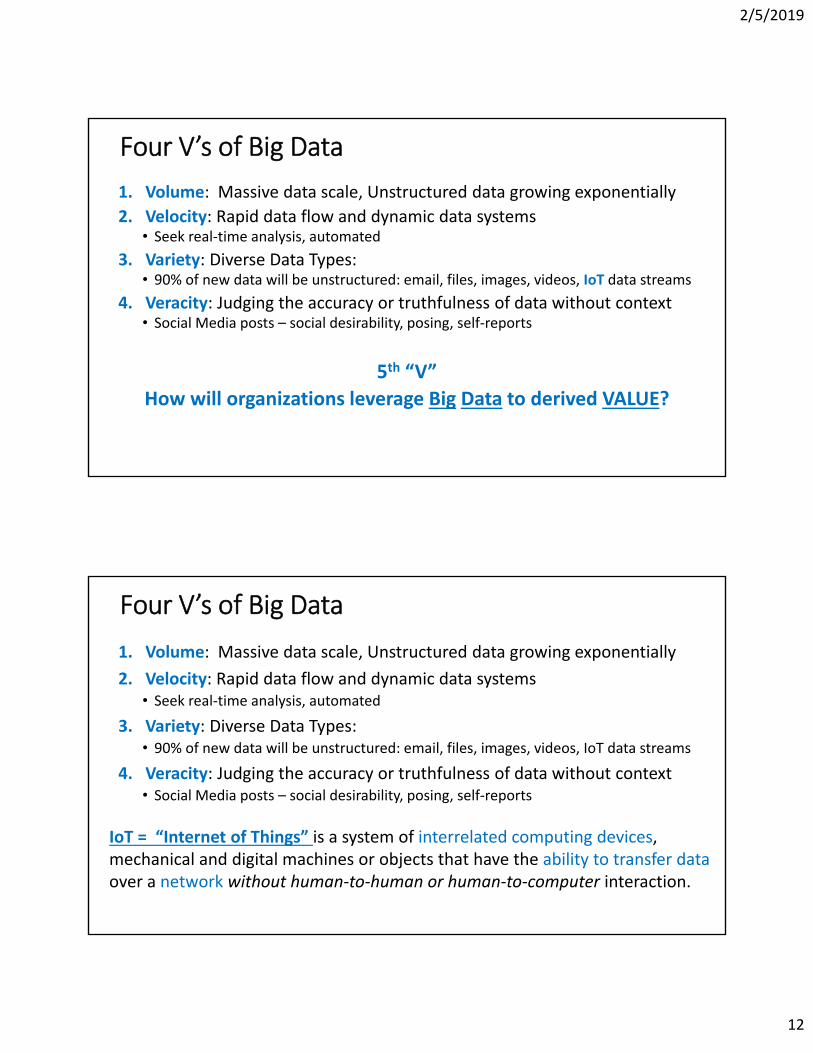
Four V’s of Big Data
1. Volume: Massive data scale, Unstructured data growing exponentially
2. Velocity: Rapid data flow and dynamic data systems • Seek real‐time analysis, automated
3. Variety: Diverse Data Types: • 90% of new data will be unstructured: email, files, images, videos, IoT data streams
4. Veracity: Judging the accuracy or truthfulness of data without context• Social Media posts – social desirability, posing, self‐reports
IoT = “Internet of Things” is a system of interrelated computing devices, mechanical and digital machines or objects that have the ability to transfer data over a network without human‐to‐human or human‐to‐computer interaction.
2/5/2019
13
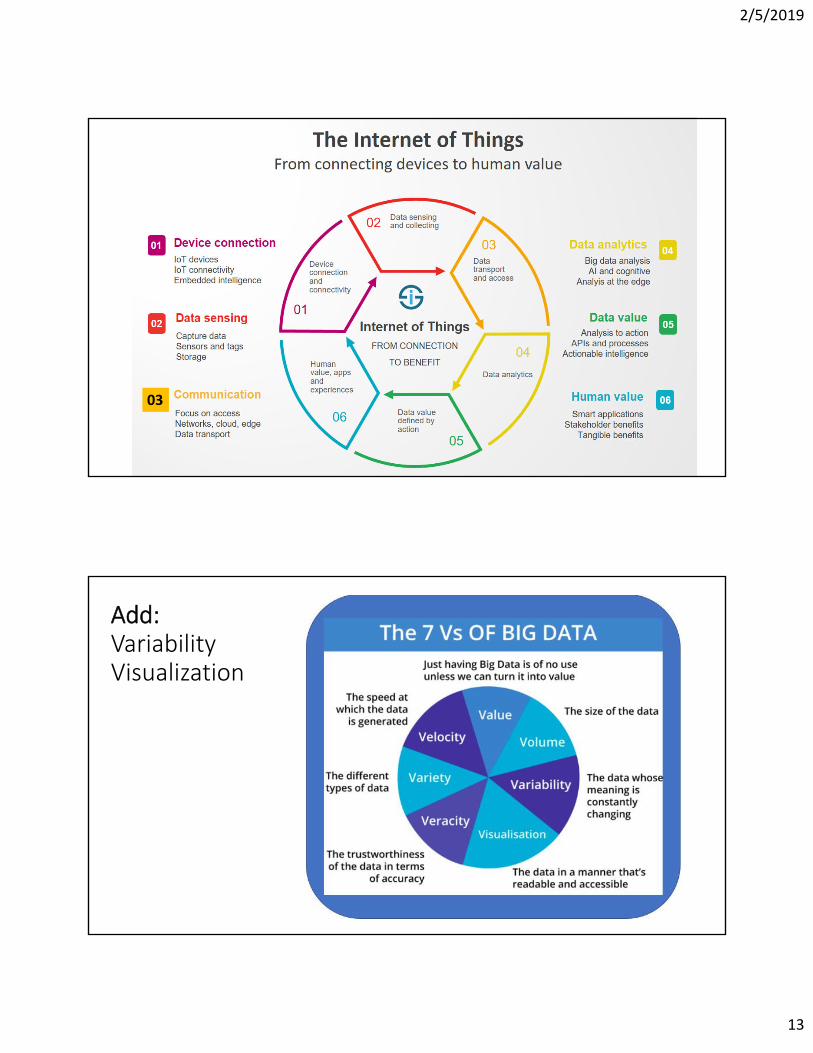
03
Add: VariabilityVisualization
2/5/2019
14
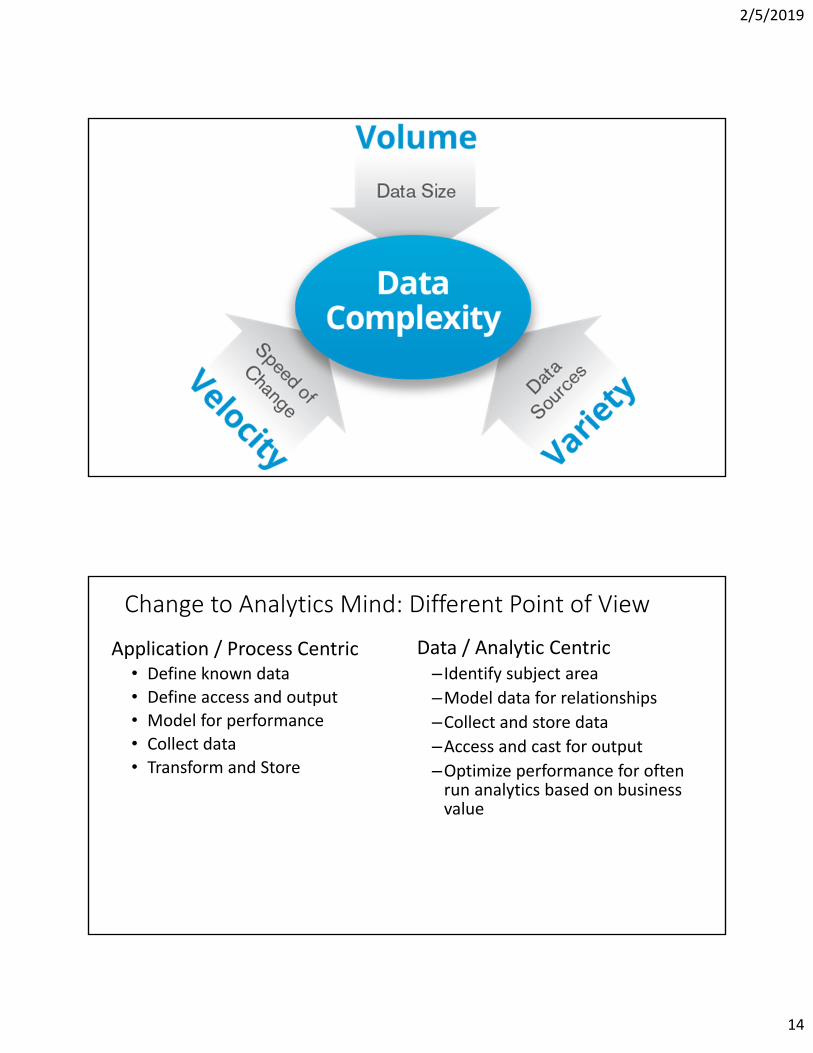
Application / Process Centric• Define known data
• Define access and output
• Model for performance
• Collect data
• Transform and Store
Change to Analytics Mind: Different Point of View
Data / Analytic Centric– Identify subject area–Model data for relationships
–Collect and store data–Access and cast for output–Optimize performance for often run analytics based on business value
2/5/2019
15
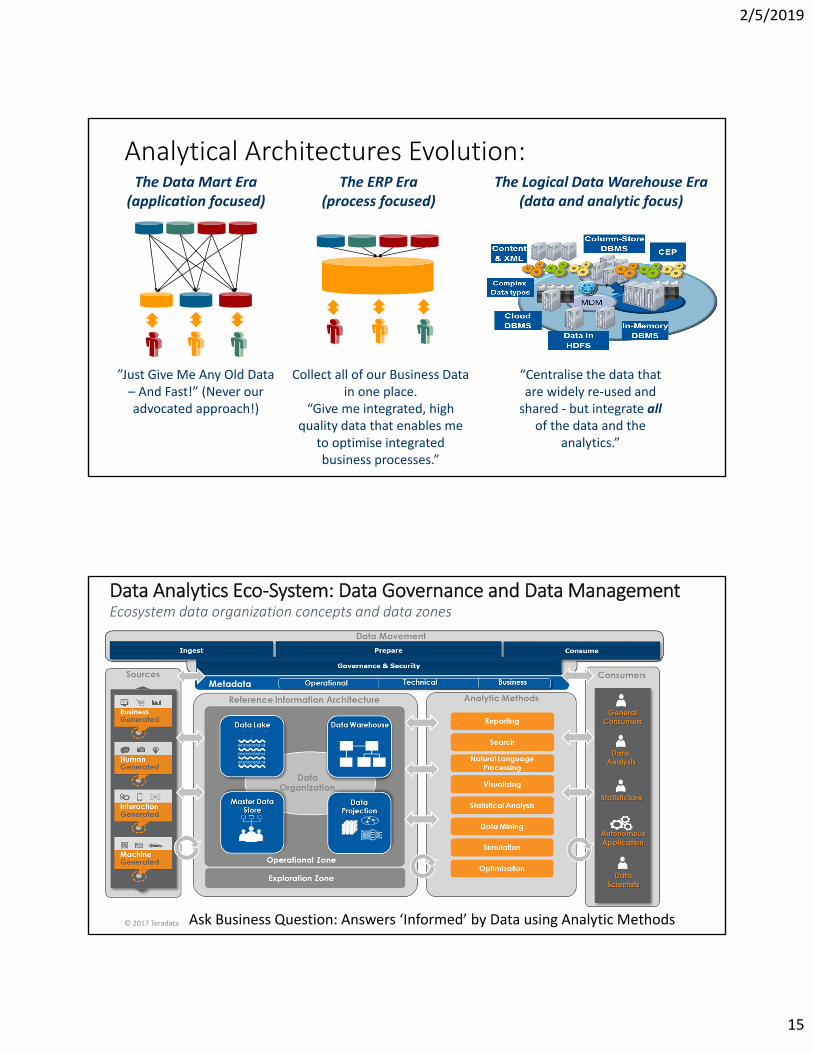
Analytical Architectures Evolution:The Data Mart Era
(application focused)The ERP Era
(process focused)The Logical Data Warehouse Era
(data and analytic focus)
”Just Give Me Any Old Data – And Fast!” (Never our advocated approach!)
“Centralise the data that are widely re‐used and shared ‐ but integrate all
of the data and the analytics.”
Collect all of our Business Data in one place.
“Give me integrated, high quality data that enables me
to optimise integrated business processes.”
Data Analytics Eco‐System: Data Governance and Data ManagementEcosystem data organization concepts and data zones
© 2017 Teradata Ask Business Question: Answers ‘Informed’ by Data using Analytic Methods

2/5/2019
16
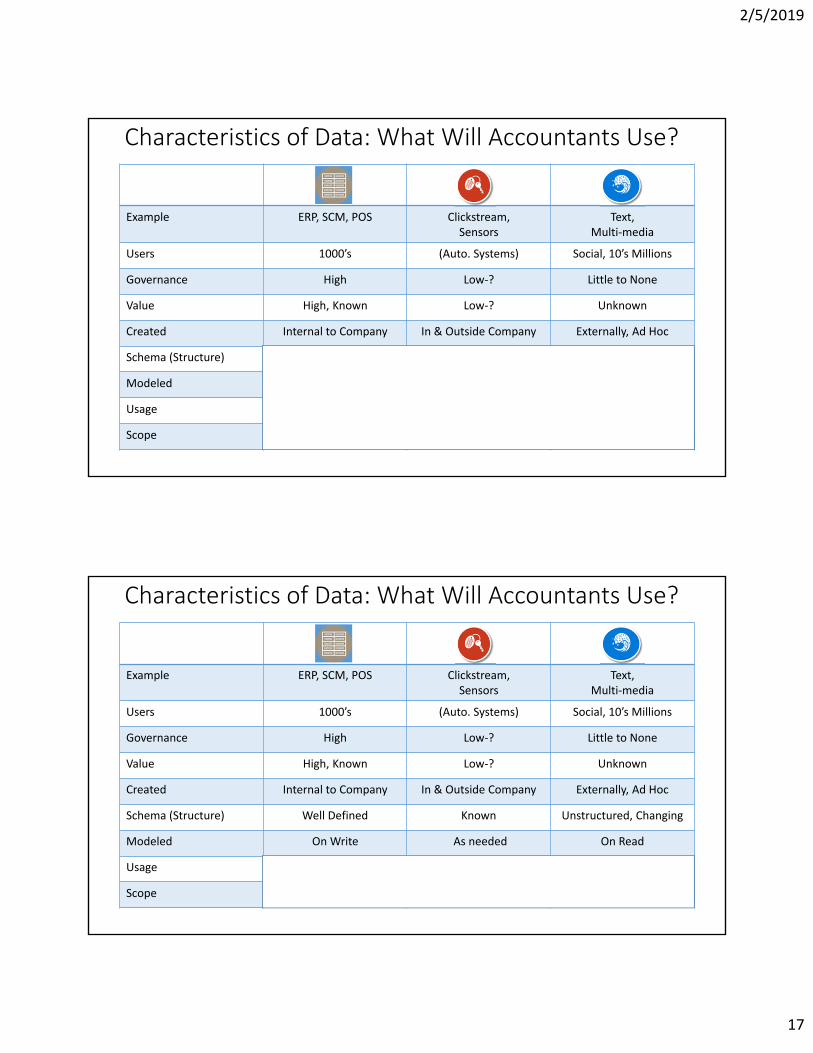
Example ERP, SCM, POS Clickstream,Sensors
Text,Multi‐media
Users 1000’s (Auto. Systems) Social, 10’s Millions
Governance High Low‐? Little to None
Value High, Known Low‐? Unknown
Created Internal to Company In & Outside Company Externally, Ad Hoc
Schema (Structure) Well Defined Known Unstructured, Changing
Modeled On Write As needed On Read
Usage Reports, KPI Monitor, Analysis Discovery
Scope Corporate Department, System Individual Society
Characteristics of Data: What Will Accountants Use?
2/5/2019
17
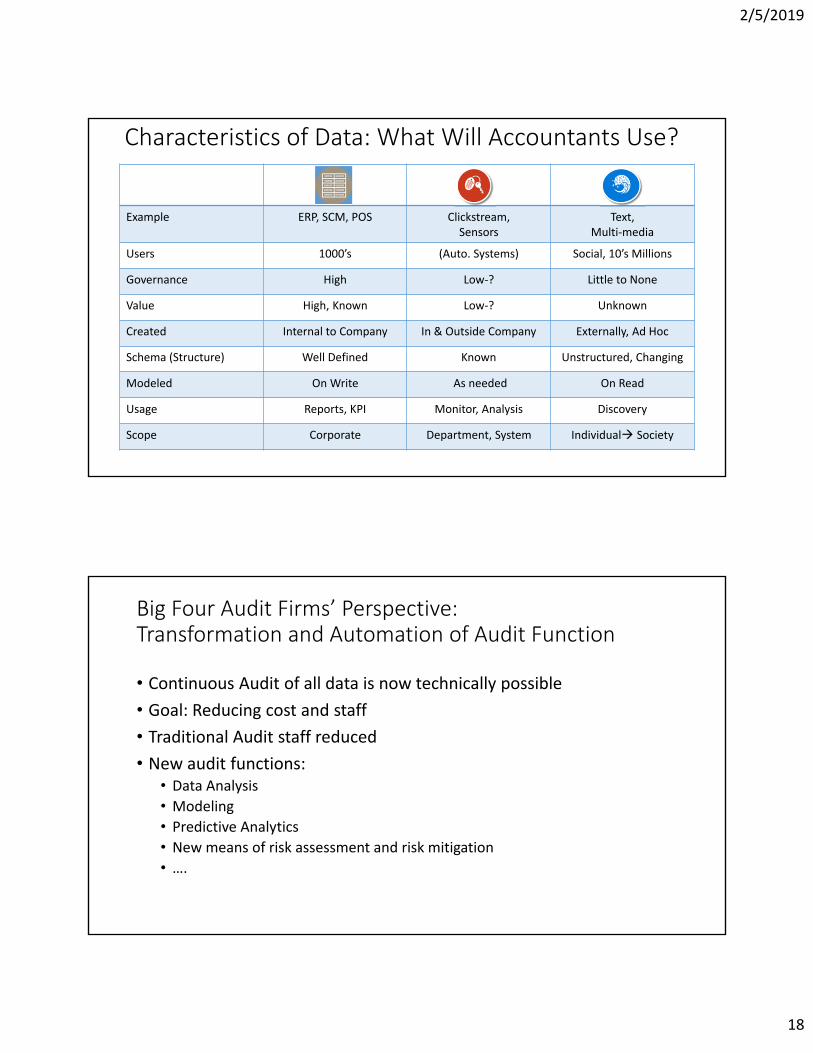
Example ERP, SCM, POS Clickstream,Sensors
Text,Multi‐media
Users 1000’s (Auto. Systems) Social, 10’s Millions
Governance High Low‐? Little to None
Value High, Known Low‐? Unknown
Created Internal to Company In & Outside Company Externally, Ad Hoc
Schema (Structure) Well Defined Known Unstructured, Changing
Modeled On Write As needed On Read
Usage Reports, KPI Monitor, Analysis Discovery
Scope Corporate Department, System Individual Society
Characteristics of Data: What Will Accountants Use?
2/5/2019
18
Example ERP, SCM, POS Clickstream,Sensors
Text,Multi‐media
Users 1000’s (Auto. Systems) Social, 10’s Millions
Governance High Low‐? Little to None
Value High, Known Low‐? Unknown
Created Internal to Company In & Outside Company Externally, Ad Hoc
Schema (Structure) Well Defined Known Unstructured, Changing
Modeled On Write As needed On Read
Usage Reports, KPI Monitor, Analysis Discovery
Scope Corporate Department, System Individual Society
Characteristics of Data: What Will Accountants Use?
Big Four Audit Firms’ Perspective:Transformation and Automation of Audit Function
• Continuous Audit of all data is now technically possible
• Goal: Reducing cost and staff
• Traditional Audit staff reduced
• New audit functions:• Data Analysis
• Modeling
• Predictive Analytics
• New means of risk assessment and risk mitigation
• ….
2/5/2019
19
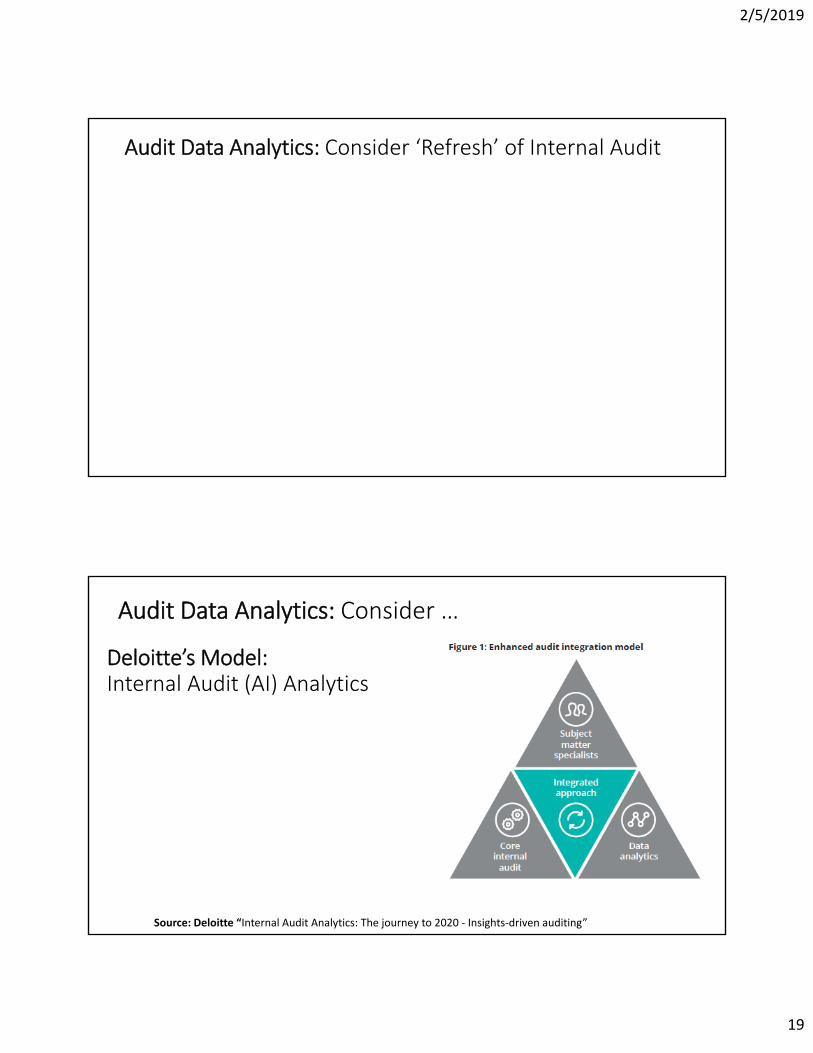
Audit Data Analytics: Consider ‘Refresh’ of Internal Audit
Deloitte’s Model: Internal Audit (AI) Analytics
Source: Deloitte “Internal Audit Analytics: The journey to 2020 ‐ Insights‐driven auditing”
Audit Data Analytics: Consider …

2/5/2019
20
1. Multidisciplinary, insights‐driven audit approach
2. Core IA professionals working with:
• data science and analytics professionals
• calling on subject matter specialists
3. Co‐developing scope, risk objectives, and approach for the internal audit
4. Internal auditors enhance effectiveness of the analytics.
Deloitte’s Model: Internal Audit (AI) Analytics
Source: Deloitte “Internal Audit Analytics: The journey to 2020 ‐ Insights‐driven auditing”
Audit Data Analytics: Consider …
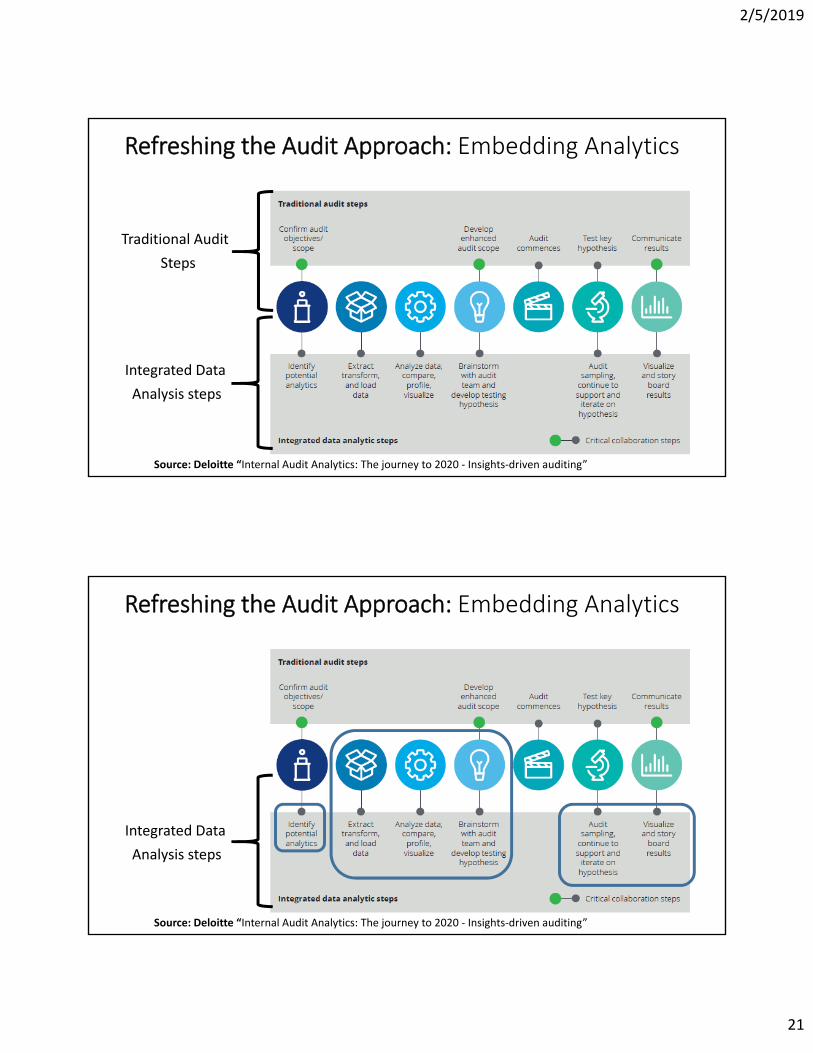
Refreshing the Audit Approach: Embedding Analytics
Source: Deloitte “Internal Audit Analytics: The journey to 2020 ‐ Insights‐driven auditing”
2/5/2019
21
Traditional Audit
Steps
Integrated Data
Analysis steps
Refreshing the Audit Approach: Embedding Analytics
Source: Deloitte “Internal Audit Analytics: The journey to 2020 ‐ Insights‐driven auditing”
Integrated Data
Analysis steps
Refreshing the Audit Approach: Embedding Analytics
Source: Deloitte “Internal Audit Analytics: The journey to 2020 ‐ Insights‐driven auditing”
2/5/2019
22
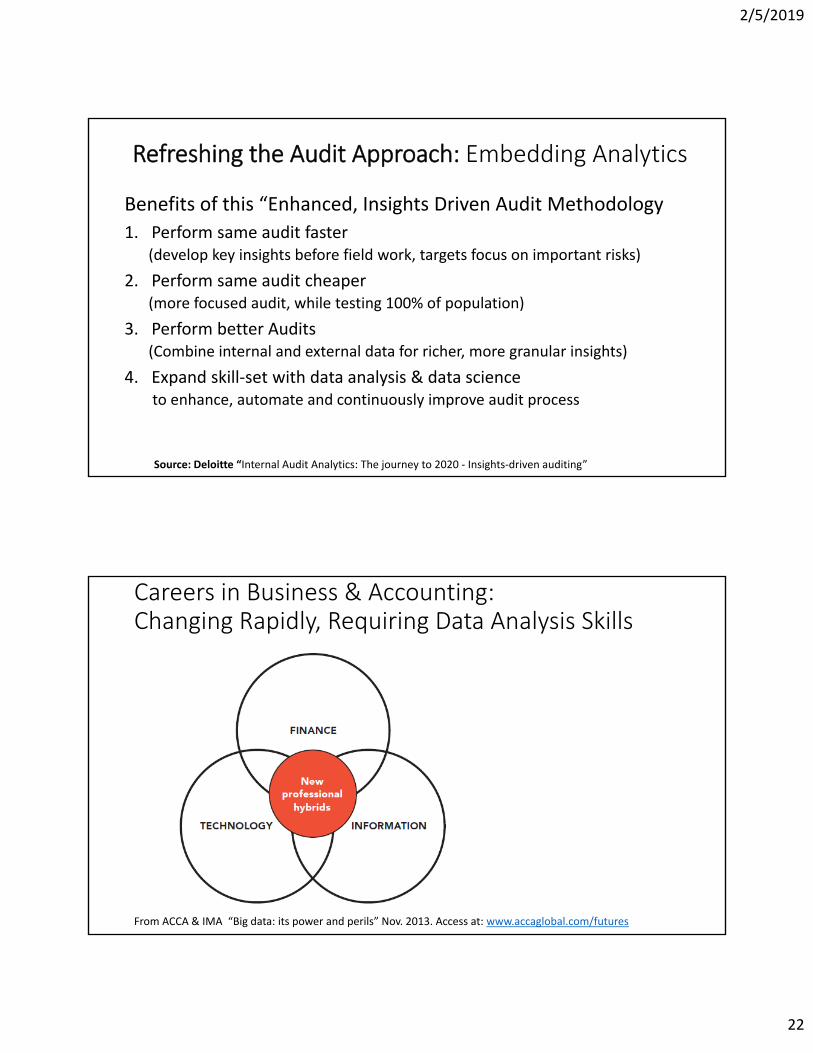
Benefits of this “Enhanced, Insights Driven Audit Methodology
1. Perform same audit faster(develop key insights before field work, targets focus on important risks)
2. Perform same audit cheaper (more focused audit, while testing 100% of population)
3. Perform better Audits (Combine internal and external data for richer, more granular insights)
4. Expand skill‐set with data analysis & data scienceto enhance, automate and continuously improve audit process
Refreshing the Audit Approach: Embedding Analytics
Source: Deloitte “Internal Audit Analytics: The journey to 2020 ‐ Insights‐driven auditing”
Careers in Business & Accounting: Changing Rapidly, Requiring Data Analysis Skills
From ACCA & IMA “Big data: its power and perils” Nov. 2013. Access at: www.accaglobal.com/futures

2/5/2019
23
Careers in Business & Accounting: Changing Rapidly, Requiring Data Analysis Skills
From ACCA & IMA “Big data: its power and perils” Nov. 2013. Access at: www.accaglobal.com/futures
Big Data accelerates the process by which business reimagines itself, … so the accountancy and finance professions will have to start to reinvent themselves.
Technical and Analytical Skills Business and Communication Skills
Data Analytics Competency Model:

2/5/2019
24
Technical and Analytical Skills Business and Communication Skills
Data Analytics Competency Model:
Data Analytics Competency Model
Source: Deloitte “Internal Audit Analytics: The journey to 2020 ‐ Insights‐driven auditing”, Figure 3.
Technical and Analytical Skills Business and Communication Skills
2/5/2019
25
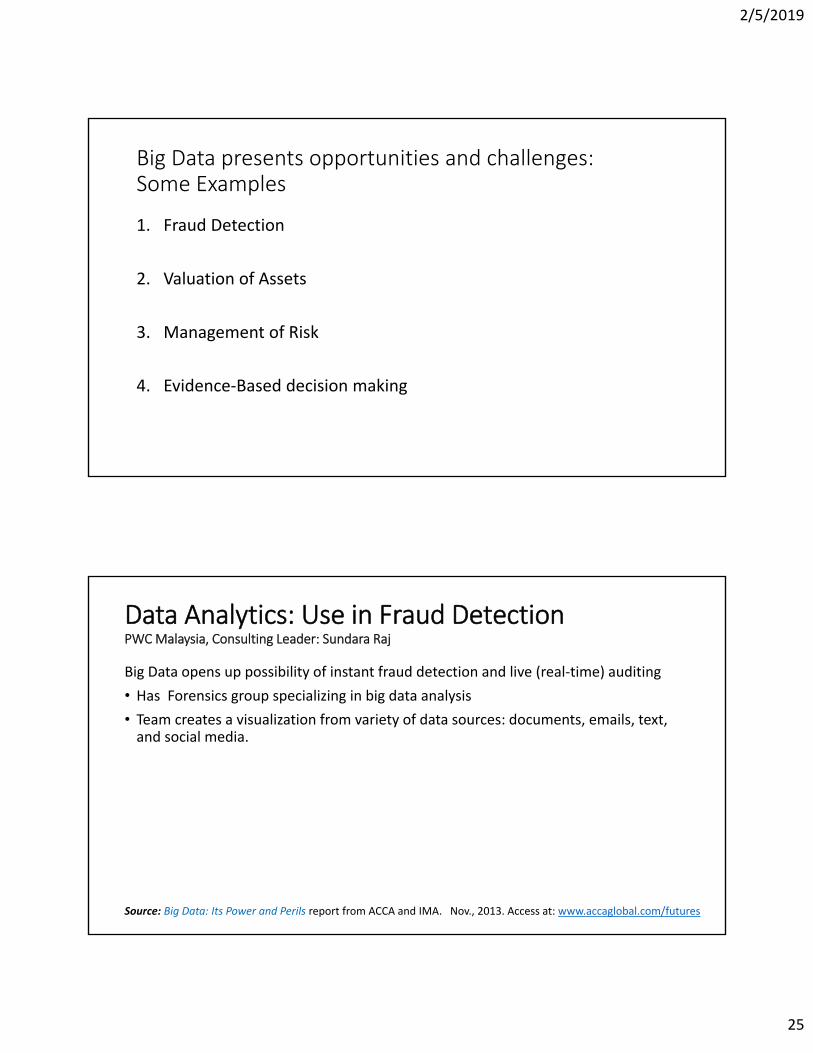
Big Data presents opportunities and challenges:Some Examples
1. Fraud Detection
2. Valuation of Assets
3. Management of Risk
4. Evidence‐Based decision making
Big Data opens up possibility of instant fraud detection and live (real‐time) auditing
• Has Forensics group specializing in big data analysis
• Team creates a visualization from variety of data sources: documents, emails, text, and social media.
Data Analytics: Use in Fraud DetectionPWC Malaysia, Consulting Leader: Sundara Raj
Source: Big Data: Its Power and Perils report from ACCA and IMA. Nov., 2013. Access at: www.accaglobal.com/futures
2/5/2019
26
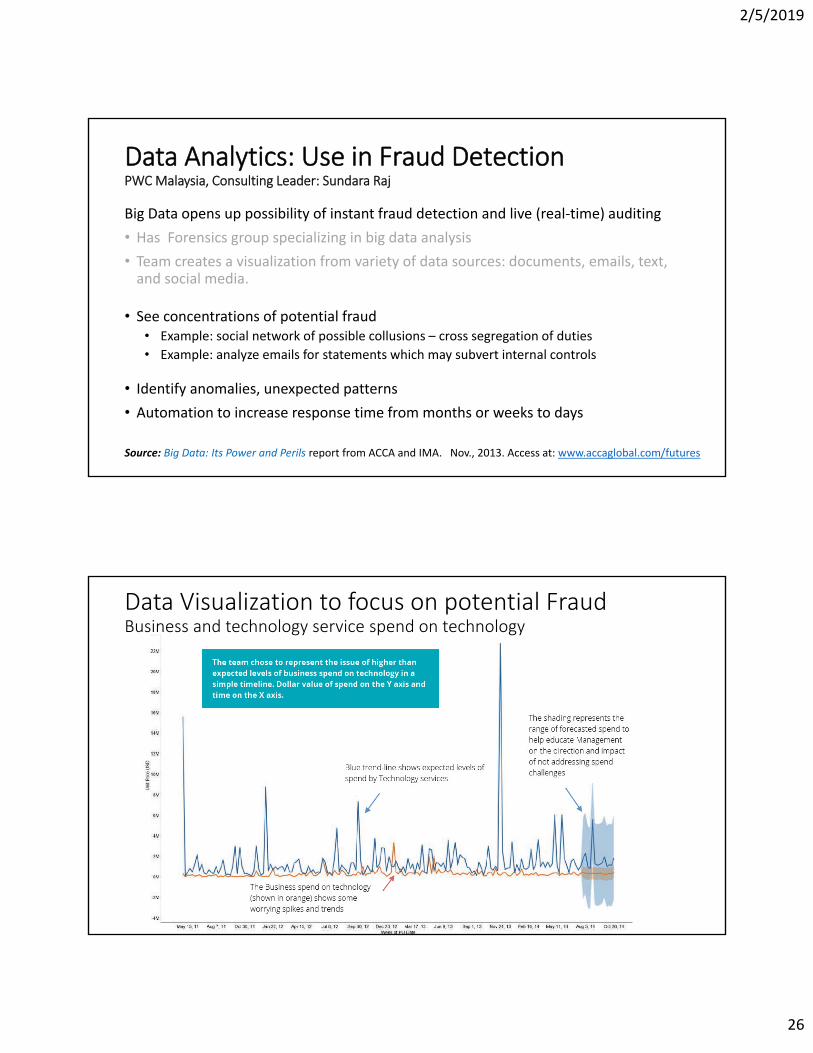
Big Data opens up possibility of instant fraud detection and live (real‐time) auditing
• Has Forensics group specializing in big data analysis
• Team creates a visualization from variety of data sources: documents, emails, text, and social media.
• See concentrations of potential fraud • Example: social network of possible collusions – cross segregation of duties
• Example: analyze emails for statements which may subvert internal controls
• Identify anomalies, unexpected patterns
• Automation to increase response time from months or weeks to days
Data Analytics: Use in Fraud DetectionPWC Malaysia, Consulting Leader: Sundara Raj
Source: Big Data: Its Power and Perils report from ACCA and IMA. Nov., 2013. Access at: www.accaglobal.com/futures
Data Visualization to focus on potential FraudBusiness and technology service spend on technology

2/5/2019
27
Data Visualization to focus on potential FraudA closer look at the Business spend
Visual Cues to Convey Message: “Big Data Dashboard”
2/5/2019
28
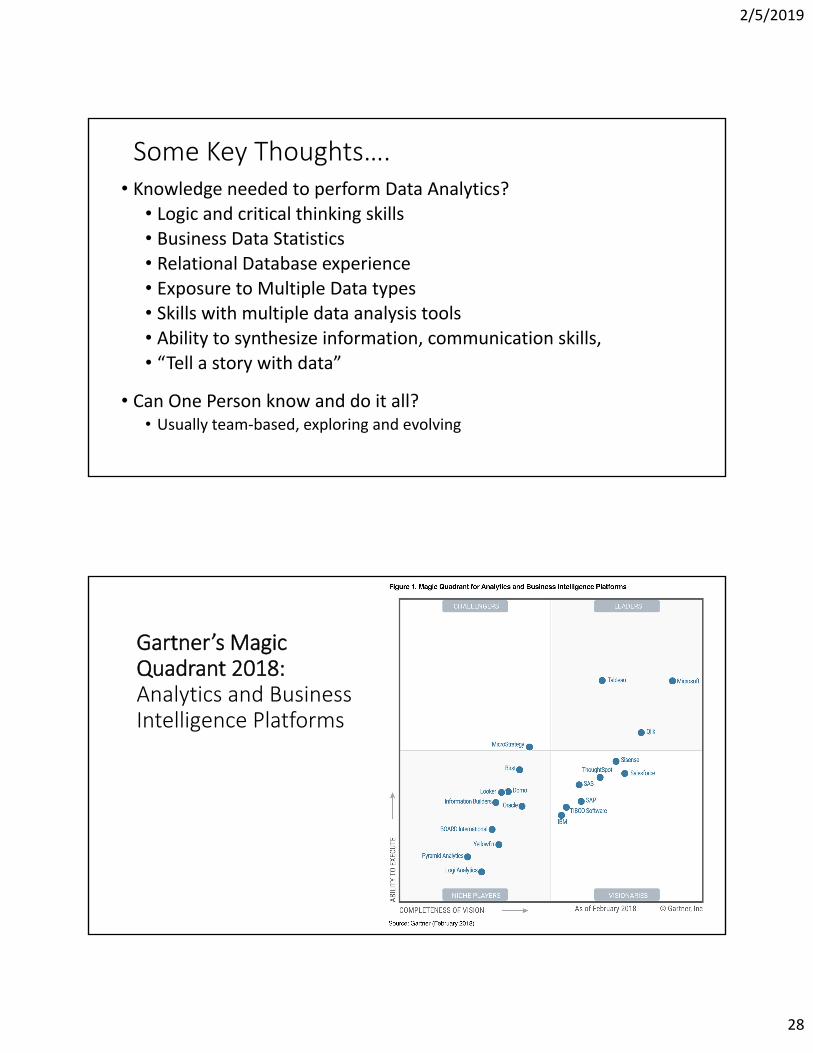
Some Key Thoughts….• Knowledge needed to perform Data Analytics?
• Logic and critical thinking skills• Business Data Statistics• Relational Database experience• Exposure to Multiple Data types• Skills with multiple data analysis tools• Ability to synthesize information, communication skills, • “Tell a story with data”
• Can One Person know and do it all? • Usually team‐based, exploring and evolving
Gartner’s MagicQuadrant 2018:Analytics and Business Intelligence Platforms

2/5/2019
29
• Microsoft Excel with plug‐ins (or standalone in “Power BI”)
• Tableau – Data Manipulation and Visualization
• Qlik View• Sisense• SAP Lumira
• SAS Business Analytics (Predicative Analytics)• IBM Business Analytics
Business Intelligence and Data Visualization Software Leaders
CRISP‐DM*: Reference Model
CRoss‐Industry Standard Process for Data Mining:
Data mining process: 6 iterative phases
1. Business understanding2. Data understanding3. Data preparation4. Modeling5. Evaluation6. Deployment
* Shearer, Colin. "The CRISP‐DM Model: the New Blueprint for Data Mining." Journal of Data Warehousing 5, no. 4 (2000): pp. 13‐22.

2/5/2019
30
Technology CompetenciesBuild your Analytics and Technology Foundation
1. Understand and use new data types from new data sources
2. Gain Data management skills: ETL: Extract/Acquire, Transform/Cleanse, Load
• Data Governance
• Structuring Big Data Collections: Data Warehouse, Data Lake, …
• Cost/Benefit of data management
3. Gain Modeling skills
• New DIY tools: Visualization, Modeling, Statistical Analysis, ….
• Programming support: Python, Open Source (R, Go) and collection of Big Data sets (Internal data paired with External)
4. Get experience with Data Analysis Tools
Technology CompetenciesBuild your Analytics and Technology Foundation, and keep building it !
Technical Skills Needed:
• Data Governance, Policy and Leadership
• Critical Thinking: Identify key question, match to data and methods to illuminate that Question.
• Programming skills
• Database knowledge (of several types of databases, data warehouse, Non‐SQL database, …)
• Statistical analysis tools and methods
• Data mining concepts and practices
• Advanced and emerging technology:
• Artificial Intelligence, Machine Learning, Neural Networks,
2/5/2019
31
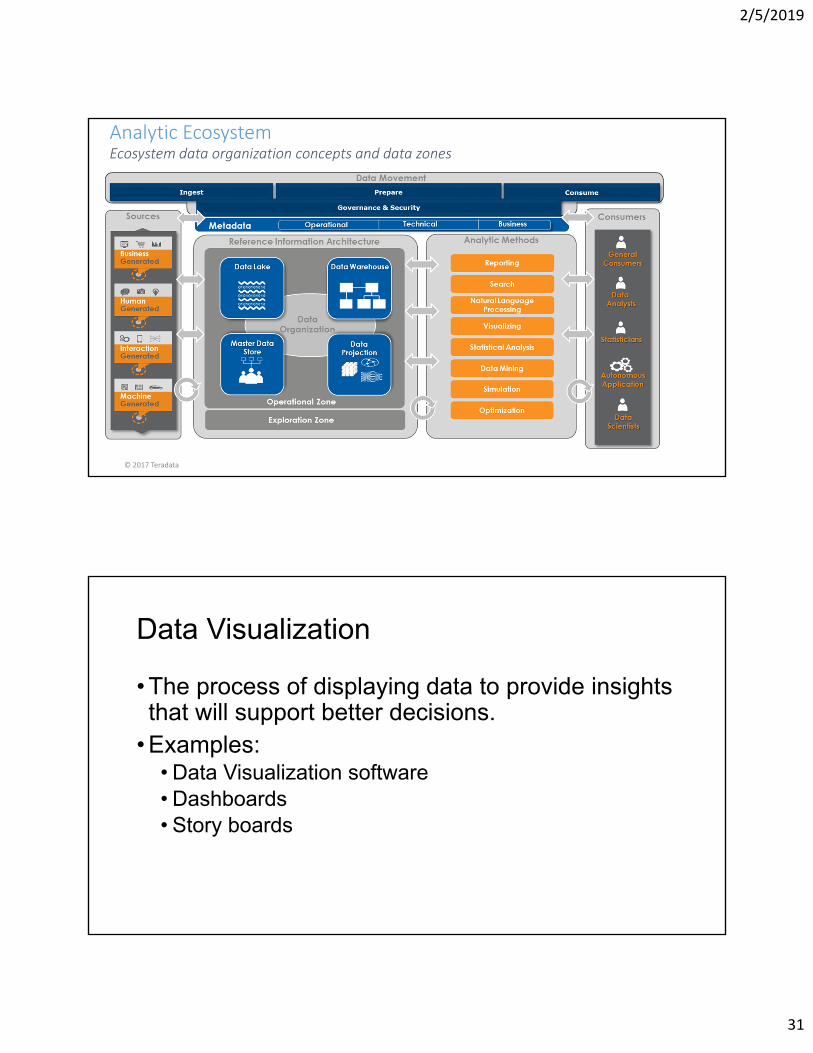
Analytic EcosystemEcosystem data organization concepts and data zones
© 2017 Teradata
• The process of displaying data to provide insights that will support better decisions.
• Examples:• Data Visualization software• Dashboards• Story boards
May 19, 2017 2017 AIS Boot Camp ‐ Chicago, IL
Data Visualization
2/5/2019
32
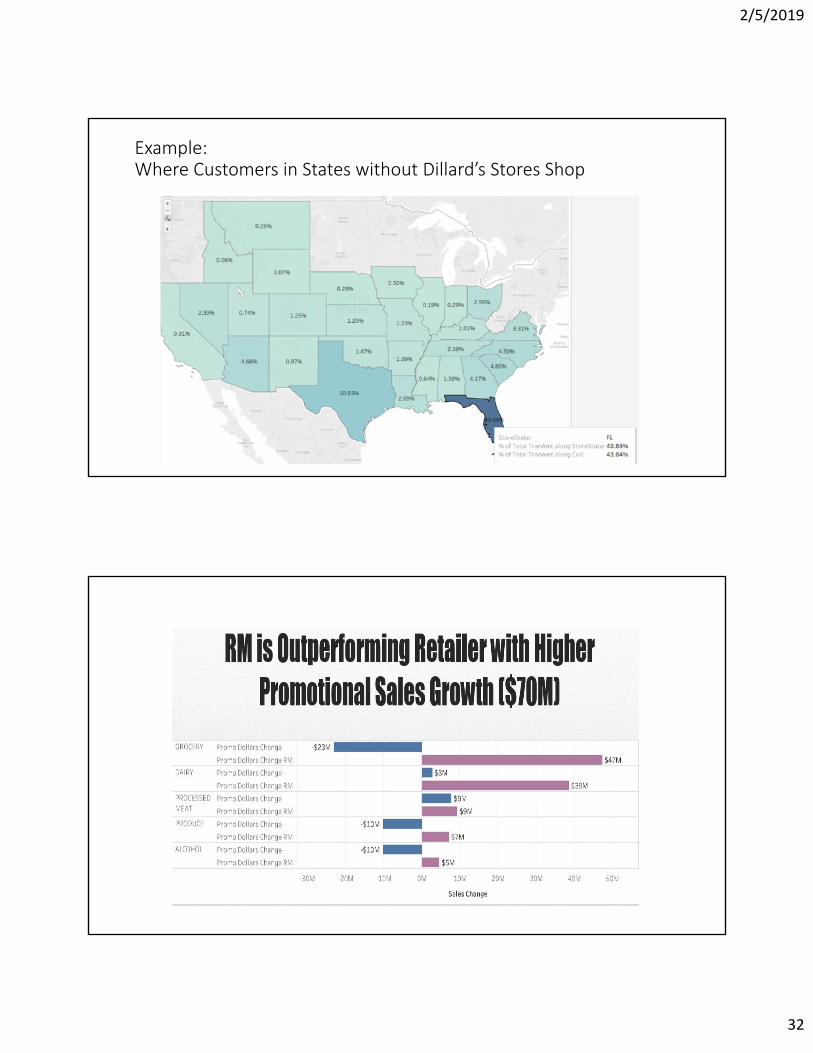
Example: Where Customers in States without Dillard’s Stores Shop
63
64
2/5/2019
33
65
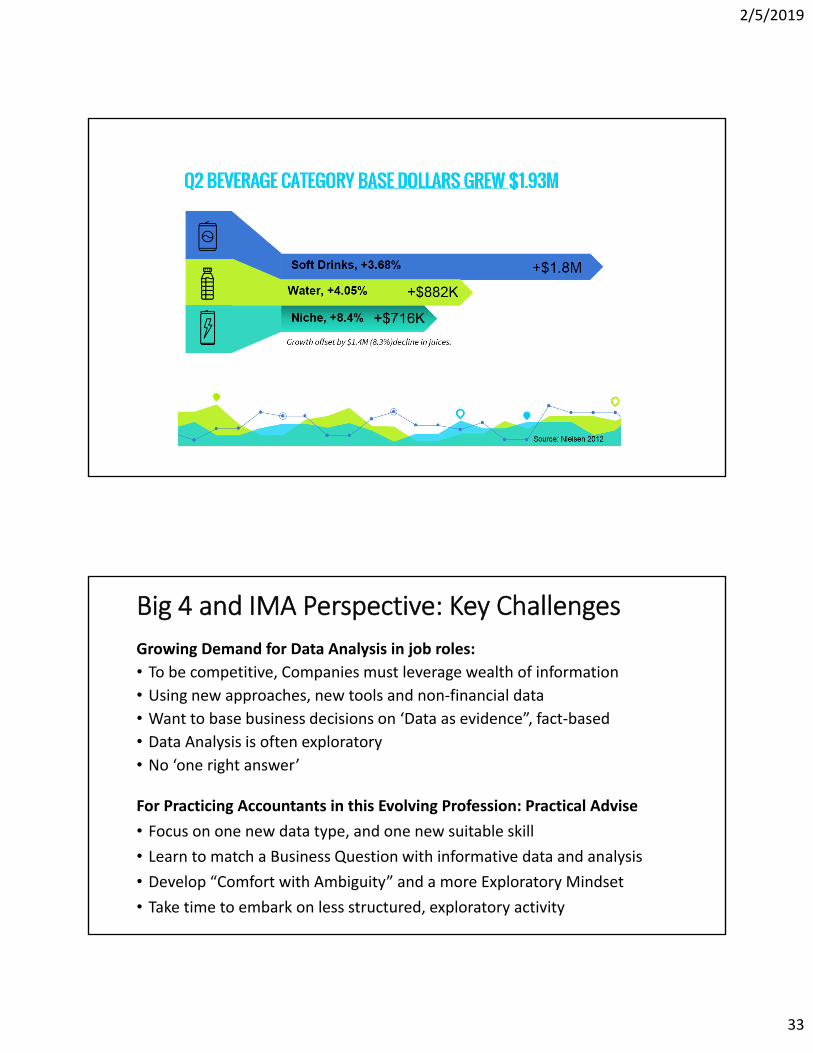
Big 4 and IMA Perspective: Key Challenges
For Practicing Accountants in this Evolving Profession: Practical Advise
• Focus on one new data type, and one new suitable skill
• Learn to match a Business Question with informative data and analysis
• Develop “Comfort with Ambiguity” and a more Exploratory Mindset
• Take time to embark on less structured, exploratory activity
Growing Demand for Data Analysis in job roles:
• To be competitive, Companies must leverage wealth of information
• Using new approaches, new tools and non‐financial data
• Want to base business decisions on ‘Data as evidence”, fact‐based
• Data Analysis is often exploratory
• No ‘one right answer’
2/5/2019
34
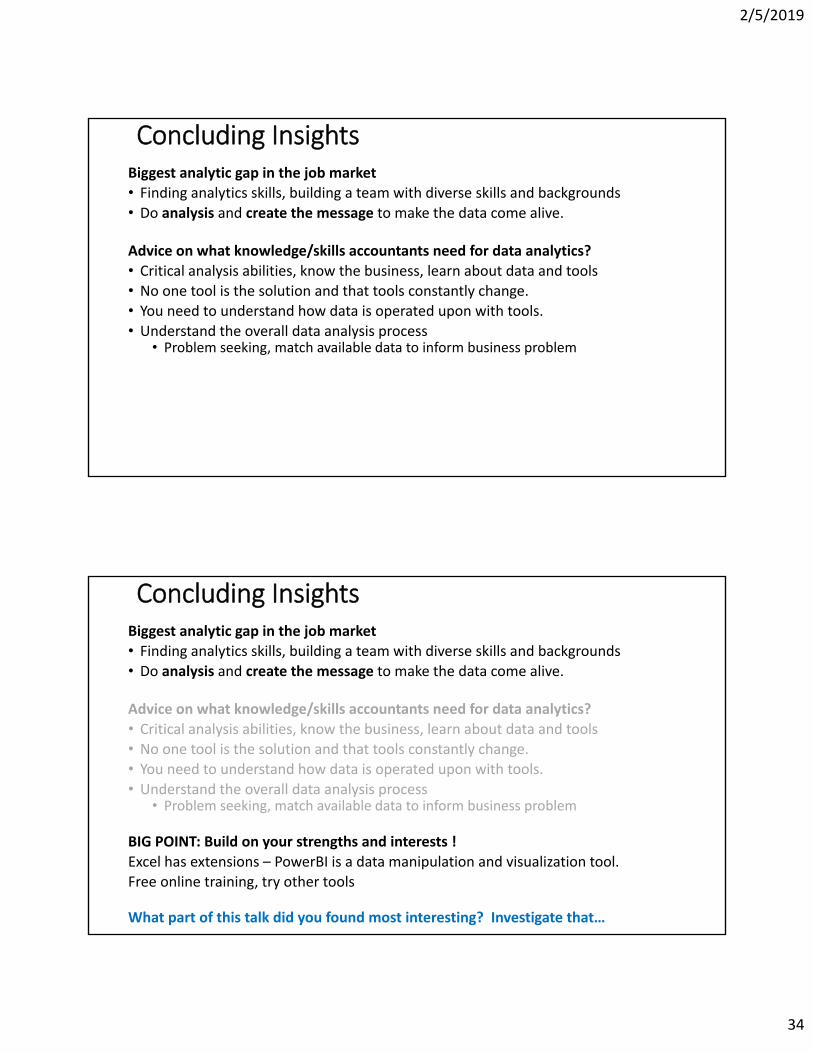
Concluding InsightsBiggest analytic gap in the job market
• Finding analytics skills, building a team with diverse skills and backgrounds
• Do analysis and create the message to make the data come alive.
Advice on what knowledge/skills accountants need for data analytics?
• Critical analysis abilities, know the business, learn about data and tools
• No one tool is the solution and that tools constantly change.
• You need to understand how data is operated upon with tools.
• Understand the overall data analysis process• Problem seeking, match available data to inform business problem
BIG POINT: Build on your strengths and interests !
Excel has extensions – PowerBI is a data manipulation and visualization tool.
Free online training, try other tools
What part of this talk did you found most interesting? Investigate that…
2/5/2019
35
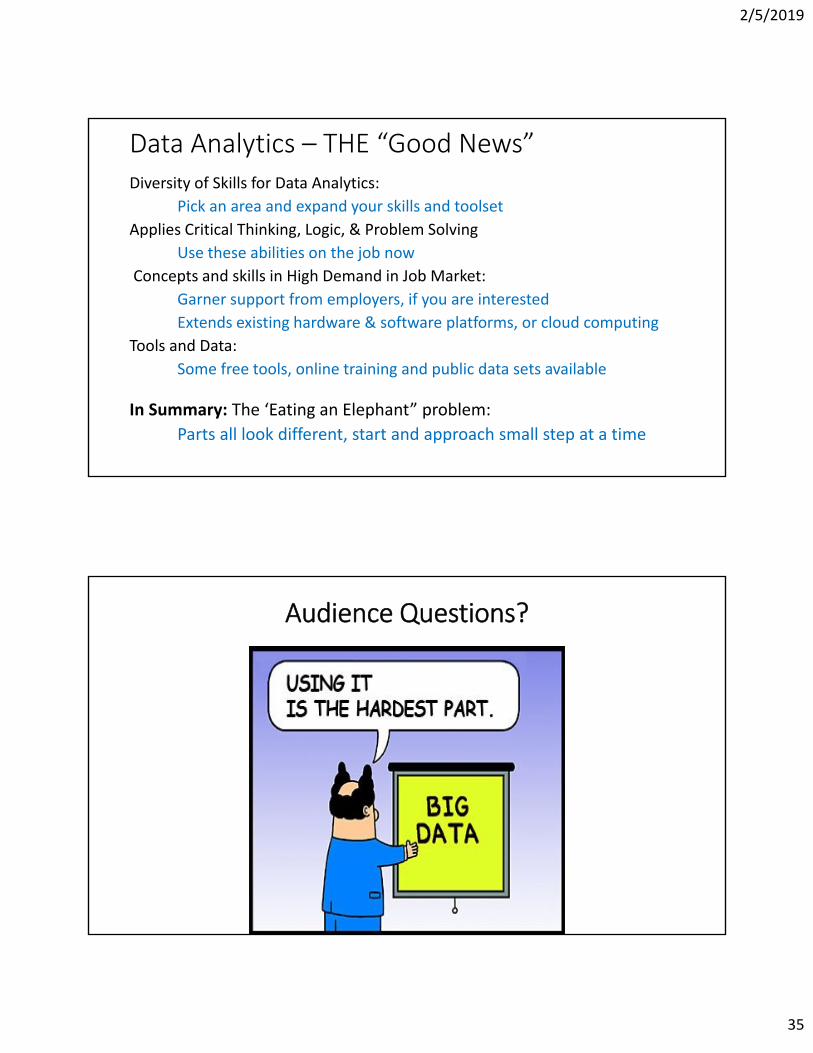
Data Analytics – THE “Good News”Diversity of Skills for Data Analytics:
Pick an area and expand your skills and toolset
Applies Critical Thinking, Logic, & Problem Solving
Use these abilities on the job now
Concepts and skills in High Demand in Job Market:
Garner support from employers, if you are interested
Extends existing hardware & software platforms, or cloud computing
Tools and Data:
Some free tools, online training and public data sets available
In Summary: The ‘Eating an Elephant” problem:
Parts all look different, start and approach small step at a time
Audience Questions?
2/5/2019
36
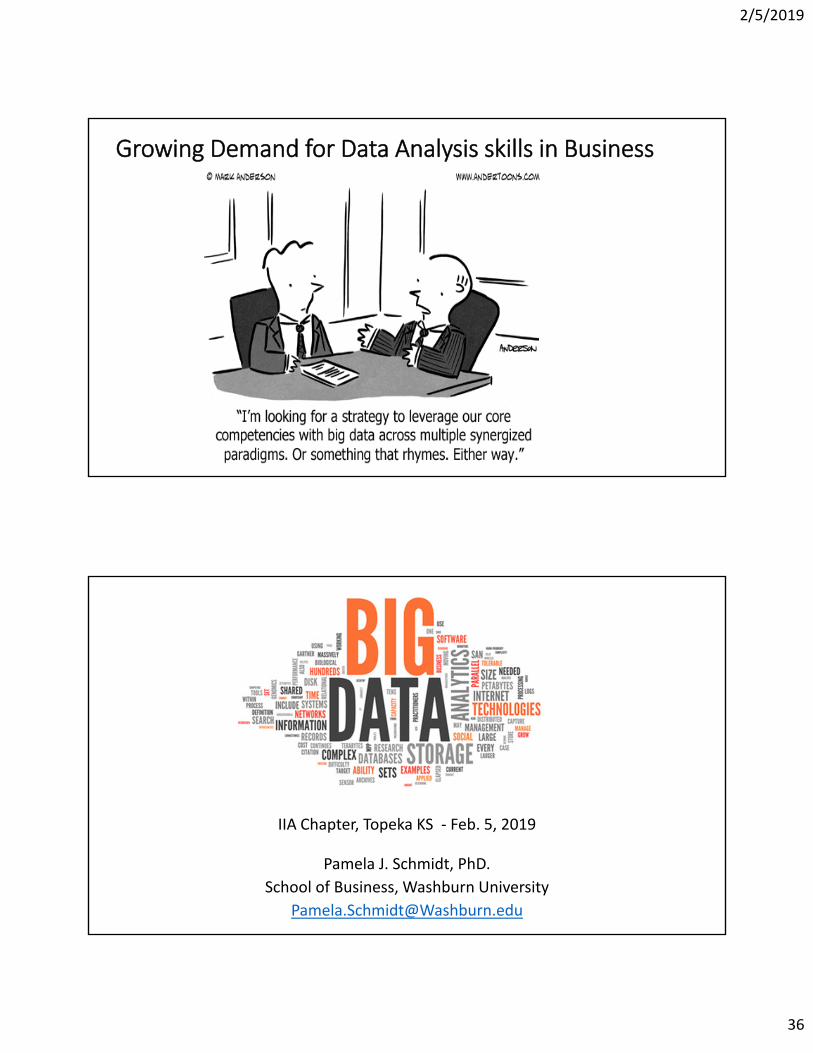
Growing Demand for Data Analysis skills in Business
IIA Chapter, Topeka KS ‐ Feb. 5, 2019
Pamela J. Schmidt, PhD.
School of Business, Washburn University