DASSAULT SYSTEMES HALF-YEAR FINANCIAL REPORT€¦ · DASSAULT SYSTEMES HALF-YEAR FINANCIAL REPORT...
34
DASSAULT SYSTEMES HALF-YEAR FINANCIAL REPORT June 30, 2013 Public limited liability company Common stock, nominal value €1 per share: 126,130,441 euros Registered Office: 10, rue Marcel Dassault – 78140 Vélizy-Villacoublay – France Versailles Commercial Register under No. 322 306 440 This document is comprised of the English language translation of Dassault Systèmes’ Half Year Report, which was filed with the AMF (French Financial Markets Authority) on July 26, 2013 in accordance with Article L.451-1-2 III of the French Monetary and Financial Code. Only the French version of the Half Year Report is legally binding.
Transcript of DASSAULT SYSTEMES HALF-YEAR FINANCIAL REPORT€¦ · DASSAULT SYSTEMES HALF-YEAR FINANCIAL REPORT...
DASSAULT SYSTEMES
HALF-YEAR FINANCIAL REPORT
June 30, 2013
Public limited liability company
Common stock, nominal value €1 per share: 126,130,441 euros
Registered Office: 10, rue Marcel Dassault – 78140 Vélizy-Villacoublay – France
Versailles Commercial Register under No. 322 306 440
This document is comprised of the English language translation of Dassault Systèmes’ Half Year Report,
which was filed with the AMF (French Financial Markets Authority) on July 26, 2013 in accordance with
Article L.451-1-2 III of the French Monetary and Financial Code.
Only the French version of the Half Year Report is legally binding.
1
Table of Contents
1 RESPONSIBILITY ..................................................................................................................... 2
1.1 Person Responsible for the Half Year Financial Report ................................................................... 2
1.2 Statement by the Person Responsible for the Half Year Financial Report ....................................... 2
2 HALF YEAR ACTIVITY REPORT .......................................................................................... 3
2.1 Summary description of Dassault Systèmes ..................................................................................... 3
2.2 Risk factors......................................................................................................................................... 5
2.3 General presentation .......................................................................................................................... 6
2.3.1 Basis of presentation of financial information ................................................................................ 6
2.3.2 Summary overview .......................................................................................................................... 8
2.3.3 Supplemental non-IFRS financial information ............................................................................. 10
2.4 Financial review of operations as of June 30, 2013 ........................................................................ 12
2.4.1 Revenue .......................................................................................................................................... 12
2.4.1.1 Software revenue......................................................................................................................... 12
2.4.1.2 Services and other revenue ......................................................................................................... 13
2.4.2 Operating expenses ........................................................................................................................ 13
2.4.3 Operating income ........................................................................................................................... 14
2.4.4 Financial income and expense, net ................................................................................................ 14
2.4.5 Income tax expense ........................................................................................................................ 14
2.4.6 Net income and diluted net income per share ............................................................................... 15
2.4.7 Cash flow ....................................................................................................................................... 15
2.5 Related party transactions ................................................................................................................ 15
2.6 2013 First Half Business Highlights................................................................................................ 16
2.7 Other corporate events ..................................................................................................................... 17
2.8 2013 Outlook ................................................................................................................................... 17
3 CONDENSED CONSOLIDATED FINANCIAL STATEMENTS FOR THE HALF YEAR
ENDED JUNE 30, 2013 .......................................................................................................................... 19
4 STATUTORY AUDITORS’ REVIEW REPORT ON THE 2013 HALF-YEAR FINANCIAL
INFORMATION ..................................................................................................................................... 33
2
1 RESPONSIBILITY
1.1 Person Responsible for the Half Year Financial Report
Bernard Charlès, President and Chief Executive Officer.
1.2 Statement by the Person Responsible for the Half Year Financial Report
Vélizy-Villacoublay, July 25, 2013
“I hereby declare that, to the best of my knowledge, the 2013 half-year condensed financial statements
have been prepared in accordance with the applicable generally accepted accounting standards and provide
a true and fair view of the company’s financial position and results of operations and those of all
companies included within the scope of consolidation, and that the half year activity report reflects a true
view of important events which occurred during the first six months of the year and of their impact on the
half year financial statements, of the principal transactions between related parties, as well as the main
risks and uncertainties for the remaining six months of the year.”
Bernard Charlès
President and Chief Executive Officer
3
2 HALF YEAR ACTIVITY REPORT
2.1 Summary description of Dassault Systèmes
As used herein, “Dassault Systèmes”, the “Company” or the “Group” refers to Dassault Systèmes SA and
all the companies included in the scope of consolidation. “Dassault Systèmes SA” refers only to the
French parent company of the Group.
Dassault Systèmes, the 3DEXPERIENCE Company, provides business and people with virtual universes
to imagine sustainable innovations. Its world-leading solutions transform the way products are designed,
produced, and supported. Dassault Systèmes’ collaborative solutions foster social innovation, expanding
possibilities for the virtual world to improve the real world. The Group brings value to over 170,000
customers of all sizes, in 12 industries, in more than 140 countries.
3DEXPERIENCE Software Applications Portfolio
The Company’s 3DEXPERIENCE software applications portfolio is designed to enable the powering of
3D realistic virtual experiences and is comprised of social and collaborative applications, 3D modeling
applications, content and simulation applications, and information intelligence applications.
Since its inception, the Company has focused on creating a portfolio of leading software brands, each
focused on a specific critical application market. The Company continues to develop its brands and create
new brands to expand its addressable market, and, in addition, has begun the introduction of industry
solution experiences. These solutions are designed on an industry-by-industry basis, and are built by
‘‘industry-relevant modules’’ of several (or all) of its brand applications with the aim of modeling the
company value chain. It is a solution designed to trigger and connect the value created by each discipline
in an industry to ensure that the company value stream is not interrupted.
The Company continues to invest in research and development as well as targeted acquisitions to advance
its brand portfolio and introduce new brands. Its application coverage has enabled it to expand its
addressable market to reach new industries, domains and key business processes within the industries
served.
The Company’s software applications are focused on helping customers address many of their most
critical product issues:
• Innovation to create delightful customer experiences;
• Product quality;
• Time-to-market;
• Globalization (design/manufacture anywhere);
• Supply chain collaboration;
• Regulatory compliance;
• IP protection;
• Manufacturing efficiency; and
• Social innovation.
4
History and Market Leadership
Dassault Systèmes was established in 1981 through the spin-off of a small team of engineers from
Dassault Aviation, which was developing software to design wind tunnel models and therefore reduce the
cycle time for wind tunnel testing, using surfacing modeling in three dimensions (“3D”). The Company
entered into a distribution agreement with IBM the same year and started to sell its software under the
CATIA brand. With the introduction of its Version 3 (“V3”) architecture, the foundations of 3D modeling
for product design were established in 1986.
Through its work with large industrial customers, the Company learned how important it was for them to
have a software solution that would support the design of highly diversified parts in 3D. The growing
adoption of 3D design for all components of complex products, such as airplanes and cars, triggered the
vision for transforming 3D part design process into a systematic integrated product design. The Version 4
(“V4”) architecture was created, opening new possibilities to realize full digital mock-ups (“DMU”) of
any product. The V4 architected software solutions helped customers reduce the number of physical
prototypes and realize substantial savings in product development cycle times, and it made global
engineering possible as engineers were able to share their ongoing work across the globe virtually.
In order to fulfill the mission to provide a robust 3D Product Lifecycle Management (“PLM”) solution
supporting the entire product lifecycle from virtual design to virtual manufacturing, the Company
developed and introduced its next software architecture in 1999, Version 5 (“V5”). In conjunction with its
development plans around its strategy and product portfolio development plans, the Company undertook a
series of targeted acquisitions expanding its software applications portfolio offering to include digital
manufacturing, realistic simulation, product data management and enterprise business process
collaboration.
In 2012, the Company unveiled its new horizon, 3DEXPERIENCE, expanded its purpose from product to
nature and life, and introduced its initial industry solution experiences. The 3DEXPERIENCE platform is
a business platform enabled to be used on premise or online, in a public or private Cloud leveraging the
Company’s current technology architecture Version 6 (“V6”).
The Company is the world leader of the global Product Lifecycle Management market based upon end-
user software revenue (source: CIMDATA).
Technology
The Company has a substantial commitment to technological innovation. Important areas of investment in
R&D include, among others, systems engineering, industry-specific offerings, cloud-based applications,
mobility, search-based technologies and bio-intelligence. From a user perspective, the Company’s
research is centered on advancing its virtual technologies to provide a more realistic 3DEXPERIENCE,
reducing total cost of ownership through out-of-the-box industry solutions, simplifying adoption in
particular for small and mid-sized companies through the introduction of on-the-cloud offerings, and
broadening adoption through further advances in ease-of-use while offering robust technology to a wide
array of users.
The architecture underlying Dassault Systèmes 3DEXPERIENCE platform is V6, which the Company
believes is unique, with its combination of online architecture, openness, scalability and flexibility.
Industry Focus
The Company’s global customer base includes companies primarily in 12 industrial sectors: Aerospace &
Defense; Transportation & Mobility; Marine & Offshore; Industrial Equipment; High-Tech; Architecture,
Engineering & Construction; Consumer Goods & Retail; Consumer Packaged Goods & Retail; Life
Sciences; Energy, Process & Utilities; Financial & Business Services; and Natural Resources. For its latest
full fiscal year 2012, the composition of end-user software revenue by major industry was approximately
as follows: Transportation & Mobility about 29%; Industrial Equipment about 20%; Aerospace & Defense
about 13%; Business Services about 13%; and other industries about 25%.
5
Sales Channels
The Company’s customer base is comprised of a wide range of companies, from start-ups, small and mid-
sized companies to the largest companies in the world as well as educational institutions and government
departments. To ensure sales and marketing coverage of all its customers, the Company has developed
three sales and distribution channels, with sales teams combining individuals with deep knowledge of their
respective industries with brand specialists. No single customer or sales channel partner represented more
than 5% of the Company’s total revenue in 2012.
Sales to large companies and government entities are generally conducted through the Company’s direct
sales channel, the 3DS Business Transformation channel. Direct sales represented 56% of total revenue
during 2012. Sales to small and mid-sized companies are generally conducted indirectly through the
Company’s 3DS Value Solutions channel, a global network of value-added resellers. This channel
represented 24% of the Company’s total revenue in 2012. Volume unit sales are conducted through the
3DS Professional channel, which is composed of a network of value-added resellers and distributors
worldwide providing sales, local training, services and support to customers. Sales through this channel
represented 20% of the Company’s total revenue in 2012, and were comprised of principally
SOLIDWORKS products as well as other Dassault Systèmes software applications.
In addition to its sales channels the Company is actively developing and expanding relationships with
system integrators.
Business Segments
The Company principally organizes its business and markets its products and services according to two
types of applications: the PLM market, to support product development, production, maintenance and
lifecycle management, and the SOLIDWORKS market, which is primarily focused on product design.
2.2 Risk factors
The main risks and uncertainties to which the Group may be exposed during the remaining six months of
fiscal year 2013 are presented in Section 1.6 “Risk Factors” of the Company’s 2012 Document de
référence filed with the Autorité des marchés financiers (“AMF”, the French Financial Markets Authority)
on April 3, 2013, with the exception of foreign currency and interest rate risks which are updated in Note
13 of the Company’s half year consolidated condensed financial statements under Chapter 3 of this Half
Year Report.
6
2.3 General presentation
2.3.1 Basis of presentation of financial information
The summary below highlights selected aspects of the Company’s financial results for the first half of
2013 under International Financial Reporting Standards (“IFRS”). The summary, the supplemental non-
IFRS financial information and the more detailed discussion that follows should be read together with the
Company’s half year consolidated condensed financial statements and the related notes included under
Chapter 3 of this Half Year Report.
The interim condensed consolidated financial statements for the six months ended June 30, 2013 have
been prepared in accordance with International Accounting Standard (“IAS”) 34, Interim Financial
Reporting, and as such do not include all information required for annual consolidated financial
statements. Consequently, the interim condensed consolidated financial statements should be read in
conjunction with the Company’s annual financial statements as of December 31, 2012, prepared in
accordance with IFRS as adopted by the European Union and published in the Company’s Document de
référence filed with the AMF (the French Financial Markets Authority) on April 3, 2013.
The interim financial statements were prepared based on the same accounting policies as those applied in
the consolidated financial statements as of December 31, 2012, with the following exceptions:
- Income tax expense is based on an estimate of the weighted average annual income tax rate
expected for the full financial year.
- Pension costs are estimated based on the actuarial reports prepared for fiscal year 2012.
- The Group has adopted IAS 19 (Revised), “Employee benefits”, mandatory for financial years
beginning on or after January 1, 2013. The amendments to IAS 19 require immediate recognition
of actuarial gains and losses in other comprehensive income (the corridor approach is removed),
immediate recognition of past service costs in the consolidated statement of income, and
eliminate the concept of expected returns on plan assets. The impact of the retrospective
application of the revised standard is presented in Chapter 3, “Condensed Consolidated Financial
Statements for the Half Year ended June 30, 2013”.
Other new standards and interpretations effective beginning on January 1, 2013 did not have a significant
impact on the financial position and results of operations of the Company. New standards and
interpretations effective beginning on January 1, 2014 were not early adopted by the Company.
In discussing and analyzing its results of operations, the Company considers supplemental non-IFRS
financial information which adjusts the Company’s IFRS financial information to exclude:
the deferred revenue adjustment of acquired companies,
amortization of acquired intangibles, including amortization of acquired technology,
share-based compensation expense,
other operating income and expense, net,
certain one-time items included in financial income and other, net, and
certain one-time tax effects.
A reconciliation of this supplemental non-IFRS financial information with information set forth in the
Company’s consolidated condensed financial statements and the notes thereto is presented below in
7
section 2.3.3 “Supplemental Non-IFRS Financial Information” and a description of this supplemental non-
IFRS financial information can be found in the Company’s Document de référence for 2012.
When the Company believes it would be helpful for understanding trends in its business, it restates
percentage increases or decreases in selected financial data to eliminate the effect of changes in currency
values, particularly the U.S. dollar and the Japanese yen, relative to the euro. When trend information is
expressed below “in constant currencies”, the results of the prior year have first been recalculated using
the average exchange rates of the most recent year, and then compared with the results of the most recent
year. All constant currency information is provided on an approximate basis. Unless otherwise indicated,
the impact of exchange rate fluctuations is approximately the same for both the Company’s IFRS and
supplemental non-IFRS financial data.
The Company’s quarterly new licenses revenue has varied significantly and is likely to vary significantly
in the future according to business seasonality and clients’ decision process. The Company’s total revenue
is however less sensitive to quarterly variation due to its significant level of recurring software revenue,
which includes software rentals. The significant level of recurring software revenue serves as a stabilizing
factor when new licensing activity is impacting revenue and net income.
A significant portion of sales typically occurs in the last month of each quarter, and, as is typical in the
software market, the Company normally experiences its highest licensing activity for the year in
December. Software revenue, total revenue, operating income, operating margin and net income have
generally been highest in the fourth quarter of each year.
Nonetheless, it is possible that the Company’s quarterly total revenue could vary significantly and that its
net income could vary significantly reflecting the change in revenues, together with the effects of the
Company’s investment plans.
8
2.3.2 Summary overview
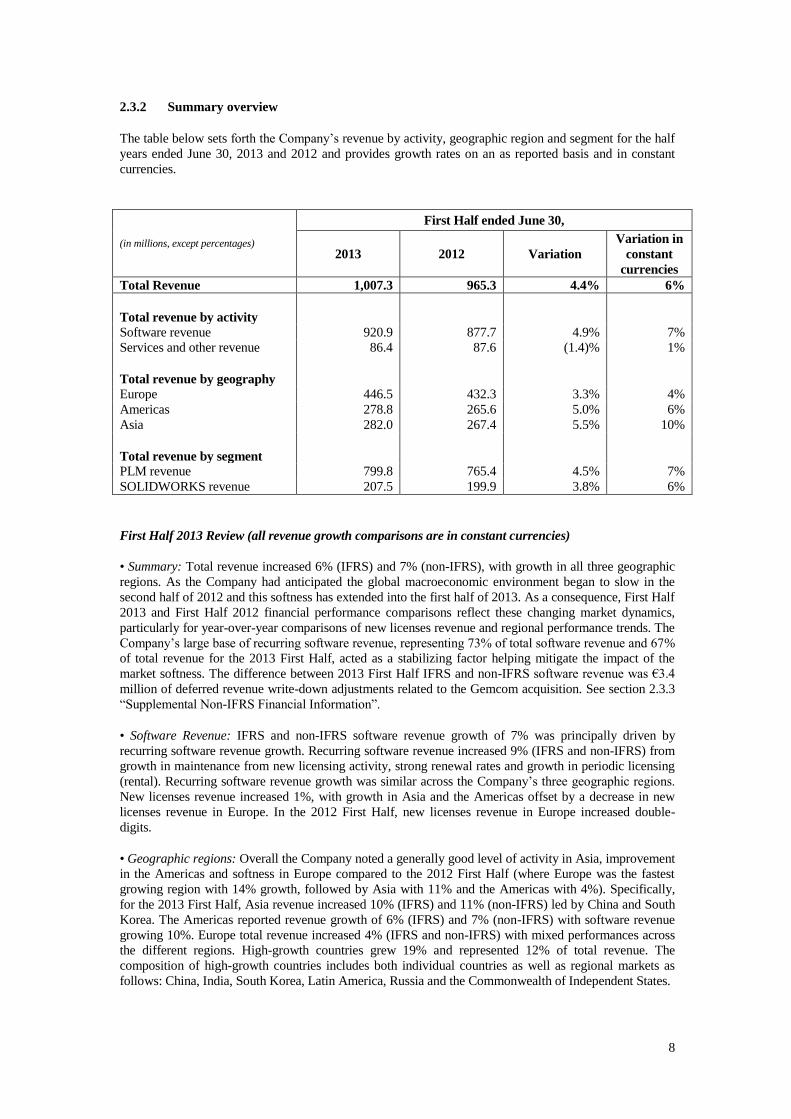
The table below sets forth the Company’s revenue by activity, geographic region and segment for the half
years ended June 30, 2013 and 2012 and provides growth rates on an as reported basis and in constant
currencies.
(in millions, except percentages)
First Half ended June 30,
2013 2012 Variation
Variation in
constant
currencies
Total Revenue 1,007.3 965.3 4.4% 6%
Total revenue by activity
Software revenue 920.9 877.7 4.9% 7%
Services and other revenue 86.4 87.6 (1.4)% 1%
Total revenue by geography
Europe 446.5 432.3 3.3% 4%
Americas 278.8 265.6 5.0% 6%
Asia 282.0 267.4 5.5% 10%
Total revenue by segment
PLM revenue 799.8 765.4 4.5% 7%
SOLIDWORKS revenue 207.5 199.9 3.8% 6%
First Half 2013 Review (all revenue growth comparisons are in constant currencies)
• Summary: Total revenue increased 6% (IFRS) and 7% (non-IFRS), with growth in all three geographic
regions. As the Company had anticipated the global macroeconomic environment began to slow in the
second half of 2012 and this softness has extended into the first half of 2013. As a consequence, First Half
2013 and First Half 2012 financial performance comparisons reflect these changing market dynamics,
particularly for year-over-year comparisons of new licenses revenue and regional performance trends. The
Company’s large base of recurring software revenue, representing 73% of total software revenue and 67%
of total revenue for the 2013 First Half, acted as a stabilizing factor helping mitigate the impact of the
market softness. The difference between 2013 First Half IFRS and non-IFRS software revenue was €3.4
million of deferred revenue write-down adjustments related to the Gemcom acquisition. See section 2.3.3
“Supplemental Non-IFRS Financial Information”.
• Software Revenue: IFRS and non-IFRS software revenue growth of 7% was principally driven by
recurring software revenue growth. Recurring software revenue increased 9% (IFRS and non-IFRS) from
growth in maintenance from new licensing activity, strong renewal rates and growth in periodic licensing
(rental). Recurring software revenue growth was similar across the Company’s three geographic regions.
New licenses revenue increased 1%, with growth in Asia and the Americas offset by a decrease in new
licenses revenue in Europe. In the 2012 First Half, new licenses revenue in Europe increased double-
digits.
• Geographic regions: Overall the Company noted a generally good level of activity in Asia, improvement
in the Americas and softness in Europe compared to the 2012 First Half (where Europe was the fastest
growing region with 14% growth, followed by Asia with 11% and the Americas with 4%). Specifically,
for the 2013 First Half, Asia revenue increased 10% (IFRS) and 11% (non-IFRS) led by China and South
Korea. The Americas reported revenue growth of 6% (IFRS) and 7% (non-IFRS) with software revenue
growing 10%. Europe total revenue increased 4% (IFRS and non-IFRS) with mixed performances across
the different regions. High-growth countries grew 19% and represented 12% of total revenue. The
composition of high-growth countries includes both individual countries as well as regional markets as
follows: China, India, South Korea, Latin America, Russia and the Commonwealth of Independent States.
9
• Operating income: IFRS operating income totaled €223.7 million compared to €232.6 million,
representing a decrease of 3.8% on higher revenue of 4.4% offset by growth in operating expenses, net of
6.9%. On a non-IFRS basis, operating income increased 5.7% to €298.4 million on higher revenue of
4.7% and operating expense growth of 4.3%. The difference in IFRS and non-IFRS operating results
principally reflected a one-time gain of €8.5 million on the sale of a consolidated entity recorded in the
2012 First Half as well as higher shared-based payment expense of €7.8 million in the 2013 First Half, and
to a lesser extent an increase in amortization of acquired intangibles of €5.5 million. See section 2.3.3 for
further information.
• Net income: IFRS net income per diluted share decreased 2.4% to €1.22, primarily reflecting the one-
time gain on the sale of a consolidated entity in the 2012 First Half and the increase in share-based
payment expense. Non-IFRS net income per diluted share increased 9.5% to €1.61 principally reflecting
growth in operating income, as well as higher financial revenue.
2013 Business Outlook
For a discussion of the Company’s 2013 business outlook, see section 2.8 “2013 Outlook”. For further
information regarding risks facing the Company, see section 2.2 ‘‘Risk factors”.
Other Financial Highlights
In June 2013, the Company entered into a new borrowing, a five-year term loan Facility Agreement for
€350 million, which was immediately fully drawn down. At June 30, 2013, cash, cash equivalents and
short-term investments totaled €1.95 billion and long-term debt was €372.4 million compared to €1.32
billion and €38.3 million, respectively at December 31, 2012.
10
2.3.3 Supplemental non-IFRS financial information
Readers are cautioned that the supplemental non-IFRS financial information is subject to inherent
limitations. It is not based on any comprehensive set of accounting rules or principles and should not be
considered in isolation from or as a substitute for IFRS measurements. The supplemental non-IFRS
financial information should be read only in conjunction with the Company’s consolidated financial
statements prepared in accordance with IFRS. Furthermore, the Company’s supplemental non-IFRS
financial information may not be comparable to similarly titled non-IFRS measures used by other
companies. Specific limitations for individual non-IFRS measures are set forth in the Company’s most
recent Document de référence.
In evaluating and communicating its results of operations, the Company supplements its financial results
reported on an IFRS basis with non-IFRS financial data. As presented above in section 2.3.1 “Basis of
presentation of financial information”, the supplemental non-IFRS financial information excludes the
effects of: deferred revenue adjustments for acquired companies, amortization of acquired intangibles,
share-based compensation expense, other operating income and expense, net, certain one-time items
included in financial income and other, net, and the income tax effect of the non-IFRS adjustments and
certain one-time tax effects. Subject to the limitations set forth in its most recent Document de référence,
the Company believes that the supplemental non-IFRS financial information provides a consistent basis
for period-to-period comparisons which can improve investors’ understanding of its financial
performance.
The Company’s management uses the supplemental non-IFRS financial information, together with its
IFRS financial information, to evaluate its operating performance, make operating decisions, conduct
planning and set objectives for future periods. Compensation of its executive officers is based in part on
the performance of its business measured with the supplemental non-IFRS information. The Company
believes that the supplemental non-IFRS data also provides meaningful information to investors and
financial analysts who use the information for comparing the Company’s operating performance to its
historical trends and to other companies in its industry, as well as for valuation purposes.
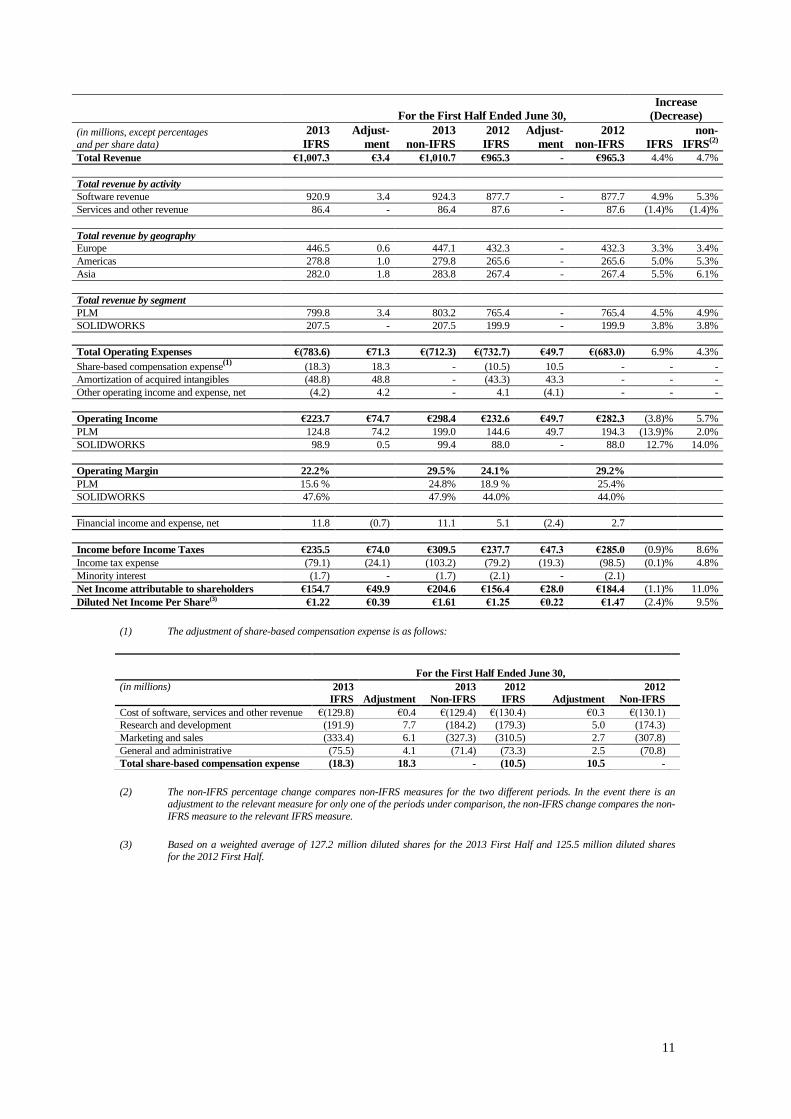
The following table sets forth the Company’s supplemental non-IFRS financial information, together with
the comparable IFRS financial measure and a reconciliation of the IFRS and non-IFRS information.
11
For the First Half Ended June 30,
Increase
(Decrease)
(in millions, except percentages
and per share data)
2013
IFRS
Adjust-
ment
2013
non-IFRS
2012
IFRS
Adjust-
ment
2012
non-IFRS IFRS
non-
IFRS(2)
Total Revenue €1,007.3 €3.4 €1,010.7 €965.3 - €965.3 4.4% 4.7%
Total revenue by activity
Software revenue 920.9 3.4 924.3 877.7 - 877.7 4.9% 5.3%
Services and other revenue 86.4 - 86.4 87.6 - 87.6 (1.4)% (1.4)%
Total revenue by geography
Europe 446.5 0.6 447.1 432.3 - 432.3 3.3% 3.4%
Americas 278.8 1.0 279.8 265.6 - 265.6 5.0% 5.3%
Asia 282.0 1.8 283.8 267.4 - 267.4 5.5% 6.1%
Total revenue by segment
PLM 799.8 3.4 803.2 765.4 - 765.4 4.5% 4.9%
SOLIDWORKS 207.5 - 207.5 199.9 - 199.9 3.8% 3.8%
Total Operating Expenses €(783.6) €71.3 €(712.3) €(732.7) €49.7 €(683.0) 6.9% 4.3%
Share-based compensation expense(1)
(18.3) 18.3 - (10.5) 10.5 - - -
Amortization of acquired intangibles (48.8) 48.8 - (43.3) 43.3 - - -
Other operating income and expense, net (4.2) 4.2 - 4.1 (4.1) - - -
Operating Income €223.7 €74.7 €298.4 €232.6 €49.7 €282.3 (3.8)% 5.7%
PLM 124.8 74.2 199.0 144.6 49.7 194.3 (13.9)% 2.0%
SOLIDWORKS 98.9 0.5 99.4 88.0 - 88.0 12.7% 14.0%
Operating Margin 22.2% 29.5% 24.1% 29.2%
PLM 15.6 % 24.8% 18.9 % 25.4%
SOLIDWORKS 47.6% 47.9% 44.0% 44.0%
Financial income and expense, net 11.8 (0.7) 11.1 5.1 (2.4) 2.7
Income before Income Taxes €235.5 €74.0 €309.5 €237.7 €47.3 €285.0 (0.9)% 8.6%
Income tax expense (79.1) (24.1) (103.2) (79.2) (19.3) (98.5) (0.1)% 4.8%
Minority interest (1.7) - (1.7) (2.1) - (2.1)
Net Income attributable to shareholders €154.7 €49.9 €204.6 €156.4 €28.0 €184.4 (1.1)% 11.0%
Diluted Net Income Per Share(3) €1.22 €0.39 €1.61 €1.25 €0.22 €1.47 (2.4)% 9.5%
(1) The adjustment of share-based compensation expense is as follows:
For the First Half Ended June 30,
(in millions)
2013
IFRS Adjustment
2013
Non-IFRS
2012
IFRS Adjustment
2012
Non-IFRS
Cost of software, services and other revenue €(129.8) €0.4 €(129.4) €(130.4) €0.3 €(130.1)
Research and development (191.9) 7.7 (184.2) (179.3) 5.0 (174.3)
Marketing and sales (333.4) 6.1 (327.3) (310.5) 2.7 (307.8)
General and administrative (75.5) 4.1 (71.4) (73.3) 2.5 (70.8)
Total share-based compensation expense (18.3) 18.3 - (10.5) 10.5 -
(2) The non-IFRS percentage change compares non-IFRS measures for the two different periods. In the event there is an adjustment to the relevant measure for only one of the periods under comparison, the non-IFRS change compares the non-
IFRS measure to the relevant IFRS measure.
(3) Based on a weighted average of 127.2 million diluted shares for the 2013 First Half and 125.5 million diluted shares for the 2012 First Half.
12
2.4 Financial review of operations as of June 30, 2013
2.4.1 Revenue
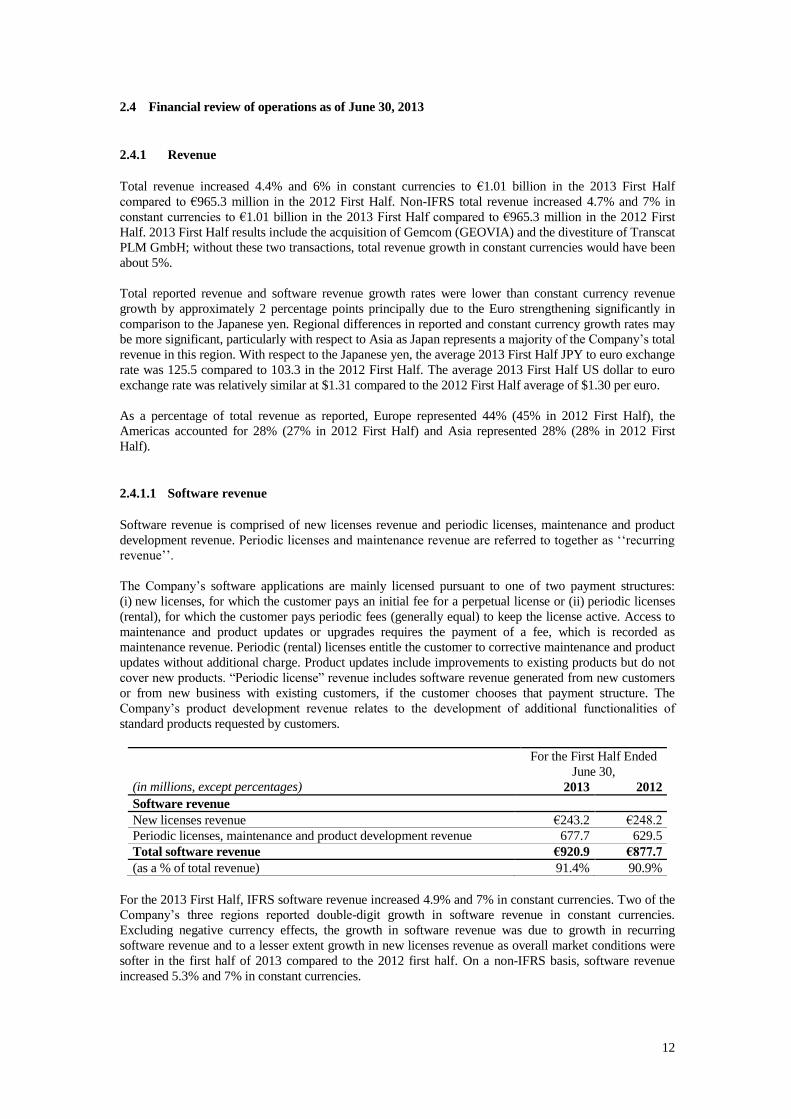
Total revenue increased 4.4% and 6% in constant currencies to €1.01 billion in the 2013 First Half
compared to €965.3 million in the 2012 First Half. Non-IFRS total revenue increased 4.7% and 7% in
constant currencies to €1.01 billion in the 2013 First Half compared to €965.3 million in the 2012 First
Half. 2013 First Half results include the acquisition of Gemcom (GEOVIA) and the divestiture of Transcat
PLM GmbH; without these two transactions, total revenue growth in constant currencies would have been
about 5%.
Total reported revenue and software revenue growth rates were lower than constant currency revenue
growth by approximately 2 percentage points principally due to the Euro strengthening significantly in
comparison to the Japanese yen. Regional differences in reported and constant currency growth rates may
be more significant, particularly with respect to Asia as Japan represents a majority of the Company’s total
revenue in this region. With respect to the Japanese yen, the average 2013 First Half JPY to euro exchange
rate was 125.5 compared to 103.3 in the 2012 First Half. The average 2013 First Half US dollar to euro
exchange rate was relatively similar at $1.31 compared to the 2012 First Half average of $1.30 per euro.
As a percentage of total revenue as reported, Europe represented 44% (45% in 2012 First Half), the
Americas accounted for 28% (27% in 2012 First Half) and Asia represented 28% (28% in 2012 First
Half).
2.4.1.1 Software revenue
Software revenue is comprised of new licenses revenue and periodic licenses, maintenance and product
development revenue. Periodic licenses and maintenance revenue are referred to together as ‘‘recurring
revenue’’.
The Company’s software applications are mainly licensed pursuant to one of two payment structures:
(i) new licenses, for which the customer pays an initial fee for a perpetual license or (ii) periodic licenses
(rental), for which the customer pays periodic fees (generally equal) to keep the license active. Access to
maintenance and product updates or upgrades requires the payment of a fee, which is recorded as
maintenance revenue. Periodic (rental) licenses entitle the customer to corrective maintenance and product
updates without additional charge. Product updates include improvements to existing products but do not
cover new products. “Periodic license” revenue includes software revenue generated from new customers
or from new business with existing customers, if the customer chooses that payment structure. The
Company’s product development revenue relates to the development of additional functionalities of
standard products requested by customers.
For the First Half Ended
June 30,
(in millions, except percentages) 2013 2012
Software revenue
New licenses revenue €243.2 €248.2
Periodic licenses, maintenance and product development revenue 677.7 629.5
Total software revenue €920.9 €877.7
(as a % of total revenue) 91.4% 90.9%
For the 2013 First Half, IFRS software revenue increased 4.9% and 7% in constant currencies. Two of the
Company’s three regions reported double-digit growth in software revenue in constant currencies.
Excluding negative currency effects, the growth in software revenue was due to growth in recurring
software revenue and to a lesser extent growth in new licenses revenue as overall market conditions were
softer in the first half of 2013 compared to the 2012 first half. On a non-IFRS basis, software revenue
increased 5.3% and 7% in constant currencies.
13
New licenses revenue decreased 2.0% as reported, but increased 1% in constant currencies for the 2013
First Half. New licenses revenue represented 26.4% and 28.3% of total software revenue for the 2013 and
2012 First Half, respectively.
Recurring software revenue increased 8.0% as reported and 9% in constant currencies and totaled
€675.6 million for the 2013 First Half, compared to €625.7 million in the 2012 First Half. The increase in
recurring software revenue reflected growth in maintenance as well as rental software revenue. In total
maintenance renewal rates continued to be high. Recurring software revenue represented 73% and 71% of
software revenue in the First Half of 2013 and 2012, respectively. Similarly, non-IFRS recurring software
revenue increased 8.5% and 9% in constant currencies and totaled €679.0 million for the 2013 First Half
compared to €625.7 million in the 2012 First Half.
Product development revenue totaled €2.1 million for the 2013 First Half compared to €3.8 million in
2012 First Half.
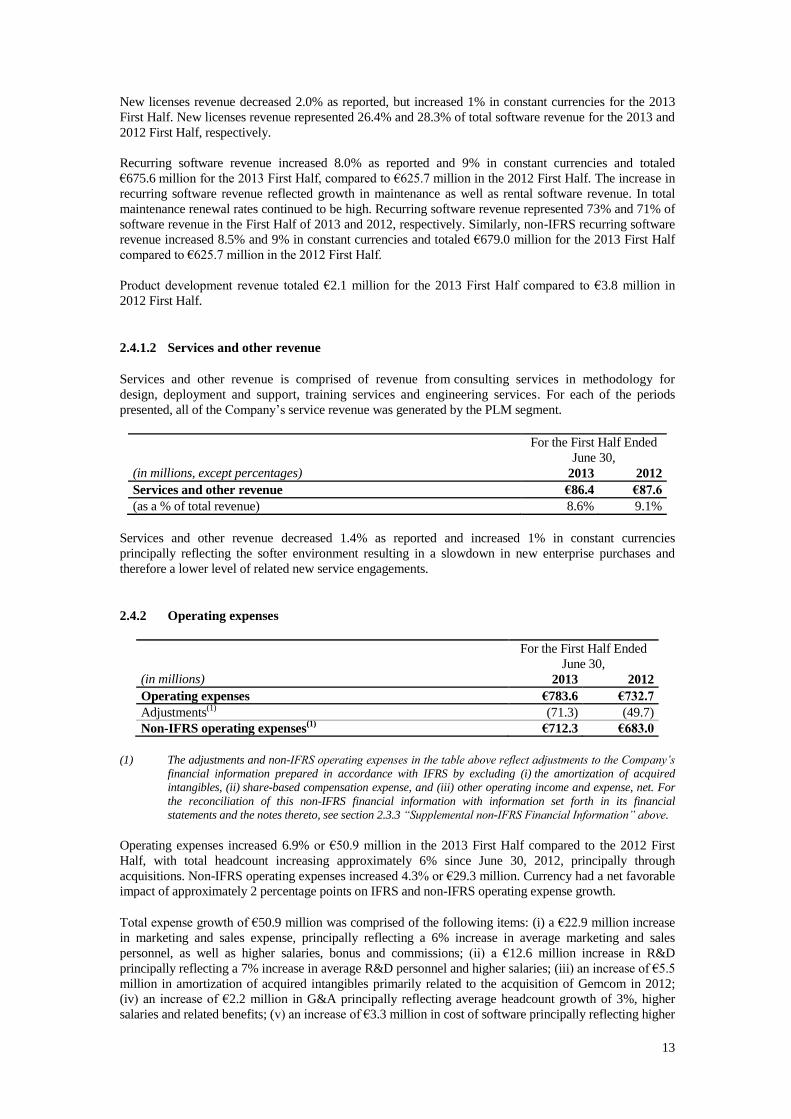
2.4.1.2 Services and other revenue
Services and other revenue is comprised of revenue from consulting services in methodology for
design, deployment and support, training services and engineering services. For each of the periods
presented, all of the Company’s service revenue was generated by the PLM segment.
For the First Half Ended
June 30,
(in millions, except percentages) 2013 2012
Services and other revenue €86.4 €87.6
(as a % of total revenue) 8.6% 9.1%
Services and other revenue decreased 1.4% as reported and increased 1% in constant currencies
principally reflecting the softer environment resulting in a slowdown in new enterprise purchases and
therefore a lower level of related new service engagements.
2.4.2 Operating expenses
For the First Half Ended
June 30,
(in millions) 2013 2012
Operating expenses €783.6 €732.7
Adjustments(1)
(71.3) (49.7)
Non-IFRS operating expenses(1)
€712.3 €683.0
(1) The adjustments and non-IFRS operating expenses in the table above reflect adjustments to the Company’s
financial information prepared in accordance with IFRS by excluding (i) the amortization of acquired
intangibles, (ii) share-based compensation expense, and (iii) other operating income and expense, net. For
the reconciliation of this non-IFRS financial information with information set forth in its financial
statements and the notes thereto, see section 2.3.3 “Supplemental non-IFRS Financial Information” above.
Operating expenses increased 6.9% or €50.9 million in the 2013 First Half compared to the 2012 First
Half, with total headcount increasing approximately 6% since June 30, 2012, principally through
acquisitions. Non-IFRS operating expenses increased 4.3% or €29.3 million. Currency had a net favorable
impact of approximately 2 percentage points on IFRS and non-IFRS operating expense growth.
Total expense growth of €50.9 million was comprised of the following items: (i) a €22.9 million increase
in marketing and sales expense, principally reflecting a 6% increase in average marketing and sales
personnel, as well as higher salaries, bonus and commissions; (ii) a €12.6 million increase in R&D
principally reflecting a 7% increase in average R&D personnel and higher salaries; (iii) an increase of €5.5
million in amortization of acquired intangibles primarily related to the acquisition of Gemcom in 2012;
(iv) an increase of €2.2 million in G&A principally reflecting average headcount growth of 3%, higher
salaries and related benefits; (v) an increase of €3.3 million in cost of software principally reflecting higher
14
personnel costs and to a lesser extent higher royalty expenses; and (vi) the negative contribution from
Other operating income and expense, net of €8.3 million; offset by lower cost of services and other
revenue of €3.9 million.
2.4.3 Operating income
For the First Half Ended
June 30,
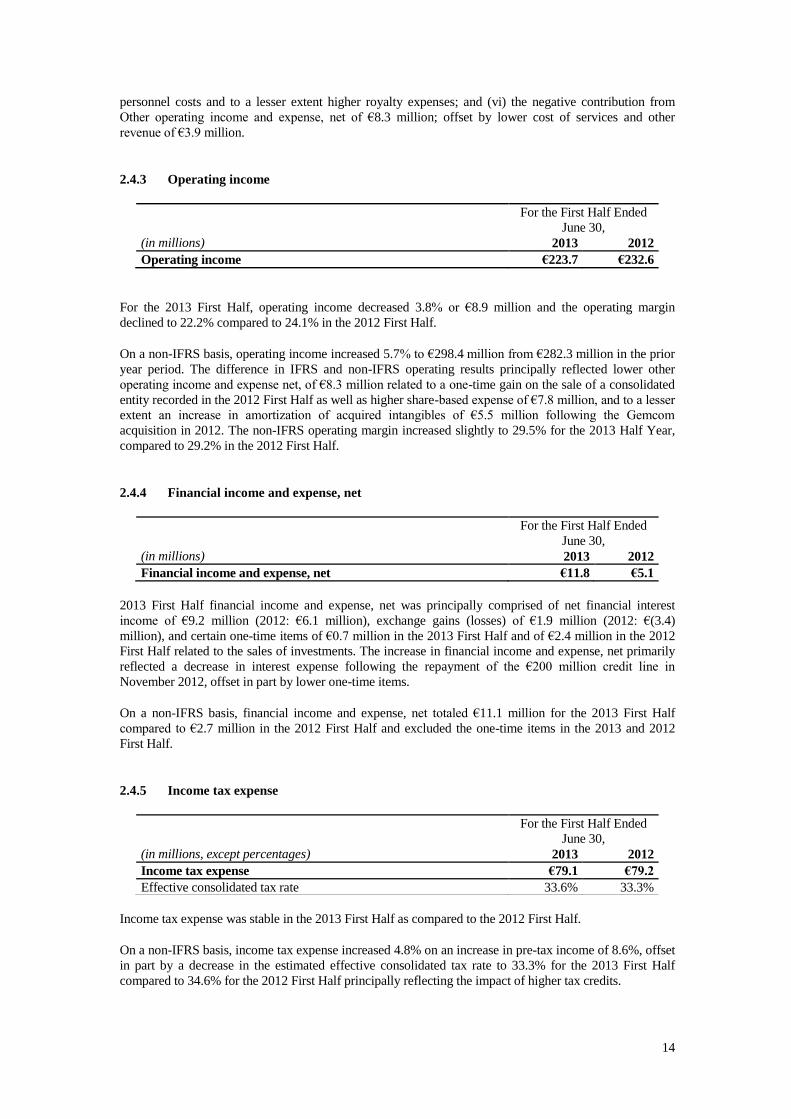
(in millions) 2013 2012
Operating income €223.7 €232.6
For the 2013 First Half, operating income decreased 3.8% or €8.9 million and the operating margin
declined to 22.2% compared to 24.1% in the 2012 First Half.
On a non-IFRS basis, operating income increased 5.7% to €298.4 million from €282.3 million in the prior
year period. The difference in IFRS and non-IFRS operating results principally reflected lower other
operating income and expense net, of €8.3 million related to a one-time gain on the sale of a consolidated
entity recorded in the 2012 First Half as well as higher share-based expense of €7.8 million, and to a lesser
extent an increase in amortization of acquired intangibles of €5.5 million following the Gemcom
acquisition in 2012. The non-IFRS operating margin increased slightly to 29.5% for the 2013 Half Year,
compared to 29.2% in the 2012 First Half.
2.4.4 Financial income and expense, net
For the First Half Ended
June 30,
(in millions) 2013 2012
Financial income and expense, net €11.8 €5.1
2013 First Half financial income and expense, net was principally comprised of net financial interest
income of €9.2 million (2012: €6.1 million), exchange gains (losses) of €1.9 million (2012: €(3.4)
million), and certain one-time items of €0.7 million in the 2013 First Half and of €2.4 million in the 2012
First Half related to the sales of investments. The increase in financial income and expense, net primarily
reflected a decrease in interest expense following the repayment of the €200 million credit line in
November 2012, offset in part by lower one-time items.
On a non-IFRS basis, financial income and expense, net totaled €11.1 million for the 2013 First Half
compared to €2.7 million in the 2012 First Half and excluded the one-time items in the 2013 and 2012
First Half.
2.4.5 Income tax expense
For the First Half Ended
June 30,
(in millions, except percentages) 2013 2012
Income tax expense €79.1 €79.2
Effective consolidated tax rate 33.6% 33.3%
Income tax expense was stable in the 2013 First Half as compared to the 2012 First Half.
On a non-IFRS basis, income tax expense increased 4.8% on an increase in pre-tax income of 8.6%, offset
in part by a decrease in the estimated effective consolidated tax rate to 33.3% for the 2013 First Half
compared to 34.6% for the 2012 First Half principally reflecting the impact of higher tax credits.
15
2.4.6 Net income and diluted net income per share
For the First Half Ended
June 30,
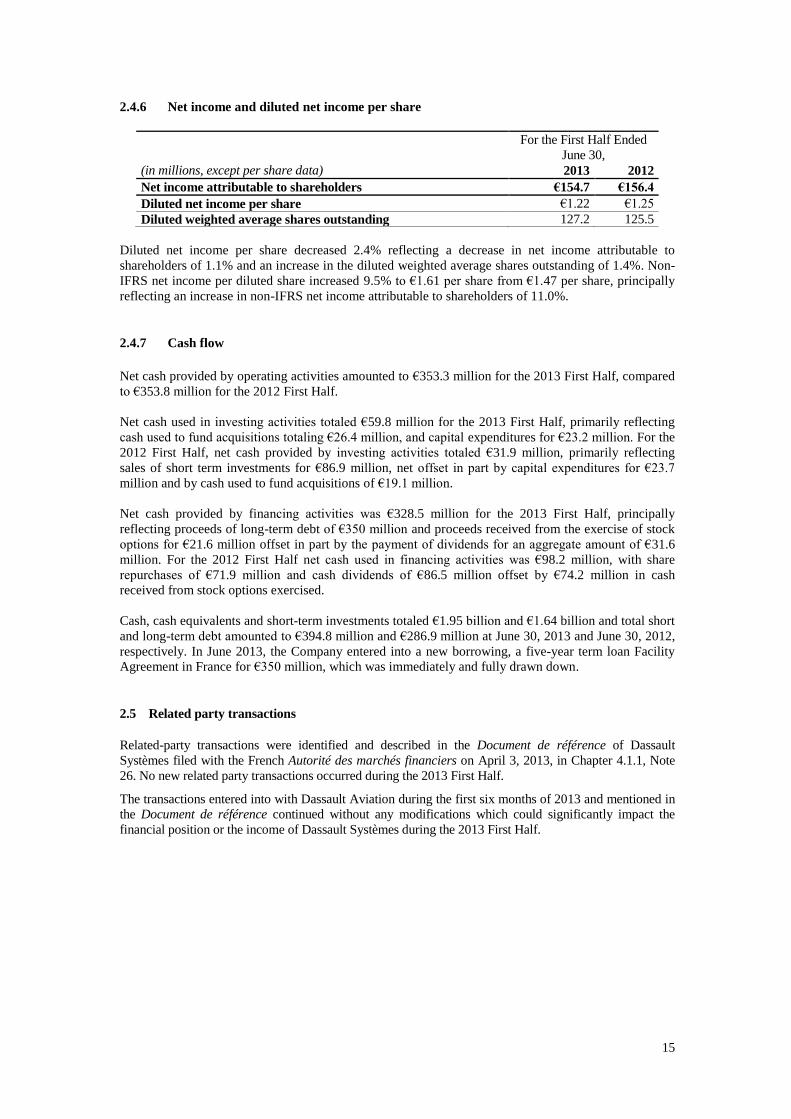
(in millions, except per share data) 2013 2012
Net income attributable to shareholders €154.7 €156.4
Diluted net income per share €1.22 €1.25
Diluted weighted average shares outstanding 127.2 125.5
Diluted net income per share decreased 2.4% reflecting a decrease in net income attributable to
shareholders of 1.1% and an increase in the diluted weighted average shares outstanding of 1.4%. Non-
IFRS net income per diluted share increased 9.5% to €1.61 per share from €1.47 per share, principally
reflecting an increase in non-IFRS net income attributable to shareholders of 11.0%.
2.4.7 Cash flow
Net cash provided by operating activities amounted to €353.3 million for the 2013 First Half, compared
to €353.8 million for the 2012 First Half.
Net cash used in investing activities totaled €59.8 million for the 2013 First Half, primarily reflecting
cash used to fund acquisitions totaling €26.4 million, and capital expenditures for €23.2 million. For the
2012 First Half, net cash provided by investing activities totaled €31.9 million, primarily reflecting
sales of short term investments for €86.9 million, net offset in part by capital expenditures for €23.7
million and by cash used to fund acquisitions of €19.1 million.
Net cash provided by financing activities was €328.5 million for the 2013 First Half, principally
reflecting proceeds of long-term debt of €350 million and proceeds received from the exercise of stock
options for €21.6 million offset in part by the payment of dividends for an aggregate amount of €31.6
million. For the 2012 First Half net cash used in financing activities was €98.2 million, with share
repurchases of €71.9 million and cash dividends of €86.5 million offset by €74.2 million in cash
received from stock options exercised.
Cash, cash equivalents and short-term investments totaled €1.95 billion and €1.64 billion and total short
and long-term debt amounted to €394.8 million and €286.9 million at June 30, 2013 and June 30, 2012,
respectively. In June 2013, the Company entered into a new borrowing, a five-year term loan Facility
Agreement in France for €350 million, which was immediately and fully drawn down.
2.5 Related party transactions
Related-party transactions were identified and described in the Document de référence of Dassault
Systèmes filed with the French Autorité des marchés financiers on April 3, 2013, in Chapter 4.1.1, Note
26. No new related party transactions occurred during the 2013 First Half.
The transactions entered into with Dassault Aviation during the first six months of 2013 and mentioned in
the Document de référence continued without any modifications which could significantly impact the
financial position or the income of Dassault Systèmes during the 2013 First Half.
16
2.6 2013 First Half Business Highlights
Product and Technology Announcements
On July 25, 2013 Dassault Systèmes unveiled V6 Release 2014, including availability of cloud industry
and brand offers. It also brings a unified new navigational interface across the entire 3DEXPERIENCE
platform available on premise, and on a public or private cloud. Specifically, the V6R2014 release,
available to select customers, on premise as well as Software as a Service (SaaS), features the controlled
availability of existing and new industry-focused and user-focused offerings.
Acquisitions
On July 5, 2013, Dassault Systèmes acquired SFE GmbH, a technological leader in conceptual
engineering, offering a fully integrated design-simulation approach, to run simulations at an early stage of
concept design and shorten product development time, headquartered in Berlin, Germany. SFE solutions
are notably used by automotive and railways transportation companies worldwide. Its solutions will be
integrated in CATIA’s applications portfolio to complement Dassault Systèmes technologies.
On July 1, 2013 Dassault Systèmes completed the previously-announced acquisition of Apriso, a leading
provider of manufacturing software solutions, headquartered in Long Beach, California. Apriso will be
integrated with and expand Dassault Systèmes’ DELMIA application portfolio and the 3DEXPERIENCE
platform’s virtual+reality capabilities closing the loop between design, engineering, manufacturing and
consumer experience. Apriso enriches the global manufacturing operations management capabilities of the
3DEXPERIENCE platform and expands Dassault Systèmes’ 3DEXPERIENCE footprint across multiple
industries, such as consumer goods, packaged goods, high tech, life sciences, transportation & mobility,
aerospace & defense and industrial equipment. The Apriso solutions are currently used by a variety of
customers, including Alstom, British American Tobacco, Bombardier, Cummins, General Motors,
Hitachi, Japan Tobacco, L’Occitane, Lockheed Martin, L’Oréal, Philip Morris International, Saint-
Gobain, Textron Systems, Trixell, Valeo, and Volvo CE. The purchase price was approximately $205
million, plus net cash acquired.
On April 25, 2013 Dassault Systèmes announced the acquisition of Archividéo, a 3D City modeling
pioneer, to extend the 3DEXPERIENCE strategy to urban planning and land development domains.
Archividéo enables the automated creation and management of large 3D urban environments and
landscapes. The acquisition of Archividéo, based in Rennes, France, brings a new dimension to
Dassault Systèmes’ 3DEXPERIENCE strategy and platform, extending it to urban environment
planning with proven 3D city and landscape modeling technology.
On April 23, 2013, Dassault Systèmes acquired FE-DESIGN to bring powerful design optimization
technology to enhance its 3DEXPERIENCE platform’s realistic simulation applications (SIMULIA).
FE-DESIGN, a privately-held company headquartered in Karlsruhe, Germany, specializes in providing
non-parametric structural and fluid simulation optimization technology for design optimization during
early-stage product development. Its product portfolio is used by more than 200 customers, including
General Motors, BMW, SIEMENS, and Suzlon.
On April 18, 2013, Dassault Systèmes acquired SIMPOE. Providing easy to use and affordable
solutions for plastic injection simulation, SIMPOE’s technology enables engineers to take into account
manufacturing constraints early in the product design cycle, in a world where plastic parts are more and
more part of everyday life, and where manufacturers are under increasing pressure to launch new
products faster and cheaper.
Customer Announcements
The 3DEXPERIENCE platform is at the heart of a new program for realistic simulation of aircraft strength
and performance. The Airbus’ ADVANS program represents a major milestone in the long-standing
relationship between Airbus and Dassault Systèmes. The SIMULIA application, part of the
3DEXPERIENCE platform, enables simulation users to move away from approximate, linear analysis to
more accurate, nonlinear simulation technologies, allowing a deeper understanding of realistic structural
performance earlier in the design cycle.
17
Snecma, a leading manufacturer of military and civil aircraft engines and part of the high technology
Safran Group, has selected Dassault Systèmes’ 3DEXPERIENCE platform to create a more unified,
flexible and collaborative production environment for its new engine programs. Snecma will use the
3DEXPERIENCE platform to enable design, engineering and manufacturing excellence for its ongoing
new generation of engines.
2.7 Other corporate events
On May 30, 2013, at the Annual Shareholders’ Meeting, Dassault Systèmes shareholders approved a cash
dividend for the fiscal year 2012 equivalent to €0.80 per share, representing an increase of 14% compared
to the prior year. For the first time in 2013, the Shareholders’ Meeting approved offering shareholders the
option to receive payment of their dividend in the form of new Dassault Systèmes shares or as in the prior
years to receive the payment of the dividend in cash. Shareholders who opted to receive payment of the
2012 dividend in the form of new Dassault Systèmes shares represented approximately 68% of Dassault
Systèmes’ shares, resulting in the issuance of 741,175 new ordinary Dassault Systèmes’ shares,
representing 0.59% of the share capital and 0.44% of the Dassault Systèmes’ (unadjusted) voting rights
calculated on the basis of the share capital and voting rights as of May 31, 2013. On June 28, 2013, the
new shares were delivered and listed on NYSE Euronext Paris the same day and the cash dividend was
paid in the aggregate amount of €31.6 million (including cash payments related to the rounding up or
down of dividend in the form of shares).
2.8 2013 Outlook
The Company has reconfirmed and upgraded its initial 2013 non-IFRS financial objectives which were
announced on February 7, 2013, principally incorporating a reaffirmation of its second half new business
outlook, an update of currency exchange rate assumptions, an upgrade to its non-IFRS earnings per share
and the incorporation of acquisitions completed as of July 25, 2013. These objectives are subject to the
assumptions and cautionary statements set forth below and are subject to revision, as market and business
conditions evolve during 2013.
The Company’s constant currency revenue growth objective for 2013 takes into consideration the mixed
economic context which could cause extended sales cycles, postponements, reductions or cancellations in
investment spending, including in the automotive sector and supply chain.
The Company’s updated 2013 non-IFRS financial objectives including Apriso as communicated on July
25, 2013, are as follows:
2013 non-IFRS total revenue growth objective range of about 7% to 8% in constant currencies
(€2.115 to €2.130 billion based upon the 2013 currency exchange rate assumptions below);
2013 non-IFRS operating margin of about 31% to 32%, stable with 2012; and
2013 non-IFRS earnings per share (EPS) range of about €3.57 to €3.67, representing growth of
about 6% to 9% in comparison to 2012.
These financial objectives are based upon an assumed average U.S. dollar to euro exchange
rate of US$1.33 per €1.00 and an average Japanese yen to euro exchange rate of JPY128 to
€1.00 for 2013.
The Company’s financial objectives are prepared and communicated only on a non-IFRS basis and are
subject to the cautionary statement set forth below. The non-IFRS objectives set forth above exclude the
following accounting elements and are estimated based upon the 2013 currency exchange rate
assumptions outlined above: 2013 deferred revenue write-downs estimated at approximately €4 million,
share-based compensation expense currently estimated at approximately €35 million for 2013; and
amortization expense for acquired intangibles currently estimated at approximately €97 million for 2013.
The above non-IFRS adjustments do not take into account the impact of the Apriso acquisition, for which
the accounting elements will be finalized and included in the Company’s third quarter earnings
announcement. These objectives do not include any impact from other operating income and expense, net,
18
(comprised principally of acquisition, relocation and restructuring expenses representing €4.2 million in
the 2013 First Half). These estimates do not include any new stock option or share grants, or any new
acquisitions or restructurings which may be completed after July 25, 2013 or any one-time tax effects.
The information above includes statements that express objectives for the Company’s future financial
performance. Such forward-looking statements are based on Dassault Systèmes management's current
views and assumptions as of July 25, 2013 and involve known and unknown risks and uncertainties.
Actual results or performances may differ materially from those in such statements due to a range of
factors. If global economic and business conditions continue to be volatile or deteriorate, the Company’s
business results may not develop as currently anticipated and may decline below their earlier levels for an
extended period of time. Furthermore, due to factors affecting sales of the Company’s products and
services, there may be a substantial time lag between any change in global economic and business
conditions and its impact on the Company’s business results.
The exchange rates mentioned above constitute a working hypothesis; currency values fluctuate, and the
Company’s results of operations may be significantly affected by changes in exchange rates if actual
exchange rates are different.
For more information regarding the risks facing the Company, see section 2.2 “Risk Factors” and Section
1.6 “Risk Factors” of the Company’s 2012 Document de référence.
19
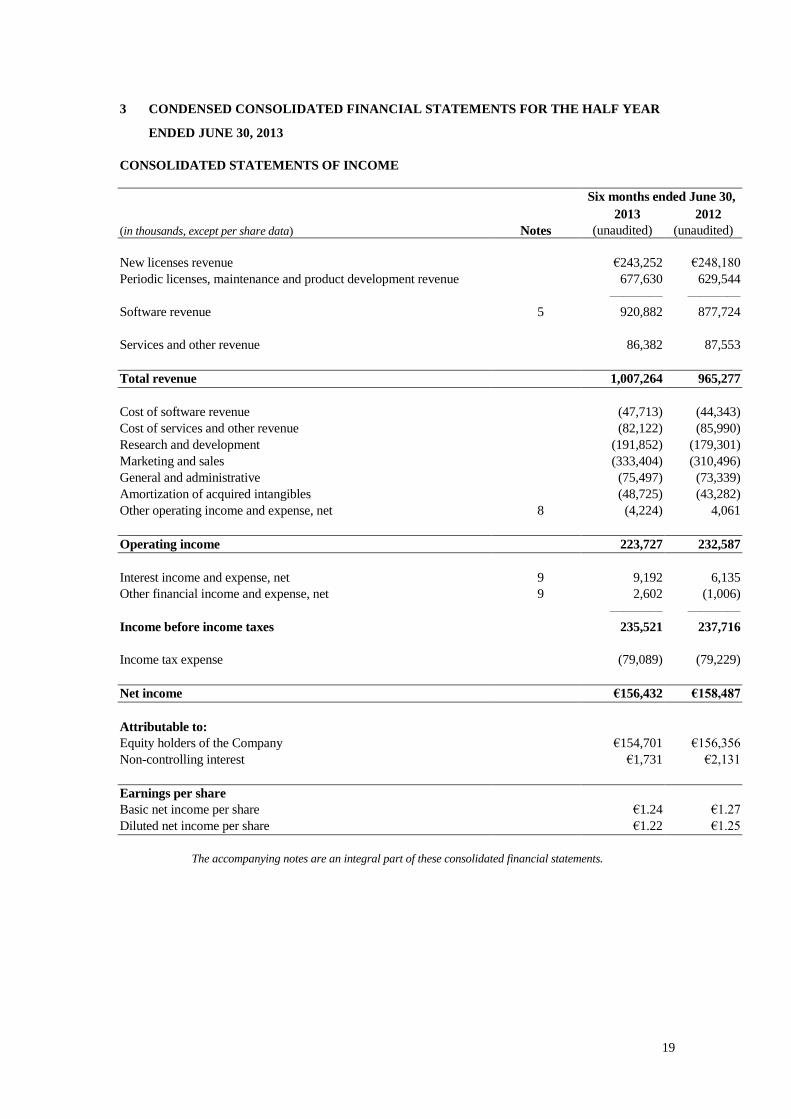
3 CONDENSED CONSOLIDATED FINANCIAL STATEMENTS FOR THE HALF YEAR
ENDED JUNE 30, 2013
CONSOLIDATED STATEMENTS OF INCOME
Six months ended June 30,
2013 2012
(in thousands, except per share data) Notes (unaudited) (unaudited)
New licenses revenue €243,252 €248,180
Periodic licenses, maintenance and product development revenue 677,630 629,544
———— ————
Software revenue 5 920,882 877,724
Services and other revenue 86,382 87,553
Total revenue 1,007,264 965,277
Cost of software revenue (47,713) (44,343)
Cost of services and other revenue (82,122) (85,990)
Research and development (191,852) (179,301)
Marketing and sales (333,404) (310,496)
General and administrative (75,497) (73,339)
Amortization of acquired intangibles (48,725) (43,282)
Other operating income and expense, net 8 (4,224) 4,061
Operating income 223,727 232,587
Interest income and expense, net 9 9,192 6,135
Other financial income and expense, net 9 2,602 (1,006)
———— ————
Income before income taxes 235,521 237,716
Income tax expense (79,089) (79,229)
Net income €156,432 €158,487
Attributable to:
Equity holders of the Company €154,701 €156,356
Non-controlling interest €1,731 €2,131
Earnings per share
Basic net income per share €1.24 €1.27
Diluted net income per share €1.22 €1.25
The accompanying notes are an integral part of these consolidated financial statements.
20
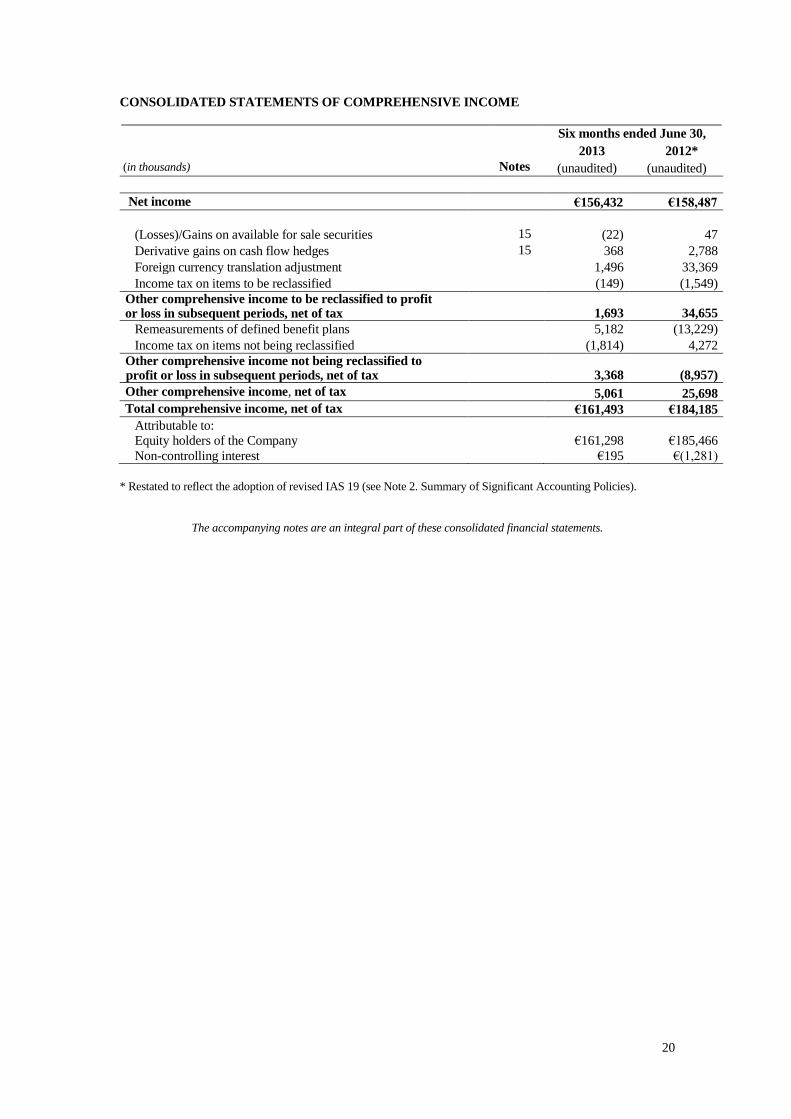
CONSOLIDATED STATEMENTS OF COMPREHENSIVE INCOME
Six months ended June 30,
2013 2012*
(in thousands) Notes (unaudited) (unaudited)
Net income
€156,432 €158,487
, , Actifs financiers disponibles à la vente
(Losses)/Gains on available for sale securities 15 (22) 47
Derivative gains on cash flow hedges 15 368 2,788
Foreign currency translation adjustment
1,496 33,369
Income tax on items to be reclassified
(149) (1,549)
Other comprehensive income to be reclassified to profit or loss in subsequent periods, net of tax 1,693 34,655
Remeasurements of defined benefit plans 5,182 (13,229)
Income tax on items not being reclassified (1,814) 4,272
Other comprehensive income not being reclassified to profit or loss in subsequent periods, net of tax 3,368 (8,957)
Other comprehensive income, net of tax 5,061 25,698
Total comprehensive income, net of tax
€161,493 €184,185
Attributable to:
Equity holders of the Company
€161,298 €185,466
Non-controlling interest
€195 €(1,281)
* Restated to reflect the adoption of revised IAS 19 (see Note 2. Summary of Significant Accounting Policies).
The accompanying notes are an integral part of these consolidated financial statements.
21
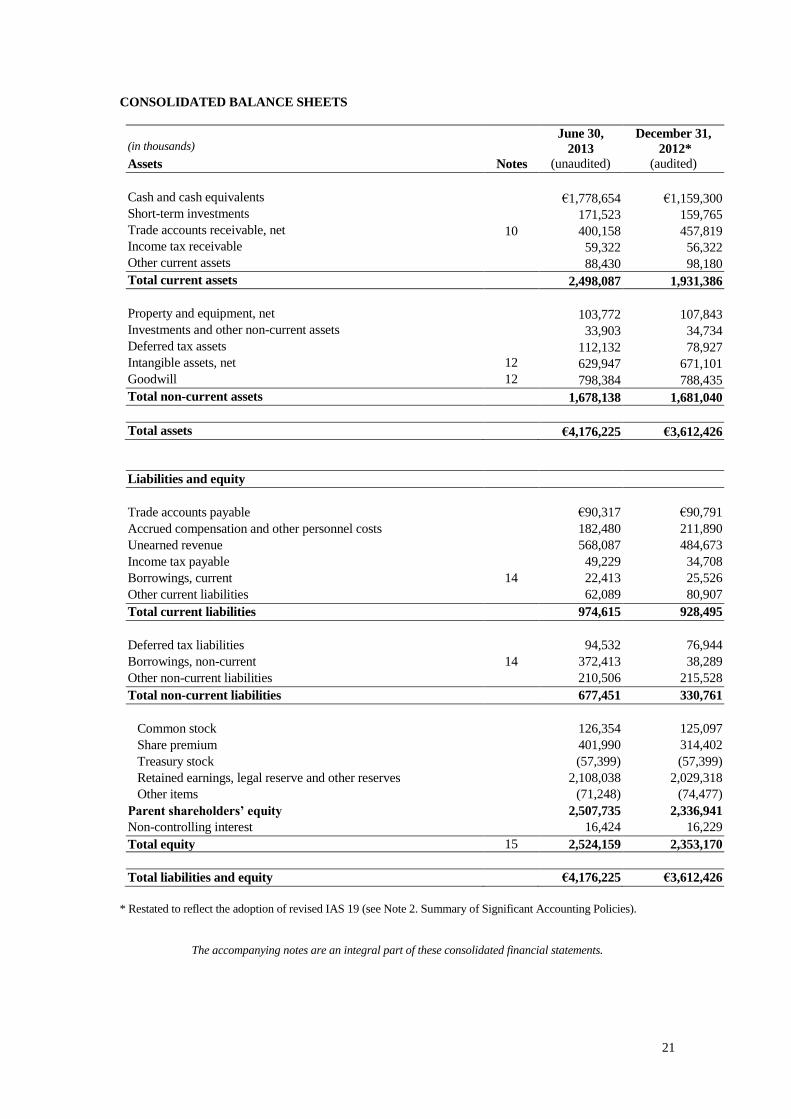
CONSOLIDATED BALANCE SHEETS
(in thousands) June 30,
2013
December 31,
2012*
Assets Notes (unaudited) (audited)
Cash and cash equivalents €1,778,654 €1,159,300
Short-term investments 171,523 159,765
Trade accounts receivable, net 10 400,158 457,819
Income tax receivable 59,322 56,322
Other current assets 88,430 98,180
Total current assets 2,498,087 1,931,386
Property and equipment, net 103,772 107,843
Investments and other non-current assets 33,903 34,734
Deferred tax assets 112,132 78,927
Intangible assets, net 12 629,947 671,101
Goodwill 12 798,384 788,435
Total non-current assets 1,678,138 1,681,040
Total assets €4,176,225 €3,612,426
Liabilities and equity
Trade accounts payable €90,317 €90,791
Accrued compensation and other personnel costs 182,480 211,890
Unearned revenue 568,087 484,673
Income tax payable 49,229 34,708
Borrowings, current 14 22,413 25,526
Other current liabilities 62,089 80,907
Total current liabilities 974,615 928,495
Deferred tax liabilities 94,532 76,944
Borrowings, non-current 14 372,413 38,289
Other non-current liabilities 210,506 215,528
Total non-current liabilities 677,451 330,761
Common stock 126,354 125,097
Share premium 401,990 314,402
Treasury stock (57,399) (57,399)
Retained earnings, legal reserve and other reserves 2,108,038 2,029,318
Other items (71,248) (74,477)
Parent shareholders’ equity 2,507,735 2,336,941
Non-controlling interest 16,424 16,229
Total equity 15 2,524,159 2,353,170
Total liabilities and equity €4,176,225 €3,612,426
* Restated to reflect the adoption of revised IAS 19 (see Note 2. Summary of Significant Accounting Policies).
The accompanying notes are an integral part of these consolidated financial statements.
22
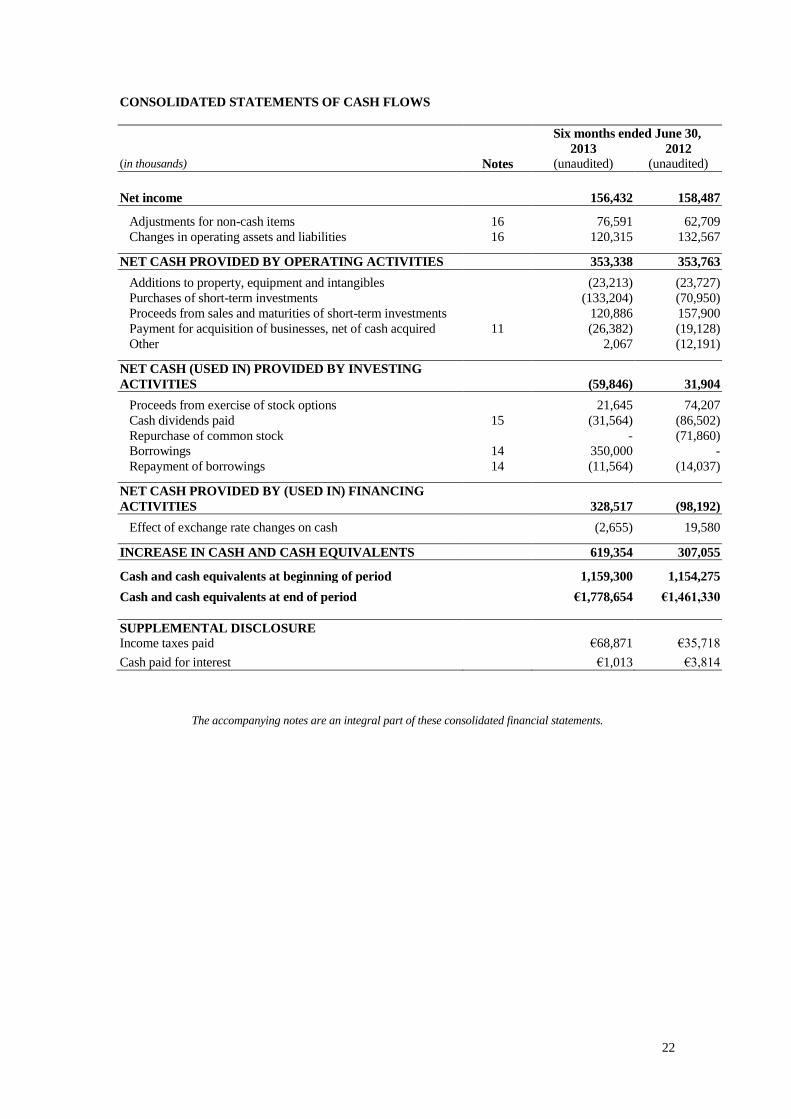
CONSOLIDATED STATEMENTS OF CASH FLOWS
Six months ended June 30, 2013 2012 (in thousands) Notes (unaudited) (unaudited)
Net income 156,432 158,487
Adjustments for non-cash items 16 76,591 62,709
Changes in operating assets and liabilities 16 120,315 132,567
NET CASH PROVIDED BY OPERATING ACTIVITIES 353,338 353,763
Additions to property, equipment and intangibles (23,213) (23,727)
Purchases of short-term investments (133,204) (70,950)
Proceeds from sales and maturities of short-term investments 120,886 157,900
Payment for acquisition of businesses, net of cash acquired 11 (26,382) (19,128)
Other 2,067 (12,191)
NET CASH (USED IN) PROVIDED BY INVESTING
ACTIVITIES (59,846) 31,904
Proceeds from exercise of stock options 21,645 74,207
Cash dividends paid 15 (31,564) (86,502)
Repurchase of common stock - (71,860)
Borrowings 14 350,000 -
Repayment of borrowings 14 (11,564) (14,037)
NET CASH PROVIDED BY (USED IN) FINANCING
ACTIVITIES 328,517 (98,192)
Effect of exchange rate changes on cash (2,655) 19,580
INCREASE IN CASH AND CASH EQUIVALENTS 619,354 307,055
Cash and cash equivalents at beginning of period 1,159,300 1,154,275
Cash and cash equivalents at end of period €1,778,654 €1,461,330
SUPPLEMENTAL DISCLOSURE
Income taxes paid €68,871 €35,718
Cash paid for interest €1,013 €3,814
The accompanying notes are an integral part of these consolidated financial statements.
23
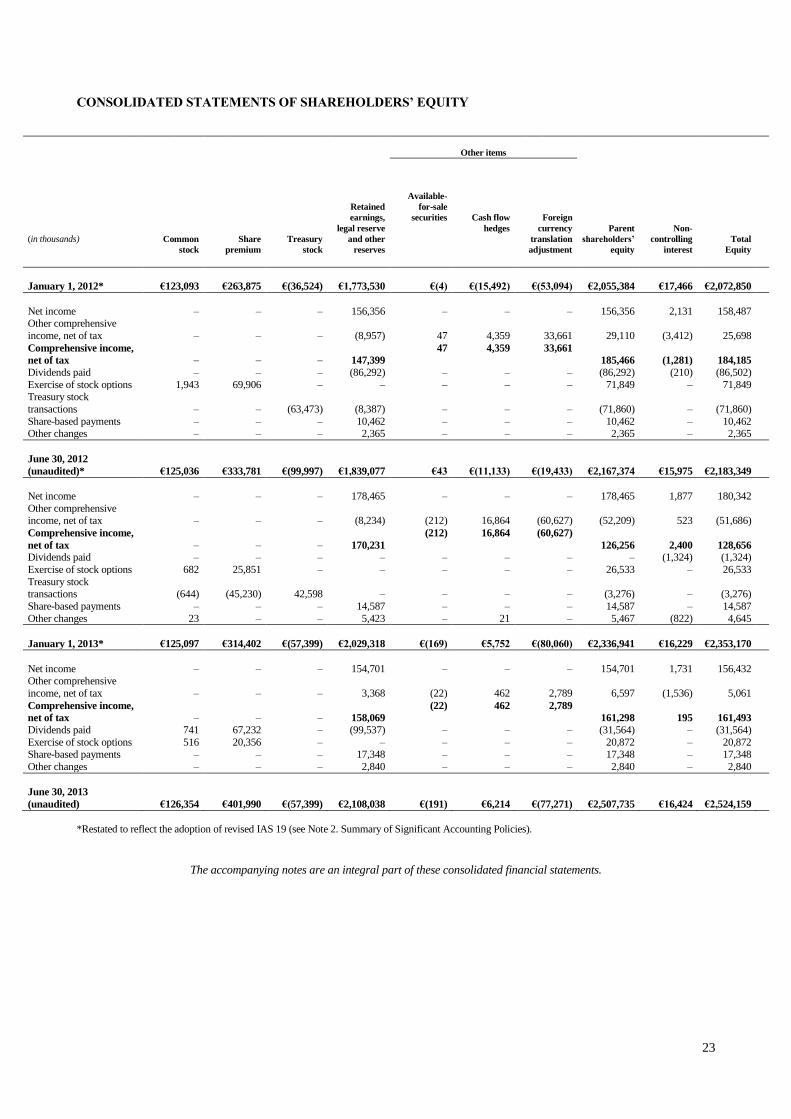
CONSOLIDATED STATEMENTS OF SHAREHOLDERS’ EQUITY
Other items
(in thousands)
Common
stock
Share
premium
Treasury
stock
Retained
earnings,
legal reserve
and other
reserves
Available-
for-sale
securities
Cash flow
hedges
Foreign
currency
translation
adjustment
Parent
shareholders’
equity
Non-
controlling
interest
Total
Equity
January 1, 2012* €123,093 €263,875 €(36,524) €1,773,530
€(4)
€(15,492)
€(53,094) €2,055,384 €17,466 €2,072,850
Net income – – – 156,356 – – – 156,356 2,131 158,487 Other comprehensive
income, net of tax – – – (8,957)
47
4,359
33,661 29,110 (3,412) 25,698
Comprehensive income,
net of tax – – – 147,399
47 4,359 33,661
185,466 (1,281) 184,185
Dividends paid – – – (86,292) – – – (86,292) (210) (86,502)
Exercise of stock options 1,943 69,906 – – – – – 71,849 – 71,849 Treasury stock
transactions – – (63,473) (8,387) – – – (71,860) – (71,860)
Share-based payments – – – 10,462 – – – 10,462 – 10,462 Other changes – – – 2,365 – – – 2,365 – 2,365
June 30, 2012
(unaudited)* €125,036 €333,781 €(99,997) €1,839,077
€43
€(11,133)
€(19,433) €2,167,374 €15,975 €2,183,349
Net income – – – 178,465 – – – 178,465 1,877 180,342
Other comprehensive income, net of tax – – – (8,234)
(212)
16,864
(60,627) (52,209) 523 (51,686)
Comprehensive income,
net of tax – – – 170,231
(212) 16,864 (60,627)
126,256 2,400 128,656
Dividends paid – – – – – – – – (1,324) (1,324)
Exercise of stock options 682 25,851 – – – – – 26,533 – 26,533
Treasury stock transactions (644) (45,230) 42,598 – –
– – (3,276) – (3,276)
Share-based payments – – – 14,587 – – – 14,587 – 14,587
Other changes 23 – – 5,423 – 21 – 5,467 (822) 4,645
January 1, 2013* €125,097 €314,402 €(57,399) €2,029,318
€(169)
€5,752
€(80,060) €2,336,941 €16,229 €2,353,170
Net income – – – 154,701 – – – 154,701 1,731 156,432 Other comprehensive
income, net of tax – – – 3,368
(22)
462
2,789 6,597 (1,536) 5,061
Comprehensive income,
net of tax – – – 158,069
(22) 462 2,789
161,298 195 161,493
Dividends paid 741 67,232 – (99,537) – – – (31,564) – (31,564)
Exercise of stock options 516 20,356 – – – – – 20,872 – 20,872 Share-based payments – – – 17,348 – – – 17,348 – 17,348
Other changes – – – 2,840 – – – 2,840 – 2,840
June 30, 2013
(unaudited) €126,354 €401,990 €(57,399) €2,108,038
€(191)
€6,214
€(77,271) €2,507,735 €16,424 €2,524,159
*Restated to reflect the adoption of revised IAS 19 (see Note 2. Summary of Significant Accounting Policies).
The accompanying notes are an integral part of these consolidated financial statements.
24
NOTES TO THE CONDENSED INTERIM CONSOLIDATED FINANCIAL
STATEMENTS
NOTE 1. DESCRIPTION OF BUSINESS
The “Company” or the “Group” refers to Dassault Systèmes SA and its subsidiaries. The Company
provides software solutions and consulting services. It aims at enabling 3DEXPERIENCE of products for
its customers.
The Company’s global customer base includes companies primarily in 12 industries: Aerospace &
Defense; Transportation & Mobility; Marine & Offshore; Industrial Equipment; High-Tech; Architecture,
Engineering & Construction; Consumer Goods & Retail; Consumer Packaged Goods & Retail; Life
Sciences; Energy, Process & Utilities; Financial & Business Services and Natural Resources. To serve
these industries, the Company has developed a broad software applications portfolio, comprised of social
and collaborative applications, 3D modeling applications, content and simulation applications, and
information intelligence applications, all powered by its 3DEXPERIENCE Platform.
Dassault Systèmes SA is a société anonyme, a form of limited liability company, incorporated under the
laws of France. The Company’s registered office is located at 10, rue Marcel Dassault, in
Vélizy-Villacoublay, France. The Dassault Systèmes SA shares are listed in France on NYSE Euronext
Paris. These interim condensed consolidated financial statements were approved by the Board of
Directors on July 24, 2013.
NOTE 2. SUMMARY OF SIGNIFICANT ACCOUNTING POLICIES
Basis of Presentation and Consolidation
The interim condensed consolidated financial statements for the six months ended June 30, 2013 were
prepared in accordance with International Accounting Standard (“IAS”) 34, “Interim Financial
Reporting”, and as such do not include all the information and disclosures required in annual consolidated
financial statements. They should be read in conjunction with the Company’s financial statements as of
December 31, 2012, prepared in accordance with International Financial Reporting Standards (“IFRS”) as
adopted in the European Union.
The interim condensed consolidated financial statements are presented in thousands of euros except where
otherwise indicated.
Summary of Significant Accounting Policies
Except as described below, the interim condensed consolidated financial statements were prepared based
on the same accounting policies as those applied in the consolidated financial statements as of December
31, 2012:
- Income tax expense is based on an estimate of the weighted average annual income tax rate
expected for the full financial year.
- Pension costs are estimated based on the actuarial reports prepared for fiscal year 2012.
- The Group has adopted IAS 19 (Revised), “Employee benefits”, mandatory for financial years
beginning on or after January 1, 2013. The amendments to IAS 19 require immediate recognition
of actuarial gains and losses in other comprehensive income (the corridor approach is removed),
immediate recognition of past service costs in the consolidated statement of income, and
eliminate the concept of expected returns on plan assets. The retrospective application of the
revised standard resulted in the impacts described below:
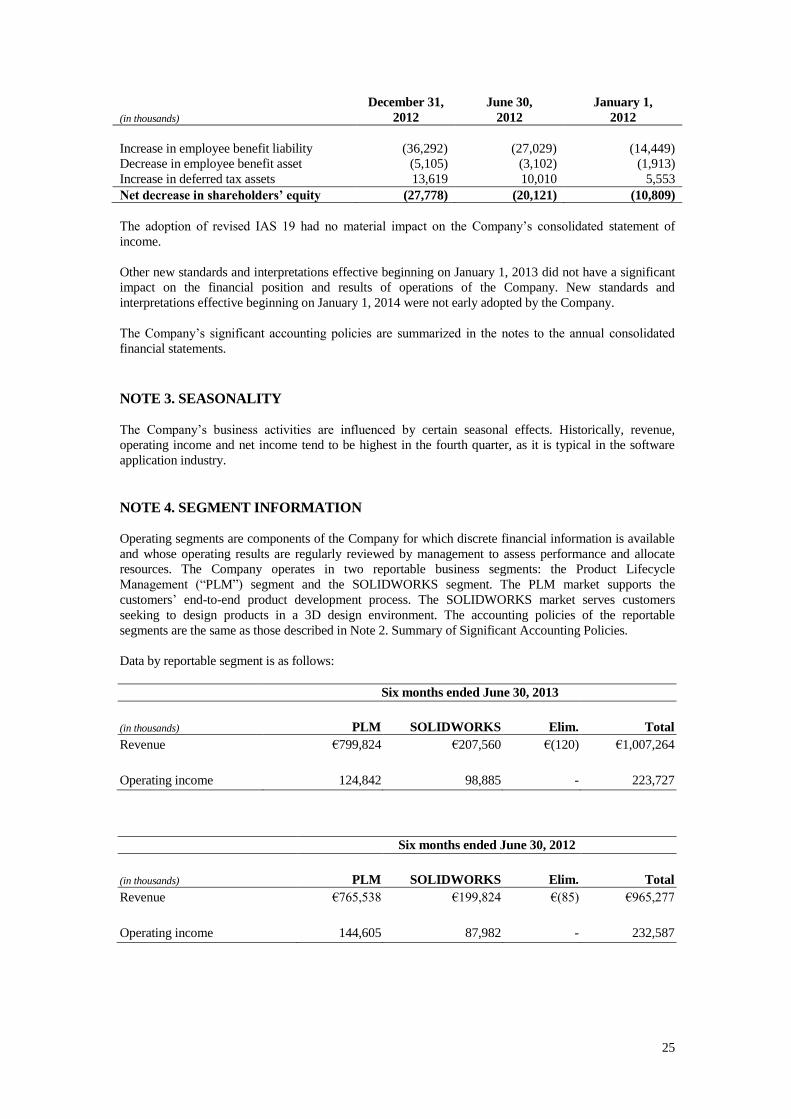
25
(in thousands)
December 31,
2012
June 30,
2012
January 1,
2012
Increase in employee benefit liability (36,292) (27,029) (14,449)
Decrease in employee benefit asset (5,105) (3,102) (1,913)
Increase in deferred tax assets 13,619 10,010 5,553
Net decrease in shareholders’ equity (27,778) (20,121) (10,809)
The adoption of revised IAS 19 had no material impact on the Company’s consolidated statement of
income.
Other new standards and interpretations effective beginning on January 1, 2013 did not have a significant
impact on the financial position and results of operations of the Company. New standards and
interpretations effective beginning on January 1, 2014 were not early adopted by the Company.
The Company’s significant accounting policies are summarized in the notes to the annual consolidated
financial statements.
NOTE 3. SEASONALITY
The Company’s business activities are influenced by certain seasonal effects. Historically, revenue,
operating income and net income tend to be highest in the fourth quarter, as it is typical in the software
application industry.
NOTE 4. SEGMENT INFORMATION
Operating segments are components of the Company for which discrete financial information is available
and whose operating results are regularly reviewed by management to assess performance and allocate
resources. The Company operates in two reportable business segments: the Product Lifecycle
Management (“PLM”) segment and the SOLIDWORKS segment. The PLM market supports the
customers’ end-to-end product development process. The SOLIDWORKS market serves customers
seeking to design products in a 3D design environment. The accounting policies of the reportable
segments are the same as those described in Note 2. Summary of Significant Accounting Policies.
Data by reportable segment is as follows:
Six months ended June 30, 2013
(in thousands) PLM SOLIDWORKS Elim. Total
Revenue €799,824 €207,560 €(120) €1,007,264
Operating income 124,842 98,885 - 223,727
Six months ended June 30, 2012
(in thousands) PLM SOLIDWORKS Elim. Total
Revenue €765,538 €199,824 €(85) €965,277
Operating income 144,605 87,982 - 232,587
26
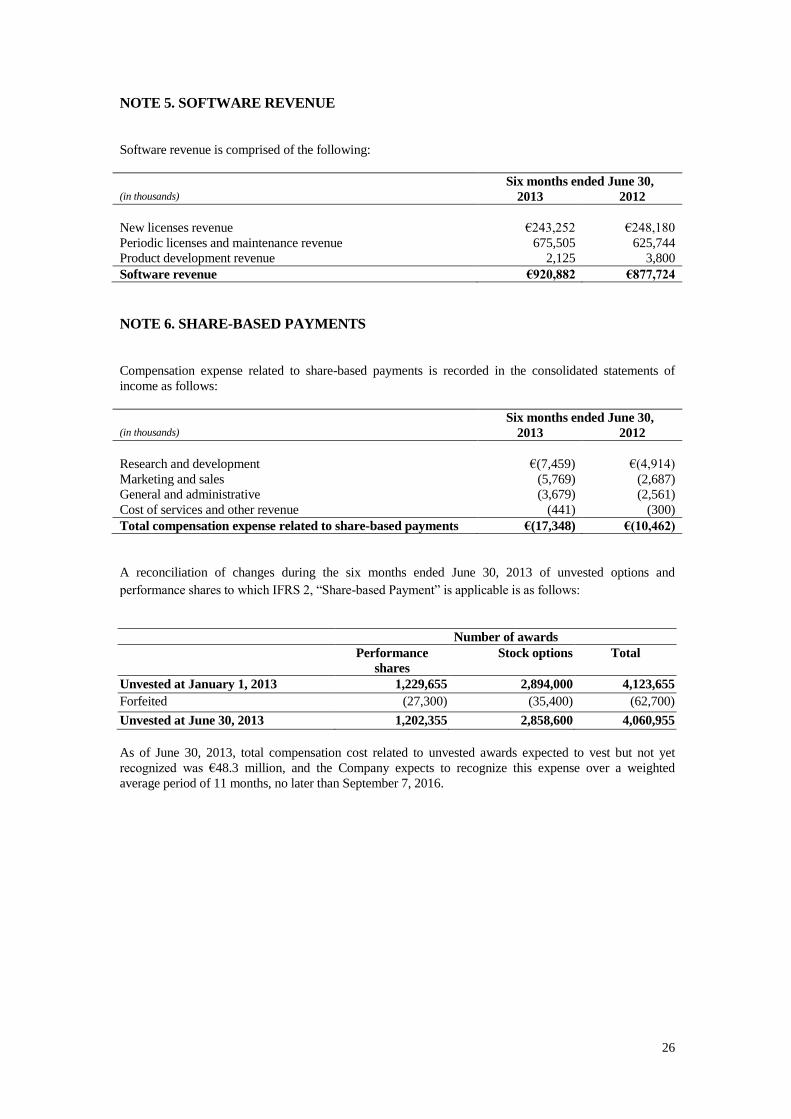
NOTE 5. SOFTWARE REVENUE
Software revenue is comprised of the following:
Six months ended June 30, (in thousands) 2013 2012
New licenses revenue €243,252 €248,180
Periodic licenses and maintenance revenue 675,505 625,744
Product development revenue 2,125 3,800
Software revenue €920,882 €877,724
NOTE 6. SHARE-BASED PAYMENTS
Compensation expense related to share-based payments is recorded in the consolidated statements of
income as follows:
Six months ended June 30, (in thousands) 2013 2012
Research and development €(7,459) €(4,914)
Marketing and sales (5,769) (2,687)
General and administrative (3,679) (2,561)
Cost of services and other revenue (441) (300)
Total compensation expense related to share-based payments €(17,348) €(10,462)
A reconciliation of changes during the six months ended June 30, 2013 of unvested options and
performance shares to which IFRS 2, “Share-based Payment” is applicable is as follows:
Number of awards
Performance
shares
Stock options Total
Unvested at January 1, 2013 1,229,655 2,894,000 4,123,655
Forfeited (27,300) (35,400) (62,700)
Unvested at June 30, 2013 1,202,355 2,858,600 4,060,955
As of June 30, 2013, total compensation cost related to unvested awards expected to vest but not yet
recognized was €48.3 million, and the Company expects to recognize this expense over a weighted
average period of 11 months, no later than September 7, 2016.
27
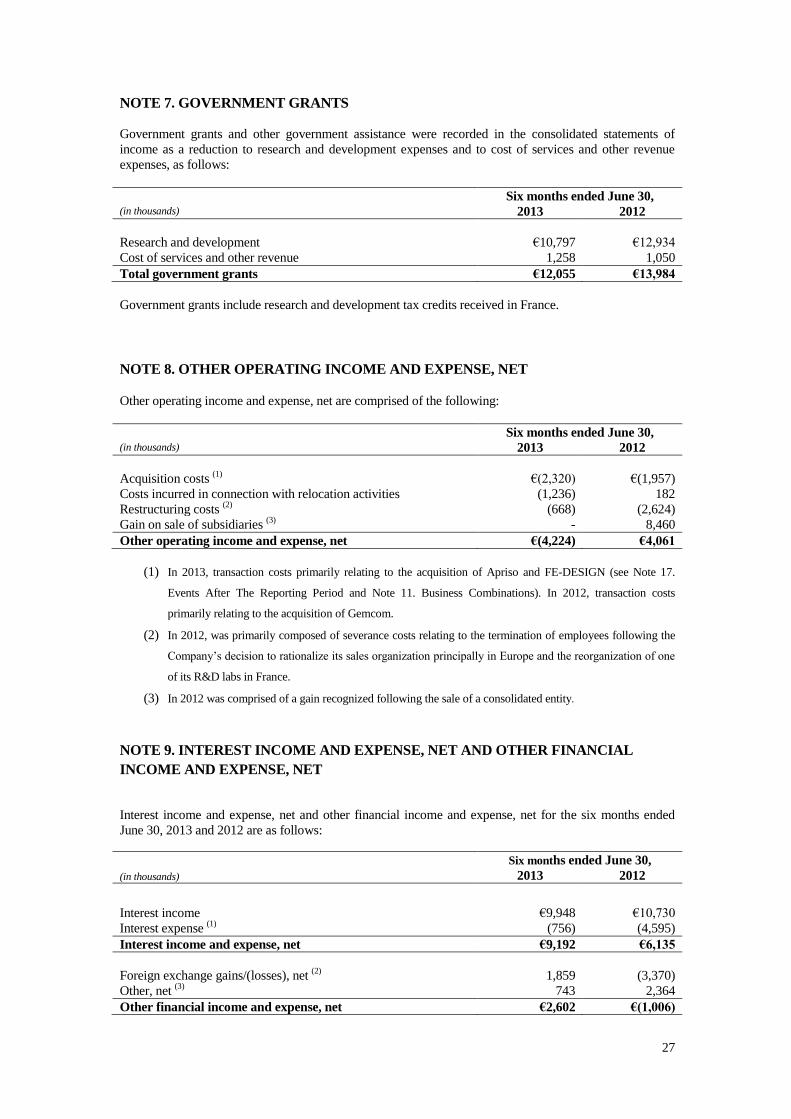
NOTE 7. GOVERNMENT GRANTS
Government grants and other government assistance were recorded in the consolidated statements of
income as a reduction to research and development expenses and to cost of services and other revenue
expenses, as follows:
Six months ended June 30, (in thousands) 2013 2012
Research and development €10,797 €12,934
Cost of services and other revenue 1,258 1,050
Total government grants €12,055 €13,984
Government grants include research and development tax credits received in France.
NOTE 8. OTHER OPERATING INCOME AND EXPENSE, NET
Other operating income and expense, net are comprised of the following:
Six months ended June 30, (in thousands) 2013 2012
Acquisition costs (1)
€(2,320) €(1,957)
Costs incurred in connection with relocation activities (1,236) 182
Restructuring costs (2)
(668) (2,624)
Gain on sale of subsidiaries (3)
- 8,460
Other operating income and expense, net €(4,224) €4,061
(1) In 2013, transaction costs primarily relating to the acquisition of Apriso and FE-DESIGN (see Note 17.
Events After The Reporting Period and Note 11. Business Combinations). In 2012, transaction costs
primarily relating to the acquisition of Gemcom.
(2) In 2012, was primarily composed of severance costs relating to the termination of employees following the
Company’s decision to rationalize its sales organization principally in Europe and the reorganization of one
of its R&D labs in France.
(3) In 2012 was comprised of a gain recognized following the sale of a consolidated entity.
NOTE 9. INTEREST INCOME AND EXPENSE, NET AND OTHER FINANCIAL
INCOME AND EXPENSE, NET
Interest income and expense, net and other financial income and expense, net for the six months ended
June 30, 2013 and 2012 are as follows:
Six months ended June 30,
(in thousands) 2013 2012
Interest income €9,948 €10,730
Interest expense (1)
(756) (4,595)
Interest income and expense, net €9,192 €6,135
Foreign exchange gains/(losses), net (2)
1,859 (3,370)
Other, net (3)
743 2,364
Other financial income and expense, net €2,602 €(1,006)
28
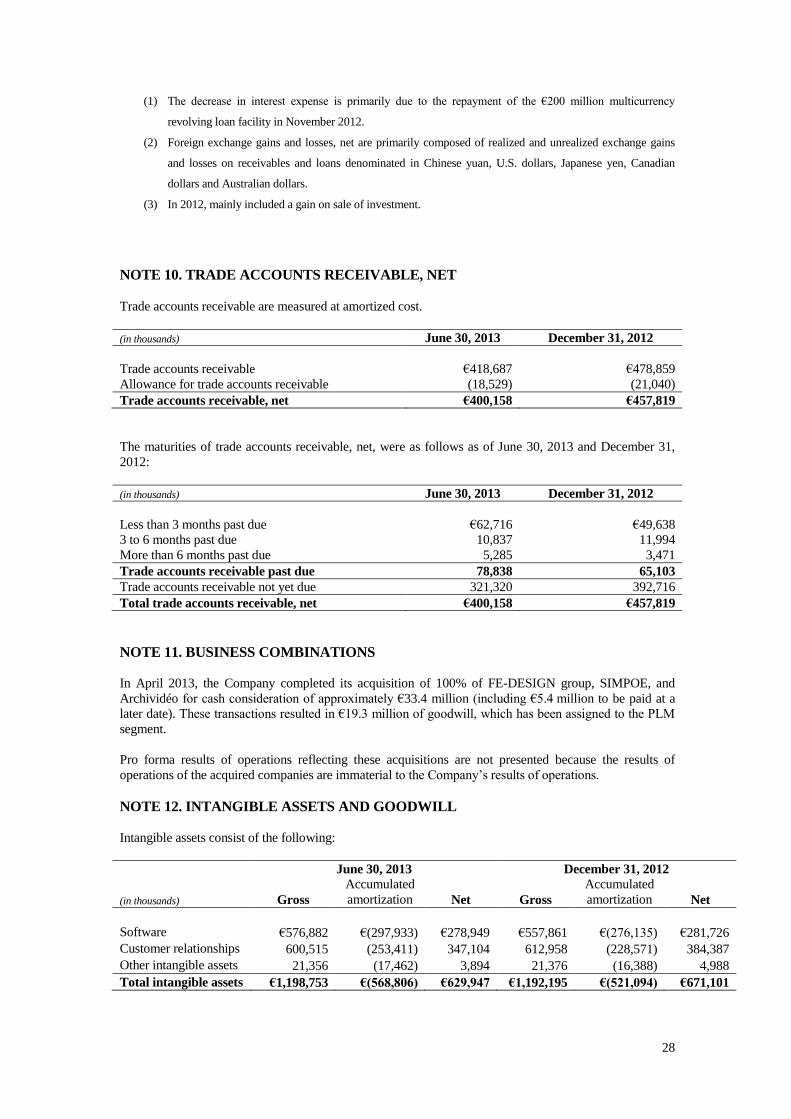
(1) The decrease in interest expense is primarily due to the repayment of the €200 million multicurrency
revolving loan facility in November 2012.
(2) Foreign exchange gains and losses, net are primarily composed of realized and unrealized exchange gains
and losses on receivables and loans denominated in Chinese yuan, U.S. dollars, Japanese yen, Canadian
dollars and Australian dollars.
(3) In 2012, mainly included a gain on sale of investment.
NOTE 10. TRADE ACCOUNTS RECEIVABLE, NET
Trade accounts receivable are measured at amortized cost.
(in thousands) June 30, 2013 December 31, 2012
Trade accounts receivable €418,687 €478,859
Allowance for trade accounts receivable (18,529) (21,040)
Trade accounts receivable, net €400,158 €457,819
The maturities of trade accounts receivable, net, were as follows as of June 30, 2013 and December 31,
2012:
(in thousands) June 30, 2013 December 31, 2012
Less than 3 months past due €62,716 €49,638
3 to 6 months past due 10,837 11,994
More than 6 months past due 5,285 3,471
Trade accounts receivable past due 78,838 65,103
Trade accounts receivable not yet due 321,320 392,716
Total trade accounts receivable, net €400,158 €457,819
NOTE 11. BUSINESS COMBINATIONS
In April 2013, the Company completed its acquisition of 100% of FE-DESIGN group, SIMPOE, and
Archividéo for cash consideration of approximately €33.4 million (including €5.4 million to be paid at a
later date). These transactions resulted in €19.3 million of goodwill, which has been assigned to the PLM
segment.
Pro forma results of operations reflecting these acquisitions are not presented because the results of
operations of the acquired companies are immaterial to the Company’s results of operations.
NOTE 12. INTANGIBLE ASSETS AND GOODWILL
Intangible assets consist of the following:
June 30, 2013 December 31, 2012
(in thousands) Gross
Accumulated
amortization Net Gross
Accumulated
amortization Net
Software €576,882 €(297,933) €278,949 €557,861 €(276,135) €281,726
Customer relationships 600,515 (253,411) 347,104 612,958 (228,571) 384,387
Other intangible assets 21,356 (17,462) 3,894 21,376 (16,388) 4,988
Total intangible assets €1,198,753 €(568,806) €629,947 €1,192,195 €(521,094) €671,101
29
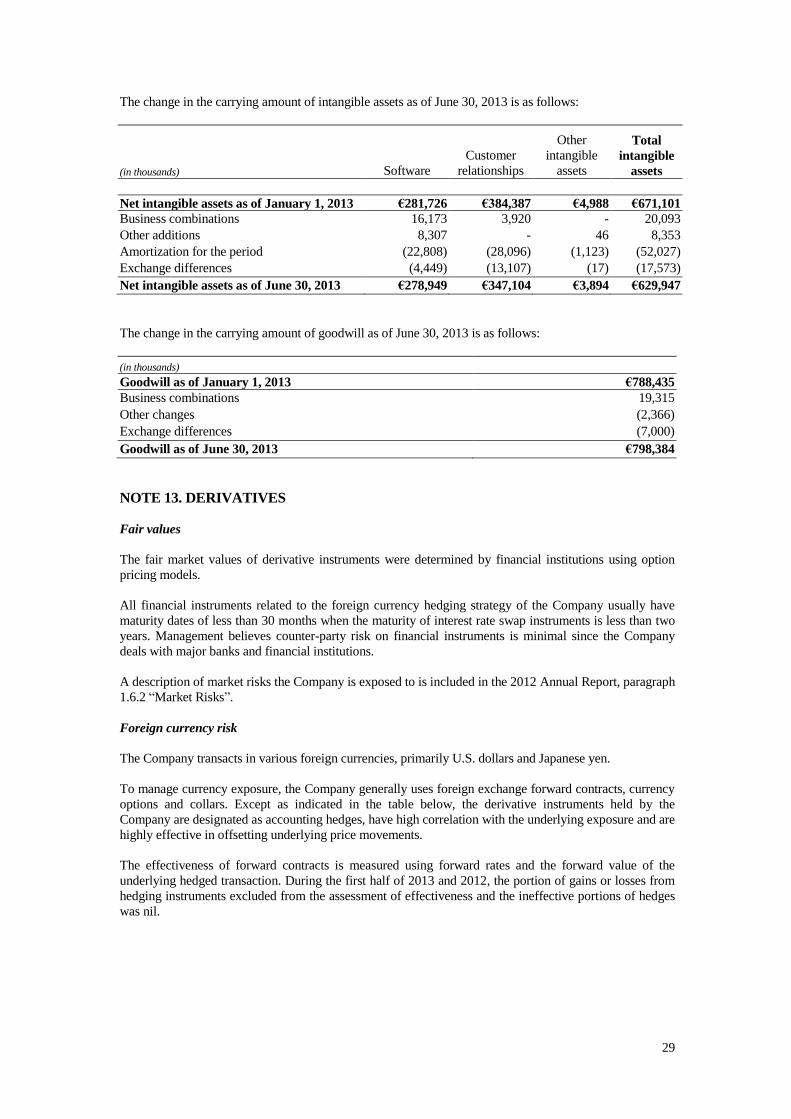
The change in the carrying amount of intangible assets as of June 30, 2013 is as follows:
(in thousands) Software
Customer
relationships
Other
intangible
assets
Total
intangible
assets
Net intangible assets as of January 1, 2013 €281,726 €384,387 €4,988 €671,101
Business combinations 16,173 3,920 - 20,093
Other additions 8,307 - 46 8,353
Amortization for the period (22,808) (28,096) (1,123) (52,027)
Exchange differences (4,449) (13,107) (17) (17,573)
Net intangible assets as of June 30, 2013 €278,949 €347,104 €3,894 €629,947
The change in the carrying amount of goodwill as of June 30, 2013 is as follows:
(in thousands)
Goodwill as of January 1, 2013 €788,435
Business combinations 19,315
Other changes (2,366)
Exchange differences (7,000)
Goodwill as of June 30, 2013 €798,384
NOTE 13. DERIVATIVES
Fair values
The fair market values of derivative instruments were determined by financial institutions using option
pricing models.
All financial instruments related to the foreign currency hedging strategy of the Company usually have
maturity dates of less than 30 months when the maturity of interest rate swap instruments is less than two
years. Management believes counter-party risk on financial instruments is minimal since the Company
deals with major banks and financial institutions.
A description of market risks the Company is exposed to is included in the 2012 Annual Report, paragraph
1.6.2 “Market Risks”.
Foreign currency risk
The Company transacts in various foreign currencies, primarily U.S. dollars and Japanese yen.
To manage currency exposure, the Company generally uses foreign exchange forward contracts, currency
options and collars. Except as indicated in the table below, the derivative instruments held by the
Company are designated as accounting hedges, have high correlation with the underlying exposure and are
highly effective in offsetting underlying price movements.
The effectiveness of forward contracts is measured using forward rates and the forward value of the
underlying hedged transaction. During the first half of 2013 and 2012, the portion of gains or losses from
hedging instruments excluded from the assessment of effectiveness and the ineffective portions of hedges
was nil.
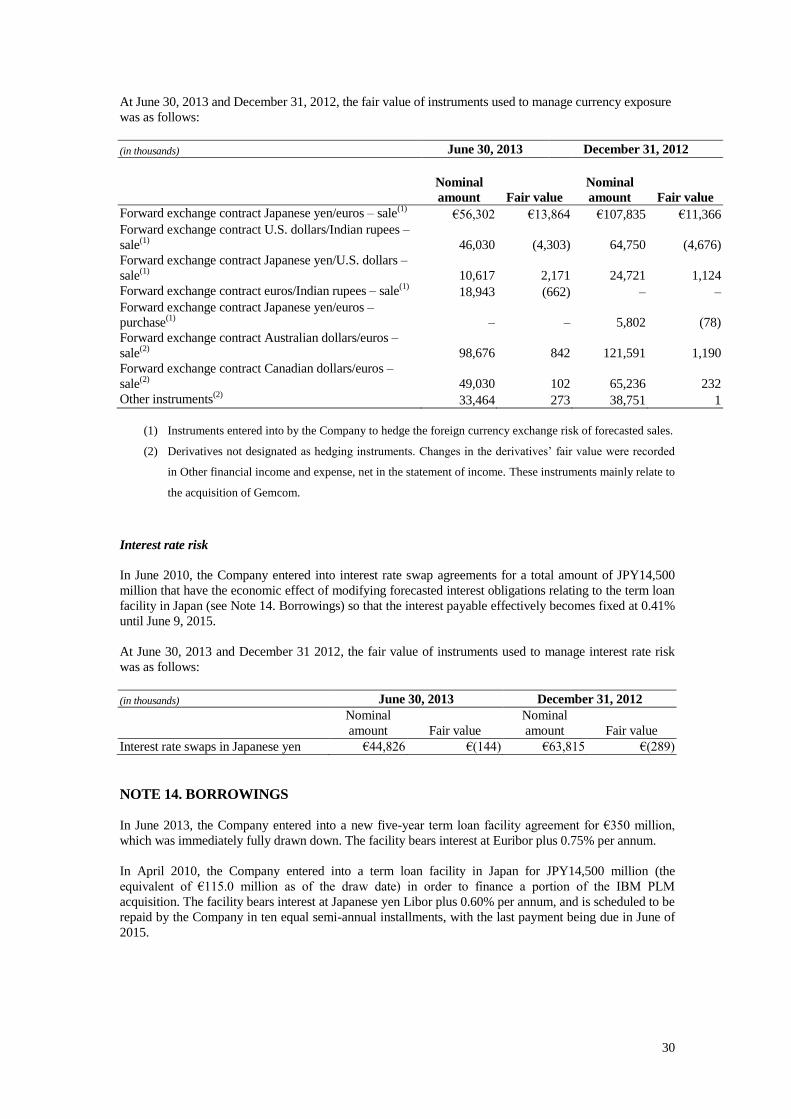
30
At June 30, 2013 and December 31, 2012, the fair value of instruments used to manage currency exposure
was as follows:
(in thousands) June 30, 2013 December 31, 2012
Nominal
amount Fair value
Nominal
amount Fair value
Forward exchange contract Japanese yen/euros – sale(1)
€56,302 €13,864 €107,835 €11,366
Forward exchange contract U.S. dollars/Indian rupees –
sale(1)
46,030 (4,303) 64,750 (4,676)
Forward exchange contract Japanese yen/U.S. dollars –
sale(1)
10,617 2,171 24,721 1,124
Forward exchange contract euros/Indian rupees – sale(1)
18,943 (662) – –
Forward exchange contract Japanese yen/euros –
purchase(1)
– – 5,802 (78)
Forward exchange contract Australian dollars/euros –
sale(2)
98,676 842 121,591 1,190
Forward exchange contract Canadian dollars/euros –
sale(2)
49,030 102 65,236 232
Other instruments(2)
33,464 273 38,751 1
(1) Instruments entered into by the Company to hedge the foreign currency exchange risk of forecasted sales.
(2) Derivatives not designated as hedging instruments. Changes in the derivatives’ fair value were recorded
in Other financial income and expense, net in the statement of income. These instruments mainly relate to
the acquisition of Gemcom.
Interest rate risk
In June 2010, the Company entered into interest rate swap agreements for a total amount of JPY14,500
million that have the economic effect of modifying forecasted interest obligations relating to the term loan
facility in Japan (see Note 14. Borrowings) so that the interest payable effectively becomes fixed at 0.41%
until June 9, 2015.
At June 30, 2013 and December 31 2012, the fair value of instruments used to manage interest rate risk
was as follows:
(in thousands) June 30, 2013 December 31, 2012
Nominal
amount Fair value
Nominal
amount Fair value
Interest rate swaps in Japanese yen €44,826 €(144) €63,815 €(289)
NOTE 14. BORROWINGS
In June 2013, the Company entered into a new five-year term loan facility agreement for €350 million,
which was immediately fully drawn down. The facility bears interest at Euribor plus 0.75% per annum.
In April 2010, the Company entered into a term loan facility in Japan for JPY14,500 million (the
equivalent of €115.0 million as of the draw date) in order to finance a portion of the IBM PLM
acquisition. The facility bears interest at Japanese yen Libor plus 0.60% per annum, and is scheduled to be
repaid by the Company in ten equal semi-annual installments, with the last payment being due in June of
2015.
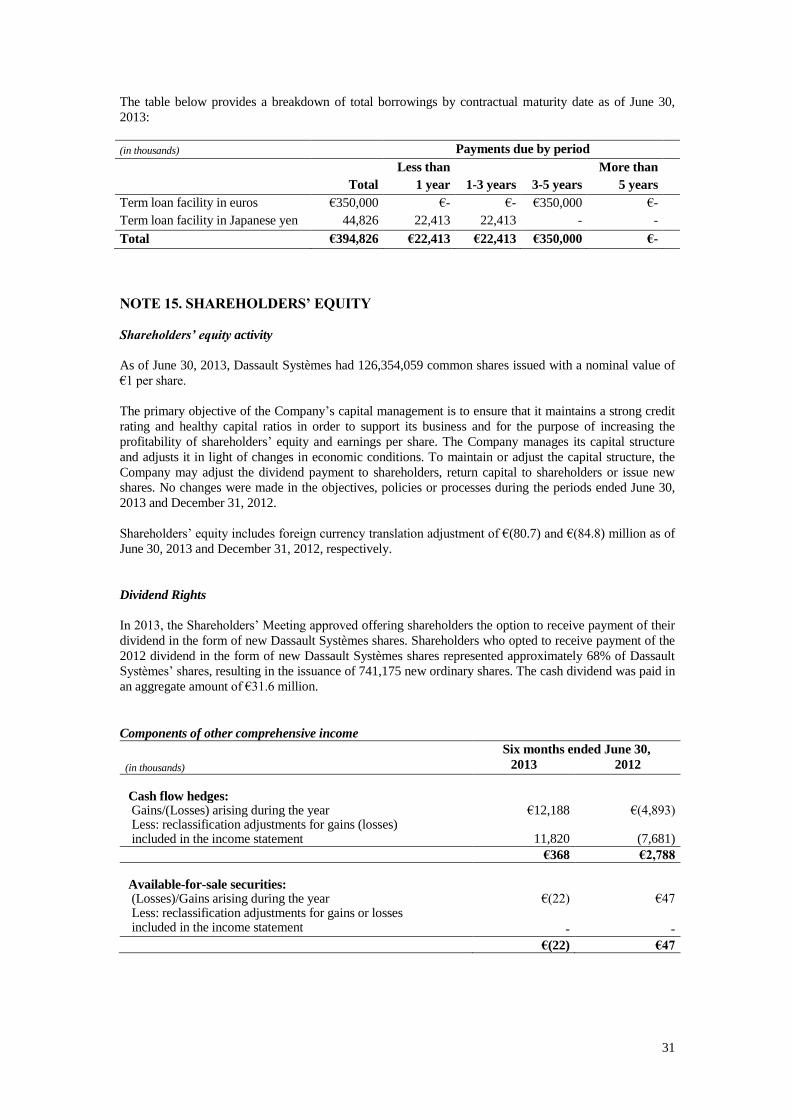
31
The table below provides a breakdown of total borrowings by contractual maturity date as of June 30,
2013:
(in thousands) Payments due by period
Total
Less than
1 year 1-3 years 3-5 years
More than
5 years
Term loan facility in euros €350,000 €- €- €350,000 €-
Term loan facility in Japanese yen 44,826 22,413 22,413 - -
Total €394,826 €22,413 €22,413 €350,000 €-
NOTE 15. SHAREHOLDERS’ EQUITY
Shareholders’ equity activity
As of June 30, 2013, Dassault Systèmes had 126,354,059 common shares issued with a nominal value of
€1 per share.
The primary objective of the Company’s capital management is to ensure that it maintains a strong credit
rating and healthy capital ratios in order to support its business and for the purpose of increasing the
profitability of shareholders’ equity and earnings per share. The Company manages its capital structure
and adjusts it in light of changes in economic conditions. To maintain or adjust the capital structure, the
Company may adjust the dividend payment to shareholders, return capital to shareholders or issue new
shares. No changes were made in the objectives, policies or processes during the periods ended June 30,
2013 and December 31, 2012.
Shareholders’ equity includes foreign currency translation adjustment of €(80.7) and €(84.8) million as of
June 30, 2013 and December 31, 2012, respectively.
Dividend Rights
In 2013, the Shareholders’ Meeting approved offering shareholders the option to receive payment of their
dividend in the form of new Dassault Systèmes shares. Shareholders who opted to receive payment of the
2012 dividend in the form of new Dassault Systèmes shares represented approximately 68% of Dassault
Systèmes’ shares, resulting in the issuance of 741,175 new ordinary shares. The cash dividend was paid in
an aggregate amount of €31.6 million.
Components of other comprehensive income
Six months ended June 30,
(in thousands) 2013 2012
Cash flow hedges: Gains/(Losses) arising during the year €12,188 €(4,893) Less: reclassification adjustments for gains (losses) included in the income statement 11,820 (7,681)
€368 €2,788
Available-for-sale securities: (Losses)/Gains arising during the year €(22) €47 Less: reclassification adjustments for gains or losses included in the income statement
-
-
€(22) €47
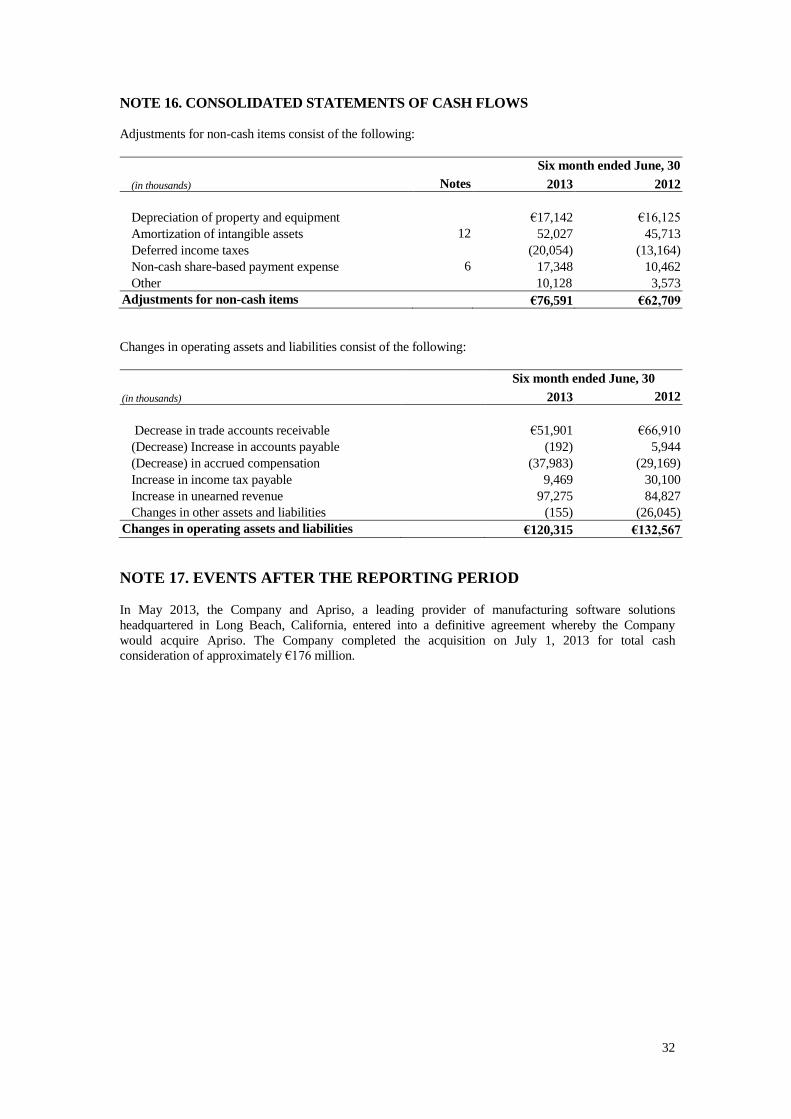
32
NOTE 16. CONSOLIDATED STATEMENTS OF CASH FLOWS
Adjustments for non-cash items consist of the following:
Six month ended June, 30
(in thousands) Notes 2013 2012
Depreciation of property and equipment
€17,142 €16,125
Amortization of intangible assets 12 52,027 45,713
Deferred income taxes
(20,054) (13,164)
Non-cash share-based payment expense 6 17,348 10,462
Other 10,128 3,573
Adjustments for non-cash items €76,591 €62,709
Changes in operating assets and liabilities consist of the following:
Six month ended June, 30
(in thousands) 2013 2012
Decrease in trade accounts receivable
€51,901 €66,910
(Decrease) Increase in accounts payable
(192) 5,944
(Decrease) in accrued compensation
(37,983) (29,169)
Increase in income tax payable
9,469 30,100
Increase in unearned revenue 97,275 84,827
Changes in other assets and liabilities
(155) (26,045)
Changes in operating assets and liabilities €120,315 €132,567
NOTE 17. EVENTS AFTER THE REPORTING PERIOD
In May 2013, the Company and Apriso, a leading provider of manufacturing software solutions
headquartered in Long Beach, California, entered into a definitive agreement whereby the Company
would acquire Apriso. The Company completed the acquisition on July 1, 2013 for total cash
consideration of approximately €176 million.
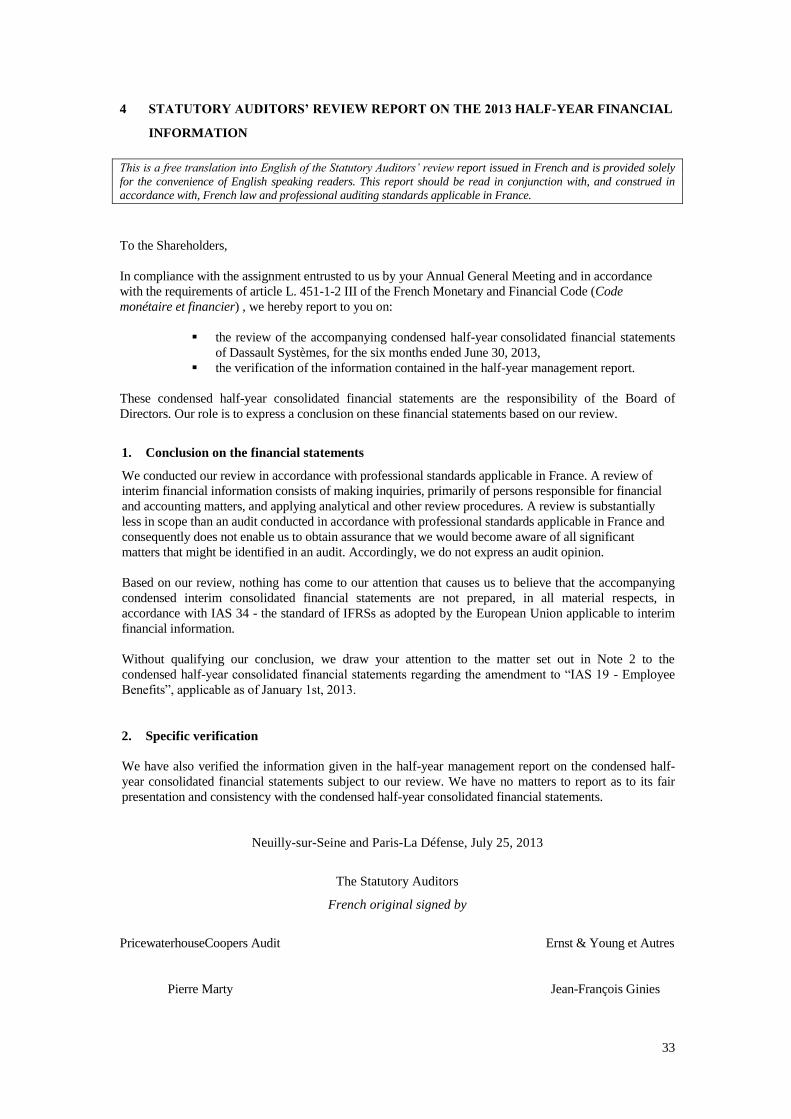
33
4 STATUTORY AUDITORS’ REVIEW REPORT ON THE 2013 HALF-YEAR FINANCIAL
INFORMATION
This is a free translation into English of the Statutory Auditors’ review report issued in French and is provided solely
for the convenience of English speaking readers. This report should be read in conjunction with, and construed in
accordance with, French law and professional auditing standards applicable in France.
To the Shareholders,
In compliance with the assignment entrusted to us by your Annual General Meeting and in accordance
with the requirements of article L. 451-1-2 III of the French Monetary and Financial Code (Code
monétaire et financier) , we hereby report to you on:
the review of the accompanying condensed half-year consolidated financial statements
of Dassault Systèmes, for the six months ended June 30, 2013,
the verification of the information contained in the half-year management report.
These condensed half-year consolidated financial statements are the responsibility of the Board of
Directors. Our role is to express a conclusion on these financial statements based on our review.
1. Conclusion on the financial statements
We conducted our review in accordance with professional standards applicable in France. A review of
interim financial information consists of making inquiries, primarily of persons responsible for financial
and accounting matters, and applying analytical and other review procedures. A review is substantially
less in scope than an audit conducted in accordance with professional standards applicable in France and
consequently does not enable us to obtain assurance that we would become aware of all significant
matters that might be identified in an audit. Accordingly, we do not express an audit opinion.
Based on our review, nothing has come to our attention that causes us to believe that the accompanying
condensed interim consolidated financial statements are not prepared, in all material respects, in
accordance with IAS 34 - the standard of IFRSs as adopted by the European Union applicable to interim
financial information.
Without qualifying our conclusion, we draw your attention to the matter set out in Note 2 to the
condensed half-year consolidated financial statements regarding the amendment to “IAS 19 - Employee
Benefits”, applicable as of January 1st, 2013.
2. Specific verification
We have also verified the information given in the half-year management report on the condensed half-
year consolidated financial statements subject to our review. We have no matters to report as to its fair
presentation and consistency with the condensed half-year consolidated financial statements.
Neuilly-sur-Seine and Paris-La Défense, July 25, 2013
The Statutory Auditors
French original signed by
PricewaterhouseCoopers Audit Ernst & Young et Autres
Pierre Marty Jean-François Ginies