Danish University Colleges Perfusion MRI (dynamic ... may not be possible to perform in some...
8
Danish University Colleges Perfusion MRI (dynamic susceptibility contrast imaging) with different measurement approaches for the evaluation of blood flow and blood volume in human gliomas Thomsen, Henrik; Larsson, Elna-Marie; Steffensen, Elena Published in: Acta Radiologica Publication date: 2012 Document Version Pre-print: The original manuscript sent to the publisher. The article has not yet been reviewed or amended. Link to publication Citation for pulished version (APA): Thomsen, H., Larsson, E-M., & Steffensen, E. (2012). Perfusion MRI (dynamic susceptibility contrast imaging) with different measurement approaches for the evaluation of blood flow and blood volume in human gliomas. Acta Radiologica, 53, 95-101. General rights Copyright and moral rights for the publications made accessible in the public portal are retained by the authors and/or other copyright owners and it is a condition of accessing publications that users recognise and abide by the legal requirements associated with these rights. • Users may download and print one copy of any publication from the public portal for the purpose of private study or research. • You may not further distribute the material or use it for any profit-making activity or commercial gain • You may freely distribute the URL identifying the publication in the public portal Download policy If you believe that this document breaches copyright please contact us providing details, and we will remove access to the work immediately and investigate your claim. Download date: 05. Jun. 2018
-
Upload
vuonghuong -
Category
Documents
-
view
215 -
download
1
Transcript of Danish University Colleges Perfusion MRI (dynamic ... may not be possible to perform in some...

Danish University Colleges
Perfusion MRI (dynamic susceptibility contrast imaging) with different measurementapproaches for the evaluation of blood flow and blood volume in human gliomas
Thomsen, Henrik; Larsson, Elna-Marie; Steffensen, Elena
Published in:Acta Radiologica
Publication date:2012
Document VersionPre-print: The original manuscript sent to the publisher. The article has not yet been reviewed or amended.
Link to publication
Citation for pulished version (APA):Thomsen, H., Larsson, E-M., & Steffensen, E. (2012). Perfusion MRI (dynamic susceptibility contrast imaging)with different measurement approaches for the evaluation of blood flow and blood volume in human gliomas.Acta Radiologica, 53, 95-101.
General rightsCopyright and moral rights for the publications made accessible in the public portal are retained by the authors and/or other copyright ownersand it is a condition of accessing publications that users recognise and abide by the legal requirements associated with these rights.
• Users may download and print one copy of any publication from the public portal for the purpose of private study or research. • You may not further distribute the material or use it for any profit-making activity or commercial gain • You may freely distribute the URL identifying the publication in the public portal
Download policyIf you believe that this document breaches copyright please contact us providing details, and we will remove access to the work immediatelyand investigate your claim.
Download date: 05. Jun. 2018

Original article
Perfusion MRI (dynamic susceptibility contrast imaging) with
different measurement approaches for the evaluation
of blood flow and blood volume in human gliomas
H Thomsen1,2, E Steffensen3 and E-M Larsson3,4
1Den Sundhedsfaglige Kandidatuddannelse, Aarhus Universitet Bygning 1264, Arhus, Denmark; 2University College Nordjylland, Aalborg,
Denmark; 3Aalborg Hospital/Aarhus University Hospital, Department of Radiology, Aalborg, Denmark; 4Uppsala University Hospital,
Department of Radiology, Uppsala, Sweden
Correspondence to: H Thomsen. Email: [email protected]
AbstractBackground: Perfusion magnetic resonance imaging (MRI) is increasingly used in the evaluation of brain
tumors. Relative cerebral blood volume (rCBV) is usually obtained by dynamic susceptibility contrast (DSC)
MRI using normal appearing white matter as reference region. The emerging perfusion technique arterial
spin labelling (ASL) presently provides measurement only of cerebral blood flow (CBF), which has not been
widely used in human brain tumor studies.
Purpose: To assess if measurement of blood flow is comparable with measurement of blood volume in
human biopsy-proven gliomas obtained by DSC-MRI using two different regions for normalization and two
different measurement approaches.
Material and Methods: Retrospective study of 61 patients with different types of gliomas examined with
DSC perfusion MRI. Regions of interest (ROIs) were placed in tumor portions with maximum perfusion on
rCBF and rCBV maps, with contralateral normal appearing white matter and cerebellum as reference
regions. Larger ROIs were drawn for histogram analyses. The type and grade of the gliomas were obtained
by histopathology. Statistical comparison was made between diffuse astrocytomas, anaplastic
astrocytomas, and glioblastomas.
Results: rCBF and rCBV measurements obtained with the maximum perfusion method were correlated
when normalized to white matter (r ¼ 0.60) and to the cerebellum (r ¼ 0.49). Histogram analyses of rCBF and
rCBV showed that mean and median values as well as skewness and peak position were correlated (0.61 ,
r , 0.93), whereas for kurtosis and peak height, the correlation coefficient was about 0.3 when comparing
rCBF and rCBV values for the same reference region. Neither rCBF nor rCBV quantification provided a
statistically significant difference between the three types of gliomas. However, both rCBF and rCBV tended
to increase with tumor grade and to be lower in patients who had undergone resection/treatment.
Conclusion: rCBF measurements normalized to white matter or cerebellum are comparable with the
established rCBV measurements used for the clinical evaluation of cerebral gliomas.
Keywords: MR imaging – modalities/techniques, MR diffusion/perfusion, brain/brain stem – structures, tissuecharacterization – topics
Submitted May 8, 2011; accepted for publication October 24, 2011
In brain tumor evaluation, magnetic resonance dynamic sus-ceptibility contrast imaging (DSC-MRI) is presently the mostwidely used MRI perfusion technique (1), allowing esti-mation of the cerebral perfusion in terms of relative cerebralblood volume (rCBV) and relative cerebral blood flow(rCBF). Visual evaluation of rCBV and rCBF maps can be
supplemented by quantitative measurements of the perfusionvalues in regions of interest (ROI) placed in tumor tissue.
Tumor type and malignancy grade are determined by histo-pathological investigation. Perfusion MRI allows quantitativecharacterization of gliomas and can potentially be a diagnosticalternative to histopathological examination, which is invasive
Acta Radiologica 2012; 53: 95–101. DOI: 10.1258/ar.2011.110242

and may not be possible to perform in some patients.A ROI-based maximum perfusion approach has beenused in several studies to grade gliomas (2–4). Other studieshave used histogram-based analyses, obtaining a largernumber of the parameters characterizing the tumor region(5–7).
Clinically established methods for quantitative perfusionmeasurements usually include normalization of the meanor maximum perfusion values in the tumor region inrelation to mean values in normal appearing white matter.Normalized rCBV measurements are considered to be theclinical standard (8, 9).
However, white matter is often affected by treatmentand/or edema or may be invaded by diffuse tumorgrowth. When perfusion is measured with other techniques(e.g. O15-PET, SPECT, and arterial spin labelling [ASL]MRI) the cerebellum has often been used as a referenceregion (10–12). These techniques measure CBF but usuallynot CBV. Thus the measurement of rCBF values byDSC-MRI perfusion in tumors with the cerebellum as areference region needs to be evaluated (12).
The aim of this study was to assess if measurement ofblood flow is comparable with measurement of bloodvolume in human biopsy-proven gliomas obtained byDSC-MRI using two different regions for normalizationand two different measurement approaches.
Material and Methods
Patients
This is a retrospective study of patients with cerebralgliomas who had undergone DSC-MRI examination at theDepartment of Radiology of our hospital during theperiod October 1, 2006 to September 30, 2008. Seventy-fivepatients were enrolled in the study using the followinginclusion criteria: the diagnosis was a cerebral glioma,DSC-MRI of the brain had been performed, and histopatho-logical diagnosis based on tissue from needle biopsy or sur-gical resection had been obtained.
Subsequently, 14 patients were later excluded because oftechnical reasons: artifacts in images and inadequate histo-pathological diagnoses.
The final study population consisted of 61 patients, 31men and 30 women. Twenty-three patients had DSC-MRIat baseline before the start of treatment and 38 patientsafter the start of treatment. Each patient was only assessedon one occasion in this study.
The National Danish Board of Health and the DanishData Protection Agency approved this study.
MR imaging and postprocessing
MRI protocol: MRI was performed on 3T and 1.5T systems(Signa HDx; GE Healthcare, Milwaukee, WI, USA) withmorphological sequences (transverse T2-weighted fast spinecho [FSE], transverse T1-weighted fluid attenuated inver-sion recovery [FLAIR] before and after contrast injection,coronal T1-weighted spin echo [SE] after contrast injection),transverse diffusion-weighted imaging (DWI) and transverse
DSC perfusion imaging. The DSC imaging was performedwith a single-shot gradient echo planar imaging (EPI)sequence with TR/TE ¼ 1400/29 msec, matrix 128 � 128,acceleration factor ¼ 2, FOV 24 cm, slice thickness 5 mmwith 1 mm inter-slice gap, 24 slices, scan time 1.5 min.Gadolinium-based contrast agent (Gadovist; Bayer ScheringPharma AG, Berlin, Germany), 0.1 mmol/kg, was injectedintravenously at 5 mL/s.
Postprocessing: rCBV and rCBF maps were calculatedusing an established tracer kinetic model applied to first-pass data (13, 14) (NordicIce NordicImagingLab, Bergen,Norway) (15). Deconvolution of the measured signal-timecurves was performed using singular value decompositionwith arterial input function of about 5 pixels retrievedfrom the middle cerebral artery branches in the hemispherecontra lateral to the tumor. Correction for contrast agentleakage in the tumor due to blood–brain barrier disruptionwas also included in the postprocessing (16).
Quantitative image analysis
Tumor tissue was identified on T1-weighted contrast-enhanced images and/or T2-weighted images and simul-taneously on the perfusion images. ROIs were placed intumor tissue with maximum signal intensity on rCBFmaps, and in normal-appearing white matter and cerebel-lum as reference regions. (Fig. 1). Care was taken to avoidedema and blood vessels by comparison withT2-weighted images at the corresponding slice positions.All ROIs were drawn by a technician and subsequentlychecked and corrected if needed by an MRI-physicist withexperience in image postprocessing and an experiencedneuroradiologist.
In addition, ROIs representing a substantial part of thetumor for histogram analyses were drawn over three sliceson rCBF maps. All ROIs was copied to rCBV images.
The size of the ROIs varied from 0.25–1.19 cm2 for thesmall ROIs and from 3.3–86 cm2 for the large ROIs usedfor histogram analyses. For the histogram analyses, slicesthrough the central largest portion of the tumor werechosen to minimize partial volume effects. Postoperativecavities were avoided, whereas central necrosis wasincluded as a part of the large ROI for the histogram ana-lyses when they were present on the slices with the mostsubstantial part of the tumor. This method was chosen tokeep the methodology of the histogram ROI drawing assimple and operator independent as possible (Fig. 1).Patients with small residual tumors after treatment (lessthan 3 cm2) were not included in the histogram analyses.In low grade gliomas, small ROIs were defined by theexperienced radiologist according to the most prominenttumor signal on CBF images, whereas the large ROIs weredrawn according to morphological MR images.
The perfusion values of normal appearing white matterand cerebellum were used to obtain normalized maximumrCBF and rCBV calculated as ratios of mean perfusionvalues in tumor ROI with maximum perfusion to meanvalues in reference regions.
Histograms were normalized to the total number of pixelsin the ROIs and to the mean values in reference regions; the
96 H Thomsen et al.. . . . . . . . . . . . . . . . . . . . . . . . . . . . . . . . . . . . . . . . . . . . . . . . . . . . . . . . . . . . . . . . . . . . . . . . . . . . . . . . . . . . . . . . . . . . . . . . . . . . . . . . . . . . . . . . . . . . . . . . . . . . . . . . . . . . . . . . . . . . . . . . .

number of histogram bins was 108 as proposed by Emblemet al. (7). The following histogram metrics were used for ana-lyses: mean, median, standard deviation (SD), peak position(PP), peak height (PH), skewness, and kurtosis.
Statistical analysis
The analysis of results obtained with the maximum per-fusion ROI approach included descriptive statistics, logar-ithmic transformation of data in cases of non-normaldistribution, and one-way analysis of variance ANOVA.Stratification into groups of untreated and treated tumorsand correlation analysis for CBF and CBV measurementswere made to compare the influence of the choice of refer-ence region on results assessed by maximum perfusionROI approach and the histogram method.
Results
The histopathological diagnoses of the majority of the 61gliomas investigated in our study were glioblastomas (n¼38), diffuse astrocytomas (n¼ 8), and anaplastic astrocytomas(n ¼ 8). Oligodendrogliomas, anaplastic oligodendrogliomas,and gangliogliomas were the smallest groups, the number of
tumors being n¼ 4, n ¼ 2, and n¼ 1, respectively. Tumortypes, WHO grades, number of patients, mean age of patients,rCBF, and rCBV values calculated with white matter tissueand cerebellum tissue as reference are summarized in Table 1.
Table 1 shows higher perfusion values for glioblastomathan for diffuse and anaplastic astrocytomas.
The results of comparison of median perfusion values fordiffuse astrocytoma, anaplastic astrocytoma, and glioblas-toma are shown in Table 2.
The stratified analysis of untreated and treated tumorgroups did not show any statistically significant differencein perfusion values between these tumor groups; however,Table 2 shows lower values of rCBF and rCBV for tumorsundergoing treatment.
Figs. 2 and 3 illustrate the correlation between rCBF andrCBV measurements in the maximum enhancement per-fusion tumor region for both reference ROIs in whitematter and cerebellum (Pearson correlation coefficient r ¼0.60 and r ¼ 0.49, respectively).
Mean values for histogram metrics for rCBF and rCBVmeasurements in tumor regions normalized to cerebellumand white matter for all tumors included in our study arepresented in Table 3. Pearson correlation coefficientsfor comparison between rCBF and rCBV measurementswith different normalization regions are shown in Table 4.
Fig. 1 Example of the ROI placement on rCBF and rCBV maps together with T1-weighted post-contrast images for tumor delineation. The upper row depicts ROI
placed in a region with maximum rCBF; the second row includes an example of the larger ROI drawing used for histogram analyses placed on rCBF images and
reference ROIs for the cerebellum. The last row presents choice of the ROI for the reference regions
Perfusion MRI (dynamic susceptibility contrast imaging) with different measurement approaches 97. . . . . . . . . . . . . . . . . . . . . . . . . . . . . . . . . . . . . . . . . . . . . . . . . . . . . . . . . . . . . . . . . . . . . . . . . . . . . . . . . . . . . . . . . . . . . . . . . . . . . . . . . . . . . . . . . . . . . . . . . . . . . . . . . . . . . . . . . . . . . . . . .
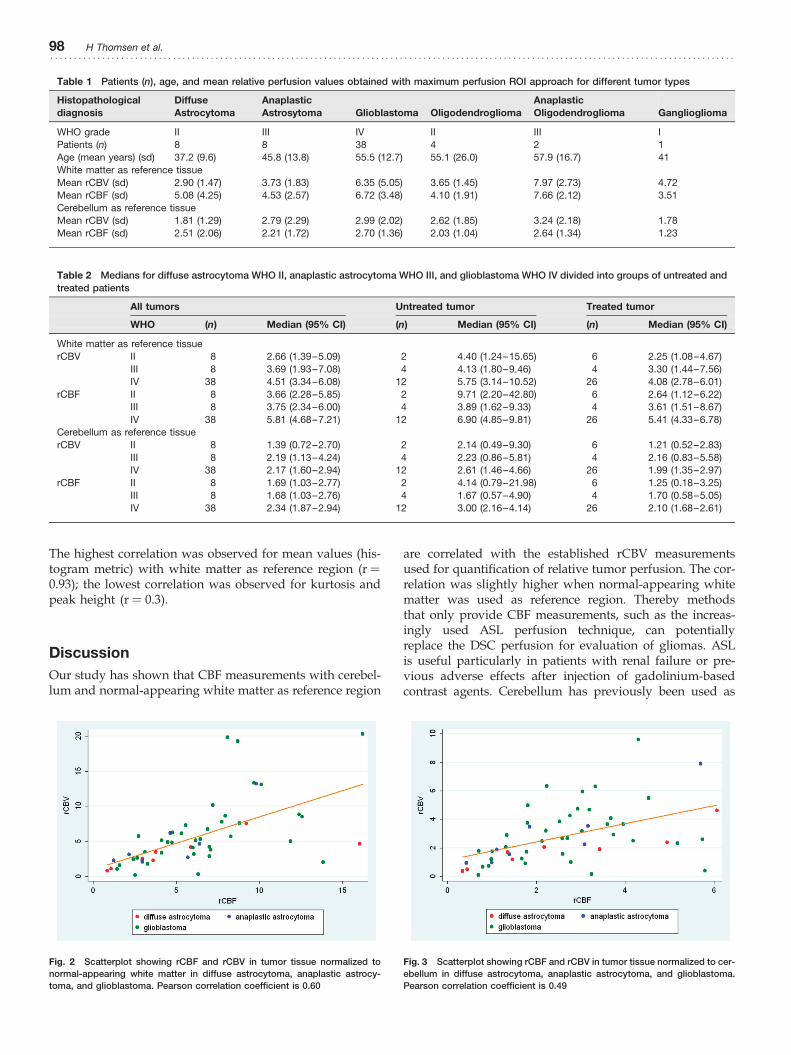
The highest correlation was observed for mean values (his-togram metric) with white matter as reference region (r ¼0.93); the lowest correlation was observed for kurtosis andpeak height (r ¼ 0.3).
Discussion
Our study has shown that CBF measurements with cerebel-lum and normal-appearing white matter as reference region
are correlated with the established rCBV measurementsused for quantification of relative tumor perfusion. The cor-relation was slightly higher when normal-appearing whitematter was used as reference region. Thereby methodsthat only provide CBF measurements, such as the increas-ingly used ASL perfusion technique, can potentiallyreplace the DSC perfusion for evaluation of gliomas. ASLis useful particularly in patients with renal failure or pre-vious adverse effects after injection of gadolinium-basedcontrast agents. Cerebellum has previously been used as
Table 1 Patients (n), age, and mean relative perfusion values obtained with maximum perfusion ROI approach for different tumor types
Histopathological
diagnosis
Diffuse
Astrocytoma
Anaplastic
Astrosytoma Glioblastoma Oligodendroglioma
Anaplastic
Oligodendroglioma Ganglioglioma
WHO grade II III IV II III I
Patients (n) 8 8 38 4 2 1
Age (mean years) (sd) 37.2 (9.6) 45.8 (13.8) 55.5 (12.7) 55.1 (26.0) 57.9 (16.7) 41
White matter as reference tissue
Mean rCBV (sd) 2.90 (1.47) 3.73 (1.83) 6.35 (5.05) 3.65 (1.45) 7.97 (2.73) 4.72
Mean rCBF (sd) 5.08 (4.25) 4.53 (2.57) 6.72 (3.48) 4.10 (1.91) 7.66 (2.12) 3.51
Cerebellum as reference tissue
Mean rCBV (sd) 1.81 (1.29) 2.79 (2.29) 2.99 (2.02) 2.62 (1.85) 3.24 (2.18) 1.78
Mean rCBF (sd) 2.51 (2.06) 2.21 (1.72) 2.70 (1.36) 2.03 (1.04) 2.64 (1.34) 1.23
Table 2 Medians for diffuse astrocytoma WHO II, anaplastic astrocytoma WHO III, and glioblastoma WHO IV divided into groups of untreated andtreated patients
All tumors Untreated tumor Treated tumor
WHO (n) Median (95% CI) (n) Median (95% CI) (n) Median (95% CI)
White matter as reference tissue
rCBV II 8 2.66 (1.39–5.09) 2 4.40 (1.24–15.65) 6 2.25 (1.08–4.67)
III 8 3.69 (1.93–7.08) 4 4.13 (1.80–9.46) 4 3.30 (1.44–7.56)
IV 38 4.51 (3.34–6.08) 12 5.75 (3.14–10.52) 26 4.08 (2.78–6.01)
rCBF II 8 3.66 (2.28–5.85) 2 9.71 (2.20–42.80) 6 2.64 (1.12–6.22)
III 8 3.75 (2.34–6.00) 4 3.89 (1.62–9.33) 4 3.61 (1.51–8.67)
IV 38 5.81 (4.68–7.21) 12 6.90 (4.85–9.81) 26 5.41 (4.33–6.78)
Cerebellum as reference tissue
rCBV II 8 1.39 (0.72–2.70) 2 2.14 (0.49–9.30) 6 1.21 (0.52–2.83)
III 8 2.19 (1.13–4.24) 4 2.23 (0.86–5.81) 4 2.16 (0.83–5.58)
IV 38 2.17 (1.60–2.94) 12 2.61 (1.46–4.66) 26 1.99 (1.35–2.97)
rCBF II 8 1.69 (1.03–2.77) 2 4.14 (0.79–21.98) 6 1.25 (0.18–3.25)
III 8 1.68 (1.03–2.76) 4 1.67 (0.57–4.90) 4 1.70 (0.58–5.05)
IV 38 2.34 (1.87–2.94) 12 3.00 (2.16–4.14) 26 2.10 (1.68–2.61)
Fig. 2 Scatterplot showing rCBF and rCBV in tumor tissue normalized to
normal-appearing white matter in diffuse astrocytoma, anaplastic astrocy-
toma, and glioblastoma. Pearson correlation coefficient is 0.60
Fig. 3 Scatterplot showing rCBF and rCBV in tumor tissue normalized to cer-
ebellum in diffuse astrocytoma, anaplastic astrocytoma, and glioblastoma.
Pearson correlation coefficient is 0.49
98 H Thomsen et al.. . . . . . . . . . . . . . . . . . . . . . . . . . . . . . . . . . . . . . . . . . . . . . . . . . . . . . . . . . . . . . . . . . . . . . . . . . . . . . . . . . . . . . . . . . . . . . . . . . . . . . . . . . . . . . . . . . . . . . . . . . . . . . . . . . . . . . . . . . . . . . . . .

reference region in a few studies (11, 12) when comparingCBF measurement assessed by different techniques.
We did not find statistically significant differencesbetween the perfusion parameters for the different tumortypes: diffuse astrocytoma, anaplastic astrocytoma, andglioblastoma. A comprehensive review of studies performedduring the last 5 years showed that some studies found astatistically significant difference between tumor groups(2–4, 17, 18), and others did not (8, 19). The results of ourstudy are in accordance with the theory of tumors: tumordevelopment and angiogenesis showing increasing per-fusion of tumor tissue with higher tumor grade (20–23).Table 2 shows that there is a trend towards increasingvalues for glioblastoma (WHO IV) in comparison withdiffuse astrocytoma (WHO II), which is in agreement withother studies (18, 24). As seen from Table 5, severalstudies report higher values of rCBV in gliomas of highgrade than gliomas of low grade (2–4, 17, 18, 24–27).
Normalized rCBV values in our study are in agreementwith the values found in the literature (Tables 3 and 5).The stratified analysis of patients groups with untreatedand treated tumors did not show any statistically significantdifference between the two strata with our ROI methods.However, in general, lower median values were observedfor rCBF and rCBV in the group with treated tumors.
It can be seen from Fig. 2 that for the majority of tumorshigher values of rCBF corresponded to higher values ofrCBV for calculations performed using both referenceregions. The Pearson correlation coefficient was r ¼ 0.60 inthe case of normalization to white matter and r ¼ 0.49when the cerebellum was used. The lower correlation coef-ficients observed in our study in comparison with r ¼ 0.65in Jarnum et al. (12) and r ¼ 0.75 in Senturk et al. (28) canbe explained by a more homogeneous tumor populationin our study. We did not observe extremely high valuesfor normalized perfusion using cerebellum as referenceregion. From our experience and taking into account the dis-cussion above, it is difficult to recommend one of the inves-tigated reference regions; both white matter and cerebellum
can be used for relative measurements of perfusion valuesin cerebral gliomas. However, the white matter perfusionmay potentially more often be affected by, for example, radi-ation therapy and tumor invasion than the cerebellum. Insome of the patients, we have observed abnormally lowvalues in the white matter compared with the rest of thepatients resulting in higher rCBF values.
The maximum perfusion ROI approach has been reported tohave an ability to differentiate between different tumor types(2–4), but it also has been reported to suffer from observerbias (7). To increase reproducibility of the measurements, pla-cement of up to four ROIs in different parts of the tumor hasbeen proposed (5, 6). In our study, we have instead usedthree experts with technical, image postprocessing, and neu-roradiological skills to agree on maximum perfusion tumorregion on perfusion images to verify our ROI measurements.
The histogram analysis method has been found to be lessobserver-dependent (5, 7), and we have used 108 bins forROI histogram visualization and analyses, as recommendedby Emblem et al. (7). Histogram metrics (mean, median, SD,and PP) were calculated for histograms normalized to bothwhite matter and cerebellum. As skewness, PH, and kurto-sis do not depend on choice of reference region, these par-ameters were calculated with only normalization to thetotal number of pixels.
The mean values for histogram metrics obtained in ourstudy are comparable with calculations performed byother groups. Emblem et al. (7) gives PH values from0.07–0.16 for high and low-grade gliomas, respectively;another study (29) shows values from 0.024–0.12, which isin good agreement with a PH of about 0.08 (Table 3) inour study. The mean values for median, mean, SD, andPP, as well as skewness, kurtosis, and PH can be found in,for example, Law et al. (5). While there is a good correspon-dence between median (from 1.14+ 0.49 to 2.72 +0.68,depending on tumor grade (5) versus 2.38+ 1.63 in ourstudy), mean (from 1.24+ 0.47 to 2.83+ 0.68 (5) and2.55+ 1.74 in our study), SD values (from 0.49+ 0.32 to2.32+ 0.29 and 3.34+ 1.75 in our study), and PP (from
Table 3 Mean values and standard deviations in parentheses of histogram metrics for CBF and CBV analyses for all tumors in the study
Median Mean SD Peak position Peak height� Skewness� Kurtosis�
Mean values (SD) of histogram metrics for CBF analyses in tumour with different reference regions
White matter as reference region 2.38 (1.63) 3.00 (1.81) 2.55 (1.74) 1.61 (1.33) 0.08 (0.04) 2.18 (0.95) 5.06 (5.65)
Cerebellum as reference region 0.93 (0.52) 1.17 (0.57) 0.99 (0.50) 0.65 (0.54)
Mean values (SD) of histogram metrics for CBV analyses in tumor with different reference regions
White matter as reference region 2.58 (1.93) 3.21 (2.14) 2.68 (1.58) 1.62 (1.73) 0.08 (0.03) 2.09 (0.84) 4.44 (4.35)
Cerebellum as reference region 1.22 (0.72) 1.54 (0.80) 1.31 (0.70) 0.79 (0.76)
Table 4 Pearson correlation coefficients for different histogram metrics for CBF and CBV analyses for all tumors presented in the study
Median Mean SD Peak position Peak height� Skewness� Kurtosis�
Pearson correlation coefficients for rCBF versus rCBV
White matter as reference region 0.91 0.93 0.88 0.76 0.30 0.43 0.3
Cerebellum as reference region 0.80 0.76 0.69 0.72
Pearson correlation coefficients for white matter versus cerebellum reference region
rCBF 0.82 0.79 0.80 0.90 NC NC NC
rCBV 0.80 0.76 0.73 0.90 NC NC NC
�Calculation performed for histograms without normalization to reference region
NC ¼ not calculated
Perfusion MRI (dynamic susceptibility contrast imaging) with different measurement approaches 99. . . . . . . . . . . . . . . . . . . . . . . . . . . . . . . . . . . . . . . . . . . . . . . . . . . . . . . . . . . . . . . . . . . . . . . . . . . . . . . . . . . . . . . . . . . . . . . . . . . . . . . . . . . . . . . . . . . . . . . . . . . . . . . . . . . . . . . . . . . . . . . . .

1.10+ 0.61 to 3.34+ 1.75 and 1.61+ 1.33 in our study), theremaining histogram metrics are difficult to compare due tothe different number of histogram bins used.
Due to a good correlation for rCBF and rCBV histogrammetrics calculated with different reference regions (correlationcoefficients 0.73 � r � 0.90, Table 4), we suggest that bothreference ROIs can be used for histogram analyses of braintumors. Low correlations for kurtosis, skewness, and PH par-ameters comparing unnormalized rCBF and rCBV measure-ments reflect the fact that rCBF and rCBV distributions intumor have different shapes (Figs. 4 and 5). However, thetypical differences in histogram shapes for CBV for differenttumor types (5) are accompanied by differences in shapes forCBF measurements. Potentially, rCBF could be used in thesame manner as rCBV to train radiologist to recognize histo-gram shape patterns for different tumors (7).
The main limitation of our study is the relatively smallnumber of samples, which contributes to the statistical
uncertainty and could be the reason for the statistically non-significant results. This presumption is supported by thesample size calculation. Table 5 shows rCBV measurementsin four studies with calculated weighted common estimatesused for sample size calculations.
Although DSC-MRI is in widespread clinical use, tumorstudies with this technique often include a relatively smallnumber of patients, from 10 to up to 92 patients (3, 5).Our study is based on clinical data collected during 2years at our hospital. Since gliomas have a relatively lowincidence (20), the number of patients was relatively small.The sample size calculations for this study estimatedsample sizes between 20 and 75, and only the glioblastomagroup met this requirement. To obtain a reasonable samplesize, we have included both untreated and treated patientsin our study. The sample size and inclusion of bothtreated and untreated patients was also the main reasonfor not performing statistical analyses for histograms
Table 5 rCBV measurements in four studies with calculated weighted common estimates
Reference/
study n�rCBV
estimate� sd� se† w‡ Estimate�w
Common estimate§
(95% CI)
sdf common
estimate��sef common
estimate††
Gliomas of
low grade
Hakyemez
et al. (4)
11 1.69 0.51 0.15 42.29 71.47 1.36 (1.23–1.49) 0.86 0.07
Fan et al. (26) 7 1.09 0.26 0.10 103.55 112.87
Law et al. (5) 31 1.51 0.64 0.11 75.68 114.28
Costanzo
et al. (2)
11 2.00 1.50 0.45 4.89 9.78
Gliomas of
high grade
Hakyemez
et al. (4)
26 5.76 3.35 0.66 2.32 13.34 4.54 (4.17–4.9) 2.27 0.19
Fan et al. (26) 8 3.27 1.54 0.54 3.37 11.03
Law et al. (5) 31 5.54 2.37 0.43 5.52 30.58
Costanzo
et al. (2)
25 4.30 1.20 0.24 17.36 74.65
�Given estimate from reference/study†se ¼ sd/
pn
‡w ¼ 1/se2
§Common estimate ¼P
(Estimatei� wi)/
P(wi)
��sdf ¼p
((sd12 þ sd2
2 þ sd32 þ sd4
2)/4)††sef ¼ 1/
pw1 þ w2 þ w3 þ w4
Fig. 4 Example of CBV distribution for glioblastoma (in yellow) and anaplas-
tic astrocytoma (in blue). CBV values are normalized to cerebellum
Fig. 5 Example of CBF distribution for glioblastoma (in yellow) and anaplas-
tic astrocytoma (in blue). CBF values for the same patients as in Fig.4 normal-
ized to cerebellum
100 H Thomsen et al.. . . . . . . . . . . . . . . . . . . . . . . . . . . . . . . . . . . . . . . . . . . . . . . . . . . . . . . . . . . . . . . . . . . . . . . . . . . . . . . . . . . . . . . . . . . . . . . . . . . . . . . . . . . . . . . . . . . . . . . . . . . . . . . . . . . . . . . . . . . . . . . . .

metrics and no attempts to provide classification based onvisual inspection of histograms.
Another limitation is the fact that our patients had beenexamined at two different field strengths. Field strengthaffects tissue characteristics and image quality. Improvedquality of the calculated parametric perfusion maps maybe seen at higher field strength due to higher signal-to-noiseratio. However, as we compared patients on the individualbasis and used normalized values of CBF and CBV wecould disregard the impact of this factor compared, forexample, to inclusion of both treated and untreatedpatient in the study.
In conclusion, rCBF values may be used as an alternativeto rCBV values for MRI evaluation of perfusion in gliomas.Comparison of the results obtained with cerebellum andwhite matter as reference regions shows that the cerebellumcan be used as a valid reference region for the calculation ofrelative perfusion values.
Conflict of interest: None.
REFERENCES
1 Lacerda S, Law M. Magnetic resonance perfusion and permeabilityimaging in brain tumors. Neuroimaging Clin N Am 2009;19:527–57
2 Di Costanzo A, Pollice S, Trojsi F, et al. Role of perfusion-weightedimaging at 3 Tesla in the assessment of malignancy of cerebral gliomas.Radiol Med (Torino) 2008;113:134–43
3 Rollin N, Guyotat J, Streichenberger N, et al. Clinical relevance ofdiffusion and perfusion magnetic resonance imaging in assessingintra-axial brain tumors. Neuroradiology 2006;48:150–9
4 Hakyemez B, Erdogan C, Bolca N, et al. Evaluation of different cerebralmass lesions by perfusion-weighted MR imaging. J Magn Reson Imaging2006;24:817–24
5 Law M, Young R, Babb J, et al. Histogram analysis versus region of interestanalysis of dynamic susceptibility contrast perfusion MR imaging data inthe grading of cerebral gliomas. Am J Neuroradiol 2007;28:761–6
6 Young R, Babb J, Law M, et al. Comparison of region-of-interest analysiswith three different histogram analysis methods in the determination ofperfusion metrics in patients with brain gliomas. J Magn Reson Imaging2007;26:1053–63
7 Emblem KE, Nedregaard B, Nome T, et al. Glioma grading by usinghistogram analysis of blood volume heterogeneity from MR-derivedcerebral blood volume maps. Radiology 2008;247:808–17
8 Jenkinson MD, Smith TS, Joyce KA, et al. Cerebral blood volume,genotype and chemosensitivity in oligodendroglial tumours.Neuroradiology 2006;48:703–13
9 Zhang H, Rodiger LA, Shen T, et al. Preoperative subtyping ofmeningiomas by perfusion MR imaging. Neuroradiology 2008;50:835–40
10 Carvalho PA, Schwartz RB, Alexander E 3rd, et al. Detection of recurrentgliomas with quantitative thallium-201/technetium-99m HMPAOsingle-photon emission computerized tomography. J Neurosurg1992;77:565–70
11 Arbab AS, Aoki S, Toyama K, et al. Brain perfusion measured byflow-sensitive alternating inversion recovery (FAIR) and dynamicsusceptibility contrast-enhanced magnetic resonance imaging:comparison with nuclear medicine technique. Eur Radiol 2001;11:635–41
12 Jarnum H, Steffensen EG, Knutsson L, et al. Perfusion MRI of braintumours: a comparative study of pseudo-continuous arterial spinlabeling and dynamic susceptibility contrast imaging. Neuroradiology2010;52:307–17
13 Ostergaard L, Weisskoff RM, Chesler DA, et al. High resolutionmeasurement of cerebral blood flow using intravascular tracer boluspassages. Part I: Mathematical approach and statistical analysis. MagnReson Med 1996;36:715–25
14 Rosen BR, Belliveau JW, Vevea JM, et al. Perfusion imaging with NMRcontrast agents. Magn Reson Med 1990;14:249–65
15 Wu O, Ostergaard L, Sorensen AG. Technical aspects ofperfusion-weighted imaging. Neuroimaging Clin N Am2005;15:623–37, xi
16 Boxerman JL, Schmainda KM, Weisskoff RM. Relative cerebral bloodvolume maps corrected for contrast agent extravasation significantlycorrelate with glioma tumor grade, whereas uncorrected maps do not.Am J Neuroradiol 2006;27:859–67
17 Cha S, Tihan T, Crawford F, et al. Differentiation of low-gradeoligodendrogliomas from low-grade astrocytomas by using quantitativeblood-volume measurements derived from dynamic susceptibilitycontrast-enhanced MR imaging. Am J Neuroradiol 2005;26:266–73
18 Hakyemez B, Erdogan C, Ercan I, et al. High-grade and low-gradegliomas: differentiation by using perfusion MR imaging. Clin Radiol2005;60:493–502
19 Fayed N, Davila J, Medrano J, et al. Malignancy assessment of braintumours with magnetic resonance spectroscopy and dynamicsusceptibility contrast MRI. Eur J Radiol 2008;67:427–33
20 Louis DN, Ohgaki H, Wiestler OD, et al. WHO Classification of the CentralNervous System. 4th edn. Lyon: International Agency for Research onCancer (IARC), 2007
21 Folkman J. Angiogenesis. Annu Rev Med 2006;57:1–1822 Naumov GN, Akslen LA, Folkman J. Role of angiogenesis in human
tumor dormancy: animal models of the angiogenic switch. Cell Cycle2006;5:1779–87
23 Folkman J. Fundamental concepts of the angiogenic process. Curr MolMed 2003;3:643–51
24 Cho SK, Na DG, Ryoo JW, et al. Perfusion MR imaging: clinical utility forthe differential diagnosis of various brain tumors. Korean J Radiol 2002;3:171–9
25 Shin JH, Lee HK, Kwun BD, et al. Using relative cerebral blood flow andvolume to evaluate the histopathologic grade of cerebral gliomas:preliminary results. Am J Roentgenol 2002;179:783–9
26 Knopp EA, Cha S, Johnson G, et al. Glial neoplasms: dynamic contrast-enhanced T2�-weighted MR imaging. Radiology 1999;211:791–8
27 Aronen HJ, Gazit IE, Louis DN, et al. Cerebral blood volume maps ofgliomas: comparison with tumor grade and histologic findings. Radiology1994;191:41–51
28 Senturk S, Oguz KK, Cila A. Dynamic contrast-enhancedsusceptibility-weighted perfusion imaging of intracranial tumors: astudy using a 3T MR scanner. Diagn Interv Radiol 2009;15:3–12
29 Emblem KE, Scheie D, Due-Tonnessen P, et al. Histogram analysis of MRimaging-derived cerebral blood volume maps: combined glioma gradingand identification of low-grade oligodendroglial subtypes. Am JNeuroradiol 2008;29:1664–70
Perfusion MRI (dynamic susceptibility contrast imaging) with different measurement approaches 101. . . . . . . . . . . . . . . . . . . . . . . . . . . . . . . . . . . . . . . . . . . . . . . . . . . . . . . . . . . . . . . . . . . . . . . . . . . . . . . . . . . . . . . . . . . . . . . . . . . . . . . . . . . . . . . . . . . . . . . . . . . . . . . . . . . . . . . . . . . . . . . . .