![ITRS 2001 Renewal - Work in Progress - Do Not Publish 1 [Per IRC Approved Proposals 3/27/01, Scenario 2.0/3.7] ITRS IRC/ITWG Meeting ORTC Proposal Review.](https://static.fdocuments.us/doc/165x107/55149715550346f06e8b5550/itrs-2001-renewal-work-in-progress-do-not-publish-1-per-irc-approved-proposals-32701-scenario-2037-itrs-ircitwg-meeting-ortc-proposal-review.jpg)
Dams - IRC · possible to carry out on-site studies and publish this report. ... Conclusion Chapter...
66
217 85 AF flr. *K-iilBii4i Dams € Environ sss ^m* m <~? il -t-'—m^ifSNf^i': wfi :& by Henri Roggeri A case study of five man-made lakes in Eastern Africa j?^-6>sfVF-2!sk
Transcript of Dams - IRC · possible to carry out on-site studies and publish this report. ... Conclusion Chapter...

217
85 AF
flr.
*K-iilBii4i
Dams € Environ
sss
^m* m
<~? il -t-'—m^ifSNf^i':
wfi
:&
by Henri Roggeri
A case study of five man-made lakes in Eastern Africa j?^-6>sfVF-2!sk

"It is realised that economic development can hardly be achieved without disruption of the environment, but such development should aim at minimizing the harmful effects upon the environment itself, upon public health and the welfare of mankind".
— Antoon de Vos "Africa, the Devastated Continent?"
(Dr. W. Junk bv Publishers, The Hague — 1975)
ELC, 1985
Front cover: picture courtesy of United Nations

i
African Dams Impacts in the Environment
The Social and Environmental Impact of Dams at the Local Level:
A case study of five man-made lakes in Eastern Africa
,-' i by Henri ROGGERI
.**- 56AF
Environment Liaison Centre

ACKNOWLEDGEMENTS First of all I wish to thank the Ford Foundation whose financial assistance made it
possible to carry out on-site studies and publish this report. My most sincere thanks also go to Mr. Joseph N. Gitonga of the Department of Civil
Engineering, University of Nairobi, whose contribution as a consultant to research activities carried out in the field and to'the internal report submitted to ELC upon completion of our study missions, was indeed remarkable.
I finally wish to thank all those who, from near and far, contributed to the realisation of this study by giving generously of their valuablctime, and in particular:
Dr. Liberty Mhlanga of the Agricultural and Rural Development Authority (ARDA) for the excellent planning of our visit to Zimbabwe;
Mr.s. G.A. Mwango, Office of the President (Kenya) Mr. P. Bradbury, Regional Water Authority (Zimbabwe) Mr. Reid, Ministry of Natural Resources (Zimbabwe) Mr. C. Harrison, Ministry of Water Resources (Zimbabwe) The Tana River Development Authority (Kenya) The Fisheries Department, Embu District (Kenya) The Medical Officer of Health, Embu District Hospital (Kenya) The Blair Research Institute (Zimbabwe) The Staff of the Kenyan and Zimbabwean dispensaries Mr. D. Bull, Environment Liaison Centre (ELC) Mr. S. Muchiru, Environment Liaison Centre (ELC) The ELC's staff members

TABLE OF CONTENTS Page
Foreword 5 Introduction 7 Objectives, Methodology and Parameters of the Study 10
Chapter I — BRIEF INTRODUCTION TO THE LAKES STUDIED 15 1. Kenya 2. Zimbabwe
Chapter II — IMPACT ON THE DISPLACEMENT OF POPULATION . . 20 1. Kenya: relatively lew persons displaced but differing fortunes 2. Zimbabwe: the consequences of the Rhodesian policy 3. Conclusion
Chapter III — IMPACT ON DRINKING WATER SUPPLY AND SANITATION 24
1. Lack of water supply networks for the local communities 2. Lake water: unsuitable for human consumption 3. Need for more sanitary installations 4. Conclusion
Chapter IV — IMPACT ON WATER-BORNE AND WATER-RELATED DISEASES 28
1. Preliminary observations 2. The Tana River lakes and environs (Kenya): considerable increase in the
incidence of water-borne and water-related diseases 3. Lake Kyle (Zimbabwe): possible increase in the incidence of malaria
4. Lake Mc Ilwaine (Zimbabwe): visitors to the recreational parks are enlightened individuals
5. Conclusion
Chapter V — IMPACT ON AGRICULTURE AND LOCAL FOOD RESOURCES 32
1. Kenya: Insignificant impact on food resources 2. Zimbabwe: no irrigation, but fishing is a food resource and a tourist
attraction 3. Conclusion
Chapter VI — IMPACT ON THE PRODUCTION AND USE OF HYDRO-ELECTRICITY AT THE LOCAL LEVEL 36
1. Electricity and local populations: a black-out on ideas? 2. Conclusion

Chapter VII — IMPACT ON PLANT COVER AND SEDIMENTATION . 39 1. Kenya: the situation worsens despite the Kamburu example 2. Zimbabwe: parks, plant cover and the nature of the soil limit erosion 3. Conclusion
Chapter VIII — COST/BENEFIT ANALYSIS 43
Chapter IX — PARTICIPATION OF NGOs and LOCAL COMMUNITIES 45
Conclusion 46 Recommendations 48 References 51 Appendices 53
i
\

FOREWORD
The Environment Liaison Centre's two major objectives in publishing this document arc, on the one hand to participate in the current debate on large dams and on the other hand, to increase the NGOs capacity to evaluate wafer management projects, so that they can direct the measures necessary for their improvement, if need be.
As a first contribution to this debate and through this case study of five man-made lakes in Eastern Africa*, the Environment Liaison Centre raises issues related to the social and environmental impacts of dams at the local level. This is to say that this study does not deal with the whole dams issue — for which upstream and downstream areas would have to be studied too — but concentrates on the neighbourhood of the lakes and on the local communities which live nearby.
Some NGOs have already intervened during the planning stages of unsatisfactory projects. This was the case, for example, with the Silent Valley dam in India. Under pressure from NGOs (e.g. Save Silent Valley Committee, Kerala Sastra Sahitya Parishad, etc.), Mrs Indira Gandhi appointed up to three consecutive committees which were given a mandate to assess the environmental impacts of the dam. The three committees recommended to drop the project while the NGOs carried on with their pressure activities to save the Kerala forest from destruction. Had Mrs Gandhi not been forced to ask the State Government to drop the project, this forest which acts as an extremely important plant barrier protecting the downstream section of the Silent Valley from successive droughts and floods occuring upstream, would have been destroyed.
But, despite the increasing interest which NGOs are showing in problems caused by large dams — an interest which is particularly dear to organisations in ELC's constituency — they are not all able to evaluate a water management project and this is often due to lack of information and data.
LLC hopes that this report will be considered as initial information which will enable NGOs to enter info dialogue with the relevant authorities as well as donor agencies whenever they become aware of a project whose effects on'the environment or the local communities appear unsatisfactory.
The two objectives mentioned above correspond with the ELC's triennial programme (1985-1988) in which water resources management plays an important role among other major themes, such as the fight against desertification, reaforestation, sustainable agriculture and renewable energy.
The water resources management programme was designed in such a way as to allow for the improvement of the flow of information between North and South, to build up networks for cooperation, to facilitate exchanges between NGOs, researchers and donor agencies and finally, to increase the capacity of NGOs in implementing their projects more efficiently.
This report was written in a manner which will make it possible, not only for NGOs working in the area of management and conservation of natural resources, but also all those for whom the subject is unfamiliar, to gain from the information gathered during the study.
"Tor the purposes of this study. Eastern Africa is composed of the following countries-Burundi, Kenya, Malawi, Mozambique, Rwanda. Tanzania, Uganda, Zambia and Zimbabwe.
5

The methods used, questions asked and issues raised in this study will, it is hoped, provide ideas and approaches useful to other NGOs in the assessment of actual or proposed large dams projects.
NGOs may also be assisted in devising and putting forward constructive and realistic recommendations for alleviating pptential adverse social and environmental impacts.
6
/

INTRODUCTION
Over the last few decades, the number of dams has continued to increase beyond all expectations and in 1984, the number of dams throughout the world reached 16,000 (1). It is likely that by the end of the 80s, about 50 large dams* will have been completed, 33 of them in developing countries (2); and by 1990, "super d a m s " measuring more than 150 metres high will have reached a total of 113 (3).
In our study, the "super d a m s " are only used as examples showing some adverse effects of large reservoirs on the environment. ELC chooses to focus on medium sized man-made lakes (meeting the definition of a large dam by ICOLD*) which are likely to be built in large numbers during the coming years.
The reasons for such fascination with the large man-made lakes thus created are"^~ evident: the use of the water reservoirs is intended to solve a number of problems. A dam is often considered an accomplishment which generates significant economic and social gains through the production of clean and cheap electricity, the control of flooding in regions situated downstream of the dam, drinking water supply and the increase of agricultural land through irrigation. In this context, a dam can be an integral part of a country's programme to fight against hunger, against energy or food dependency. Moreover, it should be borne in mind that such projects are often a modern symbol of power, wealth and high technology.
In recent years, experience has shown, however, that big dams often create, viewed in retrospect, more problems than they solve in the short or medium term. A great deal of criticism has been made pointing out the negative impact dams have on the global environment and questioning the economic interest of such projects. Goldsmith and Hildyard have this to say about the Aswan dam in Egypt (3):
"AH that we can hope for is the ruins of that dam may serve a salutary function as a permanent monument of the folly, or of the cynicism, of those who now direct the organisations which have financed so much destruction and so much misery throughout the world, a monument set in a vast muddy wasteland where once the fertile soil nourished happy and sustainable communities".
And yet, according to President Hosni Mubarak "the High Dam has proved throughout the years that it has carried out its role in protecting Egypt against drought" . Commenting this statement, J. Smolowe and E.O. Colton write: "While much of Africa is parched and starving, Egypt is weathering the continent's six-year drought without trauma. Although the level of the rain-fed Nile River is now at a record low, Egyptians
"According to the International Commission on Large Dams (ICOLD), any dam over 15 metres high —from the lowest point of the construction to the highest — is a large dam. So is an v dam which is between 10 and 15 metres high and which meets any one of the following conditions:
a) a crest of at least 500 metres in length; h) capacity of the reservoir being at least 1,000.000 cubic metres c) ability of the reservoir to support a rate flow of at least 2,000 cubic metres per second d) special problems in construction: e) unusual design (5).
i

/
M a " '•• location
S C A L £
"8000 000 mapfor «"/**«/„
APprox
Kenya

still bring in three harvests annually — two more than in other northeast African nations" (4).
Perhaps, then, we should hope that the Aswan dam serve not as a monument, but as an example and reminder to those who design projects, to the governments of developing countries and donor agencies, of all the mistakes to be avoided in future, and of all the negative effects of dams which should be minimised at all cost: displacement of persons, deforestation, erosion and sedimentation, increase of water-borne and water-related diseases, to mention only a few.
Developing countries, and Africa in particular, have considerable need for water. Because of the man-made lake it creates, a dam can in part meet this need while providing the opportunity to generate electricity, as long as the project is planned and managed properly. If environmental considerations are not taken fully into account, not only will people suffer unnecessarily, but the investment made in the dam may never be repaid.
The five case studies in this report deal with five man-made lakes in tropical and subtropical Eastern Africa — three lakes in Kenya and two in Zimbabwe (cf. maps 1 and 2). They concentrate on the social and environmental impacts of each dam on the small area surrounding it. These effects are detailed below in the paragraph headed "Objectives of the study" and each constitutes a chapter of the report which itself concludes with some recommendations to NGOs which might be involved in water resources management projects and campaigns.
SCALE 16000000 Approx.
Map 2: Location map for the lakes in Zimbabwe
9

OBJECTIVES, METHODOLOGY AND PARAMETERS OF THE STUDY
Objectives
The purpose of this study was to make a preliminary analysis of dams in the context of water resources management. Taking into account the current information and data on dams which have been recalled in the ensuing chapters, we chose to study the effects caused by the lakes to the surrounding environment and the objective was to answer the following questions:
1. Under what conditions were the displaced persons (if any) resettled? 2. What were the consequences of the building of the dams with regard to drinking
water supply and sanitation? H
3. What effects have the man-made lakes had on water-borne and water-related diseases, and what steps have been taken to minimise the possible increase of these diseases?
4. What has the impact been on agriculture and food resources given the possibility for irrigation or the greater availability of water?
5. How much electricity is produced, how is it utilised and what are the consequences on its availability to the local communities?
6. What effects have the .dams had on the plant cover as well as the erosion and sedimentation phenomena in the areas where they are located?
7. What was the level of involvement of the NGOs and local communities in the preparation of the project?
In an attempt to respond to these questions, particular attention will begiven.asmuch as is possible, to the manner in which the costs and benefits were distributed in order to evaluate the effects of the dams on basic needs (water, food, energy) of the least fortunate communities.
Finally, this study has enabled the author to compile a list of the large dams which exist in the Eastern Africa region, those which are still being built and those yet to be built (cf. Appendix I).
Methodology
As is often the case with studies of this kind, this one was limited in its scope by the budget and the time assigned to ft. These constraints largely determine the methodology to be used for the study.
Most of the data was gathered during field trips (19-24 January 1985 in Kenya; 30 January — 8 February 1985 in Zimbabwe) made by a team of two individuals:
— Mr. Joseph N. Gitonga, who was engaged by the ELC as a consultant and is a civil engineer and specialist in water engineering;
— the author of the present report, who is a researcher with ELC's water resources management programme and an agricultural engineer specialised in the field of integrated development.
1. Selection of the lakes studied
Since the study was on the Eastern Africa region, the final selection was made as follows:
10

— the dams of the Tana River (Kenya) because lake Masinga is the largest man-made lake in East Africa* and the presence of 4 dams all within a space of 100 km is unusual; besides Masinga, the Kindaruma and Kamburu lakes were also selected so that consideration could be given to lakes of different sizes which are all intended for the production of electricity;
— a dam in Tanzania (Nym at lake Pangani) which would have made it possible to study an "isolated" (in contrast to the lakes visited in Kenya) man-made lake and to include in the study a variety of dams designed, built and operating under differing sociopolitical conditions. Unfortunately, the ELC was not able to obtain the authorisation necessary for carrying out the study in Tanzania,despitenumerous contactswith the relevant authorities in the country;
— two dams in Zimbabwe, in order to observe the effects of man-made lakes subject to climatic conditions which are different from those in Kenya and Tanzania and whose objective is to supply the city of Harare with water (lake Mac Ilwaine) and to irrigate agricutural land (lake Kyle). Consequently, only 5 lakes were visited out of the original six due to the failure to
ojtain authorisation from Tanzania.
2. Information gathering
For each of the locations on which this study is based, information was gathered according to the following procedures:
2.1 Field visits
a) observation of the lakes and their surroundings; b) surveys among the local communities using the "privileged subject" technique:
with this method, members of a community who, by their social standing, are key persons whose opinions can be considered as representative of the whole community, are interviewed. Generally speaking, they are normally village chiefs, teachers, dispensary nurses, traders, etc...
The "privileged subject" technique has two major advantages: — it makes it possible to obtain information about the local community in a rela
tively short time; — in most cases, it makes it possible to overcome the obstacles created by the
community's language. c) obtaining information concerning the number of pathological cases treated in the
hospitals and dispensaries of the study area in order to be able to judge the development of water-borne or water-related diseases;
d) sampling of the water in the lakes and chemical and bacteriological analysis of these samples: — for each lake, a grab sample was taken from a place which was deemed to be most
representative of the water used by the local communities; — the analyses were carried out
• in Kenya by the Public Health Engineering Laboratory, Department of
"East Africa is composed of Kenya, Tanzania and Uganda
11

Civil Engineering, University of Nairobi; • and in Zimbabwe by the Central Africa Standards Association's laboratory in
Harare.
2.2 Reports and other materials were consulted and discussions held with officers and technicians from government ministries, medical centres and other institutions.
Parameters of the study
First and foremost, it should be recalled that for the purposes of the study, only the lakes and their immediate surroundings were considered. The regions upstream and downstream of the lakes are not included except in cases where general observations were made for the sake of clarity. The following limitations should also be borne in mind in interpreting the results of this study:
1. Information on water-borne or water-related diseases
a) Records of the number of pathological cases treated in the Zimbabwean dispensaries as well as those of Masinga and Ekarakara in Kenya (cf. Map 3) are only available in the form of tables filled on a daily basis. Collecting data from such records would have entailed several weeks' work in the field, which was not possible given the time constraints. b) The staff in rural dispensaries are not doctors, they are nurses. These dispensaries do not have laboratories and hence, the detection of some diseases (eg. bilharzia) is extremely difficult. The information related to these diseases may well not be representative of the reality. c) In a great majority of cases, the information did not go back further than 1981 either because dispensaries have been recently built or because their records systems are still relatively new.
2. Interviews with the Privileged Subjects
The privileged subjects are supposed to inform the interviewer of the opinions of the majority of the communities from which they come. This technique requires some caution because:
— these subjects might not be in touch with the whole community, but in the case of small communities, the section which might not be represented is generally not quantitatively important;
— the subject mighf be tempted to give more importance to his'or her own opinion which might be quite different from that of the rest of the community; however, the surveys for the study concentrated on facts (where do they get water, electric power, etc.?) and therefore this possibility remains minimal.
3. Water samples ,
A single grab sample has the major inconvenience of not taking into account, in space and in time, the variations of the water's quality. Yet in a lake these variations can be quite significant depending on whether the samples are taken from the middle of the lake or from the banks, and taking into consideration other aspects such as currents, different depths and the wet and dry seasons (6).
12

Since the samples taken for the purposes of the study were intended to provide information on the quality of water used in the home, they came from the surface, near the banks and from points at which members of the local communities drew water for their use.
4. Field research team
The study was carried out by two people only, whereas a whole team ol experts would have been needed to cover in-depth such varied fields of competence as human health, water quality, hydrology, soil sciences, economics, sociology, etc.
Grab Sampling Credit: FLC/HK
I 13

^
o
f>
s^— _3 SABA SABA •
Q THIKA
QMURANO'A
/ • '
-z-
<r
•y
(
'/
r
1?
<~ y
"^
5
\
• • '
r"
\ M W E A J l R R I O A T I
s~ "N. ' . / / / • '
! ^ s « W A C H O R O + t
s.
tf
M
. V * , RIAKANAU +
> ^ . V 8 ^ x ~ W > c ^ ^ ^
V x • >
/-/
v /
0 5
2 { + EKARA
V̂
IQKm
GATEGI
(ARA
P>-
F 5 ^ r — - ^ M W E A
•GAME 7
JRESERVt ft 1 *
' •̂
KIRITIRl
V MACHAN&A
I / ^ ^ < T '
\*~\ f J
~ A \
' ^ \ ( K J K A M B U R U
, D MASINGA ^
*
-~- —
- — • —
+ Q
*-
0
I E 6 E N
•V.GITARU *~l
' ^ v * \j£t<A-J*L-
KINDARUMA
N
\
DISTRICT ADMIN. BOUNDARY
NATIONAL PARK
IRRIGATION SCHEME
HEALTH CENTRE/DISPENSARY
TOWN
APPROX SAMPLING POINT
r •" '
/
\
/ s
i
Map 3: Dams of the Tana River

I — BRIEF INTRODUCTION TO THE LAKES STUDIED
1. Kenya
In 1972, the total irrigated land surface in Kenya was less than 7 300 ha (7). By 1985 this figure has increased only to 10,000 ha distributed among seven irrigation projects (8).
A major part of the country's investments on the development of water resources has been spent in the Lower Tana River Basin area. The Tana River Basin covers over 100,000 km' (16% of the national territory) and the Tana River Development Authority envisages that by the year 2000 the river will irrigate 90,000ha, provide water for another 9 million people — 3 million alone from the city of Nairobi — and generate 800 MW of electricity.
This ambitious goal may well not be reached however, if due consideration is given to the projects which ha ve just been completed or to those which are still on-going. The Bura Irrigation Project (Tana River) is a good case in point. The first phase (which is to be completed in 1986) was supposed to make it possible to irrigate 6700 ha for an initial cost of US$90 million (1980). In 1982 the cost of the project was re-estimated at US$193.30 million — an increase of 115% in US$ (180% in Kenya Shilling) — and estimates of the irrigated land surface was only 3900 ha in 1983. These estimates were further reduced in 1985 (2900 ha) in order to maintain the construction costs of US$100 million although this decision hardly alleviated doubts as to when the project would be completed (9).
Bura is the fifth in a series of 10 irrigation and/or hydro-electric projects on the Tana River — including the Seven Forks hydro-electric complex of which the three man-made lakes visited in Kenya are a part (cf. Map 3).
1.1. Kamburu
This dam which became operational in 1975 created a mass of water of approximately 15km2 which is used exclusively by-its hydro-electric plant whose maximum production capacity is 94MW.
It has happened that during the driest periods the lake only covers an area of 2.2 km2
(10), thus causing serious problems for the plant. The Masinga dam was built upstream largely in order to insure that Kamburu has a regular water supply throughout the year (cf. paragraph 1.3).
The area surrounding the lakes is very sparsely populated and, despite the presence of-some small plots on which traditional crops and mainly maize have been planted, the terrain has evidently developed very little since the establishment of the lake. The Mwea game reserve is to the north-west of Kamburu dam, between the left bank of the Tana River and the right bank of the Thiba River.
1.2 Kindaruma
Kindaruma is the smallest of the lakes visited during this study; the dam, which was completed in 1968 and was intended for the production of hydro-electricity (maximum production capacity: 44 MW), has made it possible to create a reservoir of approximately 10km2.
Practically no-one lives around this lake; there is only a small village with traditional huts (mud walls and thatch roofs) at about 500 metres downstream from the dam and 300 metres from the Tana River.
15

On the banks the vegetation includes bushes which evidently existed well before the building of the dam. It is a little thicker than the growth around Kamburu.
1.3 Masinga >̂
Since it became operational in 1981, Masinga has been the largest man-made lake in East Africa (flood area: !20krrr) and will remain the largest until the completion of the Bura Irrigation Project.
But Masinga is not only large in size; its construction, financed by the European Economic Community (EEC), the Federal Republic of Germany, the United Kingdom and Kenya, required US$74 million. The maximum production capacity of its hydroelectric plant is only 40MW since the dam was intended mainly to be a water reserve to ensure constant supply to the Kamburu plant and to other irrigation projects to be built in future.
On the northern banks of the lake, the bush is interspersed with traditional dwellings of subsistence farmers (maize, sheep and goats). Throughout the whole of Embu district only one village, Riakanau, is situated on the banks of the dam and, like the other villages in the area, it was there already even before the dam was built.
The southern bank, which is in Machakos district, is quite different: because of the plains, it has been possible to develop maize cultivation on larger plots of land, particularly around Masinga village. The area is still sparsely populated though there are some concrete houses among the traditional dwellings which are the only kind of housing to be found on the northern banks and around the other lakes.
2. Zimbabwe _ '
In the Zimbabwean context, the word "dam" immediately calls to mind the.Kariba dam on the Zambezi. The lake is 277 km long and has a surface area of 5364 km-', shared between Zimbabwe and Zambia.
Kariba, the third largest man-made lake in Africa, was built in order to supply the Northern Rhodesian copper mines as well as the Southern Rhodesian towns and industries with electricity. Its construction also created serious problems, one of which was that 50,000 persons were moved to other areas where the pressure on agricultural land grew to such an extent that, for a period of several years, famine was rampant and the death rate among humans was high (II).
Nowadays, Kariba is the only dam intended for the production of hydro-electric power; the other dams in Zimbabwe are exclusively for irrigation and water supply. The major hydro-electric projects in Zimbabwe are to be found in the South-Eastern Lowveld where the Regional Water Authority is responsible for providing water to an area of 60,000 km2: 44,000 ha are currently irrigated and a further 240,000 ha could soon be (source: Regional Water Authority). Three-quarters of the irrigated surface area is used for the production of sugar cane, and the rest for cotton, wheat and soya production.
This country's agriculture is one of the most successful in Africa (12) and for this credit has to be given to the irrigation project policy adopted over the past twenty years or so, first by the Rhodesian authorities and then by the Zimbabwean government, although several other economic and political factors are also responsible (13).
16

2.1 Kyle (cf. Map 4)
Lake Kyle (1961) on the Mtilikwe River, is one of the group of irrigation projects of the Low veld (cf. Map 5). This 91 knv stretch of water, the largest of those whose total surface areas are entirely within Zimbabwean territory, is used exclusively lor the irrigation of agricultural land situated downstream.
A major part of the land surrounding the lake (approximately 90%) has been converted into a recreational park including a game reserve. The existence of hotels and its proximity to the Great Zimbabwe historical ruins render Lake Kyle an extremely interesting tourj«t site.
The thick bush and forest terrain that one can see here gives way, to the south-east, to sparse bushes on the sides of rocky mountains, where the inhabitants use subsistence farming (maize, sheep and goats, fishing) on the Mtilikwe communal land. The area is relatively densely populated.
PROPERTY BOUNDARY
Map 4: General Layout of Kyle Dam * WATER SAMPLING POINT
17

/
)MASVINGOv
KYLE DAM aTURGE/SIYA
DAM
BANGALAi DAM
•MANJ|RENJ|
.DAM
mm ^TRIANGLE
\ ^ - « - V H ^ o VALLEY
20 40 60
irrigated areas
18
Map 5: The Lowveld irrigation scheme

2.2 Mc Ilwaine (cf. Map 6)
This lake (area 57 km2) was established in 1952 on the Hunyani River, 35 km from Harare, in order to meet the drinking water requirements of the capital city.
Mc Ilwaine is a recreational park: the northern bank has facilities for pleasure sailing, fishing, water skiing and camping; while the south bank is a game'park. The people living in Harare arid tourists from elsewhere visit this lake in large numbers. The vegetation is abundant and green.
Thirty kilometres down trom the Mc Ilwaine dam is lake Robertson which was established in 1976 when the Darwendale dam was completed. This other large reservoir (91 km2) which was intended to be used by the inhabitants of the capital is also a recreational park and although the.facilities have not yet been completed, it is already quite popular.
Map 6: General Layout of Lake Mcllwaine
19

II — IMPACT ON THE DISPLACEMENT OF POPULATION
It is a well-known fact that dams are very rarely built in uninhabited areas and therefore before the flooding, people who live in identified dam sites have to be moved and resettled elsewhere. Such movements necessarily imply a break but this could be an appropriate occasion to improve housing and social amenities as well as forjob creation in the resettlement area.
Careful and intricate planningis however necessary in order to cater for the needs"of the newly-displaced persons. Moreover, resettlement is a long term operation which requires significant financial and human resources. Studies carried out at the end of such operations have shown that in most cases, the three factors to be considered (cost, duration and human resources), have been grossly "underestimated during the planning stages (14).
With respect to the four largest man-made lakes in Africa — Lake Nasser in Egypt, Lake Volta in Ghana, Lake Kainji in Nigeria and Lake Kariba in Zambia and Zimbabwe — the final resettlement cost was between US$ 200 and 2000 per displaced person, that is to say 20 to 25% of the total cost of the dam (15) and, judging by the problems, could well be deemed insufficient.
The establishment of these four lakes forced 336,000 persons to leave their lands and homes, as can be seen in the figures below (16):
— Lake Nasser: 120,000 displaced persons — Lake Kariba: 86,000 displaced persons — Lake Volta: 80,000 displaced persons — Lake Kainji: 50,000 displaced persons
As has already been mentioned in the case of Lake Kariba, these movements created serious problems. In the case of Lake Volta, for example, the 80,000 persons concerned were relocated in 52 villages built specifically for this purpose by the Ghanaian government. Due to poor planning, there were problems of implementation because the villages were not ready in time and the government abandoned the construction of schools and other community buildings because of lack of finances! Furthermore, the intention of the project had been that each farmer would have 5 ha in exchange for the land he had lost. But, of the 21,600 ha which had been envisaged, only 6,000 ha were eventually available. Needless to say, this was in no way commensurate with the 75,000 ha of cultivated land that was flooded by Lake Volta (II).
In the conclusion of this general introduction something should be said about a notion which is difficult to quantify but which, however, needs to be taken into account when a person is torn away from his land, his house and familiar surroundings; the notion is called 'stress of relocation'.
Several scientific studies have been carried out on this problem and have showed that physiological, psychological and socio-cultural difficulties cropped up among persons who had been relocated against their will (17). Current research on this matter has identified steps which can be taken in order to minimise the stress and its effects since no satisfactory solution has yet been found to eliminate it. The day when the only problem in the planning and completion of dams will be stress of relocation, the battle will largely have been won! But alas, that day is still far in the distant future as the results of observations made in Kenya and Zimbabwe show.
20 ^

I. Kenya: relatively few persons displaced but differing fortunes
Although no-official figures arc available, it would seem that the areas now taken up by the Masinga. Kamburu and Kindaruma lakes were relatively sparsely populated before the construction of the dams. The low rainfall and the tse-tse fly made the Kindaruma region largely unsuitable for agriculture (14). Thus nobody was living in the area now Hooded by Lake Kindaruma. For the same reasons, this land was hardly used as pasture.
It is however estimated that 1,000 families lived on small plots of subsistence farming (maize, millet, beans, peas) and they were forced to move before the Masinga and Kamburu Hood-waters covered their land (18).
1.1 Masinga
At the lake site, the original flow of the Tana River constitutes the administrative boundary between Embu and Machakos districts. Before the flooding, the land regulations applied to the area varied, depending on whether land was on the left or right bank of the river.
1.1.1 Government Trust lands
With the beginning of the construction of the Masinga dam, the government moved families which were cultivating land on the left bank of the Tana River in Embu district to new land, and particularly in the Mwea Irrigation Scheme in the northern part of Embu district was situated (cf. Map 3). The transfer involved all families, whether their land was to be covered by the lake or not. An evaluation was made of the crops in the fields and the improvements made to the abandoned land and the families were given compensation. Since the land itself belonged to the State, there was no compensation for its value. No records were available regarding how much land the displaced people lost and how much land they were given in exchange.
1.1.2 Freehold land
On the other side of the river, in Machakos district, the families were given compensation for their land, at the rate of US$100 (1980) per acre (this was the average price for an acre (0.40 ha) of land used for subsistence farming at the time); they also received compensation for any improvement they may have made as well as for crops in the fields at the time of their departure.
However, the search for and purchase of new land as well as for new housing was the entire responsibility of the displaced families. According to the Masinga village chief, the move did not cause insurmountable problems, because even today the region is still quite sparsely populated.
Of the 500 families whose land was flooded, it is impossible to determine how many were in effect displaced: some of them had land on which they lived, in other areas which were not affected by the construction of the dam.
1.2 Kamburu
The land which is currently occupied by the Kamburu lake and dam belonged to the Tana River Development Authority which prohibited settlement on this land although this rule was not strictly adhered to. The construction works and the rapid population growth in some areas of Machakos district which were already quite highly populated attracted about 100 families which settled more or less illegally on the right bank of the
21

Tana River near the present dam (7 j . On the left bank, the first groups of farmers were 8 km to the north of the river.
Hence the forced emigration brought about by the construction of the lake was very limited. Nonetheless, the authorities compensated the displaced persons for improvements made and for crops lost and resettlement was left to the individual. The northwestern edge of the lake became the Mwea game park.
2. Zimbabwe: the consequences of the Rhodesian policy
Before 1980 Zimbabwe was known as Rhodesia, an African nation led by a white minority whose policy towards the country's black population was a close reminder of that applied in the Republic of South Africa.
Since 1965, the year in which the white minority unilaterally declared its independence, the Rhodesian government established a series of laws which enabled the 6000 white farmers to control half of the country's arable land and employ 250,000 Africans in the production of 90% of the country's agricultural products (12). The situation made the tribal lands a reservoir of abundant cheap labour and agricultural production in these lands deteriorated to such an extent that it was quite easy for it to be reduced to nothing by the 7-year guerilla warfare at the end of the 70s.
These facts enable us to understand better why the fertile sites of lakes Kyle and Mc Uwaine were occupied by large agricultural lands owned by whites and why. todav. there are no data available on compensation received by the big landowners or then possible displacement. There is also no information regarding the migration of local African populations.
2.1 Kyle
Almost all of the flooded area was on a single property belonging to a Mr. Kyle who gave his name to the lake. As was often the case during that period, the area surrounding the property was occupied by Africans who were more or less linked to the big farm. Before the completion of the dam, these people were forced to leave their land and houses, without any compensation, and had to find places to resettle wherever and however they could.
Some chose to build their homes on the slopes of hills bordering the lake to the southeast in an area known as 'Mtilikwe Communal Land" (cf. map 4), others left the region altogether. Whatever the case may be, the Mtilikwe communal lands support a large number of people most of whom revolve around two villages while the recreational park takes up 90% of the land bordering the lake. Each of these villages has a school and a dispensary which were recently constructed. These villages were already there, in a less elaborate form,-when the dam was built. ;
2.2. Mc Ilwaine
The land which is now covered by the lajce was in the past shared between several large-scale farms. Although no-one was able to confirm whether or not there had been any displacement of whites or blacks, the lake Mc Ilwaine situati6n can be likened to that ol lake Kyle since it is highly likely that there too, the economy of the large farms depended on that of the local African communities and vice versa.
Nowadays, the whole lake and its environs have been made into a recreational park and as such it was impossible to meet anyone there who could be a possible witness ofthe
22

events related to the construction of the Mc Ilwaine dam.
3. Conclusion
As has already been mentioned in the paragraph dealing with the parametres of this study, the absence of quantitative data related to the movement of populations and the fact that it was impossible to make enquiries among those who had been obliged to move (due to time constraints and because the people who were affected by the establishment of the lake had mixed with those who were not), conclusions will have to be made with the greatest of prudence.
In Zimbabwe, the political situation is the major reason for which the African individuals affected had been driven from their land without any economic or social consideration of the consequences. With regard to the problem of involuntary migration, the construction of the Rhodesian dams was only a form of giving expression to a policy based on racism. Hence these are particular situations which cannot be compared to other dams in Africa.
As for the white population, no conclusion will be made in their regard, given the little in' ormation obtained. By contrast there are several observations and remarks which can be made on the Kenyan examples.
Although the area in which the dams were built is considered to be sparsely populated, 1000 families were displaced and most of them were originally settled on the Masinga site. Therefore, taking into account the demographic characteristics of the rural family in Kenya and in Africa, 4000 to 6000 persons are likely to have been displaced.
In spite of these numbers, which are hardly negligible, the authorities responsible for the construction of the dams did not plan any resettlement programme worthy of the name. On the right bank of the Tana River, the emigrants were themselves obliged to look for new places in which to live and work. On the left bank, the government directed those families which were cultivating State lands to the Mwea Irrigation Scheme where a portion of land was assigned to them, and the individuals had to organise themselves in order to find or build new homes.
Admittedly the number of persons affected by the establishment of these lakes is nothing to be compared with the figures quoted in the introduction to this chapter, but this does not mean that there was no justification for carrying out, with greater care, a preliminary study on the movement of persons which was to be brought about by the construction of the dams.
Moreover, the Masinga dam was completed in 1981 and at that time the results of studies on the problems of involuntary migration outlining mistakes made in the past, were already available. This tends to prove the fact that those responsible for the dam construction projects as well as the international donors who finance these projects, are still not taking sufficient account of the problems pertaining to the displacement of persons.
Clearly, it should be the policy of donors and recipient governments to ensure, in all cases, that thorough resettlement programmes are instituted.
23

Ill — IMPACT ON DRINKING WATER SUPPLY AND SANITATION
It is surprising to note that in existing reports and articles, mention is not made of" considerations of the impact dams have on the drinking water supply of communities living near man-made lakes and on sanitation. And yet, the immediate consequence of the building of a dam is the establishment of a reservoir of water. Furthermore, which African government or which bilateral or international aid agency has not joined the United Nations in proclaiming "clean water and adequate sanitation for all by 1990"?
Should one therefore conclude that these aspects are systematically included in all dam construction projects, and that evidently those living in the areas around the lakes already have drinking water and adequate sanitation?
According to observations made during this study the categorical reply is no!
1. Lack of water supply networks for the local communities
The Kamburu and Kindaruma dams in Kenya are used only for the production of hydro-electricity while Masinga's role is to maintain the quantity of water necessary for the regular supply to the electricity plants downstream as well as its own plant. On the sites-of these three lakes, no drinking water supply network was constructed..
As for lake Kyle in Zimbabwe, its water is intended solely for use in irrigating the Lowveld, the agricultural region in the south-east. Lake Mc llwaine* — much like lake Robertson situated 30 km downstream — is used to supply drinking water to the city of Harare, and the water is treated before it is distributed to the consumers. The tourist facilities on these two lakes obtain their drinking water from nearby towns: Masvingo for lake Kyle and Harare lor Mc llwaine.
The rural communities living arouna tne lakes therefore have to supply their water themselves; this means that these communities use water drawn directly from the lakes for their drinking needs and all domestic activities. Here, mention should be made of two particular situations:
— at lake Kyle, the families living.on the Mtilikwe communal lands use the dam water or water from several springs distributed along the hillsides, depending on how far they are from the banks;
— the inhabitants of the village immediately downstream of the Kindaruma dam (cf. Chapter I, paragraph 1.2) fetch water from the river, but there is nothing to indicate that the quality of the water at that point is basically any different to that of the lake.
When a dam is built on a waterway, the lake it creates immediately becomes the water source directly available to the local population. The problem would then be to determine if this water is clean enough for drinking.
2. Lake water: unsuitable for human consumption
There are various consequences to the construction of a dam and here are some:
NB. *Lake Mc llwaine and the surrounding area has become a recreational park; this lake is not taken into consideration Jor the purposes o) this chapter.
24

— the rate at which water flows is drastically reduced and this enables a certain number of micro-organisms to develop;
— the decomposition of submerged organic matter (particularly plants) can lead to deoxygenation of the water;
— human or animal excreta deposited near the lake can rapidly pollute the stagnant water;
— the dam can cause concentrations in the lake of matter carried by the water (soil particles, chemical fertilizers, e t c . ) , and some of these are toxic.
The observations below were made after results of chemical and bacteriological analyses carried out in the framework of this study. Results were compared with standards established by the World Health Organisations (19).
2.1. The Tana River lakes (Kenya): high level of turbidity* and significant proliferation of micro-organisms
The results of analyses in Appendix II (Tables 1 to 3) indicate that the chemical and bacteriological characteristics of the waters of each lake are similar:
— the rate of turbidity is very high; — the populations of coliform bacteria are highly developed and the presence of one
of them (E. Coli) seems to indicate the existence of faecal pollution; — on the other hand, the high oxygenation rate indicates that the organic
decomposition activity is low (the vegetation covering the flooded areas was, to a large extent, destroyed before the Hooding), there are no traces of industrial pollution and the content of toxic elements remains at acceptable levels.
Taking the first two observations into account, it is clear that the water in lakes Masinga, Kamburu and Kindaruma is not fit for consumption unless it is treated.
2.2. The water in lake Kyle (Zimbabwe): satisfactory...for a lake!
The water quality in this lake is by far superior to that of the Kenyan lakes (cf. Appendix II, table 4):
— the rate of turbidity is relatively low; — the rate of coliform bacteria corresponds to a normal level for the surface water of a
lake and there is no evidence of faecal pollution; — organic decomposition and the content of toxic elements are low as in the Kenyan
lakes. The copper content, however, indicates slight industrial pollution. Although the quality of the water is more or less satisfactory — for waters, in a lake — it
cannot be considered drinkable; the rate of turbidity and the copper content should be corrected by appropriate treatment before the water is fit for consumption.
3. Need for more sanitary installations
It is indeed a rare thing to see sanitary facilities around any of these lakes. Only a few latrines have been built, at the rate of one per organised group of dwellings (e.g. village). In the Mtilikwe communal lands {lake Kyle), the schools in the two villages have their
'Turbidity is a waterway's content in muds and suspended matter.
25

sanitary facilities including a public latrine (all these facilities were built after 1980). Nonetheless, it is true to say that given the large number of people living only a few metres from the lake, these rudimentary facilities are extremely inadequate, as is the case also for the lakes in Kenya.
As regards water for domestic use, — e.g., for preparing food and also for personal hygiene, cleaning of utensils and clothing — the lakes are, once again, the only source.
4. Conclusion
In the light of the observations made above, it is necessary to make some conclusions at this point; the establishment of the lakes in no way helped improve the water supply to the local co.mmunities, nor did it increase its availability in time since the dams were built on rivers which flowed all year round.
Since there had been no analysis of the waters before the dams were built, it is impossible tp»determine whether their quality has deteriorated. Nevertheless, there was a chemical analysis — no bacteriological analysis was made — for the Tana River water at the proposed site of Masinga Lake before the implementation of the project (27). Compared to our Masinga sample, the former analysis enables us to say that the water chemical content has slightly increased but remains acceptable. It is however clearly evident that all the lakes, whose water flows slower and has a higher temperature, have encouraged the proliferation of micro-organisms which would have been more limited in a river.
Whatever the case may be, the water in lakes Masinga, Kamburu, Kindaruma and Kyle are not fit for human consumption. And its use for domestic purposes is definitely a risk. which is only increased by the lack of adequate sanitary installations. Pollutants from human excrement left in the open are likely to be swept by rain and wind into the water which is used t>y the local people and their animals (potential carriers of germs which can be deposited in the'water).
The non-existence of drinking water distribution facilities and the lack of adequate sanitation, coupled with the absence of legislation concerning the protection of the quality of water (eg. banning the use of lakes water to animals) and the lack of information campaigns for the local people (on simple water treatment methods, hygiene, etc.), can only lead to the proliferation of all sorts of illnesses. Those responsible for the conceptualisation of dam projects have apparently not thought it useful to take steps to reduce the risk of the spread of diseases, nor have they thought it necessary to improve the living standards of the people who live around the lakes.
26

m
**PW
Credit: UNEP
A Hazardous Water Supply.
27

IV — IMPACT ON WATER-BORNE AND WATER RELATED DISEASES
The spread of water-borne and water-related diseases is one of the most spectacular consequences of the construction of a large dam, one of the worst things that a water project can do to the environment when no adequate measures are taken to arrest it.
The construction of the'Aswan dam (lake Nasser, in Egypt), for instance, was followed by an increase from 21% to 75% in the number of persons attacked by bilharzia in the local community (20). Around lake Volta (Ghana) the figure went from 1% and 5% (depending on the area) to 80% and 100%: there had been no budgetary provision for the control of the spread of such diseases, and subsequently, a programme involving more than US$100 million was launched in order to try to eradicate bilharzia in the area! (11)
Other parasitic diseases also frequently spread around man-made lakes and these include malaria, elephantiasis and river blindness. They are spread by "hosts" or "vectors" within which the parasite has to spend part of its lifetime before it can be transmitted to man. In most cases, the hosts are snails (bilharzia), mosquitoes (malaria) or flies.
The construction of a dam can lead to the spread of parasitic diseases in the surrounding areas because it creates conditions which are favourable for the development of one or several of these organisms. The change in the rate of flow of the waters can for example lead to:
— the establishment of egg-laying areas for mosquitoes (malaria carriers) in the stagnant surface waters of the lakes and in pools of water which collect alongside the lakes when the levels fall (21);
— the presence of snails (bilharzia carriers) in calm or slow-moving waters, encouraged by the growth of aquatic plants on which they live (22).
Another element of the spread of diseases around a man-made lake is linked to sanitation facilities: the lack of control of human excreta in the proximity of a lake can cause water pollution (cf. Chapter III, paragraph 4). When this water is subsequently drunk by humans, it can cause diseases such as diarrhoea, cholera, dysentry, or even typhoid fever (23).
Of particular interest at this stage are three major mechanisms by which disease is spread:
— once the pathogenic agent has been released by its aquatic host, it is transmitted to humans through external contact with water (as in the case of bilharzia);
— the pathogenic agent is transmitted by an insect bite (made by a mosquito as it is the water-related carrier of malaria);
— the pathogenic agent present in water is ingested orally (as in the case of diarrhoeal diseases).
The results of the observations made in the field have been included in paragraphs 2 to 4 below and it is appropriate to bear in mind what was said in the chapter on the parameters of the study, some of which are repeated below.
J
1. Preliminary observations
As in the majority of countries in At rica, the staft of the dispensaries visited were not doctors but nurses. Moreover, none of these dispensaries was equipped with a laboratory
28

or equipment for carrying out tests. In such situations, it is particularly difficult to detect some diseases, especially bilharzia which the dispensary staff were able to diagnose only because of the presence of blood in the urine — a symptom which applies to other diseases as well — in other words, two years after the initial entry of the pathogenic agent into the body, by which time the disease will have affected the liver. Consequently, the records of cases treated, which form the basis of this part of the study, cannot be a true reflection of the real development of diseases such as bilharzia. Moreover, the choice of the dispensary at which a patient is to be treated is an individual one since there are no administrative obligations which would force an individual to use a given medical centre because he lives in a particular region.
Because of these facts, it is not possible to determine the exact size of a community attached to a given dispensary. In the absence of more precise information, it has been assumed that the population of areas situated near dispensaries increase in accordance with the annual population growth rate of the general surrounding area.
It should be recalled, finally, that in the case of Zimbabwe, it was not possible to take iito account the data related to the number of cases recorded for each disease in the dispensaries around lake Kyle. Reasons for this situation have already been given earlier (cf. "Parameters of the study").
2. The Tana River lakes and environs (Kenya): considerable increase in the incidence of water-borne and water-related diseases
Since it was impossible to determine the "zone of influence" of each of the lakes, the data collected from the different dispensaries in the area will be analysed under the same paragraph.
Of the seven dispensaries visited, two had only daily records of the number of cases treated. Given the time constraints, it was not possible to utilise these data and therefore only five dispensaries are considered.
Among the diseases featured in the records of these dispensaries, four are transmitted by water: malaria, bilharzia, diarrhoea and illnesses related to intestinal worms. There are no records previous to 1981 hence the Riakanau dispensary's records (cf. Map 3) are probably the most interesting since the Masinga dam was completed in 1981, and more so because it is the only dispensary about which one can be sure that only those persons living around lake MaVinga are treated there.
Table 1, a result of the information gathered from the records (cf. Annex III), shows that from 1981 to 1984, both years inclusive, the number of cases of malaria treated at Riakanau increased by an annual average rate of 21% while the rate for diarrhoeal diseases is 71%!
Due consideration has to be given to the fact that the average population growth rate in the region was approximately 5% per annum (24;25) and that the same person can be attacked several times by the same disease during the reference period. This, however, does not justify such increases in the number of cases treated. Consequently, it is evident that the presence of the lake has encouraged_the proliferation of water-borne diseases.
The number of cases of bilharzia recorded in all the dispensaries is too small for statistical analysis and therefore the disease cannot be considered. This does not mean that the disease, which, like malaria, is endemic in the region (7) has not increased. As has
29

I
already been indicated, the dispensary staff can only detect it in certain instances which, moreover, can constitute a diagnosis for other diseases as well (cf. paragraph I above)'
It is nonetheless possible that the incidence of bilharzia has not increased. Actually, during the latter years the levels of the lakes varied significantly (26) and if these variations were frequent — the report quoted in this context does not give any indication to this effect — the host snails could not have been able to grow. It is probahlethat th^e level variations corresponded to the seasonal changes which occur twice a year (in'kenya there are two dry seasons and two rainy seasons a year).
With the exception of the Wachoro dispensary where the number of cases treated decreased lor reasons which were unknown, malaria increased everywhere with annual average growth rates of between 14% and 40% of recorded cases. The same applies to the intestinal worms (19% and 71%) and the diarrhoeal diseases (from 33% to 70%) except in Machanga where the number decreased without any explanation being evident
These figures clearly indicate that no extra preventive or curative measures were taken to counteract increase in disease incidence which could be expected to follow the dam construction. This was confirmed by the dispensary staff and the director of the Embu medical centre.
Table 1: Annual average rate (%) of increase of the total number of cases treated in each dispensary (cf. Map 3)
Dispensary
Gategi Kiritiri Machanga Riakanau Wachoro
Malaria
30 40 14 21 -7
Diarrhoeal diseases
33 J 42
-8 70 -11
Intestinal worms
19 71 * * -8
•Given the very low number of cases treated, these records were not taken into account
3, Lake Kyle (Zimbabwe): possible increase in the incidence of malaria
The following observations are based on interviews held with dispensary staff of the Mtilikwe communal lands. According to them, the spread of malaria would be relatively significant, cases of diarrhoeal diseases have remained at a relatively low level and bilharzia does not seem to be a problem in the area.
In relation to this latter point, it should be noted that the lake Kyle area is rocky and this is particularly evident on the banks of the lake at the communal lands. Areas suitable to aquatic plants which encourage the development of snails needed to complete the bilharzia cycle (snail — water — man — snail) are very rare.
4. Lake Mc Ilwaine: visitors to the recreational parks are enlightened individuals
On arrival at the recreational park, the visitor is warned by numerous signs "Beware of
30

bilharzia'". Evidently, those who visit lake Mc llwaine are not the same as the ones in the lake Kyle communal lands! Most visitors come here from the capital for relaxation and it is very likely that their level of awareness of risks one can run in the vicinity of a large expanse of water in Eastern Africa enables them to take all the necessary precautions, including that of avoiding contact with the water.
5. Conclusion
Lake Mc llwaine is a very particular case and, given thc.lack of data.it is not possible to draw conclusions with regard to lake Kyle. The only information that this part of the study produces deals with health problems caused by the Tana River lakes.
The comparison of the records of cases of water-borne and water-related diseases treated at the Gategi, Kiritiri, Machanga and Riakanau dispensaries — all of which are located on the left bank of the Tana River— demonstrates that the lakes are the probable cause of the increasing incidence of these diseases in the surrounding area. It can further be confirmed that no steps were taken to minimise their effects on public health.
The interviews held with local medical officers during fields visits and at the Embu district hospital clearly indicate that the authorities concerned are aware of the spread of these diseases and its relation to the presence of the man-made lakes. Moreover, preliminary studies carried out before the construction of the dams observed that there would most probably be health problems due to the new conditions created by the man-made lakes (10;27). Why were the necessary measures not taken as a follow-up to these studies? The reasons,'as expressed in the interviews once again, were "economic": the cost of such preventive measures (improvement of the banks of the lakes, information campaigns, sanitation...) would represent a considerably high proportion of the final cost of the project.
This would indicate that the expenses incurred in providing health care to patients suffering from water-borne diseases over decades or even centuries are not considered as part of the final cost of a water resources management project. From an "economic" point of view, this reasoning seems quite illogical, and more so because preventive measures would probably have been less costly than the health care and medicines necessary to treat the diseases themselves. If one were to reason in terms of better health and well-being of populations (factors which influence individual productivity), then the economic and humanitarian points of view would correspond to one another. And in that case, it would no longer be a matter of aiming for the day when the last brick will be laid to complete the dam, it would become a matter of long-term planning.
f
31

V — IMPACT ON AGRICULTURE AND LOCAL FOOD SUPPLY
Since a dam makes it possible to irrigate land in which there is inadequate water, it can have an important effect on agriculture, hence it can lead to increased agricultural production, which in turn improves the food resources of a country or a region.
The countries in the Sahel have cultivated 250,000 ha of land through irrigation and the potential irrigable land surface is estimated at 2.3 million hectares. On average, 14,000 ha are irrigated each year in this region (28).
But irrigation can also be a source of problems and the two phenomena mentioned below are among the most wide-spread. In this case, reference is made to lake Nasser (Egypt), one of the largest irrigation projects in the world:
— The slow rate of flow of water in the canals dug out of the ground encourages the spread of bilharzia throughout the irrigated land surface;
— The infiltration of the water from these canals into neighbouring soils results in the re-surfacing of this water due to poor drainage. The soils in the neighbouring area
> then become useless for any agricultural activity because they are waterlogged. A dam can also lead to the impoverishment of soils situated downstream. With
reference to lake Nasser still, mention should be made of the fact that before the construction of the Aswan dam, the Nile floods spread a total of 100 million tonnes of sediment over a surface of a million hectares. Nowadays these indispensible nutrients are infused into the soil in the form of fertilizers, at the cost of US$ 100 million per annum! (3). . ,
Irrigation usually concerns areas which may be hundreds of kilometres from the dam. But the purpose of this study is to assess the impact of dams on agriculture and food supply in the surroundings of the lakes.
At this local level the effects of a dam can be envisaged under three points of view, as follows:
— increase in agricultural activity (and therefore potentially an increase in the local food production and consumption). In the case of land which is higher than the level of the lake, gravitational irrigation will not be possible and hehce it will be necessary to utilize pumps or pumping stations (these are not necessarily high technology, they can be operated by wind or animal power).
— the rise of underground water towards areas near the soil surface can easily lead to a new source of water which would be easily available and accessible to the root systems of plants, and consequently, this could favour agriculture at the local level. However, if this phenomenon is too pronounced, it could lead to waterlogging and agricultural activity would be severely limited.
— the water retention created by the dam can lead to an increase of the fish stock, as long as the breed of fish introduced can adapt to the new temperature and oxygenation conditions in the water as well as to the new diet conditions (changes in the aquatic plants and in micro-organisms). This new source of easily available fish can be a rich and low-cost addition to the food requirements. However, it often happens that this new source disappears alter having increased rapidly because, for instance, of the de-oxygenation of the water caused by the decomposition of submerged vegetation or because the nutrients needed by the fish become exhausted.
The observations made during field visits bear on these three aspects which are useful in the evaluation of the impacts of a dam in terms of the improvement or deterioration of the local communities' food supply.
32

1. Kenya: Insignificant impact on food supply
1.1. No water for crops
Neither the area downstream of the three dams nor those around the lakes are irrigated in Masinga, Kamburu and Kindaruma. The sole task of these dams is the production of electricity. Nonetheless, it is quite shocking to note that on the banks of lake Masinga, around Riakanau village, the planted maize dries up prematurely only 80 metres or so away from the water. This would indicate that during the time of the field trips, the water table was not high enough for the plants to reach.
The area of land surrounding the~lakes does not manifest significant differences as compared to areas further afield neither do they show any signs of development since the construction of the dams. It would therefore seem likely that the groundwater is constantly at levels well below the reach of the root systems, and thus having no role in the growth of the vegetation in the areas.
1.2. The consequences of immoderate Ashing
Although fish production has increased since the construction of the dams, it is however limited due to the insufficiency of food for the fish. The rate of flow of the waters and the numerous variations in the levels of the lakes are not conducive to the increase of planktons (26) which, together with insects and other organisms living at the bottom of the lakes, are the basic foods for the types of fish in Masinga, Kamburu and Kindaruma. The types of fish used appear in table 2 below which also indicates the catches made (in kilogrammes) in 1981 and 1982 at Masinga and Kamburu/Gitaru (cf. Map 3).
Table 2: Fish production in lakes Kamburu (and Gitaru) and Masinga in 1981 and 1982 (in kilogrammes)
Species Kamburu + Gitaru Masinga 1981 1982 1981 1982
Tilapia - 20,195 13,880 13,301 Carp Barbus Labeo Eel Mormyrus
Total 33,582 21,237 29,495 *
•Fishing has been prohibited at Masinga since 1982 Source: Fisheries Department, Embu (Kenya)
Despite the little information available, it can be seen that at Kamburu, the quantities of fish caught decreased significantly within the space of a year (-37%). Since there was.no significant change in the fishing activities or in the numbers of fishermen, this decrease in production seems to indicate that the fish in lake Kamburu diminished in corresponding proportions. It would have been more logical if the quantities offish remained stable or increased.
10,784 1,618 474 291 220
5,364 1,207 71 350 365
1,483 — 7,459
2,240 3,121 1,891
33

Although it is possible to propose several hypothetical explanations for this situation (tor example: the turbidity rate can, by limiting the amount of light entering the water, hinder the development of plankton or plants on which the fish feed (29)), it would seem that the main reason for this decrease is improper and uncontrolled fishing.
The fishermen in the region, operating totally independently, used very fine nets and even poisons to increase their catch, according to the Fisheries Department in Embu. This is also the reason why the authorities prohibited any fishing at lake fviasinga where such practices almost depleted the fish stocks which were limited to start with because the project had only been recently launched. At the moment, the authorities are restocking the lake and meanwhile, a system of the official registration of each boat operating on the -lake and the possibility of organising the fishermen into cooperatives are being considered.
There is no fishing at Kindaruma where crocodiles, which even attacked nets loaded with fish, have discouraged the few fishermen in the area.
2. Zimbabwe: no irrigation, but fishing is a food resource and a tourist attraction
Here, once again, there were no official figures related to fishing in particular. However, it is still possible to make a few remarks.
2.1. Lake Mc llwaine
There has been no irrigation system originating from this lake and the park is obviously not an agricultural area. The hilly area in which lake Mc llwaine is situated is well treed, but, according to those who knew the area before the construction of the dam. there has been little change in the vegetation, so it is difficult to draw any conclusions.
Since the fishing done in the area is a leisure activity.it was not considered because it is not within the purviews of the study. It should be noted, however, that fishing is controlled (by the size of fish caught)and requires a permit issued by the park authorities.
2.2 Lake Kyle: irrigation is a privilege, fishing a major activity
Lake Kyle, like the other water resources management projects in the area, irrigates the Lowveld approximately 100 km downstream. Around the lake and beyond the limits of the park, o,wners of big ranches can obtain authorisation to use some of the lake water (depending on the level in the reservoir). The small farmers in the Mtilikwe communal lands cannot do the same since they do not have pumps for obvious financial reasons and no irrigation development for these farmers was provided for in the dam project. Also, this area is quite rocky and extends to the side of the hill which the groundwater does not reach, so any cultivation there depends entirely on rainfall.
Although there is no information on fish production in the lake, fishing seems to be the major activity on the shores (here reference is made only to the communal lands since the rest of the area is included in the recreational park). Fish is also a major source of food.
Men, women and children take part in the fishing and although no exact figures are known, it would seem that the fish in the lake are quite abundant or, at least sufficient for regular supply, given the methods used by the local people.
Given the limited time, it was not possible to establish the proportions offish used in the diets of the local communities.
34

3. Conclusion
Logically, the areas around a lake should be well provided with water so that crops can grow normally, irrespective of seasonal changes. But alas, there are complications to this logic.
Indeed, when water is stored, it can sometimes make it possible to irrigate areas downstream of the dams, thus increasing the total surface area cultivated in a region and increasing therefore its agricultural production. It is also true that irrigation projects at a lake would require supplementary financing. But these expenditures would evidently be minimal compared to the financial resources used in the construction of a dam alone, and they would enable the communities living in the area to obtain their own food throughout the year, regardless of the difficult climatic conditions in these regions.
With the exception of lake Kyle, about which it is important to bear in mind the fact that only a small part of the land around it is inhabited, the contribution of fish as food is limited or seriously threatened. In Kenya, even despite the conditions which are unfavourable for the development offish stocks, no control and no serious management had been considered when the lakes were established, so the local fishermen had free rein. Nowadays, the authorities have the difficult problem of restocking lake Masinga and are obliged to take such unpopular measures as prohibiting fishing activities altogether. Surely it would have been better if fisheries development plans had been incorporated into the project from the start.
35

VI — IMPACT ON THE PRODUCTION AND USE OF HYDRO-ELECTRICITY AT THE LOCAL LEVEL
Since the price of oil went up in the 70s, interest in hydro-electricity has continued to increase. It is estimated that the annual production of hydro-electricity between 1976 and 1985 increased by 35% in the world and by 68% in the developing countries (source: World Conference on Energy, Munich, September 1980). Apart from the price of fossil fuels, there are three other reasons for this trend:
— water is a national resource and hydro-electricity ensures that a country has a stable production of energy at the national level;
— a number of countries opt for hydro-electricity production in order to reduce their balance of payments deficits (in relation to the importation of fuels);
— the production of this energy does not, in itself, require the use of complicated techniques, such as those used in nuclear energy production, for example.
In 1980, Africa was producing 3,207 billion kWh and its hydro-electricity potential-whose development is on-going or planned, was estimated at 3,210 kWh (30).
Last but not least, another argument in favour of hydro-electricity is its low cost of production given the fact that the raw material (water) is free of charge. Table 3 below gives the comparative costs of the production of several kinds of energy.
Table 3: Comparative costs of power generation
Type of generation
Hydropower Large, High head Low head, Mini-Hydro
Diesel Large, Heavy oil (Coastal location)
Steam Large, Gas-fired Large, Coal-fired Large, Oil (imported)-fired
Nuclear;
Large Multiple Units
Investment cost* US S/kWh installed
1,100 3,500
1,000
800 1,000
800
1,600
Fuel cost US<f/kWh
—
4-2
0 4 2-7
5-5
1-0
Power cost US4/kWh
2-4 12-7
6-7
24 5-2
7-5
5-1
Source: World Bank *The investment costs include the cost of transportation and distribution of the power generated.
With regard to the table, it is interesting to note the great difference between the cost prices for the large projects and those that are small. It is also interesting to recall that water resources management projects have until today ^ot included environmental protection (in the widest sense of the term). One can therefore rightly wonder if the
36

difference in the cost price for power produced by largexprojects and those of small projects would still be to the advantage of the former if the environmental protection, resettlement costs, preventive health and fisheries development expenditures were also taken into account, with the understanding that the larger the man-made lake, the more important the measures for the conservation bf the environment and the social considerations.
The electricity generated is generally used in the national grid which mainly supply towns or industries, as is the case with lake Kariba in Zimbabwe (cf. chapter I, paragraph 2), or lake Volta in Ghana. The Akosombo dam produces 833 MW which are used by neighbouring countries as well as by the Kaiser aluminium mines and the national grid which supplies the main towns. The country's needs for electricity have increased so much that in order to honour contracts for the export of electricity, Ghanaians have to suffer frequent electricity cuts (14). What is more, the electricity is rarely distributed in the area around the dam at which it is produced as can be seen in the paragraph below.
1. Electricity and local populations: a black-out on ideas?
Of the five dams with which the study is concerned, only those on the Tana River (Kenya) produce hydro-electricity. The maximum production capacity for each of these dams is as follows:
— Masinga 40 MW — Kamburu 94 MW — Kindaruma 44 MW
All the electricity produced is channelled to the national grid and then is distributed to the towns and other electrified areas of the country. Local dwellings, schools and dispensaries do not have any electricity, and yet the villages which are built for the engineers and technicians working on the Masinga and Kamburu plants are supplied with electricity coming from the dam.
This w*ould indicate that supplying the villages in the region with electricity was clearly possible. Once again, the absence of benefits for the local people can be explained in financial terms, unless it was simply a matter of neglect.
2. Conclusion _
Once again the conclusion is that in terms of electricity as of irrigation, drinking water, sanitation and fisheries, the local populations do not benefit.
It is interesting to compare this situation with those in some developed countries where the areas around lakes are supplied with electricity free of charge or according to preferential rates!
37

Electric Power: taken away Credit: UN/Y. NAG ATA
38

VII — IMPACT ON PLANT COVER AND SEDIMENTATION
Sediments are soil particles — containing nutrients — which are removed from the soil (erosion) and transported by water currents which then deposit them in the plains situated downstream (sedimentation). In Africa, this phenomenon is particularly prevalent during the rainy seasons, when the rivers overflow and temporarily flood the plains alongside them. The agricultural importance of sediments is therefore obvious, because they make it possible for the soil to renew itself. On the other hand, their accumulation in front of a dam poses two problems:
— the impoverishment of soils situated downstream has to be remedied by the costly use of fertilizers;
— the lake fills up with solid matter, thus reducing the period during which the dam can be used and possibly altering the quality of the water (eutrophication*).
lirosion, which is the cause of the sedimentation phenomenon, can occur at two levels: — in the water catchment area of the river, upstream from the dam; — around the man-made lake. In both cases, the plant cover plays an extremely important role. If the cover is
inadequate, the run-off carries soil particles which are not held down by roots nor protected by foliage, right into the river or lake.
In the area surrounding a lake, the plant cover can either become more dense subsequent to a greater availability of water in the soil (cf. chapter V), or diminish due to pressure from the local population — clearing the land in order to increase the available arable land, the use of wood for fuel, overgrazing, etc. — aspects which encourage erosion.
Erosion is an extremely prevalent phenomenon in some parts of Africa where rains and consequently rivers, can be very violent, and where non-existent orsparse vegetation and the dessication of soils during the dry seasons can make the soils particularly vulnerable to the water action.
In the case of lake Nasser, it has been possible to work out the losses incurred in agriculture due to the absence of sedimentation (cf. chapter VX Cake Volta poses another kind of problem. The Volta River which flows into'the Gulf of Guinea, used to carry sediments from its catchment area right up to the Ghanaian coast. The sea deposited these sediments along the coastline right up to Togo, thus compensating for erosion by waves. The Akosombo dam which was built in 1965 is now retaining a large proportion of the sediments.
Since 1980, the sea in Togo has covered 135 metres of land. The road which runs alongside the beach has already had to be reconstructed twice, most recently in 1984. The new road is now 1 km inland as compared to the previous one. Towns and factories are threatened and some have already been submerged, like Keta town in Ghana (10,000 inhabitants)!
The phenomenon is spreading westwards, driven by strong sea currents, and is now threatening Benin and Nigeria. But some countries situated further inland (Mali, Burkina
* Eutrophication "involves the water and bottom sediments becoming enriched with nutrients to a point where the water quality deteriorates: the nutrient content of the lake rises to a dangerous level, sometimes known as the 'trophic' level". Definition by ICOLD (22).
}9
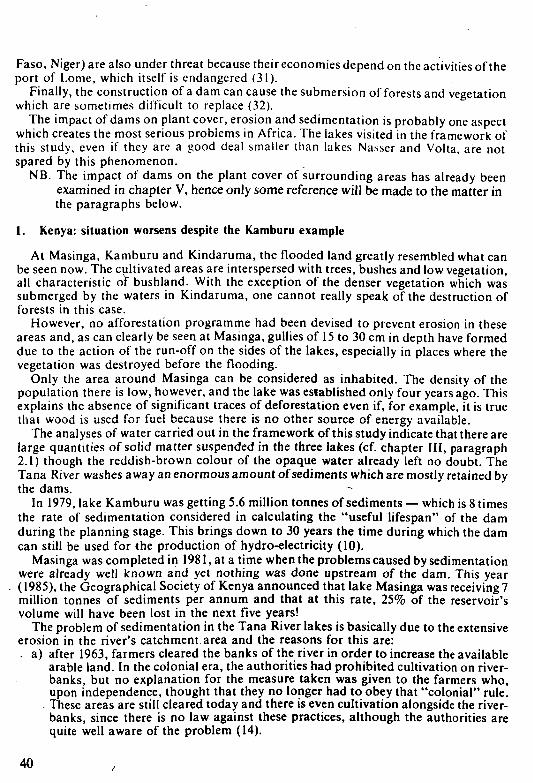
Faso, Niger) are also under threat because their economies depend on the activities of the port of Lome, which itself is endangered (31).
Finally, the construction of a dam can cause the submersion of forests and vegetation which are sometimes difficult to replace (32).
The impact of dams on plant cover, erosion and sedimentation is probably one aspect which creates the most serious problems in Africa. The lakes visited in the framework of this study, even if they are a good deal smaller than lakes Nasser and Volta, are not spared by this phenomenon.
NB. The impact of dams on the plant cover of surrounding areas has already been examined in chapter V, hence only some reference will be made to the matter in the paragraphs below.
1. Kenya: situation worsens despite the Kamburu example
At Masinga, Kamburu and Kindaruma, the flooded land greatly resembled what can be seen now. The cultivated areas are interspersed with trees, bushes and low vegetation, all characteristic of bushland. With the exception of the denser vegetation which was submerged by the waters in Kindaruma, one cannot really speak of the destruction of forests in this case.
However, no afforestation programme had been devised to prevent erosion in these areas and, as can clearly be seen at Masinga, gullies of 15 to 30 cm in depth have formed due to the action of the run-off on the sides of the lakes, especially in places where the vegetation was destroyed before the flooding.
Only the area around Masinga can be considered as inhabited. The density of the population there is low, however, and the lake was established only four years ago. This explains the absence of significant traces of deforestation even if, for example, it is true that wood is used for fuel because there is no other source of energy available.
The analyses of water carried out in the framework of this study indicate that there are large quantities of solid matter suspended in the three lakes (cf. chapter III, paragraph 2.1) though the reddish-brown colour of the opaque water already left no doubt. The Tana River washes away an enormous amount of sediments which are mostly retained by the dams.
In 1979, lake Kamburu was getting 5.6 million tonnes of sediments — which is 8 times the rate of sedimentation considered in calculating the "useful lifespan" of the dam during the planning stage. This brings down to 30 years the time during which the dam can still be used for the production of hydro-electricity (10).
Masinga was completed in 1981, at a time when the problems caused by sedimentation were already well known and yet nothing was done upstream of the dam. This year (1985), the Geographical Society of Kenya announced that lake Masinga was receiving 7 million tonnes of sediments per annum and that at this rate, 25% of the reservoir's volume will have been lost in the next five years!
The problem of sedimentation in the Tana River lakes is basically due to the extensive erosion in the river's catchment area and the reasons for this are: . a) after 1963, farmers cleared the banks of the river in order to increase the available
arable land. In the colonial era, the authorities had prohibited cultivation on river-banks, but no explanation for the measure taken was given to the farmers who, upon independence, thought that they no longer had to obey that "colonial" rule. These areas are still cleared today and there is even cultivation alongside the river-banks, since there is no law against these practices, although the authorities are quite well aware of the problem (14).
40

b) No reforestation or embankment policy has been established in the areas through which the Tana River and its tributaries run.
2. Zimbabwe: parks, plant cover and the nature of the soil limit erosion
Lake Mc llwaine is once again a particular case. Human activities do not atlect the abundant vegetation in the park and so local erosion is limited. As for erosion upstream, this seems to be insignificant as shown in appendix II (table 5): the water seems relatively free of suspended solid matter.
In the Mtilikwe communal lands, the only area around lake Kyle where agriculture is allowed, several trees have been felled and a relatively high proportion of the vegetation was destroyed by the local farmers. However, the rocky terrain does limit erosion here. There is sedimentation in this lake, due to the presence of small cultivated areas upstream, but it does not reach the levels recorded in the Tana River reservoirs in Kenya. The substantial plant cover in this region certainly helps to limit the pheomenon of erosion upstream of the lake. Similarly, the vegetation in the park prevents the soil from being carried away by the run-off in the areas around the lake.
3. Conclusion
There are sediments in each of the lakes visited, but the quantities vary considerably. Although they do not pose problems lor the economic interests in lakes Mc llwaine and Kyle, their concentration in the Tana River lakes in Kenya seriously threatens the capacity of the dams in the production of hydro-electricity for the years and yields initially planned and anticipated.
This means that the time during which the dams are to pay for themselves has to be reduced and that in turn means the cost of the production of the power also increases. According to the EEC, one of the major donors for the Masinga project, the dam would still have been a worthwhile venture even if it were to become unusable after only 20 years of service (14). Be that as it may, but would it not be more worthwhile and cost-effective to prevent sedimentation and thus increase the period during which theidam can be utilised? This is even more important given that preventing sedimentation also entails preventing erosion by means of afforestation and excavation works in areas subjected to erosion, limitations of agricultural activities* in the vicinity of rivers and education of the people who live in these areas. In this way, the national heritage would also be preserved and especially the one element which is so essential in agricultural production, the soil.
The reasons for which the Masinga dam project was not accompanied by soil conservation measures include the following:
— for the EEC, the financing of water resources management projects and that of soil conservation programmes was undertaken by two different departments and could not be included in the same project (14);
— The Tana River Development Authority is responsible for the management of the dams and it prefers to leave'ythe problem of_s_oil conservation to the (Kenyan) government (14); . "\
— the government apparently decided that the operation would be too costly in terms
¥Agricultural practices providing a permanent plant cover — e.g., fruit trees, forestry etc. — could be the only activities allowed in these zones in order to protect the soil while maintaining an output.
41

of money and time although the investment would clearly have produced good returns, not least by prolonging the life of the dam;
Clearly, decisions concerning the integration of soil conservation and reafforestation programmes into dam schemes must be made jointly by governments and donor agencies. It is difficult to expect a developing country government to pay for these measures (even if they are paid back in the longer term) if the donors fail to make available the necesary funds.
The organisational division in donor agencies — which appear to be one of the reasons that prevent the necessary integration of such large-scale projects — could surely be overcome given sufficient motivation. NGOs and local communities could help to provide such motivation, but would need at least to be informed of the problems and, at best, to be fully consulted in the project planning stages.
Such a consultation could also help recipient governments to make the case with donors for a fully-integrated project package, and could help donors to realise their own interests by providing such a package.
In addition, it is in the interests of "donors" — which often means "lending agencies" — to incorporate measures which increase the ease and likelihood of repayment (by the recipient governments) by conserving the lifetime of the benefits of the project.
42

VIII — COST-BENEFIT ANALYSIS The cost-benefit analysis (CBA) is an integral part of deciding whether to undertake a
project of development. It lists and assesses on the one hand the amount of all the benefits that can be generated by the project and on the other hand, all the costs necessary to obtain these benefits. That is to say, a CBA in a dam project proposal should enable the decision-makers to decide whether the project is worth Being implemented or whether alternative solutions would give better results.
From the findings of this study, it is clear that no environment conservation measures were included in the CBA's of each of the five dam project appraisals while very little consideration was given to social issues at the local level.
For the sake of clarity, the following discussion is based on the Masinga dam example. In this case, the only items related to the issues raised in the present study that were
included in the CBA were the following (source: Tana River Development Authority): — resettlement, in terms of compensation (for land etc.), as a cost; — fisheries in terms of additional benefit generated by the project. Still, these items were incomplete (resettlement should not be thought of only in terms
of compensation) or based on unrealistic figure. For example, preliminary studie. anticipated that fish catches in Masinga Lake would be of 400 tonnes offish per year (27). Due to a poor fish stock management the catches did not reach this level and now fishin is forbidden (see chapter V paragraph 1.2). The same applies to the estimates of the siltation rate which was then 3.8 million tonnes of sediments per year, and the pre-construction environmental study said "even assuming that all these sediments were retained in the Upper-reservoir (Masinga), a life of some 300 \ears would be assured" (27). In fact, at the current rate, 25% of Masinga reservoir's volume will have been lost by 1990!
The tables hereafter can be outlined from the information collected during this study. Generally speaking:
1. Costs and benefits included in project appraisals
Costs Benefits
— Feasibility studies — Preparation of site (clearance etc..) — Construction of dam, power plant (if any)
and irrigation scheme (if any) — Displacement of persons (compensation,
if any)
— Electricity production) — Irrigation , — Fisheries ) » a n v
— Flood control
43

2. Actual Costs and Benefits
.Costs Benefits ,
Costs listed under paragraph I — Electricity ) — Irrigation J — Flood control j ,f a n v
— Fisheries )
— loss of fuelwood — increase in diseases and/or health care
(at the local level) — cost of displacement (above compensation) — reduction of the useful lifespan of dam
due to higher than predicted siltation rate (if any) and local erosion (if any)
— decrease in benefits generated by fisheries due to decrease in the fish stock (if any)
3. Potential costs and benefits if due consideration is given to local communities and local environment
Costs Benefits
— Benefits listed under paragraph 1 Costs listed under paragrah 1 Health centers Increase of medical staff Preventive measures against water-related and water-borne diseases (lake shores improvement, information, sanitation — Better public health etc.) Drinking water supply for local communities local irrigation schemes fisheries management local electricity networks resettlement schemes fight against erosion afforestation
Increased local food resources (and local agricultural production) Better housing for local communities
Plant cover and soil conservation Local fuelwood production Local communities are better-off. local communities' productivity might increase
44

4. Conclusion
From the list above (paragraph 3), it is clear that all the components are inter-related. A realistic approach of the CBA issue in a dam project proposal is really complex. It requires very complete preliminary studies and the balancing of net costs-benefits compared to those of alternative solutions. If such a process was undertaken, alternative solutions might be more competitive in some cases.
Moreover, dam projects should not be approved until the local communities who are concerned with the project and the NGOs which are people representatives are satisfied.
Had these conditions been applied to the five projects which are discussed in this study, these dams would have been constructed on a very different basis. Some might also not have been constructed at all.
IX — PARTICIPATION OF NGOs AND LOCAL COMMUNITIES
Excluding the few comments made in the conclusions of former chapters, the participation of NGOs and local communities has not been mentioned in this study and in a way, this report can proudly claim to have reflected the reality correctly!
During the period including the implementation of the feasibility studies and the construction of dams, the authorities have not (to our knowledge) at any moment consulted the people who lived in the areas which are today the sites of the lakes, nor did they request their participation in the implementation of the projects. The same applied to the NGOs which, in any case, do not exist in these regions at the strictly local level. The needs, hopes and possible knowledge of the local populations were never taken into account.
The only enquiries worth mentioning that were carried out were with the local leaders (mainly village chiefs) on the right bank of the Tana River, in Machakos district (Kenya). But these enquiries only enabled the authorities to determine which members of the communities would be compensated for loss of land when the flooding took place at Masinga.
The dams were built for irrigation andjorthe production of hydro-electricity without any real attention being given to the populations which would be directly concerned by the establishment of the lakes, and without the authorities finding out whether it would be possible to respond at least partially to the most urgent needs of these populations by simply making the slightest changes to the initial project proposals.
45

CONCLUSION
The dams which were the object of this study are not "super dams" like Aswan, Akosombo and Kariba. Moreover, their impact on the environment and on the local communities was only considered in relation to their immediate surroundings, since the regions upstream and downstream of the lakes were not a part of the study. However, the problems raised throughout this report and reiterated below are far from negligible.
In the first instance, the local population do not benefit in any way from the presence of the lakes, whether it is a matter of the availability of drinking water, sanitary installations and electricity/or the increase of food resources and the improvement of housing. As can be seen in this sad summary made by a Riakanau resident who was asked how the establishment of lake Masinga had improved or made life easier in the village, "the only difference is that now you need a boat and more time if you want to cross over to the other side of the valley"!
Also, families were displaced and in most cases were not properly resettled, and diseases such as malaria are rapidly increasing in the regions visited. Finally, the dams had no significant favourable effect on the plant cover in the surrounding areas, thus leading, in some cases, to the erosion of the banks of the lakes, while the accumulation of sediments in the Kenyan reservoirs — due mostly to the erosion phenomena in the Tana River catchment area — has reached exceptionally high levels.
Most of these problems were possible to anticipate and were known to the authorities responsible for the design and the implementation of the projects as well as to the donor agencies which financed them (13). And yet no preventive measures were taken.
Donor agencies claim that they do not wish and nor can they impose their views on the governments of developing countries. This is easily understandable. But it is clear that they can make constructive suggestions and support the improvements necessary to the project as well as they can refuse to finance a project which does not seem sound to them.
Let us not forget that donor agencies have a responsibility to their own contributors to ensure that their money is well spent from a development viewpoint. Donors can, and do, impose conditions on funding applications, but they should also be willing to increase their initial contribution in order to enable governments to fulfill these conditons.
One can wonder why they actually support some projects which might cause problems of which everyone is aware. That developing countries' governments would rather "ignore" the social and environmental problems — whose prevention means an increase in the total cost of the projects — because they would have to look for supplementary funds, is easily understandable. Still, this is undoubtedly a case of short-sightedness. On the one hand, the destruction of the environment can either be irreversible, or can be remedied subsequently through environmental rehabilitation projects which are much more costly than timely preventive measures. On the other hand, environmental degradation often takes on economic significance. For example, the phenomena related to erosion in the long term lead to the reduction of agricultural land or to desertification, while the resultant sedimentation reduces the time during which a dam can be used for irrigation or the production of electricity.
Whether it is donor agencies or national governments of developing countries, no one should neglect these realities in return for political or commercial advantages.
46

Finally, if need be, it should be recalled that the objective of development is the improvement of the living conditions of the people in any given country.
This is a simple fact that no one can deny. But if this objective is seen by governments and donor agencies with the same attitude towards the local populations such as those covered by this study, it becomes clear that the situation is paradoxical to say the least. These populations which are directly concerned by the establishment of man-made lakes, do not benefit from them. In places where the opportunity to improve housing conditions, health facilities and food resources arises, nothing is done. And yet water pipelines and electricity wires transport water and electricity to other areas, towns and industries which are hundreds of kilometres away from the lakes.
The "super dam" projects seem to have survived (unofficially, agencies such as the World Bank or the Arab Bank for African Development no longer wish to finance projects with such risks — 33), but several other large dams similar to those studied will still be built in future because Africa needs them mainly to respond to her needs for water.
The building of some will be justified, others could more advantagedusly be replaced with smaller projects accompanied— in the case of energy production — by solar, wind;
or other plants. These small dams are of particular interest because their small reservoirs make them easier to manage effectively. Finally, the improvement of existing projects could definitely limit the construction of new dams, in some cases.
Whatever the case may be, it is imperative that the environmental and social aspects be taken into serious consideration in any project, no longer simply as a matter of general considerations, but as an integral part of the project as a whole, including the feasibility studies, the cost-benefit analyses and the management of the dams once they arc operational.
The integration ol" environmental and social factors is extremely important in the implementation of any water resources management project in industrialised countries. The same should apply in developing countries and, since each new lake established is a particular case, these aspects should be reconsidered for each new project. And, as far as is possible, use should be made of communities and NGOs whose knowledge of the local environment can be an invaluable source of information. The need for this participation is far from being recognised as is project planning that gives due consideration to environment and local communities.
11 is up to the NGOs, among others, to ensure that these aspects are taken into account for any project and, if necessary, attempt to persuade the authorities to take the necessary steps.
This report was written in order to demonstrate the various problems which could arise in regard to a man-made lake and certain information concerning other problems are included as supplements in the paragraphs introducing each chapter. The material used as reference can easily be made available for consultation.
With this information and the few recommendations made in the following pages, the NGOs should be able to identify inadequacies in projects concerning them and should take the necessary action, to the benefit of all concerned...
47

RECOMMENDATIONS
1. To project designers, governments of developing countries and donor agencies
a) A large ciam shouid only be buiit in cases where all other alternatives have been considered and none of them constitutes a satisfactory solution to the problem (irrigation, production of energy);
b) the impact on the environment and the local communities should be given careful attention in all phases of the project, from the design right up to its management after it becomes operational and particularly in cost-benefit analyses;
c) environmental aspects should be considered with regard to the site of the man-made lake as well as in the catchment area, both upstream and downstream; and all steps to be taken in relation to the conservation of the environment in the area should be integrated into the project;
d) the improvement of the local communities' living conditions should also be an integral part of the project;
e) the statistical data on which the project is based (rainfall, variations in the rate of How in the river, sedimentation rate. etc.). should be carefully studied —providing adequate leeway for the risks involved — so that the dam can be operational throughout the period initially envisaged;
I") the final cost of the project should be determined with the greatest of care in order to do away with last-minute "miscellaneous expenses" which cannot be attended to due to budgetary constraints and to ensure the integrated completion of all the components of the project;
g) there should be consultations with the local communities and NGOs, particularly regarding the environmental and social aspects ot the project;
h) reports and other documents concerning the project should be at the disposal of the general public;
i) full compensation and resettlement schemes, as well as preventive health measures to alleviate increases in water-related diseases, and soil conservation measures, should be conditions for donor support of large dam projects;
j) environmental impact assessment of all water management projects should be carried out by donor agencies prior to approval of funding.
2. To NGOs
2.1. NGOs should ensure that project designers, governments of developing countries and donor agencies implement the recommendations made in paragraph 1. above, giving particular attention to the following aspects:
a) the resettlement of persons should be planned very carefully, taking into account the opinions and needs of the local populations and adopting measures which would improve the living conditions;
b) the communities living around the lakes should have access to the following: — drinking water supply networks (community's central purification system,
etc); — sanitation facilities (evacuation/collection of refuse, etc.):
48

— electricity distribution networks, il he project involves a hsdro-eleetriedam; — appropriate irrigation system using the water from the lake; — information and training related to the four points immediately above;
_•) a lish management programme should be integrated into the project, including inlormation concerning stocking, restrictions pertaining to tishing, the expected changes in the water quality and the envisaged nutritional sources for the fish;
d) preventive measures in respect of water-borne or water-related diseases should be envisaged, including information and training regarding simple curative techniques, etc., and regarding the management of the lake —action to be taken concerning the banks (in order to eliminate stagnant pools and the growth of vegetation), artificial changes in the levels of the lakes, etc.;
e) anti-erosion measures should be integrated into all projects, particularly: — reforestation along the shores of the lakes as well as on the banks of the rivers
and their tributaries upstream; — agricultural activities should be limited in these same areas; — the communities living in these areas should be made aware of the phenomena
related to erosion; — the area around the lake should be made into a game park;
I) once all these measures have been integrated in the project, its advantages should be reconsidered and compared to those alternative projects initially disqualified. The following should then be included in the total cost of the project: — net annual yields of forests submerged or removed; — net annual yield of agricultural land submerged; — loss of fuelwood and fodder submerged; — real expenditure on compensation and rehabilitation of the local people; — total cost ol soil conservation measures; — total cost of preventive measures against water-related and water-borne
diseases and evaluation of necessary expenses following the dam construction (construction of dispensaries, e t c . ) ;
— cc^st of possible anti-evaporation measures; — cost of measures for the conservation of wildlife species endangered by the
creation of the reservoir.
2.2. In cases where a project is considered unsatisfactory, the NGOs should take the following steps:
a) contact the government responsible for the project and ask for supplementary action in order to improve it, then, if this is not followed by the desired action,
b) contact the donors, requesting them not to finance the said project; c) where necessary, initiate a national or international information campaign for the
general public, involving the participation of other NGOs and utilising advice given by water resources management project specialists.
49

ELC
will assist NGOs in dealing with dam projects by: '
i) publicising their work;
ii) putting them in touch with other groups and experts (in their area or internationally) who can provide support and advice;
iii) compiling case studies of NGO activities in relation to dams in order to help NGOs to learn from one another's experiences;
iv) liaising with relevant international and donor agencies in pursuit ol the objectives described in the recommendations included in this report.
Please, tell us what you are doing by writing to:
The Co-ordinator Water Resources Management Programme Environment Liaison Centre , P.O. Box 72461 Nairobi . KENYA.
50

REFERENCES
1. Power G.; 1984: Do high dams present lower risk?, in World Water, June 1984 2. Adams P., Solomon L.; 1984: The gift that stops giving — hydro-electric dams, in
The problem with Large-scale hydro darns in The Third World—correspondence surrounding. Energy Probe (Toronto, Canada), June 1984
3. Goldsmith E., Hildyard N.; 1984: The social and environmental effects of large dams; Wadebridge Ecological Centre, U.K., 1984
4. Smolowe J., Colton E.O.; 1985: Reassessing the Aswan Dam. in Newsweek, February 25, 1985
5. Personal correspondence with Mr. J. Cotillon, General Secretary of the International Commission on Large Dams, Paris, France, April 1986
6. ALPHA, AWWA, APCF; 1976: standard methods for the examination of water and waste-water. 1976
7. Oomen J.M.V.; 1981: Monitoring Health in African dams, 77!es/'.sfrom De Erasmus Universiteit Rotterdam. Netherlands, 1981
8. Anonymous; 1985: To irrigate or not to irrigate is Kenya's question, in The Weekly Review (Kenya), February 1, 1985
9. Okumu V.; 1985: Is Bura scheme a white elephant?, in the Daily Nation (Kenya), March 1st, 1985
10 Odingo R.S.; 1976: An African dam, in Ecological Bulletins (Stockholm, Sweden), No. 29. 1979.
11. Blackwelder B., Carlson P.; 1984: Fact sheets on International water development projects; Environmental Policy institute (Washington; U.S.A.), 1984
12. Frankel G.; 1984: Zimbabwe's mix of incentives for peasant farmers raises outDut at a time of famine; in the International Herald Tribune, November 25-26, 1984
13. Dennis M.; 1985: Zimbabwe works a 'farming miracle'; in the Guardian Weekly; May 26; 1985
14. Linney W.. Harrison S.; 1981: Large dams and the developing world: Social and environmental costs and benefits — A look at Africa; Environment Liaison Centre (Nairobi-Kenya), 1981
15. Ackerman W.C.; 1973: Resettlement, in Man made lakes; their problems ami environmental effects, American Geophysical Union, 1973
16. Obeng L.E.; 1981: Man's impact on tropical rivers, in Perspectives in running water ecology. Lock M. A. and Dudley Williams D., Eds. Plenum Press New York and London.
17. ScudderT., Colson E.; 1982: From welfare to development: a conceptual framework for the analysis of dislocated people, in Involuntary migration and Resettlement — The problems and responses of dislocated people, Hansen A. and Oliver Smith A. Eds, Western Press/Boulder, Colorado, 1982
18. GotabaleiN., 1980: Masingadam — Towards self-sufficiency in electricity, in Kenya News and Africa Report December 1980.
19. World Health Organization, 1971: International Drinking Water Standards. 20. Anonymous, 1985: Environmental effects of large dams, in Asian Pacific
Environment Newsletter, vol. 3, no. I, March 1985
51
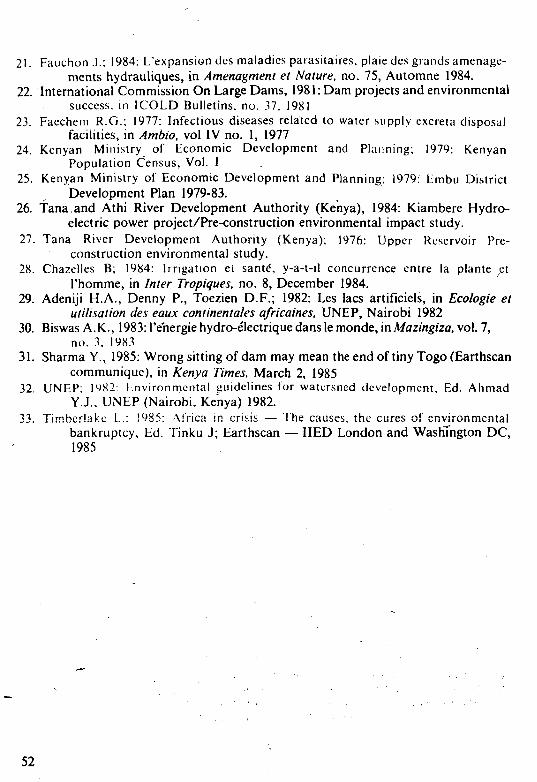
21. Fauchon J.: 1984: L'expansion dcs maladies paiasitaires. plaie dcs grands amenage-ments hydrauliques, in Amenagment et Nature, no. 75, Automne 1984.
22. International Commission On Large Dams, 1981: Dam projects and environmental success, in ICOLD Bulletins, no. 37. 1981
23. Faechem R.G.; 1977: Infectious diseases related to water supply excreta disposal facilities, in Ambio, vol IV no. 1, 1977
24. Kenyan Ministry of Economic Development and Planning; 1979: Kenyan Population Census, Vol. 1
25. Kenyan Ministry of Economic Development and Planning; 1979: Embu District Development Plan 1979-83.
26. Tana,and Athi River Development Authority (Kenya), 1984: Kiambere Hydroelectric power project/Pre-construction environmental impact study.
27. Tana River Development Authority (Kenya); 1976: Upper Reservoir Pre-construction environmental study.
28. Chazelles B; 1984: Irrigation ei sante", y-a-t-il concurrence entre la plante ct rhomme, in Inter Tropiques, no. 8, December 1984.
29. Adeniji H.A., Denny P., Toezien D.F.; 1982: Les lacs artificiels, in Ecologie et utilisation des eaux continentales africaines. UNEP, Nairobi 1982
30. Biswas A.K., 1983: l'ehergie hydro-electrique dans le monde, inMazingiza, vol. 7, no. 3. 19X3
31. Sharma Y., 1985: Wrong sitting of dam may mean the end of tiny Togo (Earthscan communique), in Kenya Times. March 2, 1985
32. UNEP; 1̂ X2: Environmental guidelines for watersned development, Ed. Ahmad Y.J.. UNEP (Nairobi. Kenya) 1982.
33. Timberlake 1...: 1985: Africa in crisis — The causes, the cures of environmental bankruptcy, Ed. Tinku J; Earthscan — IIED London and Washington DC, 1985
52

53

Appendix I
LARGE DAMS1 OF EASTERN AFRICA Existing, under construction and planned dams
For the purposes of this study, Eastern Africa is composed of the following countries: Burundi, Kenya, Malawi, Mozambique, Rwanda, Tanzania, Uganda, Zambia and Zimbabwe.
The figures below are estimates provided by various authors and sources.
1. Existing large dams
country name of the dam year of completion
Hood capacity cost funded area in 106.m3 by km2
KENYA Kamburu Kindaruma Masinga
1975 1968 1981
15 10 •-
120
— — 1560
— — us$ 74 M
— — EEC, FRG, UK, Kenya
MALAWI
MOZAMBIQUE
TANZANIA
UGANDA
ZAMBIA
Kamuzu Mudi Nankhuna
Cabora Bassa Chicamba Real Massingir Mavuzi Sussudenga
Nym(Pangani) Mindu Mtera
Owen Falls
Itezhitezhi Kafue Gorge Kariba2
Mita Hills Mulingushi
1966 1954 1959
1974 1959 1975 1953 1963
1966
1981
1954
1978 1971 1959
1924
—
2580 120 170
90
80
—
120 3100 5364
90 53
—
63000 1920 2884
—
—
156000
1: as defined by ICOLD 2: lake Kariba is common to Zambia and to Zimbabwe
54

Existing large dams (continued)
country
ZIMBABWE
name of dam
Bangala Darwendale (Robertson) Hunyani Poort (Mcllwaine) Kariba2
Kyle
Manjirenji Ruti Turgwe/Siya
2. Large dams under construction
country
KENYA
MOZAMBIQUE
ZIMBABWE
name of dam
Kiambere
Corumane
Pequenos Lilombos
Sebakwe3
Mwenje3
year of completion
1964 1976
1952
1959 1961
1966 — 1976
year of completion
1988 (Phase I due 1986)
—
Oct. 1985 Nov. 1985
flood area in km-
81
57
5364 91
— — —
flood area in km2
—
—
• "
—
capacity cost I06.m'
127 — 480 —
funded by
—
247 £1,5M —
156000 — 1286 Zimb
$3M 274 — 126 — 105 —
capacity cost 106.m3
3500 US$ 312M (all phases completed
1200 US$ 110M
440 US$ 70M
270 — 40,7 —
—
—
funded by
World Bank, African Development Bank, EEC, Kuweit, FRG, UK, Netherlands. Kenya
—
2: lake Kariba is common to Zambia and to Zimbabwe 3: raising existing dams
55
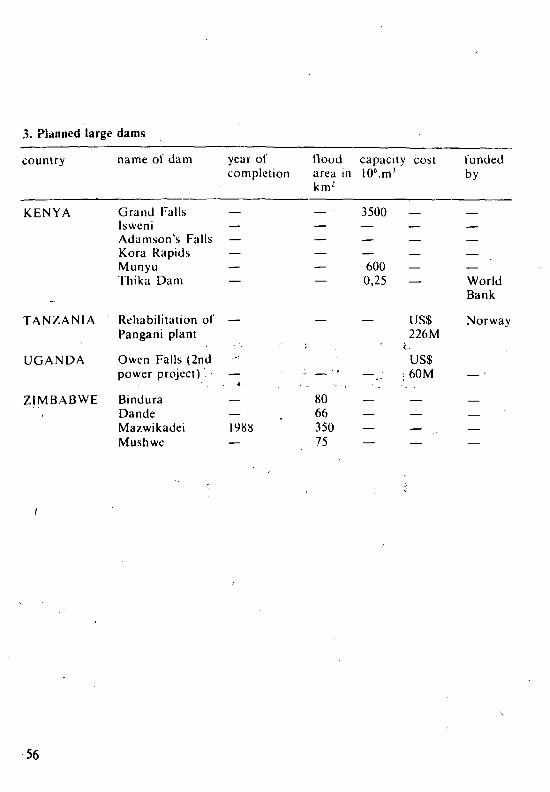
3. Planned large dams
country
KENYA
^
TANZANIA
UGANDA
ZIMBABWE ,
name of dam
Grand Falls Isweni Adamson's Falls Kora Rapids Munyu Thika Dam
Rehabilitation of Pangani plant
Owen Falls (2nd power project)
Bindura Dande Mazwikadei Mushwe
year of completion
— — — — — —
—
* — — 1988 —
Hood area in knr
— — — — — —
—
: ' • —
80 66 350 75
capacity 106.m'
3500 — — — 600 0,25
—
—,; ;
— — — —
' cost
— — — — — —
US$ 226M
US$ 60M
— — —
funded by
— — — — — World Bank
Norway
— s
— — —
56

APPENDIX II
UNIVERSITY OF NAIROBI
DEPARTMENT O F CIVIL ENGINEERING
TABLE 1: CHEMICAL AND BACTERIOLOGICAL ANALYSIS FOR
WATER SAMPLES
Sample Description: Masinga Dam near Masinga village on the surface, about 0.5m from shore
Parameter Result Remarks
pH Apparent colour (°H) True colour (°H) Conductivity Turbidity (F.T.U.) Hardness Ca++ as CaC03 (mg/l) Hardness total as CaC03 (mg/l) Total alkalinity as CaC03 (mg/l) Carbonate alkalinity (mg/l) Iron (mg/l) Fluorides (mg/l) Sulphates (mg/l) Phosphates (mg/l) Silica (mg/l)
Dissolved oxygen (p.p.m.) Nitrates (mg/l) Manganese (mg/l) Chlorides (mg/l) Chromium (mg/l) Copper (mg/l) Total coliform count/100 ml E. coli count/100 ml Volatile solids (mg/l) Total solids (mg/l) Suspended solids (mg/l) Biochemical oxygen demand (mg/l) Chemical oxygen demand (mg/l)
7.20 Neutral water 300 V. high due to red coffee soil silt 31 High — indicating v. fine suspension
73 24
338 44 0
0.1 0.65 0.2 0.1 19.0 6.7 0.3 0 10 0 0
28000 6000
o.k.
Extremely high — due to fine silt Soft water, o.k. Soft water, o.k. Low bicarbonate content, o.k. Low carbonate and hydroxide content Low, indicative of sufficient aeration Almost optimum required, o.k. Low — expected result, o.k. Low — expected result, o.k. High due to high silt concentration Nearly saturated, low organic content Low — indicative of low organic pollution As expected»for surface sample, o.k. Low — expected result Absence of industrial effluents Absence of industrial effluents -Heavy bacteria pollution Probable heavy faecal pollution
600 High 480 High 0 Low content of degradable organics 1.2 Low content of degradable organic matter
GENERAL REMARKS: Water heavily polluted by inert matter (particles of red coffee soil) and bacteria. Unfit for domestic purposes before complete treatment.

UNIVERSITY OF NAIROBI DEPARTMENT OF CIVIL ENGINEERING
TABLE 2: CHEMICAL AND BACTERIOLOGICAL ANALYSIS
FOR WATER SAMPLES
Sample Description: Kamburu Dam near dam wall on the surface' about 0.5m from shore
Parameter
PH Apparent colour (°H) True colour (°H) Conductivity Turbidity (F.T.U.) Hardness Ca++ as CaC03 (mg/1) Hardness total as CaC03 (mg/1) Total alkalinity as CaC03 (mg/1) Carbonate alkalinity (mg/1) Iron (mg/1) Fluorides (mg/1) Sulphates (mg/1) Phosphates (mg/1) Silica (mg/1) _ Dissolved oxygen (p.p.m.) Nitrates (mg/1) Manganese (mg/1) Chlorides (mg/1) Chromium (mg/1) Copper (mg/1) Total coliform count/100 ml E. coli count/100 ml Volatile solids (mg/1) Total solids (mg/1) Suspended solids (mg/1) Biochemical oxygen demand (mg/1) Chemical oxygen demand (mg/1)
Result
7.15 430
47 —
150 24 40 42
0 - 0.2
0.63 0.15 0.1
. 18.0 6.7
0.21 0
10 0 0
40500 37000
— 500 400
0 2.4
Remarks
Neutral water Extremely high, due to silt High — V. fine particles present — Extremely high due to fine silt Soft water, o.k. Soft water, o.k. Low bicarbonate content, o.k. Low carbonate and hydroxide content, o.k. High Nearly optimum concentration, o.k. Low — expected result, o.k. Low — expected result, o.k. High due to high silt concentration Nearly saturated, low organic content Low — indicative of low organic pollution As expected for surface sample, o.k. Low — expected result Absence of industrial effluents Absence of industrial effluents High but expected for such water Probable heavy faecal pollution — High High Low content of dcgradable organics Low content of degradable organic matter
GENERAL REMARKS: Highly polluted water. Deep brown colour due to silt from red coffee soil. Heavy bacteria pollution. Unsuitable for domestic consumption without complete treatment.
58

\ UNIVERSITY OF NAIROBI
DEPARTMENT OF CIVIL ENGINEERING
TABLE 3: CHEMICAL AND BACTERIOLOGICAL ANALYSIS
FOR WATER SAMPLES
Sample Description: Kindaruma Dam on the surface1 about 0.5m from shore
Parameter Result Remarks
PH Apparent colour ("H) True colour ("H) Conductivity Turbidity (F.T.U.) Hardness Ca++ as CaC03 (mg/l) Hardness total as CaC03 (mg/l) Total alkalinity as CaC03 (mg/l) Carbonate alkalinity (mg/l) Iron (mg/l) Fluorides (mg/l) Sulphates (mg/l) Phosphates (mg/l) Silica (mg/l) Dissolved oxygen, (p.p.m.) Nitrates (mg/l) Manganese (mg/l) Chlorides (mg/l) Chromium (mg/l) Copper (mg/l) Total coliform/100 ml v
£. coli count/100 ml Volatile solids (mg/l) Total solids (mg/l) Suspended solids (mg/l) Biochemical oxygen demand (mg/l) Chemical oxygen demand (mg/l)
7.10 480 47 — 170
22.0 38.0 44.0
0 0.05 0.62 0.1 0.05 16.5 6.7
0.20 0
N 1.5 0 0
37000 7500 —
45.0 380 0
3.6
Neutral water, o.k. Extremely high — due to silt High — indicating v. fine suspension
Extremely high — due to line silt Soft water, o.k. Soft water, o.k. Low bicarbonate content, o.k. Low carbonate and hydroxide content, o.k. Low, indicative of sufficient aeration Nearly optimum concentration, o.k. Low — expected result, o.k. Low — expected result, o.k. High due to high silt concentration Nearly saturated, low organic content Low — indicative of low organic pollution As*expected for surface sample, o.k. Low — expected result Absence of industrial effluents Absence of industrial effluents Heavy — expected for surface raw water Probable heavy faecal pollution
High High Low content of degradable organics Low content of degradable organic matter
GENERAL REMARKS: Water heavily polluted by inert matter, mostly red coffee soil. Heavy bacterial pollution. Not suitable for domestic consumption without complete treatment.
59

UNIVERSITY OF NAIROBI DEPARTMENT OF CIVIL ENGINEERING
TABLE 4: CHEMICAL AND BACTERIOLOGICAL ANALYSIS
FOR WATER SAMPLES
Sample Description: L. Kyle near dam wall on the surface close to shore
Parameter Result Remarks
pH Apparent colour (°H) True colour (°H) Conductivity Turbidity (F.T.U.) Hardness Ca + + as CaCO.l (mg/1) Hardness total as CaCo.i (mg/l) Total alkalinity as CaC03 (mg/l) Carbonate alkalinity (mg/l) Iron (mg/l) Fluorides (mg/l) Sulphates (mg/l) -Phosphates (mg/l) Silica (mg/l) Dissolved oxygen (p.p.m.) Nitrates (mg/l) Manganese (mg/l) Chlorides (mg/l) Chromium (mg/l) Copper (mg/l) — Total coliform count/100 ml E. coli count/100 ml Volatile solids (mg/l) Total solids (mg/l) Suspended solids (mg/J) Biochemical oxygen demand (mg/l) Chemical oxygen demand (mg/l)
6.9 5
'5 — 3.5 10 36 36 0
' 0.04 0.05 —
0.03 15.6 6.7
0.01 0 40
0.03 0.41 6700
0 — 7 2 0 4
Neutral water Low, o.k. Low, o.k. — V. clear raw water Soft water Soft water Low bicarbonate content Low hydroxide and carbonate content Low, o.k. Low, below optimum — Low, o.k. Low, o.k. Nearly saturated, absence of organics Low Expected result, aeration Low Low Suspected remote industrial pollution Expected result for surface water Faecal pollution absent — Fairly low Fairly low No bio-degradable organics Little quantity of organics
GENERAL REMARKS: Fairly clean raw water with little suspended particle concentration
60

UNIVERSITY OF NAIROBI DEPARTMENT O F CIVIL ENGINEERING
TABLE 5: CHEMICAL AND BACTERIOLOGICAL ANALYSIS
FOR WATER SAMPLES
Sample Description: L. Mcllwaine near police Boating Club, near surface,
about 0.5m from jetty
Parameter Result Remarks
pH Apparent colour (°H) True colour (°H) Conductivity Turbidity (F.T.U.) Hardness Ca++ as CaC03 (mg/1) Hardness Total as CaC03 (mg/1) Total alkalinity as CaC03 (mg/1) Carbonate alkalinity (mg/1) Iron (mg/1) Fluorides (mg/1) Sulphates (mg/1) Phosphates (mg/1) Silica (mg/1) Dissolved oxygen (p.p.m.) Nitrates (mg/1) Manganese (mg/1) Chlorides (mg/1) Chromium (mg/1) Copper (mg/1) Total coliform count/100 ml E. coli count/100 ml Volatile solids (mg/1) Total solids (mg/1) Suspended solids (mg/1) Biochemical oxygen demand (mg/ Chemical oxygen demand (mg/1)
GENERAL REMARKS: Water fairly clear and not coloured — no indication of soil deposits. Would require turbidity removal and chlonnation before domestic consumption
6.9 5 5
20 26 58 60 0
0.06 0.15
0.04 7.5 6.7
0.03 0 82
0.05 0.38
15 6 0 0
Neutral Low, o.k. Low, o.k.
Fair Soft water Soft water Low bicarbonate content Low hydroxide and carbonate content Low, o.k. Low, below optimum
Low, o.k. Low, o.k. Nearly saturated, absence of organics Low Expected result, aeration Low Low Suspected remote industrial pollution
Fairly low Fairly low No bio-degradable organics Organics absent

APPENDIX III CASES REPORTED AND TREATED AT VARIOUS HEALTH CENTRES
90 ©s
90
©\
90 9*
90 0\
M -
Month
Aug.
Sept.
Oct. Nov.
Dec.
Jan.
Feb. Mar. Apr.
May June
July Aug. Sept. Oct. Nov.
Dec.
Jan. Feb. Mar.
Apr. May
June
July Aug.
Sept. Oct. Nov. Dec.
Jan. Feb. Mar. Apr.
May June
July
Aug.
- Sept.
Oct. Nov. Dec.
- Malaria D
M
342
298
309
316 263
335 397 520 537 — — 679 609 525 516 —
403
488 373 752
604
520 627
491 — 394 392 540 — •
400
— — — — — —
—
598
—
865 —
— Diarrhoe
Gategi H/C
D
113 77
24
10 52
93 69 113 150
y
137 93 48 139 106 —
56
110
72 210
94
58 132
110 —
118 124 941 —
92
— - —
— — — —
—
260 •
\ — ; 70 ',
—
al diseases
W
77
60
17
21
66
82 75 154 177 — 72 76 90 121 61 —
128
94
112 115
108
149 266
142 —
109 104 108 —
221
— — — —
— —
— 4
— 137
—
W -
s —
—
—
—
—
, —
— — — — 5 13 19 5 6 —
0
6 1 6
13
1 0
12 —
15 29 0 —
0
— — — — —
-^ —
13 •
—
14 , —
-j Intestinal
M
143 9̂4
289
273 251
259 355 323 318 409 599 837 -837 198 236 328
328
349 382 316
193
370 —
478
312 304 259 406 282
437
— ' 314 326 634 '525 555
398
316
453
301 726
worms
Riakanau H/C
D
10
29
12
7
16
32 12 17 24 19 16 20 20 23 16 24
24
56
30 62
36.
45 —
28
38 78 47 54 44
60 — 67 66 59 125 108
65
169
146 41 98
S — !
W
3
18
10
7
9
18 18 28 9 15 11 20 20 20 16 32
32
39
32 57
17
39 —
48 53 95 59 73 43
50 — 63 83 109 77
96 97
66
67 ' 17
135
s
—
—
—
—
—
0 0 0 0 0 0
0
0
0 0
0
0 _
0 0 0 0 0 0
0
0 0 0 0
0 0
0
0
0 0
Schistosomiasis
62

LOCATED CLOSE TO THE DAMS IN KENYA
M
285 253 272 297 373
459 443 627 321 339 600 530 529 420 283 383 474
492 544 519 547 481 544 946 611 670 425 562 673
878 932 6.54 1033 1031 1573
1299
530 577 480 547 657
Kiritiri
D
45 40 53 43 22
90 97 160 80 66 10 7 8 22 29 21 29
63 47 95 88 59 43 82 45 48 100 96 82
129 90
us 113 90 71 89 7
102
487' 170 179
H/C
W
39 76 70 6 77
97 52 64 54 109 15 34 39 32 19 36 46
43 53 44 31 69 89
138
98 81 86
148 119 166 156 87 166 179 34 112 110 123 123
S
— — — —
—
— — — — 2 0 — 2 0 0 0 0
0 0 0 0 0 1 0 0 0 0 0 0
0 1 0 0 0 0 1 2 0 0 0 0
M
256 275 313 283 207
276 335 337 209 292 290 366 — 304 106 223 —
211 222 204 130 174 289 261 241 284 308 407 353
503 449 392 439 910 800 501 118 —
229 360 —
M:
1)
31 46 24 14 72
67 103 83 52 49 59 76 — 39 44
39
38 20 34 33 32 41 47 56 38 31 62 45
47 36 41 30* 28 42 34 38 —
49 26 —
achanga/HC
W
30-57 39 28 43
58 85 42 28 48 62 89
6 1
22 —
— — 20 5 12 12 13 14 12 7 22 16
17 20 22 10 25 18 12 3 — 7 6 —
S
— — — —
—
— — — — — 0 0 — 0 0 0 —
— 2 0 0 0 1 0 1 0 1 1 2
0 1 0 0 0 0 1 0 —
0 0 —
iM
563 480 521 427 514
532 343 448 290 397 — 480 402 487 501 413 353
475 321 524 404 368 478 446 282 144 — 619 —
498 — 507 — 686 692 769 769 535 482 329 429
Wachoro H / C
D
312 251 308 189 184
195 230 198 64 224 — 312 — 359 341 316 272
283 223 290 » 293 253 281 316 166 5 — 109 —
62 — 134 — 238 287 254 263 217 213 92 104
W
168 166 148 111 138
159 117 165 73 144 — 112 55 115 120 236 106
24 77 3 68 13 124 137 86 16 — 95 —
105 — 78 — 130 120 188 186 123 163 72 91
S
7 4 I 5 5 7
0 3 5 15 0 24 9 0 o 0 —
1 — 28 — 7 60 14 14 6 22 2 0
Dash indicates records not available
63
ENVIRONMENT LIAISON CENTRE
The Environment Liaison Centre (ELC) is an international nongovernmental organization (NGO) established in Nairobi, Kenya, in 1974 by NGOs concerned about environment and development. The hundreds of NGOs which came to the U.N. Conference on the Human Environment in Stockholm in 1972 were a major factor in the convening and success of that meeting. It was during the conference that the ELC was first conceived by NGOs to strengthen communications and cooperation between NGOs around the world and to act as a link with the United Nations Environment Programme (UNEP), headquartered in Nairobi. ELC also works with other intergovernmental organizations and has consultative status with ECOSOC, UNESCO, International Whaling Commission, and Liaison status with FAO.
The ELC is part of the global effort to protect the earth's ecosystems for human health and well being; to promote sustainable utilization and equitable distribution of resources; and to improve human settlements.
Its major objectives are:
• to strengthen NGOs working in the field of environment sustainable development and connected issues, particularly in the Third World, through the provision of information, financial assistance and training.
• to build links between environmental NGOs around the world and between Environmental and Development and other NGOs.
• to facilitate, through two-way communication links, NGO input into and support for the United Nations Environment Programme (UNEP), the United Nations Centre for Human Settlements (UNCHS) and, where appropriate, other intergovernmental organizations.
The centre has 231 member organisations in 66 countries around the world which contribute to its policy decisions. It also maintains contact with over 7000 other groups working on Environmental problems and promoting sustainable development.
P.O. Box 72461 • Telephone 24770 Nairobi, Kenya • Telex 23240 ENVICENTE