
Damping of the Acoustic Vibrations of a Suspended … · Damping of the Acoustic Vibrations of a...
12
1 Supporting Information for: Damping of the Acoustic Vibrations of a Suspended Gold Nanowire in Air and Water Environments Todd A. Major, a Aurélien Crut, b Bo Gao, c Shun Shang Lo, a Natalia Del Fatti, b Fabrice Vallée, b and Gregory V. Hartland a,* a Department of Chemistry and Biochemistry, University of Notre Dame, Notre Dame, IN 46556, USA b Université Lyon 1, CNRS, LASIM, 43 Boulevard du 11 Novembre, 69622 Villeurbanne cedex, France c Radiation Laboratory, University of Notre Dame, Notre Dame, IN 46556, USA * Corresponding author: e-mail [email protected] Electronic Supplementary Material (ESI) for Physical Chemistry Chemical Physics This journal is © The Owner Societies 2012
Transcript of Damping of the Acoustic Vibrations of a Suspended … · Damping of the Acoustic Vibrations of a...

1
Supporting Information for:
Damping of the Acoustic Vibrations of a Suspended Gold Nanowire in Air and
Water Environments
Todd A. Major,a Aurélien Crut,b Bo Gao,c Shun Shang Lo,a Natalia Del Fatti,b Fabrice
Vallée,b and Gregory V. Hartlanda,*
a Department of Chemistry and Biochemistry, University of Notre Dame, Notre Dame, IN
46556, USA
b Université Lyon 1, CNRS, LASIM, 43 Boulevard du 11 Novembre, 69622 Villeurbanne
cedex, France
c Radiation Laboratory, University of Notre Dame, Notre Dame, IN 46556, USA
* Corresponding author: e-mail [email protected]
Electronic Supplementary Material (ESI) for Physical Chemistry Chemical PhysicsThis journal is © The Owner Societies 2012

2
Finite Element Calculations:
The acoustic modes of the nanowires were calculated using the Finite Element
method implemented through the Solid Mechanics module of Comsol Multiphysics
(Version 4.2). The accuracy and speed of these calculations depends on the mesh size,
and for the long nanowires in the present study there is a considerable advantage to
performing the calculations in two dimensions. This strictly corresponds to an infinitely
long nanowire, which is consistent with the analytical results of Equations (1) and (2) of
the main text. The 2D analysis only provides information about vibrational modes that
are symmetric along the axis of the nanowire. However, this is not a problem for the
present studies, as these are the modes that are excited in the transient absorption
experiments. Note that we have previously shown that the frequency of the breathing
mode of a finite circular cylinder is essentially the same as that for an infinite cylinder for
aspect ratios greater than 3,1 which justifies the approach used here.
The calculations were performed using free boundary conditions with elastic
constants of bulk polycrystalline gold, specifically, values of Young’s modulus,
Poisson’s ratio and density of E = 79 GPa, ν = 0.42 and ρ = 19,300 kg/m3, respectively.2
The results from this analysis are presented in scaled frequency units: f/fc where fc is the
frequency of the breathing mode of a circular cylinder. In these calculations the
frequencies were also scaled by the square root of the cross-sectional area, to account for
changes in size as the geometry is changed. Different shapes were considered
corresponding to NWs with equilateral triangular, square, pentagonal, hexagonal and
circular cross-sections.
Electronic Supplementary Material (ESI) for Physical Chemistry Chemical PhysicsThis journal is © The Owner Societies 2012
3
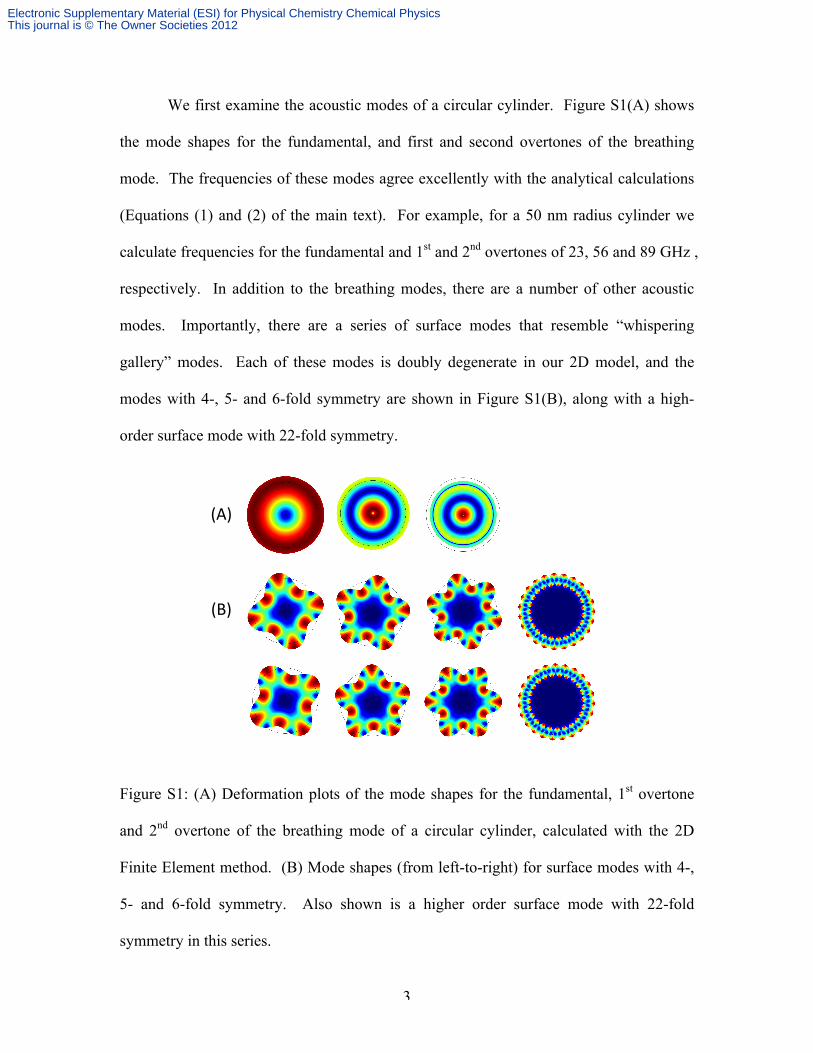
We first examine the acoustic modes of a circular cylinder. Figure S1(A) shows
the mode shapes for the fundamental, and first and second overtones of the breathing
mode. The frequencies of these modes agree excellently with the analytical calculations
(Equations (1) and (2) of the main text). For example, for a 50 nm radius cylinder we
calculate frequencies for the fundamental and 1st and 2nd overtones of 23, 56 and 89 GHz ,
respectively. In addition to the breathing modes, there are a number of other acoustic
modes. Importantly, there are a series of surface modes that resemble “whispering
gallery” modes. Each of these modes is doubly degenerate in our 2D model, and the
modes with 4-, 5- and 6-fold symmetry are shown in Figure S1(B), along with a high-
order surface mode with 22-fold symmetry.
!"#$
!%#$
Figure S1: (A) Deformation plots of the mode shapes for the fundamental, 1st overtone
and 2nd overtone of the breathing mode of a circular cylinder, calculated with the 2D
Finite Element method. (B) Mode shapes (from left-to-right) for surface modes with 4-,
5- and 6-fold symmetry. Also shown is a higher order surface mode with 22-fold
symmetry in this series.
Electronic Supplementary Material (ESI) for Physical Chemistry Chemical PhysicsThis journal is © The Owner Societies 2012

4
Figure S2 shows a plot of the frequencies of the whispering-gallery like acoustic
modes versus mode symmetry (the number of lobes in the deformation plots). The
frequencies have been normalized to the frequency of the fundamental breathing mode.
Note that the 5- and 6-fold symmetry modes are close in frequency to the fundamental
breathing mode. The line is a phenomenological fit to the frequencies of the whispering-
gallery like modes of f fc = 0.17(n+1) , where n is the mode symmetry.
Figure S2: Normalized frequency f/fc versus mode symmetry for the “whispering-gallery”
acoustic modes.
The excitation amplitude of the different modes in the transient absorption
experiments was determined by projecting the initial displacement (assumed to be
isotropic expansion) onto the orthogonal basis of vibrational modes.3,4 For our 2D model,
this is done in Comsol by evaluating for each mode its scalar product with the dilation
field by computing the surface integral (u.x + v.y)dS∫∫ , where (x,y) and (u,v) are the
displacement fields associated to the initial dilation and to the considered normal mode.
The scalar product was normalized by dividing by the norms associated to the two fields
Electronic Supplementary Material (ESI) for Physical Chemistry Chemical PhysicsThis journal is © The Owner Societies 2012
5
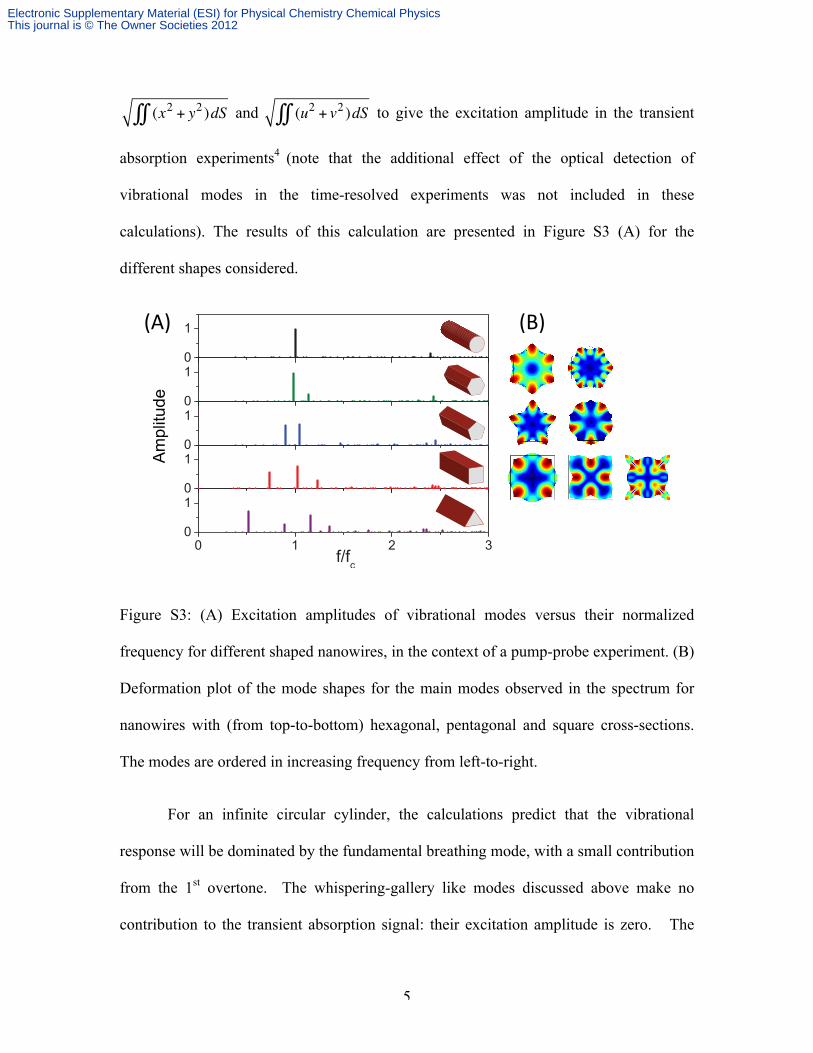
(x2 + y2 )dS∫∫ and (u2 + v2 )dS∫∫ to give the excitation amplitude in the transient
absorption experiments4 (note that the additional effect of the optical detection of
vibrational modes in the time-resolved experiments was not included in these
calculations). The results of this calculation are presented in Figure S3 (A) for the
different shapes considered.
!"#$ !%#$
Figure S3: (A) Excitation amplitudes of vibrational modes versus their normalized
frequency for different shaped nanowires, in the context of a pump-probe experiment. (B)
Deformation plot of the mode shapes for the main modes observed in the spectrum for
nanowires with (from top-to-bottom) hexagonal, pentagonal and square cross-sections.
The modes are ordered in increasing frequency from left-to-right.
For an infinite circular cylinder, the calculations predict that the vibrational
response will be dominated by the fundamental breathing mode, with a small contribution
from the 1st overtone. The whispering-gallery like modes discussed above make no
contribution to the transient absorption signal: their excitation amplitude is zero. The
Electronic Supplementary Material (ESI) for Physical Chemistry Chemical PhysicsThis journal is © The Owner Societies 2012

6
situation is different for the other shapes considered – multiple acoustic modes appear,
with the spectrum becoming more complicated as the symmetry is reduced. The mode
shapes of the main modes that appear in the spectrum are given in Figure S3 (B) for
infinite cylinders with hexagonal, pentagonal and square cross-sections. The modes are
presented from left-to-right in order of increasing frequency.
The modes that appear in the spectrum are clearly hybrid modes that arise from
mixing between the breathing mode and the whispering-gallery like modes that have the
symmetry of the nanowire. The lower frequency mode primarily involves motion at the
apexes and the higher frequency mode involves motion on the faces on the structure. For
the square cross-section there is an additional higher frequency mode in the spectrum that
arises from hybridization between the breathing mode and a more complicated 4-fold
symmetric acoustic mode. It is important to note that the positions of the modes that
appear in the spectrum are determined by the frequencies of the whispering-gallery like
modes that mix with the breathing mode. For example, there is a wider spacing between
modes for the triangular cross-section nanowire, because the 3-fold symmetric
whispering-gallery like mode is much lower frequency than the breathing mode.
Having established the origin of the modes in the transient absorption spectrum,
we now examine the effect of rounding the apexes of the pentagonal structure on the
frequencies and weights of the acoustic modes. This effect was investigated because real
nanowires do not have perfect pentagonal cross-sections: there is some degree of
rounding of the apexes.5 Rounded apexes were created using the “Fillet” command in
Comsol. This is equivalent to placing a circle with radius r at the apex so that it just
touches the edges of the structure, and tracing the line created by the circle and the edges
Electronic Supplementary Material (ESI) for Physical Chemistry Chemical PhysicsThis journal is © The Owner Societies 2012

7
of the structure. For a pentagon, the center of the circle is displaced from the apex by a
distance d = r sin ϕ 2( ) where ϕ = 108° is the angle of the apex. As the radius-of-
curvature increases the shape approaches a circle. The limiting radius-of-curvature
occurs when the d = R , where R is the distance from the center of the pentagon to the
apex. This defines a critical radius-of-curvature rc = Rsin ϕ 2( ) .
Figure 3 of the main text shows the frequencies and weights of the two main
modes versus the relative radius-of-curvature r/rc for a pentagonal nanowire. The
frequencies in Figure 3 are presented as f/fc where fc is the frequency for the circular
cylinder with a radius rc. The frequencies have also been scaled by the square-root of the
area A of the structure ( A πrc2 ), to account for the slight change in size of the object as
the radius-of-curvature at the apexes changes. The weights of the modes in the transient
absorption experiments were calculated using the formalism given above. Mode shapes
are also presented for different values of r/rc.
Experimental Data:
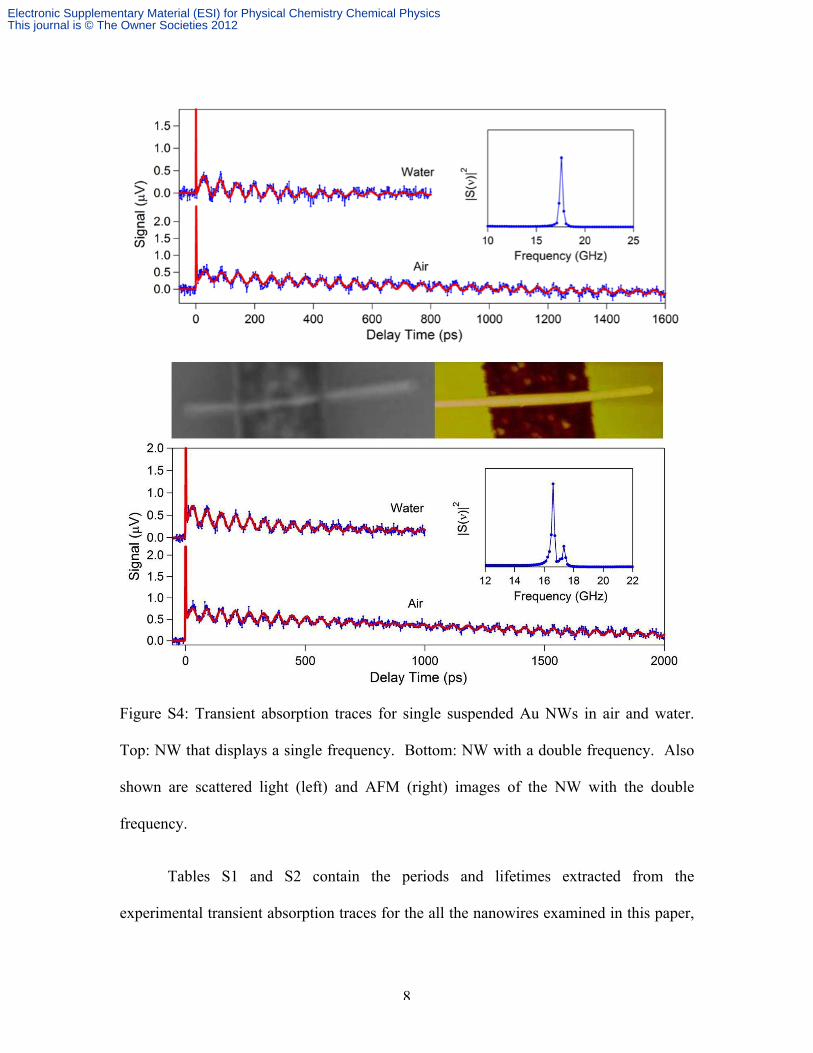
Additional transient absorption traces for suspended Au nanowires are presented
in Figure S4. Examples are given for a NW that displays a single frequency (top) as well
as a NW with a double frequency (bottom). The insets of the Figures show Fourier
Transforms of the modulated portion of the transient absorption data for the nanowires in
air. Scattered light and AFM images of the NW with the double frequency are also
presented, which show that this object is an isolated, single NW. Traces are presented for
both air and water environments.
Electronic Supplementary Material (ESI) for Physical Chemistry Chemical PhysicsThis journal is © The Owner Societies 2012
8
Figure S4: Transient absorption traces for single suspended Au NWs in air and water.
Top: NW that displays a single frequency. Bottom: NW with a double frequency. Also
shown are scattered light (left) and AFM (right) images of the NW with the double
frequency.
Tables S1 and S2 contain the periods and lifetimes extracted from the
experimental transient absorption traces for the all the nanowires examined in this paper,
Electronic Supplementary Material (ESI) for Physical Chemistry Chemical PhysicsThis journal is © The Owner Societies 2012

9
see main text for details. Fits to the transient absorption data were performed using Igor
Pro (Version 6.02a).
Table S1: Periods (Tbr) and lifetimes (τbr) for nanowires with a single vibrational period in air, on glass, and in water.
Table S2: Periods (Tbr) and lifetimes (τbr) for suspended nanowires with two vibrational periods in air and in water.
Absorption Cross-Section Calculations and Laser Induced Heating:
Low powers were used in these experiments to avoid damaging the nanowires.
This is especially important in this study, because the same wire must be interrogated in
different environments to extract the effect of the environment on vibrational damping.
Wire # Diameter
(nm) Air Glass Water
Tbr (ps) τbr (ps) Tbr (ps) τbr (ps) Tbr (ps) τbr (ps)
1 135 ± 5 52.8 ± 0.8 1380 ± 80 54.6 ± 0.2 520 ± 80 *** *** 2 50.8 ± 0.3 1830 ± 120 52.0 ± 0.2 630 ± 70 *** *** 3 55.7 ± 0.3 730 ± 80 55.6 ± 0.2 770 ± 50 *** *** 4 53.5 ± 0.3 2200 ± 300 56.5 ± 0.2 370 ± 30 *** *** 5 104 ± 5 42.0 ± 0.1 1460 ± 80 41.4 ± 0.1 500 ± 20 42.0 ± 0.1 340 ± 20 6 55.1 ± 0.1 1660 ± 30 57.0 ± 0.1 340 ± 30 55.5 ± 0.1 610 ± 20 7 56.7 ± 0.3 1700 ± 200 60.8 ± 0.1 430 ± 30 57.4 ± 0.5 450 ± 30 8 56.6 ± 0.1 1010 ± 50 58.2 ± 0.1 400 ± 30 56.7 ± 0.1 390 ± 30
Wire #
Diameter (nm) Air Water
Tbr (ps) τbr (ps) Tbr (ps) τbr (ps)
9 159 ± 5 63.1 ± 0.3 66.9 ± 0.3
2900 ± 500 1900 ± 200 65.8 ± 0.2 240 ± 20
10 145 ± 5 58.0 ± 0.1 60.3 ± 0.1
1900 ± 400 2000 ± 200 60.0 ± 0.1 500 ± 40
11 54.6 ± 0.2 57.1 ± 0.2
2000 ± 500 1400 ± 200
12 63.2 ± 0.2 66.0 ± 0.2
1700 ± 300 1100 ± 200 64.8 ± 0.2 440 ± 40
13 62.1± 0.8 65.1± 0.8
1700 ± 400 5000 ± 2000 64.5 ± 0.2 360 ± 30
Electronic Supplementary Material (ESI) for Physical Chemistry Chemical PhysicsThis journal is © The Owner Societies 2012
10
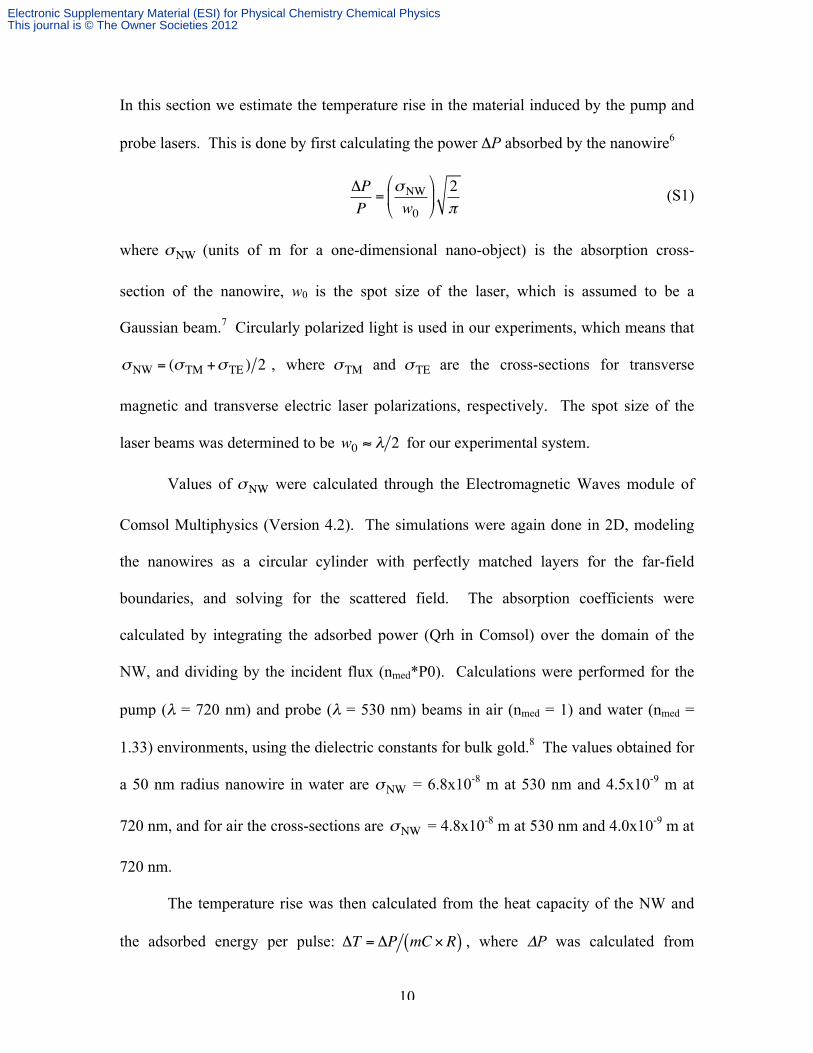
In this section we estimate the temperature rise in the material induced by the pump and
probe lasers. This is done by first calculating the power ΔP absorbed by the nanowire6
ΔPP
=σNWw0
"
#$
%
&'2π
(S1)
where σNW (units of m for a one-dimensional nano-object) is the absorption cross-
section of the nanowire, w0 is the spot size of the laser, which is assumed to be a
Gaussian beam.7 Circularly polarized light is used in our experiments, which means that
σNW = (σTM +σTE ) 2 , where σTM and σTE are the cross-sections for transverse
magnetic and transverse electric laser polarizations, respectively. The spot size of the
laser beams was determined to be w0 ≈ λ 2 for our experimental system.
Values of σNW were calculated through the Electromagnetic Waves module of
Comsol Multiphysics (Version 4.2). The simulations were again done in 2D, modeling
the nanowires as a circular cylinder with perfectly matched layers for the far-field
boundaries, and solving for the scattered field. The absorption coefficients were
calculated by integrating the adsorbed power (Qrh in Comsol) over the domain of the
NW, and dividing by the incident flux (nmed*P0). Calculations were performed for the
pump (λ = 720 nm) and probe (λ = 530 nm) beams in air (nmed = 1) and water (nmed =
1.33) environments, using the dielectric constants for bulk gold.8 The values obtained for
a 50 nm radius nanowire in water are σNW = 6.8x10⁻⁸ m at 530 nm and 4.5x10⁻⁹ m at
720 nm, and for air the cross-sections are σNW = 4.8x10⁻⁸ m at 530 nm and 4.0x10⁻⁹ m at
720 nm.
The temperature rise was then calculated from the heat capacity of the NW and
the adsorbed energy per pulse: ΔT = ΔP mC ×R( ) , where ΔP was calculated from
Electronic Supplementary Material (ESI) for Physical Chemistry Chemical PhysicsThis journal is © The Owner Societies 2012
11
Equation (S1), R is the repetition rate of the laser (80 MHz), C is the specific heat of Au
(0.129 J g-1 K-1) and m is the mass of the irradiated portion of the nanowire. The mass is
given by m = πr2 2w0( )ρ , where ρ is the density of gold (19.3x10⁶ g/m3), r is the
radius of the nanowire and 2w0 is the diameter of the equivalent top hat beam. Using
energies per pulse of P R = 5 pJ for the pump beam 0.1 pJ for the probe beam, we
calculate a temperature rise in the NW of less than 10 K (5K from the pump beam and 2
K from the probe beam) for r = 50 nm. The energies per pulse at the sample were
estimated by measuring the power of the laser just before the microscope, and after the
pump and probe had been re-collimated by the second objective, in order to account for
optical losses through the focusing objective. The calculated temperature rises are very
small, and indicate that the NWs should not be damaged during our experiments.
Electronic Supplementary Material (ESI) for Physical Chemistry Chemical PhysicsThis journal is © The Owner Societies 2012

12
References:
1 A. Crut, P. Maioli, N. Del Fatti and F. Vallée, Phys. Chem. Chem. Phys., 2009, 11,
5882-5888.
2 G. Simmons and H. Wang, Single Crystal Elastic Constant and Calculated Aggregate
Properties: A Handbook, 2nd Ed. The M.I.T. Press: 1971
3 M. Hu, X. Wang, G. V. Hartland, P. Mulvaney, J. P. Juste and J. E. Sader, J. Am.
Chem. Soc. 2003, 125, 14925-14933.
4 A. Crut, V. Juvé, D. Mongin, P. Maioli, N. Del Fatti and F. Vallée, Phys. Rev. B,
2011, 83, 205430.
5 K. Critchley, K. P. Khanal, M. L. Gorzny, L. Vigderman, S. D. Evans, E. R. Zubarev,
and N. A. Kotov, Adv. Mater. 2010, 22, 2338-2342.
6 C. R. Carey, T. Lebel, D. Crisostomo, J. Giblin, M. Kuno and G. V. Hartland, J. Phys.
Chem. C, 2010, 114, 16029-16036.
7 A. E. Siegman, Lasers, University Science Books, 1986.
8 P. B. Johnson and R. W. Christy, Phys. Rev. B 1972, 6, 4370-4379.
Electronic Supplementary Material (ESI) for Physical Chemistry Chemical PhysicsThis journal is © The Owner Societies 2012


