DairyBase/media/DairyBase/0240...future comparative analysis should Dairy Australia choose to use...
12
DairyBase Expert user guide
Transcript of DairyBase/media/DairyBase/0240...future comparative analysis should Dairy Australia choose to use...
DairyBaseExpert user guide

Disclaimer
Whilst all reasonable efforts have been taken to ensure the accuracy of
DairyBase Expert User Guide, use of the information contained herein is
at one’s own risk. To the fullest extent permitted by Australian law, Dairy
Australia disclaims all liability for any losses, costs, damages and the like
sustained or incurred as a result of the use of or reliance upon the
information contained herein, including, without limitation, liability stemming
from reliance upon any part which may contain inadvertent errors, whether
typographical or otherwise, or omissions of any kind.
© Dairy Australia Limited 2015. All rights reserved.
ISBN 978-1-925347-02-9
DairyBase expert user guide 3
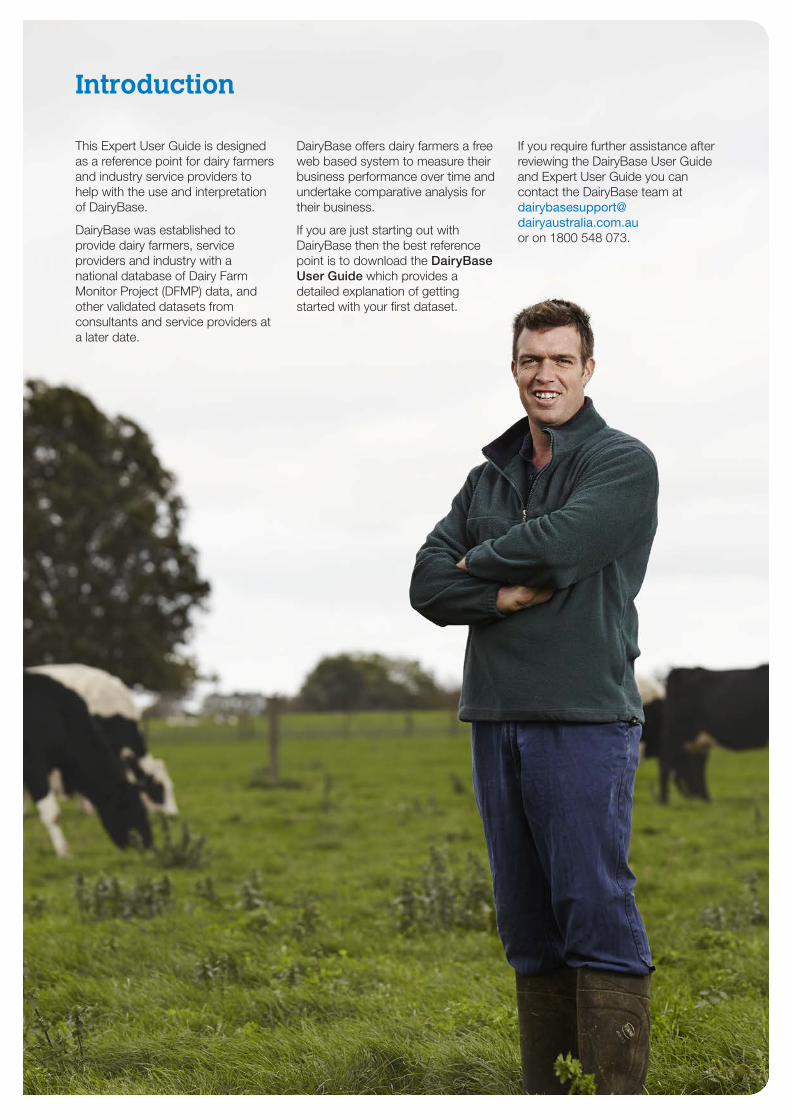
Introduction
This Expert User Guide is designed as a reference point for dairy farmers and industry service providers to help with the use and interpretation of DairyBase.
DairyBase was established to provide dairy farmers, service providers and industry with a national database of Dairy Farm Monitor Project (DFMP) data, and other validated datasets from consultants and service providers at a later date.
DairyBase offers dairy farmers a free web based system to measure their business performance over time and undertake comparative analysis for their business.
If you are just starting out with DairyBase then the best reference point is to download the DairyBase User Guide which provides a detailed explanation of getting started with your first dataset.
If you require further assistance after reviewing the DairyBase User Guide and Expert User Guide you can contact the DairyBase team at dairybasesupport@ dairyaustralia.com.au or on 1800 548 073.
4
Creating datasets for other users
DairyBase has been designed so that industry service providers can create datasets on behalf of dairy farmers and dairy farmers can share their datasets with service providers.
In order to create a dataset for a dairy farmer the farmer will first need to assign authority of their individual Farm ID to the service provider. To assign authority the dairy farmer will first need to register and login to DairyBase via Salesforce.
The process for assigning authority in DairyBase will become automated in that the authority allocations will be made by each individual user and thus a farmer will be able to assign edit authority for their dataset to a service provider within DairyBase. This process however is still being finalised so in the meantime the allocation of datasets between users will be done by the DairyBase support team.
In order to obtain authority to create a dataset for a farmer the farmer will first need to contact the DairyBase support team at [email protected] or on 1800 548 073 to request that the designated service provider have access to create a dataset for their Farm ID. The support team will then manually load this access.
Once the Farm ID has been identified, you then select ‘Create a dataset’ at the top of the screen and select the Farm ID that relates to that farm to create the new dataset. The step by step process for creating a dataset can be found in the DairyBase User Guide.
If you are going to have access to multiple farms within DairyBase you might find it easier to include the farm or owners name in the dataset name to make each dataset more easily identifiable.
It is important for dairy farmers and service providers to ensure they identify whether datasets are Actual or Not Actual years as this will determine their possible use in future comparative analysis should Dairy Australia choose to use additional datasets over and above the Dairy Farm Monitor Project. If at a later date Dairy Australia decide to utilise some validated datasets from service providers in the comparative analysis, they will only use datasets that are assigned as Actual years and not those that are Not Actual years.
Creating and filtering datasets
DairyBase expert user guide 5
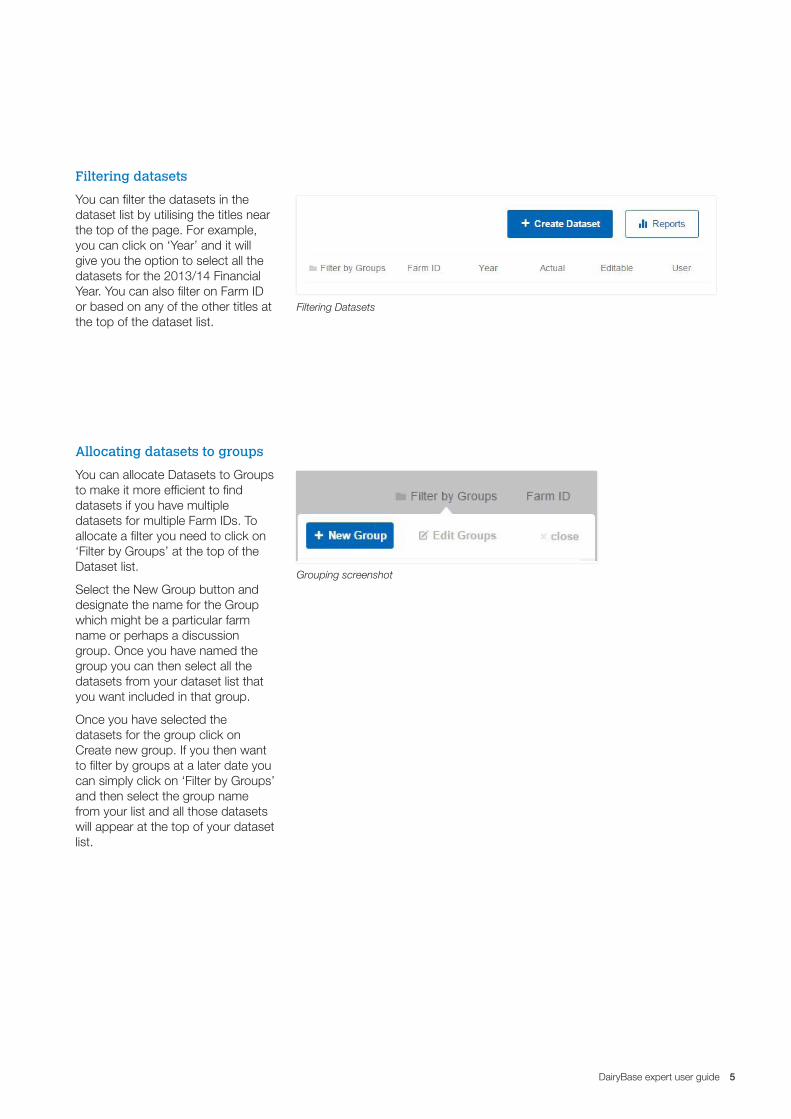
Filtering datasets
You can filter the datasets in the dataset list by utilising the titles near the top of the page. For example, you can click on ‘Year’ and it will give you the option to select all the datasets for the 2013/14 Financial Year. You can also filter on Farm ID or based on any of the other titles at the top of the dataset list.
Filtering Datasets
Grouping screenshot
Allocating datasets to groups
You can allocate Datasets to Groups to make it more efficient to find datasets if you have multiple datasets for multiple Farm IDs. To allocate a filter you need to click on ‘Filter by Groups’ at the top of the Dataset list.
Select the New Group button and designate the name for the Group which might be a particular farm name or perhaps a discussion group. Once you have named the group you can then select all the datasets from your dataset list that you want included in that group.
Once you have selected the datasets for the group click on Create new group. If you then want to filter by groups at a later date you can simply click on ‘Filter by Groups’ and then select the group name from your list and all those datasets will appear at the top of your dataset list.

6
Editing datasets
For assistance with editing your first dataset please use the DairyBase User Guide.
How to handle changes to land areas throughout the financial year
DairyBase utilises the Usable Area and Milking Area from the Land Resources tab to complete calculations throughout the App and in the final reports. On this basis the areas entered in the Land Tab need to reflect the average positon for the farm for that financial year. If there have been changes to the land areas throughout the year either through sales, purchases, changes
to lease areas or the transfer of areas between milking and support these need to be reflected in the areas entered in the Land Tab.
The best way to work out the land areas to utilise is by calculating it on a weighted average basis so working out when the change in land area occurred and thus for
what period of the twelve months the change was in place.
Below is a worked example of a farm where they purchased land during the year and also relinquished a lease block as a result of the purchase.
Example 1
A dryland farm purchased an additional 100 hectares on January 1 and relinquished a lease of 70 hectares on April 1.
Hectares Areas at 1 July Areas at 1 January Areas at April 1 Land Areas to use in DairyBase
Total Owned Area 210 310 310 260
Total Leased Area 72 72 0 54
Total Available Area 282 382 310 314
Total Usable Area 265 360 294 296
Total Unusable Area 17 22 16 18
Milking Area 205 215 215 210
Support Area 60 145 79 86
To calculate the areas to use in DairyBase shown in the final column you work on the opening areas being used for 6 out of 12 months (50%) as they remain unchanged until January 1. The areas shown in the January 1 and April 1 columns were each used for 9 out of 12 months (so 25%) of the year.
DairyBase expert user guide 7
Generating reports
Exporting and importing data
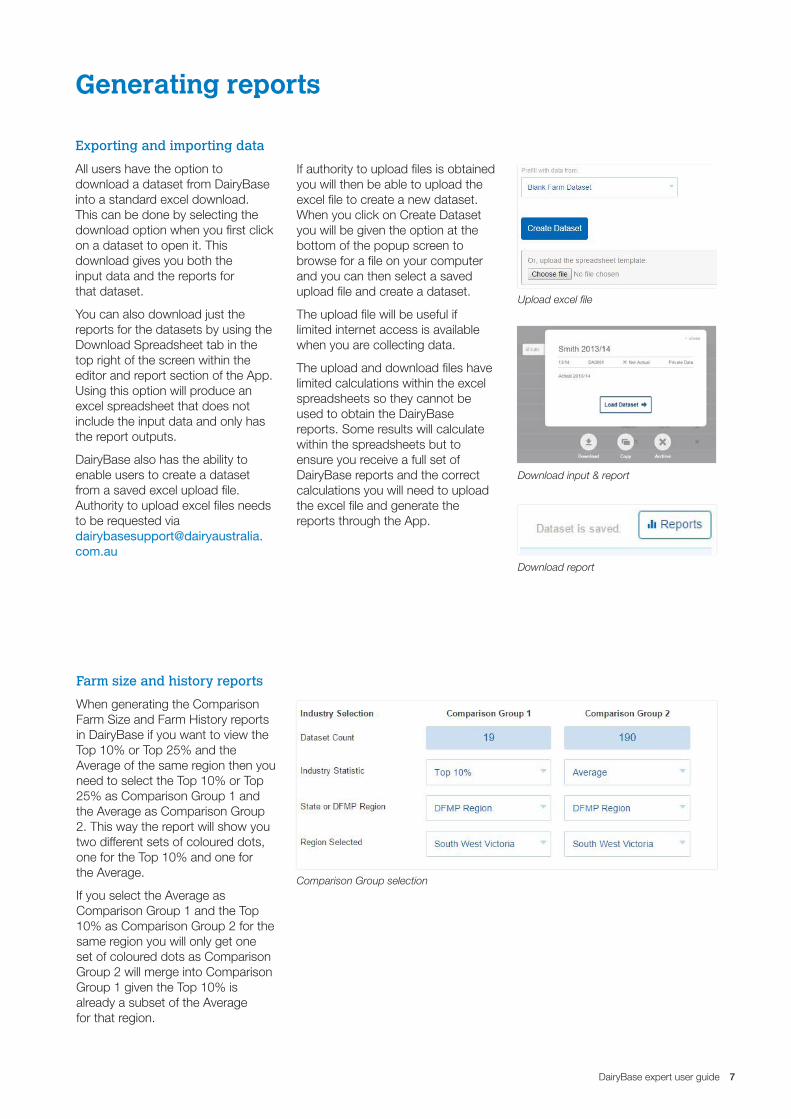
All users have the option to download a dataset from DairyBase into a standard excel download. This can be done by selecting the download option when you first click on a dataset to open it. This download gives you both the input data and the reports for that dataset.
You can also download just the reports for the datasets by using the Download Spreadsheet tab in the top right of the screen within the editor and report section of the App. Using this option will produce an excel spreadsheet that does not include the input data and only has the report outputs.
DairyBase also has the ability to enable users to create a dataset from a saved excel upload file. Authority to upload excel files needs to be requested via [email protected]
If authority to upload files is obtained you will then be able to upload the excel file to create a new dataset. When you click on Create Dataset you will be given the option at the bottom of the popup screen to browse for a file on your computer and you can then select a saved upload file and create a dataset.
The upload file will be useful if limited internet access is available when you are collecting data.
The upload and download files have limited calculations within the excel spreadsheets so they cannot be used to obtain the DairyBase reports. Some results will calculate within the spreadsheets but to ensure you receive a full set of DairyBase reports and the correct calculations you will need to upload the excel file and generate the reports through the App.
Download input & report
Download report
Upload excel file
Comparison Group selection
Farm size and history reports
When generating the Comparison Farm Size and Farm History reports in DairyBase if you want to view the Top 10% or Top 25% and the Average of the same region then you need to select the Top 10% or Top 25% as Comparison Group 1 and the Average as Comparison Group 2. This way the report will show you two different sets of coloured dots, one for the Top 10% and one for the Average.
If you select the Average as Comparison Group 1 and the Top 10% as Comparison Group 2 for the same region you will only get one set of coloured dots as Comparison Group 2 will merge into Comparison Group 1 given the Top 10% is already a subset of the Average for that region.
8
DairyBase calculations and assumptions
Milk production
DairyBase includes a default calculation for milk not sent to the factory based on an assumption around the quantity fed to calves and the quantity of waste milk. This quantity of milk is then included in the energy requirements for the milking herd which is in turn used in pasture harvest calculations.
Feed per cow calculations
The feed quantities per cow are based on the total quantities fed on the milking area only divided by the number of cows milked and does not include feed fed on the support area.
Livestock energy calculations
DairyBase factors in the energy requirements for growth, maintenance, activity, pregnancy and milk production.
These energy requirements are influenced by the terrain and distance walked along with the size, breed and age of each livestock class and the level of milk production per cow. These energy requirements are utilised in the Pasture Harvest calculation.
Pasture energy
DairyBase assumes the energy for pasture on the milking platform is 11 megajoules of energy per kilogram of dry matter whilst pasture on the support area has 10 megajoules of energy per kilogram of dry matter.
Pasture harvest
DairyBase factors in all the energy requirements for each livestock class and the energy obtained from the different feeds fed when calculating pasture harvest.
DairyBase works off the default energy for each feed which matches the DFMP defaults unless the user overrides these default energy values in which case the updated energy values are utilised.
The data collected in the livestock and feed tabs is utilised to determine the pasture harvest on the milking area versus on the support area and usable area. The time spent on milking area, support or agistment for each livestock class in the livestock tab determines the energy demand for each group on each area. This is then combined with the information in the feed tabs about the quantities of each feed fed either on the milking area or support area to determine the pasture harvest on each area.
Feed inventory
DairyBase calculates the value of opening and closing inventory of feed in the assets tab by utilising the opening and closing quantities of each feed type provided by the user for each individual dataset.
The value for opening and closing feed inventory is based on the following rule for each individual feed.
If a quantity of the feed type (concentrate, silage, hay or other) was purchased in that financial year then the value of the purchased feed will be utilised as both the opening and closing value for that particular feed type.
For example, if you purchased 50 tonne dry matter of silage during the financial year for $300 per dry tonne then this is the value that will be attributed to both the opening and closing silage quantities on hand. This is the case, even if the opening or closing quantity were actually quantities that were conserved on the farm for a different cost to the purchase price.
If there are no purchases for a particular feed type then the value attributed to the opening and closing quantities will be based on the values designated by the DFMP each year for each region. These values are based on the hay and grain report average for each region.
For example, if you had opening and closing quantities of silage on hand but you did not purchase any throughout the year as it was all home grown, then the value attributed to the opening stock will be based on the value allocated by the DFMP for opening stock and the value for the closing stock will be based on a different closing value allocated by the DFMP for silage for that financial year.

DairyBase expert user guide 9
10
Glossary of terms
Cash table
Total Farm Cash Income The total of net milk income, net livestock sales, feed sales and other farm income
Total Herd Costs The total of herd costs including AI and Herd Test, Animal Health and Calf Rearing
Total Shed Costs The total of dairy shed costs including electricity and dairy supplies such as rubberware and filter socks
Total Feed Costs The total of feed costs including purchased (concentrates, silage, hay, other and agistment) and home grown feed (fertiliser, irrigation, hay and silage making, fuel, pasture and crop costs)
Total Variable Costs The total of herd, shed and feed costs
Total Cash Overhead Costs The total of all overhead costs that have a cash cost to the business. This includes employed labour costs, repairs and maintenance, rates, insurance and other administration costs such as accounting, consultants, telephone etc
Total Farm Working Expenses The total of all variable and cash overhead costs
Farm Operating Cash Surplus This is calculated from total farm cash income less total farm working expenses
Total Finance Costs The total of all interest paid on farm related debt and lease payments on farm land (for a lease that is longer than 12 months)
Total Capital and Principal Costs The total of livestock purchases, other capital purchases (net) and loan principal repayments
Net Farm Cash Flow Before Tax and Drawings This is calculated from the Farm Operating Cash Surplus less total finance costs, capital purchases and principal repayments
Net Cash Flow Before Tax This is calculated from Net Farm Cash Flow Before Tax and Drawings less any Non-Farm Cash Income and the owner/operator drawings
Profit table
Gross Farm Income This is the total farm income, including cash and non-cash income (feed and livestock inventory changes)
Total Variable Costs The total of herd, shed and feed costs. This is the same as in the Cash Report given there are no non-cash expenses in the variable costs
Gross Margin Gross Farm Income less Total Variable costs
Total Operating Costs This is the total of all variable costs and total overhead costs (cash and non-cash)
Cost of Production (COP) This is calculated from milk income less Earnings Before Interest and Tax. It thus factors in all the variable and overhead costs (cash and non-cash) plus feed and livestock inventory changes over the year. This shows the net cost of producing one kilogram or one litre of milk.
Earnings Before Interest and Tax (EBIT) This is calculated from gross farm income minus total variable costs and total overhead costs (cash and non-cash). EBIT shows the profit available to fund debt servicing (interest), lease payments, principal reductions, capital improvements and growth in the business owners wealth.
Total Finance Costs The total of all interest paid on farm related debt and lease payments on farm land (for a lease that is longer than 12 months)
Net Farm Income This is calculated from Earnings Before Interest and Tax less total finance costs (interest and lease)

DairyBase expert user guide 11
Wealth table
Total Current Assets The average value of the current farm assets from the tax accounts over the year, using the opening and closing values. This includes cash, farm management deposits, feed inventory and accounts receivable (trade debtors)
Total Non-Current Assets The average market value of the owned non-current farm assets, using the opening and closing market values. This includes land, water, livestock, plant and equipment and other farm assets
Total Farm Assets Owned The average value of the total owned farmed assets, both current and non-current
Return on Assets This is calculated from Earnings Before Interest and Tax divided by the Total Farm Assets Owned. Return on Assets describes how well the farm business has used its owned assets to generate a profit
Leased Assets The average value of the total leased assets over the year, including any land, water or plant and equipment
Total Assets Managed The average value of the owned and leased farm assets over the year
Return on Total Assets (ROTA) This is calculated from Earnings Before Interest and Tax (EBIT) divided by the total farm assets under management of the farm business, including both owned and leased assets. Return on Total Assets describes how well the farm business has used its owned and leased assets to generate a profit
Total Current Liabilities The average value of current farm liabilities from the tax accounts over the year, using the opening and closing values. This includes accounts payable (trade creditors) and overdraft balances
Total Non-Current Liabilities The average value of the non-current farm liabilities (loans) over the year, using the opening and closing values. This includes Equipment Liabilities and Long Term Liabilities
Total Liabilities Average of the total farm liabilities over the year, using the opening and closing values
Total Equity This is calculated from Total Farm Assets owned less Total Liabilities. This shows the total average value of capital invested in the farm business by the owner/operator(s)
Equity as % of Owned Assets This is the Average Equity as a % over the year which is calculated from Total Farm Assets Owned less Total Liabilities divided by Total Farm Owned Assets
Return on Equity This is calculated from Net Farm Income divided by Total Equity. Return on Equity demonstrates the return being received by the business owners for their level of investment in the business

12
Dairy Australia Limited ABN 60 105 227 987
Level 5, IBM Centre60 City Road, Southbank VIC 3006 AustraliaT + 61 3 9694 3777 F + 61 3 9694 3701E [email protected]
0240
| Ju
l 201
5