DairyBase - DairyNZ - DairyNZ · Level 2 - Physical Detail Questionnaire DairyBase Farm ......
12
www.dairybase.co.nz Version 3 August 2012 Level 2 - Physical Detail Questionnaire DairyBase Farm business name: Client name: Season: DairyBase ID # Completing the level two physical questionnaire will enable the generation of a level two physical detail report which is a two page report. Page One: Physical Detail A Report Available by completing sections 9-19 of this questionnaire. These sections are compulsory to complete. Page Two: Physical Detail B Report Available by completing sections 20-23 of this questionnaire These sections are optional to complete (but sections 9-19 must still be completed) Before level two physical information can be committed and a report generated a DairyBase Level One Questionnaire must also be completed (sections 1-9). If you have not already completed this questionnaire or do not have a copy, contact the rural professional you are working with through DairyBase or download from www.dairybase.co.nz Tips for completing this questionnaire: 1. Utilise information in shaded light orange sections for suggestion on where to source answers and further clarification on what the question is asking 2. If information is lacking to complete question use the default option (where available) 3. If you are having trouble or get stuck on a question, move on and come back to it 4. Utilise your DairyBase rural professional to assist or contact DairyBase on 0800 4 DairyNZ Once this questionnaire is completed return to your rural professional.
Transcript of DairyBase - DairyNZ - DairyNZ · Level 2 - Physical Detail Questionnaire DairyBase Farm ......
www.dairybase.co.nz Version 3 August 2012
Level 2 - Physical Detail Questionnaire
DairyBase
Farm business name:
Client name: Season: DairyBase ID #
Completing the level two physical questionnaire will enable the generation of a level two physical detail report which is a two page report.
Page One: Physical Detail A Report
Available by completing sections 9-19 of this questionnaire.
These sections are compulsory to complete.
Page Two: Physical Detail B Report
Available by completing sections 20-23 of this questionnaireThese sections are optional to complete (but sections 9-19 must still be completed)
Before level two physical information can be committed and a report generated a DairyBase Level One Questionnaire must also be completed (sections 1-9). If you have not already completed this questionnaire or do not have a copy, contact the rural professional you are working with through DairyBase or download from www.dairybase.co.nz
Tips for completing this questionnaire:
1. Utilise information in shaded light orange sections for suggestion on where to source answers and further clarification on what the question is asking
2. If information is lacking to complete question use the default option (where available)
3. If you are having trouble or get stuck on a question, move on and come back to it
4. Utilise your DairyBase rural professional to assist or contact DairyBase on 0800 4 DairyNZ
Once this questionnaire is completed return to your rural professional.
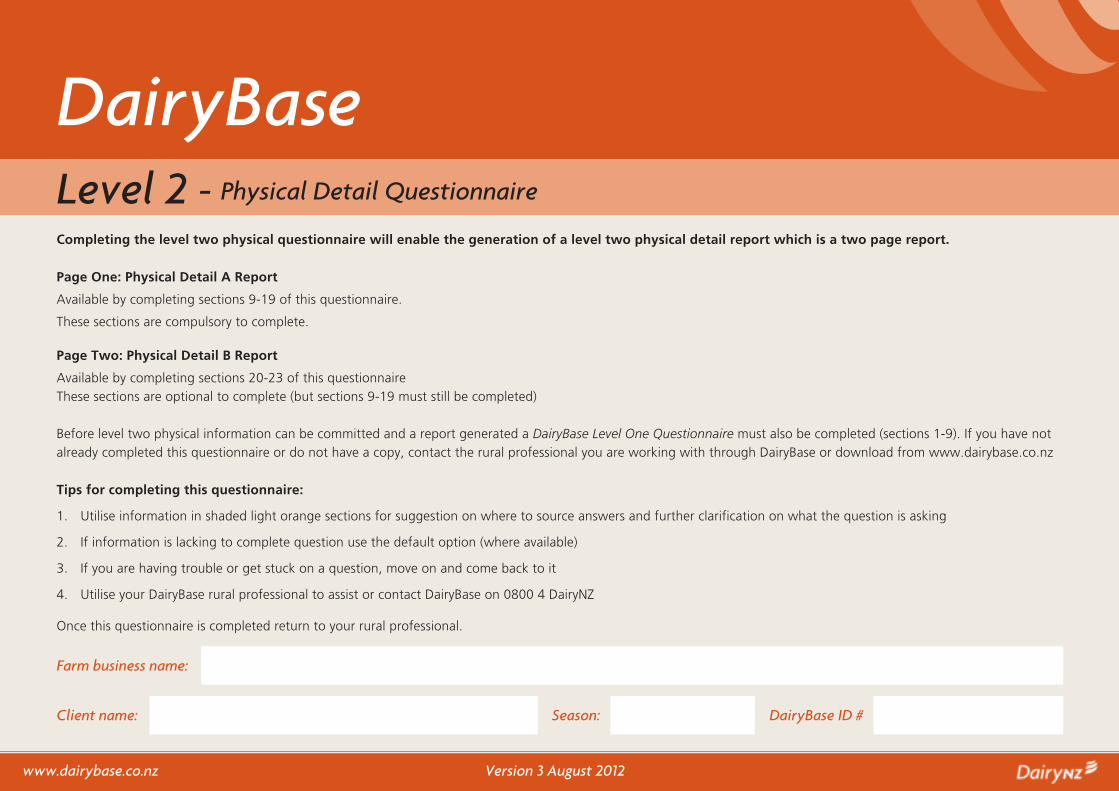
Section 10 – Physical Description – These values influence the maintenance requirements of the cow and are used in the energy calculations – Required information
Distance from farm dairy to furthest paddock (km) Estimate from farm map if available
% of farm at a different height/altitude to farm dairy Only needed if a significant portion of the farm is hilly or if the cows have a significant
climb to/from the farm dairyAverage difference in height between farm dairy and hill paddocks (m)
Section 9 – Farm description – Required information (sections 1 to 8 are covered in the Level 1 Questionnaire)
Farm Dairy Type (please circle) Number of sets of cups
Shed 1 (H = Herringbone, R = Rotary, Other) H R Other
Shed 2 (H = Herringbone, R = Rotary, Other) H R Other
Shed 3 (H = Herringbone, R = Rotary, Other) H R Other
Rainfall for season (mm) Enter if measured otherwise district average used
Section 11 – Stock Description – Values from this section appear in the report under ‘Physical Description’ and are used in energy calculations, as well as being a useful indicators in their own right – Required information
Cow LWT kg (Dec 1)
Jersey 75% Jersey J12F4
75% Friesian F12J4
Average Crossbred Friesian Holstein
Friesian
370-390 400-440 440-470 445 470-500 510-610
Or estimate from NZ Animal Evaluation Ltd (NZAEL) Lwt BV using below formulaAverage herd Lwt = 503kg + Lwt BV x 95% (if average producing herd)
x 85-90% (if low producing herd)x 100% (if high producing herd)
Herd Reliability LIC / CRV BW / Circle LIC or CRV to indicate the source of the BW.Available from group profile report (printed July/August) with all replacement 2 year olds included. If not available use first herd test report. For more information on animal evaluation visit http://www.aeu.org.nz/. If values not known leave blankHerd PW/Reliability
PW /
Nitrogen (N) applied to the effective area onlyKg or Kg/ha Please circle appropriate units
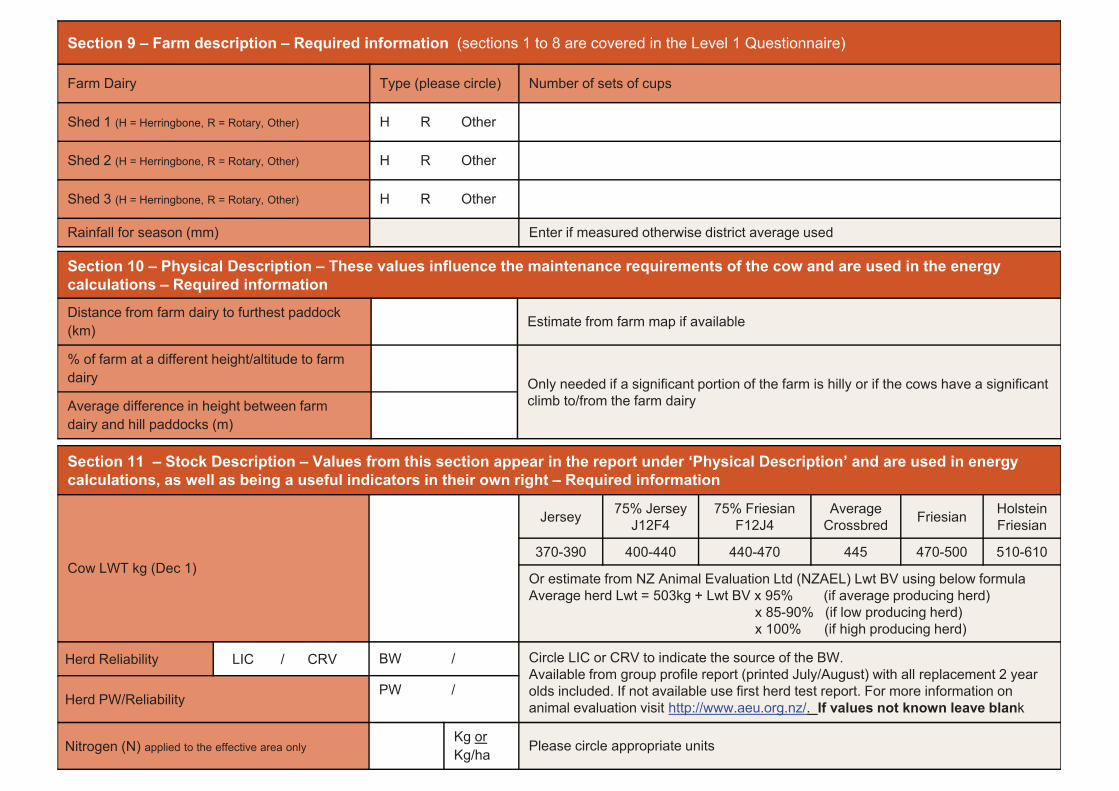
Section 12 – Milk Production – This section captures all milk output from herd (except colostrum) whether saleable or not to gain greater accuracy to estimate the energy requirements. Per cow daily production at peak and at end of December are used to calculate monthly drop off from peak which can be an indicator of loss of pasture quality – Required information
Litres of milk fed to calves (Number of calves x litres/calf/day x no. days)
Includes sick cow milk and saleable milk taken from vat and fed to both replacement & non-replacement calves (do not include colostrum milk). For a 25% replacement rate, for calves fed for 8 weeks, approximately 25% of their feed will come from colostrum so adjust number of days fed out of the vat
Complete calculation table below if total not known - include replacement & non-replacement calves reared; exclude colostrum milk fed to calves
Number of calves reared Estimated litres of milk/calf/day(sick cow milk and saleable milk only) Number of days fed milk
Spring
Autumn
Discarded milk solids (kg)(Number of cows x days withheld x av. Kg MS/cow/day)
Discarded milk solids e.g. from sick cows disposed of and NOT fed to calves. If sick cow milk is fed to calves only count treated cows from date calves stopped being fed sick milk so you do not double up. Refer to animal treatment records for number of cows treated and withholding period. Use average if different treatments have different withholding lengths e.g. 150 cows x 6 days x 1.6 kgMS = 1440 kgMS
Average daily milk solids per cow for 10 days at peak (kg)
Peak period is when the highest daily per cow production is achieved. Take into consideration that not all cows may have calved and some milk may also be going to the calves. So the milk statement may not always reflect peak per cow production.Refer to milk company statements and daily records as a starting point
Last date of 10 day peak If peak was on 10 Oct then the last day of 10 day peak would be 15 Oct ie 5 days after peak
Milk solids to 31 Dec sold to factory Refer to December dairy company statement under season to date production or dairy company website 1 Jun to 31 Dec production
Average daily milk solids per cow for last 10 days in December (kg)
Refer to December dairy company statement or website for daily production. Work out by dividing average daily milk solids for last 10 days in December by number of cows milking at 31 Dec

Section 13 – Days in Milk (DIM) – A useful indicator of herd performance and used in the energy calculation. DIM is reported under ‘Milk Production’ – Required information
HINT: Days in Milk is heavily influenced by when 50% of the cows calved and when cows dried offFocus on getting accuracy with 1. Date 50% of cows calved2. Date and number of cows dried off (if herd had staggered dry off, record each dry off date separately)
Spring Autumn
Number of cows calving This should include all cows calving from 1 Jun to 31 Dec for spring calving and 1 Jan to 31 May for autumn calving. Information can be obtained for calving report
Date when 50% of cows calved
Information can be obtained from calving report or yellow note book. If yellow note book is being used, count cows until you reach 50% of cows and use that date or mean calving date from calving report and subtract 5 days
Days in milk per cow
Average days in milk for herd. If known enter in value cell, if not known complete Days in milk table (section 14a) on the following page.A separate table must be completed for spring and autumn
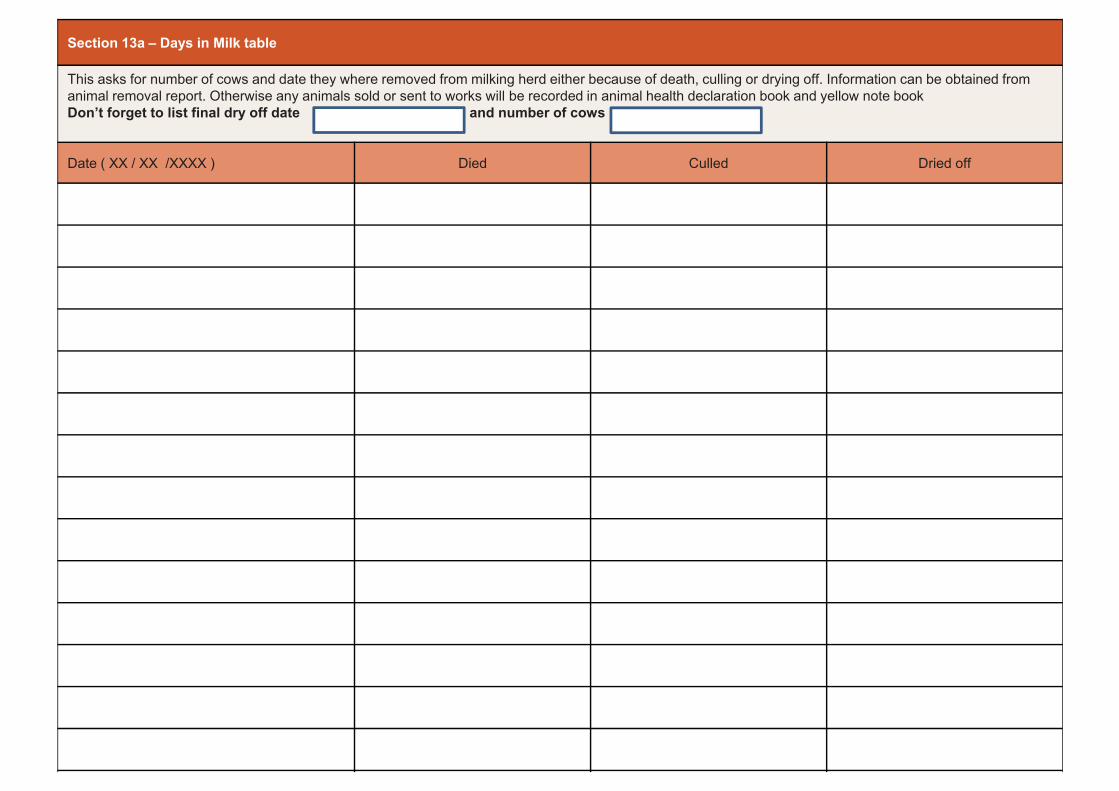
Section 13a – Days in Milk table
This asks for number of cows and date they where removed from milking herd either because of death, culling or drying off. Information can be obtained from animal removal report. Otherwise any animals sold or sent to works will be recorded in animal health declaration book and yellow note bookDon’t forget to list final dry off date and number of cows
Date ( XX / XX /XXXX ) Died Culled Dried off
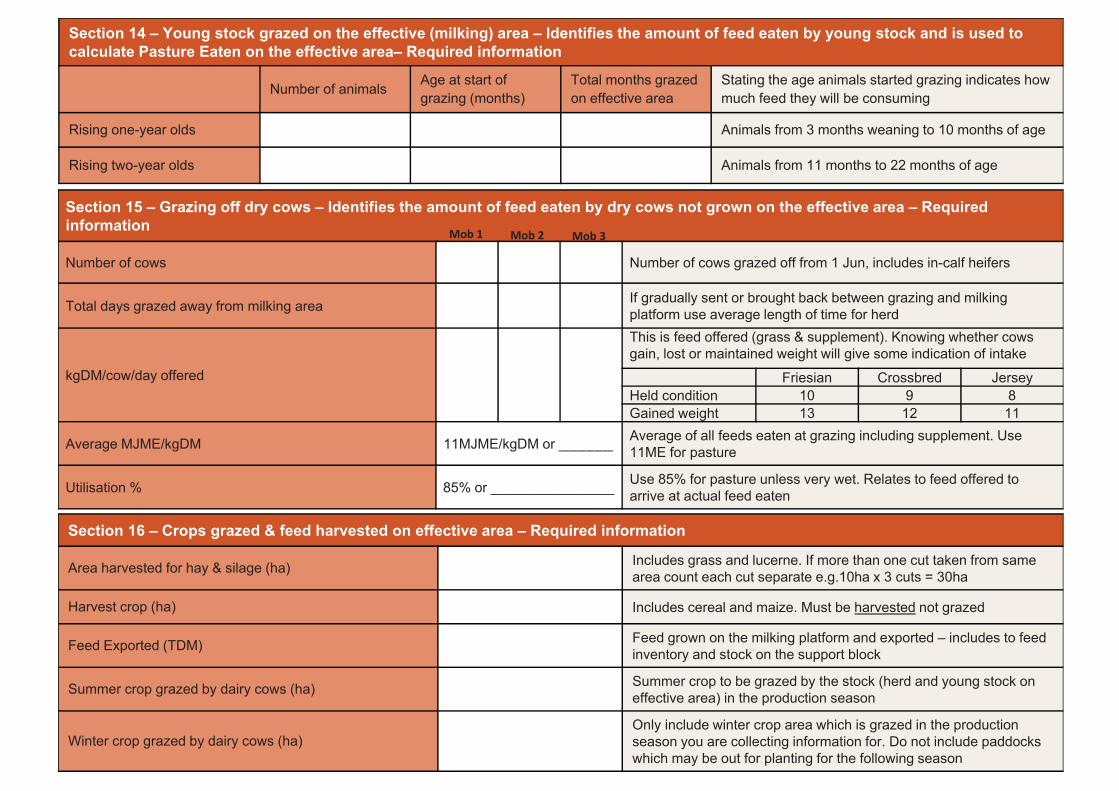
Section 15 – Grazing off dry cows – Identifies the amount of feed eaten by dry cows not grown on the effective area – Required information
Number of cows Number of cows grazed off from 1 Jun, includes in-calf heifers
Total days grazed away from milking area If gradually sent or brought back between grazing and milking platform use average length of time for herd
kgDM/cow/day offered
This is feed offered (grass & supplement). Knowing whether cows gain, lost or maintained weight will give some indication of intake
Friesian Crossbred JerseyHeld condition 10 9 8Gained weight 13 12 11
Average MJME/kgDM 11MJME/kgDM or _______ Average of all feeds eaten at grazing including supplement. Use 11ME for pasture
Utilisation % 85% or ________________ Use 85% for pasture unless very wet. Relates to feed offered to arrive at actual feed eaten
Section 14 – Young stock grazed on the effective (milking) area – Identifies the amount of feed eaten by young stock and is used to calculate Pasture Eaten on the effective area– Required information
Number of animals Age at start of grazing (months)
Total months grazedon effective area
Stating the age animals started grazing indicates how much feed they will be consuming
Rising one-year olds Animals from 3 months weaning to 10 months of age
Rising two-year olds Animals from 11 months to 22 months of age
Section 16 – Crops grazed & feed harvested on effective area – Required information
Area harvested for hay & silage (ha) Includes grass and lucerne. If more than one cut taken from same area count each cut separate e.g.10ha x 3 cuts = 30ha
Harvest crop (ha) Includes cereal and maize. Must be harvested not grazed
Feed Exported (TDM) Feed grown on the milking platform and exported – includes to feed inventory and stock on the support block
Summer crop grazed by dairy cows (ha) Summer crop to be grazed by the stock (herd and young stock on effective area) in the production season
Winter crop grazed by dairy cows (ha)Only include winter crop area which is grazed in the production season you are collecting information for. Do not include paddocks which may be out for planting for the following season
Mob 1 Mob 3Mob 2
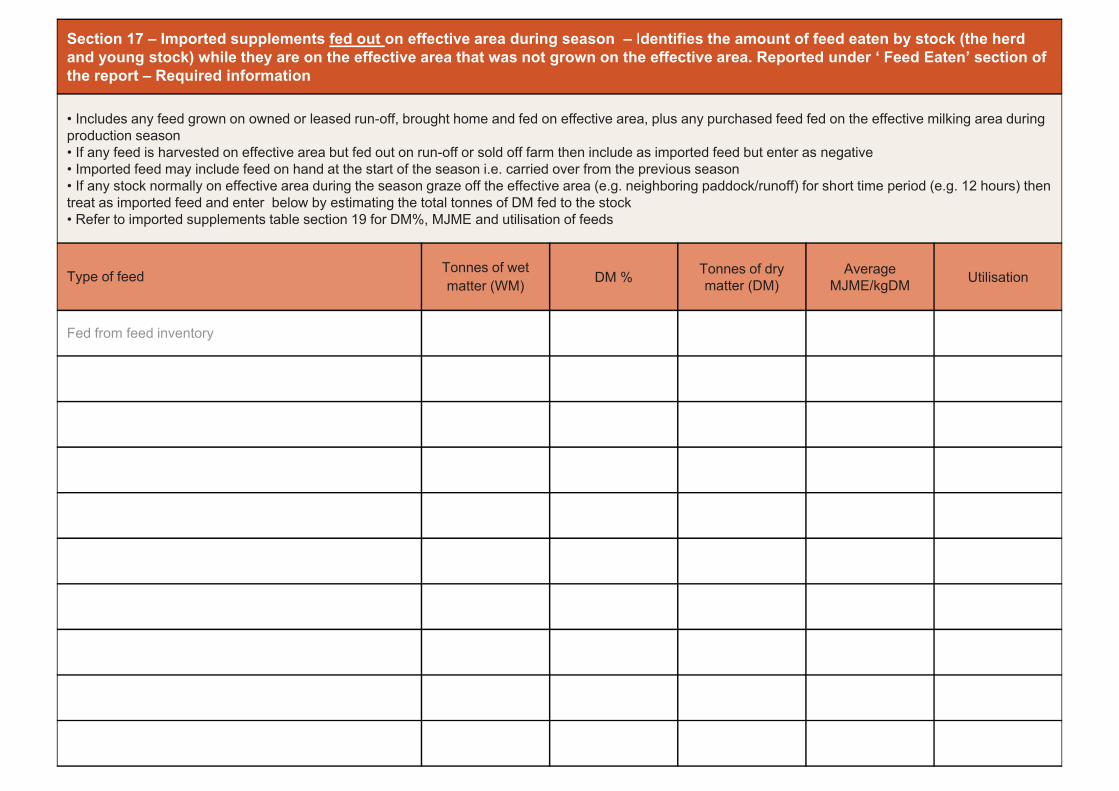
Section 17 – Imported supplements fed out on effective area during season – Identifies the amount of feed eaten by stock (the herd and young stock) while they are on the effective area that was not grown on the effective area. Reported under ‘ Feed Eaten’ section of the report – Required information
• Includes any feed grown on owned or leased run-off, brought home and fed on effective area, plus any purchased feed fed on the effective milking area during production season• If any feed is harvested on effective area but fed out on run-off or sold off farm then include as imported feed but enter as negative• Imported feed may include feed on hand at the start of the season i.e. carried over from the previous season• If any stock normally on effective area during the season graze off the effective area (e.g. neighboring paddock/runoff) for short time period (e.g. 12 hours) thentreat as imported feed and enter below by estimating the total tonnes of DM fed to the stock• Refer to imported supplements table section 19 for DM%, MJME and utilisation of feeds
Type of feed Tonnes of wet matter (WM) DM % Tonnes of dry
matter (DM)Average
MJME/kgDM Utilisation
Fed from feed inventory
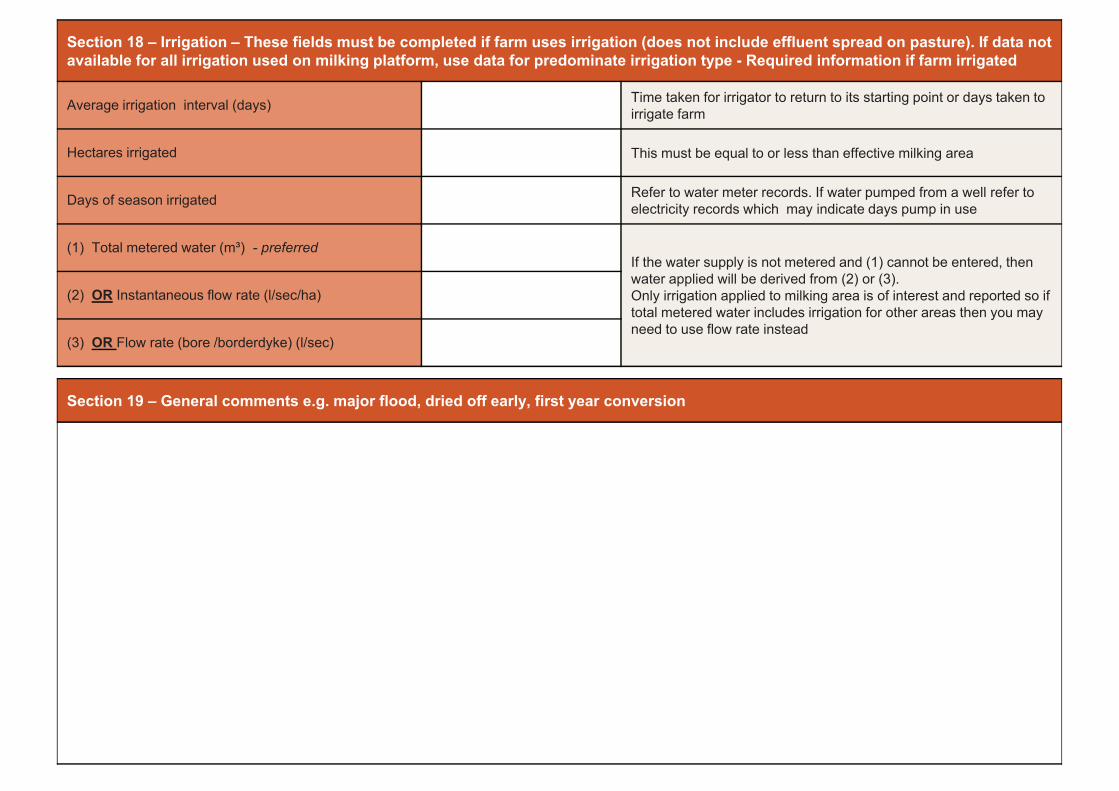
Section 19 – General comments e.g. major flood, dried off early, first year conversion
Section 18 – Irrigation – These fields must be completed if farm uses irrigation (does not include effluent spread on pasture). If data not available for all irrigation used on milking platform, use data for predominate irrigation type - Required information if farm irrigated
Average irrigation interval (days) Time taken for irrigator to return to its starting point or days taken to irrigate farm
Hectares irrigated This must be equal to or less than effective milking area
Days of season irrigated Refer to water meter records. If water pumped from a well refer to electricity records which may indicate days pump in use
(1) Total metered water (m³) - preferredIf the water supply is not metered and (1) cannot be entered, then water applied will be derived from (2) or (3). Only irrigation applied to milking area is of interest and reported so if total metered water includes irrigation for other areas then you may need to use flow rate instead
(2) OR Instantaneous flow rate (l/sec/ha)
(3) OR Flow rate (bore /borderdyke) (l/sec)

Imported Supplements – Information on dry matter, energy and utilisation of feed
Maize silageDM 30-38%, Utilisation : Bins 75-85%. Dry Paddock, 65-75%. Wet paddock, 50-60% (includes storage losses) Proliq DM 32-40%. Utilisation %: 95%
Baleage/Pit silageBaleage DM 30-40%. Pit Silage DM 25-30% MJME 8-12.Utilisation %: Dry paddock 70-80%. Wet paddock 60-70%. Kiwifruit Average DM 14% soft, 20% hard
Hay DM 85%, MJME 6-9, Utilisation 60-85% Maize grain/glutenDM 87-89%. Utilisation %: Bins 80-90%, Shed 95%.
ConcentratesMost will be approx 90% DM, Utilisation 80-95% (includes storage losses) Molasses
DM average 75%. Utilisation %: 95%
Lucerne silage & Hay
DM 85%. MJME 8-10.Utilisation %: Dry paddock 70-80%, Wet paddock 60-70% Onions DM average 10%
Palm kernel DM 90-95%. Utilisation %: Bins 80-90%, Shed 95% Potato DM average 20%
Cereal silageDM 30-40%. MJME 9-12.Utilisation %: see maize silage Carrots DM average 12-13%
Barley/wheat grain DM 86-89%. Utilisation %: Bins 80-90%, Shed 95%. Soybean meal DM 90%.Utilisation %: Bins 80-90%, Shed 95%
Bread DM average 63% Sweet corn silage DM average 20%
Brewers grain DM 24%. Utilisation %: Bins 80-90%, Shed 95% Broll DM 85%
Cereal straw Average DM 85-89% Tapioca DM 88%.Utilisation %: Bins 80-90%, Shed 95%
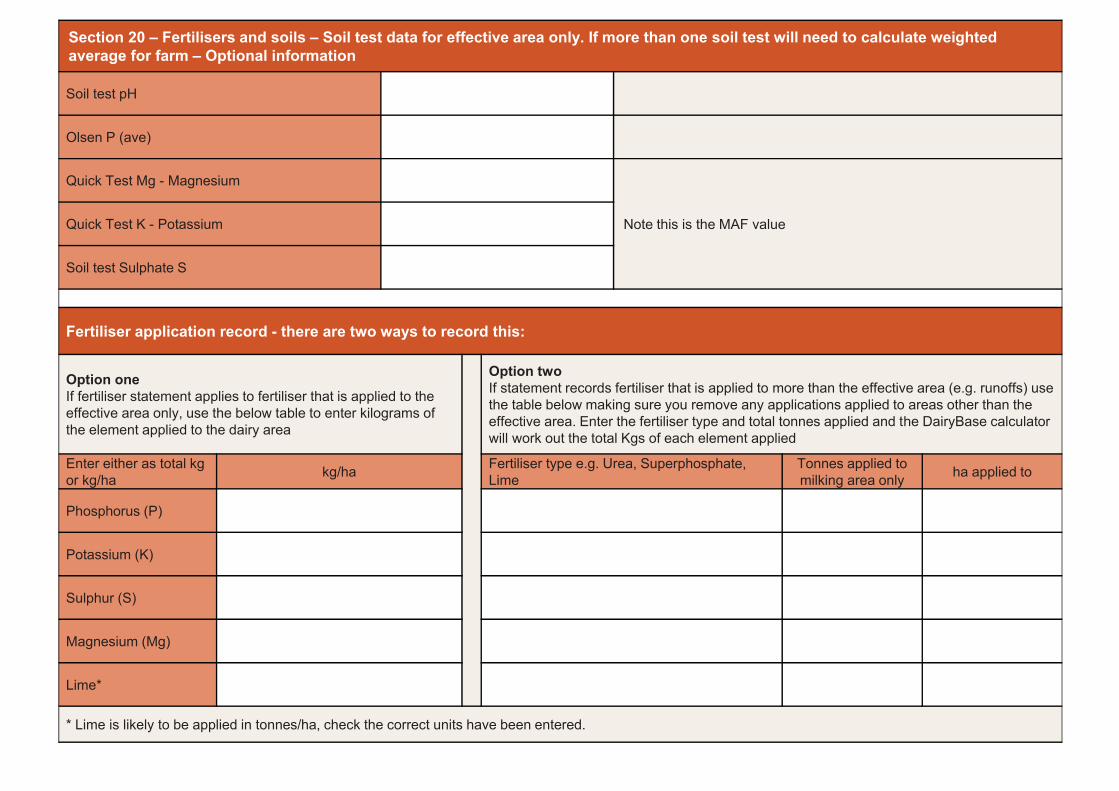
Section 20 – Fertilisers and soils – Soil test data for effective area only. If more than one soil test will need to calculate weighted average for farm – Optional information
Soil test pH
Olsen P (ave)
Quick Test Mg - Magnesium
Note this is the MAF valueQuick Test K - Potassium
Soil test Sulphate S
Fertiliser application record - there are two ways to record this:
Option oneIf fertiliser statement applies to fertiliser that is applied to the effective area only, use the below table to enter kilograms of the element applied to the dairy area
Option twoIf statement records fertiliser that is applied to more than the effective area (e.g. runoffs) use the table below making sure you remove any applications applied to areas other than the effective area. Enter the fertiliser type and total tonnes applied and the DairyBase calculator will work out the total Kgs of each element applied
Enter either as total kg or kg/ha kg/ha Fertiliser type e.g. Urea, Superphosphate,
LimeTonnes applied to milking area only ha applied to
Phosphorus (P)
Potassium (K)
Sulphur (S)
Magnesium (Mg)
Lime*
* Lime is likely to be applied in tonnes/ha, check the correct units have been entered.

Section 21 – Calving and Mating – Values appear in Part B of the report and are compared to industry targets rather than benchmarks. The majority of the data is available from your InCalf Fertility Focus Report or calving/mating report provided records are up to date –Optional information
Planned start of calving (spring calving cows) Use planned start of calving (PSC) for mixed age cows
Planned start of mating (spring calving cows) Use date for mixed age cows only (not yearling matings). Available from mating report
Date AB finished (spring calving cows) Available from mating report or from InCalf Fertility Focus Report page 2. If no AB used enter date bull withdrawn
Date bull withdrawn from herd (spring calving cows) If bull left with herd for remainder of season enter date which matches culling criteria for calving date
Number MA cows confirmed empty This is cows confirmed empty (not necessarily culled empty)
For the below questions either answer using reproductive records or InCalf Fertility Focus Report results. Both columns do not need to be completed just one or the other
Calving/mating records
OR InCalfFertility
Focus Report
Number of cows calved at 21 days (spring calving cows) % Number of cows calved 3 weeks from PSC. Available from calving report or % from the InCalf Fertility Focus Report
Number of cows calved at 42 days (spring calving cows) % Number of cows calved 6 weeks from PSC. Available from calving report or % from the InCalf Fertility Focus Report
Number of cows calved at 63 days (spring calving cows) % Number of cows calved 9 weeks from PSC. Available from calving report or % from the InCalf Fertility Focus Report
Number of cows induced % Number of cows induced or % from the InCalf Fertility Focus Report or vet report
Number of cows submitted in 21 days from PSM %Number of cows not number of matings. For split calving herds include spring and autumn matings . Available from Submission Rate Report or Fertility Focus Report 21day submission rate
Number of cows treated for anoestrus %Number of cows treated for anoestrous or % from the InCalfFertility Focus Report. May need to look at vet invoices for appropriate months
6 week in-calf rate (% of herd in calf at 6 weeks)
Pregnancy diagnosis
Or InCalfReport
This is the % of cows that are vetted to be 6 weeks in calf. Obtain either from dated pregnancy diagnosis or from the % from the InCalf Fertility Focus Report. If not known leave blank. It is not the 6 week calving rate
Circle whether actual or estimate
%
ActualEstimate

Section 22 – Mastitis and Lameness – Values appear in Part B of the report and are compared to industry targets rather than benchmarks – Optional information
Average bulk somatic cell count (for season) Refer to dairy company website or SCC report. Do not use average herd test results
Cows lameNumber of recorded cases. Do not double count animals, if treated three times only equal to one animal. Refer to treatment records or Health Detail Form
Cows treated for mastitis in first 6 weeks from PSC
Section 23 – Wastage and replacements – This section measures wastage of whole herd from calving through to December and wastage of R2 heifers from 1st lactation to 2nd lactation. Cross reference checks can be made with cows calving, peak cows and cows grazed off – Optional information
Number of cows and R2 heifers at the start of seasonInformation can be obtained from Herd Summary Report or stock reconciliation in financial statement (if balance date is 31 May)
Number of R2 heifers at the start of season
Number of R2 heifers at the start of season and still in the herd at end of season
See Herd Summary Report or think of R2 that are in calf and able to start the next season as R3’s. Do not include empty heifers
Number of cows and R2 heifers milking at 1 Dec This must be less than or the same as peak cows milked. Check December herd test
Number of replacement calves reared Used to calculate replacement rate
End of questionnaire