DAFTAR PUSTAKA -...
58
62 DAFTAR PUSTAKA 1. Levett PN. Leptospirosis. Clin. Microbiol. Rev. 2001;14(2):296-326. doi:10.1128/CMR.14.2.296. 2. World Health Organization. Informal Expert consultation on Surveillance, Diagnosis and Risk Reduction of Leptospirosis Chennai, 17-18 September. 2009. 3. Abhijit M B. Unusual Clinical Manifestations of Leptospirosis. 2005;51(3):179-183. 4. Ramadhani T, Yunianto B. Kondisi lingkungan pemukiman yang tidak sehat berisiko terhadap kejadian leptospirosis (studi kasus di kota semarang). 2010;XX:46-54. 5. Data Surveilans Leptospirosis kota Semarang tahun 2004 - 2007. Available at: http://dinkes-kotasemarang.go.id/. Accessed December 5, 2014. 6. Levett PN, Haake DA. Leptospira Species (Leptospirosis). 1998:1-8. 7. Allen P, Raftery S PD. Massive pulmonary haemorrhage due to leptospirosis. Intensive Care Med 1989;15(5):322-4. 8. Martins MG, Matos KT, da Silva MV de AM. Ocular manifestations in the acute phase of leptospirosis. Ocul Immunol Inflamm 1998;6:75-9. 9. Handa R, Sood A WJ. Peritonitis complicating leptospirosis. Postgr. Med J 1995;71:250. 10. Edwards CN EC. Hyperamylasemia and pancreatitis in leptospirosis. AM J Gastroenterol 1991;16:52-4. 11. Panicker JN, Mammachan R JR. Primary neuroleptospirosis. Postgr. Med J 2001;77:589-90. 12. Shah K, Amonkar GP, Kamat RN, Deshpande JR. Cardiac Findings in Leptospirosis. J Clin Pathol 2009;63(2):119-123. 13. McGrowder D, Brown P. Clinical and laboratory findings in patients with leptospirosis at a tertiary teaching hospital in Jamaica. Res. Rep. Trop. Med. 2010:59-64. doi:10.2147/RRTM.S14118.
Transcript of DAFTAR PUSTAKA -...
62
DAFTAR PUSTAKA
1. Levett PN. Leptospirosis. Clin. Microbiol. Rev. 2001;14(2):296-326.
doi:10.1128/CMR.14.2.296.
2. World Health Organization. Informal Expert consultation on Surveillance,
Diagnosis and Risk Reduction of Leptospirosis Chennai, 17-18 September.
2009.
3. Abhijit M B. Unusual Clinical Manifestations of Leptospirosis.
2005;51(3):179-183.
4. Ramadhani T, Yunianto B. Kondisi lingkungan pemukiman yang tidak
sehat berisiko terhadap kejadian leptospirosis (studi kasus di kota
semarang). 2010;XX:46-54.
5. Data Surveilans Leptospirosis kota Semarang tahun 2004 - 2007. Available
at: http://dinkes-kotasemarang.go.id/. Accessed December 5, 2014.
6. Levett PN, Haake DA. Leptospira Species (Leptospirosis). 1998:1-8.
7. Allen P, Raftery S PD. Massive pulmonary haemorrhage due to
leptospirosis. Intensive Care Med 1989;15(5):322-4.
8. Martins MG, Matos KT, da Silva MV de AM. Ocular manifestations in the
acute phase of leptospirosis. Ocul Immunol Inflamm 1998;6:75-9.
9. Handa R, Sood A WJ. Peritonitis complicating leptospirosis. Postgr. Med J
1995;71:250.
10. Edwards CN EC. Hyperamylasemia and pancreatitis in leptospirosis. AM J
Gastroenterol 1991;16:52-4.
11. Panicker JN, Mammachan R JR. Primary neuroleptospirosis. Postgr. Med J
2001;77:589-90.
12. Shah K, Amonkar GP, Kamat RN, Deshpande JR. Cardiac Findings in
Leptospirosis. J Clin Pathol 2009;63(2):119-123.
13. McGrowder D, Brown P. Clinical and laboratory findings in patients with
leptospirosis at a tertiary teaching hospital in Jamaica. Res. Rep. Trop. Med.
2010:59-64. doi:10.2147/RRTM.S14118.
63
14. Daher EF. Clinical presentation of leptospirosis : a retrospective study of
201 patients in a metropolitan city of Brazil. Braz J Infect Dis
2010;14(1):3-10.
15. Baron S. Medical Microbiology, 4th Edition. 4th ed. (Baron S, ed.).
University of Texas Medical Branch at Galveston; 1996.
16. WHO | Leptospirosis Burden Epidemiology Reference Group (LERG).
Available at: http://www.who.int/zoonoses/diseases/lerg/en/index1.html.
Accessed January 19, 2015.
17. Gamage CD, Tamashiro H, Ohnishi M, Koizumi N. Epidemiology ,
Surveillance and Laboratory Diagnosis of Leptospirosis in the WHO
South-East Asia Region. World Health 2003.
18. Gasem MH, Wageenar JFP, Goris MGA, Adi MS, Isbandrio BB,
Hartskeerl RA, Rolain JM, Raoult D VGE. Murine Typhus and
Leptospirosis as causes of Acute Undiferentiated Fever in Central Java,
Indonesia. Emerg Infect Dis 2009;15(6):975-7.
19. CDC - Infection - Leptospirosis. Available at:
http://www.cdc.gov/leptospirosis/infection/index.html. Accessed January
19, 2015.
20. Marinho M. Leptospirosis : Epidemiologic Factors , Pathophysiological
and Immunopathogenic. 2010.
21. Faine S, Adler B, Bolin C, Perolat P. Leptospira and Leptospirosis. 2nd ed.
Melbourne: MediSci; 1999:96, 123-129, 109-110.
22. Lee SH, Kim S, Park SC, et al. Cytotoxic Activities of Leptospira
interrogans Hemolysin SphH as a Pore-Forming Protein on Mammalian
Cells. 2002;70(1):315-322. doi:10.1128/IAI.70.1.315.
23. Ko AI, Goarant C, Picardeau M. The dawn of the molecular genetics era
for an emerging zoonotic pathogen. Nat Rev Microbiol 2009;7(10):736.
doi:10.1038/nrmicro2208.Leptospira.
24. Dutta TK, Christopher M. Leptospirosis--an overview. J. Assoc. Physicians
India 2005;53(June):545-551.
64
25. Andrade L, de Francesco Daher E, Seguro AC. Leptospiral Nephropathy.
Semin. Nephrol. 2008;28(4):383-394.
doi:10.1016/j.semnephrol.2008.04.008.
26. Araujo ER, Seguro AC, Spichler A, Magaldi AJ, Volpini RA, Brito T De.
Acute kidney injury in human leptospirosis: an immunohistochemical study
with pasthophysiological correlation. Virchows Arch 2010;456(4):367.
27. Abboud O. Tropical Acute Renal Failure. 3th Congr. Nephrol. Internet
2003. Available at: http://www.uninet.edu/cin2003/conf/aboud/aboud.html.
Accessed January 29, 2015.
28. Wysocki J, Liu Y, Shores N. Leptospirosis with acute liver injury.
2014;70112(3):257-258.
29. Gouveia EL, Metcalfe J, De Carvalho ALF, et al. Leptospirosis-associated
severe pulmonary hemorrhagic syndrome, Salvador, Brazil. Emerg. Infect.
Dis. 2008;14(3):505-508. doi:10.3201/eid1403.071064.
30. Turgut M, Sünbül M, Bayirli D, Bilge a, Leblebicioğlu H, Haznedaroğlu I.
Thrombocytopenia complicating the clinical course of leptospiral infection.
J. Int. Med. Res. 2002;30:535-540.
31. Wagenaar JFP, Goris MGA, Partiningrum DL, et al. Coagulation disorders
in patients with severe leptospirosis are associated with severe bleeding and
mortality. Trop Med Int Heal. 2010;15(2):152-159.
doi:10.1177/1745691612459060.
32. Smits HL, Van Der Hoorn M a WG, Goris MG a, et al. Simple latex
agglutination assay for rapid serodiagnosis of human leptospirosis. J. Clin.
Microbiol. 2000;38(3):1272-1275.
33. Miyahara S, Saito M, Kanemaru T, Villanueva SYAM, Gloriani NG,
Yoshida S. Destruction of the hepatocyte junction by intercellular invasion
of Leptospira causes jaundice in a hamster model of Weil’s disease. Int. J.
Exp. Pathol. 2014;95(4):271-281. doi:10.1111/iep.12085.
34. Chang ML, Yang CW, Chen JC, et al. Disproportional exaggerated
aspartate transaminase is a useful prognostic parameter in late leptospirosis.
World J. Gastroenterol. 2005;11(35):5553-5556.
65
35. Thenmozhi A, Nagalakshmi K, Mahadeva RUS. Biochemical
characterization, clinical diagnosis and hepatic complication of weil’s
disease and other co-infections. Asian J. Pharm. Clin. Res. 2012;5:134-138.
36. Thapa BR, Walia A. Liver function tests and their interpretation.
Gastroenterology 1958;34:675-682.
37. Nathwani R a., Pais S, Reynolds TB, Kaplowitz N. Serum alanine
aminotransferase in skeletal muscle diseases. Hepatology 2005;41:380-382.
doi:10.1002/hep.20548.
38. Daher EF, Silva GB, Karbage NNN, et al. Predictors of oliguric acute
kidney injury in leptospirosis: Nephron - Clin. Pract. 2009;112.
doi:10.1159/000210571.
39. Gancheva GI. Brief communication Leptospirosis in elderly patients.
Brazilian J. Infect. Dis. 2013;17(5):592-595.
doi:10.1016/j.bjid.2013.01.012.
40. Comtois R, Bertrand S, Beauregard H, Vinay P. Diagnostic value of the
determination of blood urea in dehydrated patients with and without central
diabetes insipidus. Union. Med. Can. 1990;119(6):317-321.
41. Karande S, Satam N, Kulkarni M, Bharadwaj R, Pol S. Leptospiral
pneumonia. Indian J. Pediatr. 2005;72(2):86. doi:10.1007/BF02760593.
42. Rice TW, Wheeler AP, Bernard GR, Hayden DL, Schoenfeld DA, Ware
LB. Comparison of the SpO2/FIO2 ratio and the PaO2/FIO2 ratio in
patients with acute lung injury or ARDS. Chest 2007;132(2):410-417.
doi:10.1378/chest.07-0617.
43. Škerk V, Markotić A, Puljiz I, et al. Electrocardiographic changes in
hospitalized patients with leptospirosis over a 10-year period. Med. Sci.
Monit. 2011;17(7):CR369-R375. doi:881847 [pii].
44. Daher EF, Silva GB, Silveira CO, et al. Factors associated with
thrombocytopenia in severe leptospirosis (Weil’s disease). Clin. (Sao
Paulo) 2014;69:106-110. doi:S1807-59322014000200106
[pii]\r10.6061/clinics/2014(02)06.
66
45. Lewington, A; Kanagasundaram S. Acute Kidney Injury. UK Ren. Assoc.
2011;(August 2010).
46. Yang H-L, Jiang X-C, Zhang X-Y, et al. Thrombocytopenia in the
experimental leptospirosis of guinea pig is not related to disseminated
intravascular coagulation. BMC Infect. Dis. 2006;6:19. doi:10.1186/1471-
2334-6-19.
47. Goeijenbier M, Gasem MH, Meijers JCM, et al. Markers of endothelial cell
activation and immune activation are increased in patients with severe
leptospirosis and associated with disease severity. J. Infect. 2015.
doi:10.1016/j.jinf.2015.05.016.
48. Lehnhardt A, Kemper MJ. Pathogenesis, diagnosis and management of
hyperkalemia. Pediatr. Nephrol. 2011;26:377-384. doi:10.1007/s00467-
010-1699-3.
49. Andreev E, Koopman MG, Arisz L. A rise in plasma creatinine that is not a
sign of renal failure: Which drugs can be responsible? J. Intern. Med.
1999;246:247-252. doi:10.1046/j.1365-2796.1999.00515.x.
50. Schoolwerth AC, Schoolwerth AC, Sica D a., et al. Renal Considerations in
Angiotensin Converting Enzyme Inhibitor Therapy. Circulation
2001;104:1985-1991. doi:10.1161/CIRCULATIONAHA.109.192576.
51. Giboney PT. Mildly elevated liver transaminase levels in the asymptomatic
patient. Am. Fam. Physician 2005;71(6):1105-1110.
52. El-Neweshy MS. Experimental doxycycline overdose in rats causes
cardiomyopathy. Int. J. Exp. Pathol. 2013;94:109-114.
doi:10.1111/iep.12013.
53. Choi JW. Association between elevated serum hepatic enzyme activity and
total body fat in obese humans. Ann. Clin. Lab. Sci. 2003;33(3):257-264.
54. Togal T, Sener A, Yucel N, et al. Intensive care of a weils disease with
multiorgan failure. J. Clin. Med. Res. 2010;2(3):145-9.
doi:10.4021/jocmr2010.05.302w.
55. Tachycardia | Fast Heart Rate. Available at:
http://www.heart.org/HEARTORG/Conditions/Arrhythmia/AboutArrhyth
67
mia/Tachycardia-Fast-Heart-Rate_UCM_302018_Article.jsp. Accessed
June 11, 2015.
56. Visentin GP, Liu CY. Drug Induced Thrombocytopenia. Hematol Oncol
Clin North Am 2007;21(4):685-vi.
doi:10.1016/j.biotechadv.2011.08.021.Secreted.
57. Gouveia, E. L., Metcalfe, J., de Carcalho, A. L., Aires TST, Villaboas-
Bisneto, J. C., Queirroz, A., Santos, A. C., Salgado K, Reis, M. G. & Ko
AI. Leptospirosis-associated severe pulmonary hemorrhagic syndromee.
Emerg Infect Dis 2008:505-508.
58. Sivaprakasam V, Zochowski WJ, Palmer MF. Clinical spectrum of severe
leptospirosis in the UK. JMM Case Reports 2014;1(4):e000003-e000003.
doi:10.1099/jmmcr.0.000003.
68
Lampiran 1
69
Lampiran 2
70
71
72

73
74
75
76
77
78
79
80
81
82
83
Lampiran 3
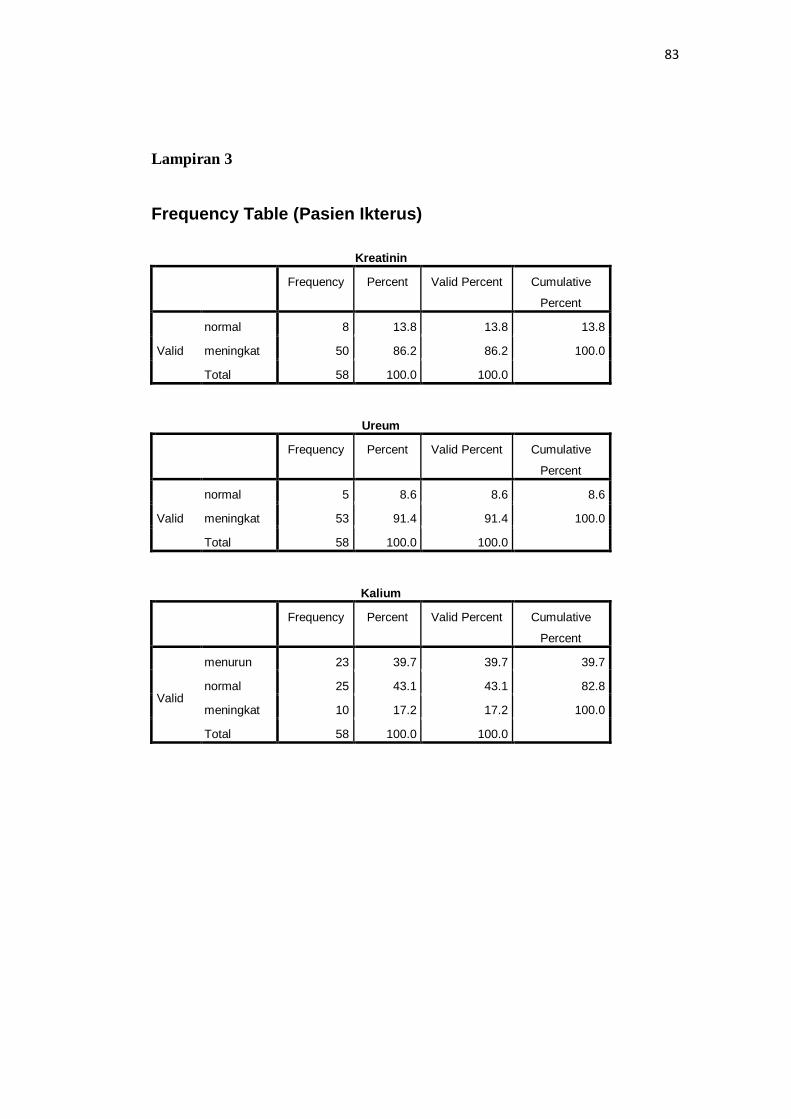
Frequency Table (Pasien Ikterus)
Kreatinin
Frequency Percent Valid Percent Cumulative
Percent
Valid
normal 8 13.8 13.8 13.8
meningkat 50 86.2 86.2 100.0
Total 58 100.0 100.0
Ureum
Frequency Percent Valid Percent Cumulative
Percent
Valid
normal 5 8.6 8.6 8.6
meningkat 53 91.4 91.4 100.0
Total 58 100.0 100.0
Kalium
Frequency Percent Valid Percent Cumulative
Percent
Valid
menurun 23 39.7 39.7 39.7
normal 25 43.1 43.1 82.8
meningkat 10 17.2 17.2 100.0
Total 58 100.0 100.0
84
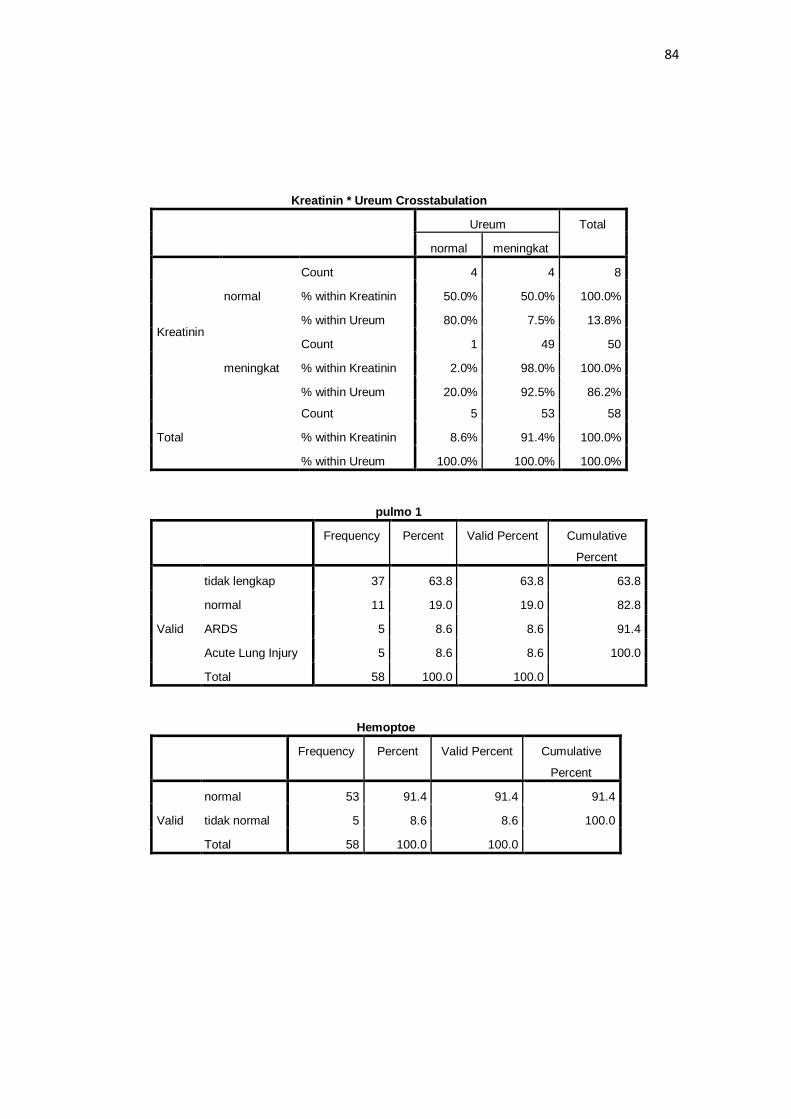
Kreatinin * Ureum Crosstabulation
Ureum Total
normal meningkat
Kreatinin
normal
Count 4 4 8
% within Kreatinin 50.0% 50.0% 100.0%
% within Ureum 80.0% 7.5% 13.8%
meningkat
Count 1 49 50
% within Kreatinin 2.0% 98.0% 100.0%
% within Ureum 20.0% 92.5% 86.2%
Total
Count 5 53 58
% within Kreatinin 8.6% 91.4% 100.0%
% within Ureum 100.0% 100.0% 100.0%
pulmo 1
Frequency Percent Valid Percent Cumulative
Percent
Valid
tidak lengkap 37 63.8 63.8 63.8
normal 11 19.0 19.0 82.8
ARDS 5 8.6 8.6 91.4
Acute Lung Injury 5 8.6 8.6 100.0
Total 58 100.0 100.0
Hemoptoe
Frequency Percent Valid Percent Cumulative
Percent
Valid
normal 53 91.4 91.4 91.4
tidak normal 5 8.6 8.6 100.0
Total 58 100.0 100.0
85
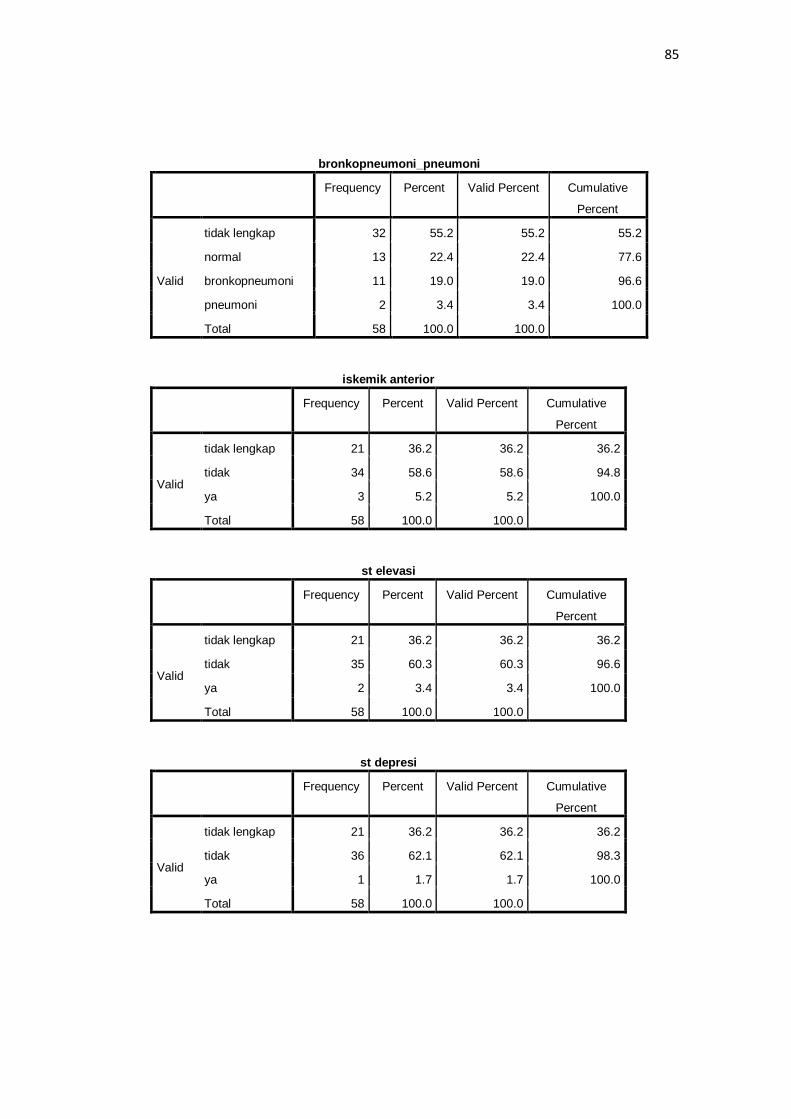
bronkopneumoni_pneumoni
Frequency Percent Valid Percent Cumulative
Percent
Valid
tidak lengkap 32 55.2 55.2 55.2
normal 13 22.4 22.4 77.6
bronkopneumoni 11 19.0 19.0 96.6
pneumoni 2 3.4 3.4 100.0
Total 58 100.0 100.0
iskemik anterior
Frequency Percent Valid Percent Cumulative
Percent
Valid
tidak lengkap 21 36.2 36.2 36.2
tidak 34 58.6 58.6 94.8
ya 3 5.2 5.2 100.0
Total 58 100.0 100.0
st elevasi
Frequency Percent Valid Percent Cumulative
Percent
Valid
tidak lengkap 21 36.2 36.2 36.2
tidak 35 60.3 60.3 96.6
ya 2 3.4 3.4 100.0
Total 58 100.0 100.0
st depresi
Frequency Percent Valid Percent Cumulative
Percent
Valid
tidak lengkap 21 36.2 36.2 36.2
tidak 36 62.1 62.1 98.3
ya 1 1.7 1.7 100.0
Total 58 100.0 100.0
86
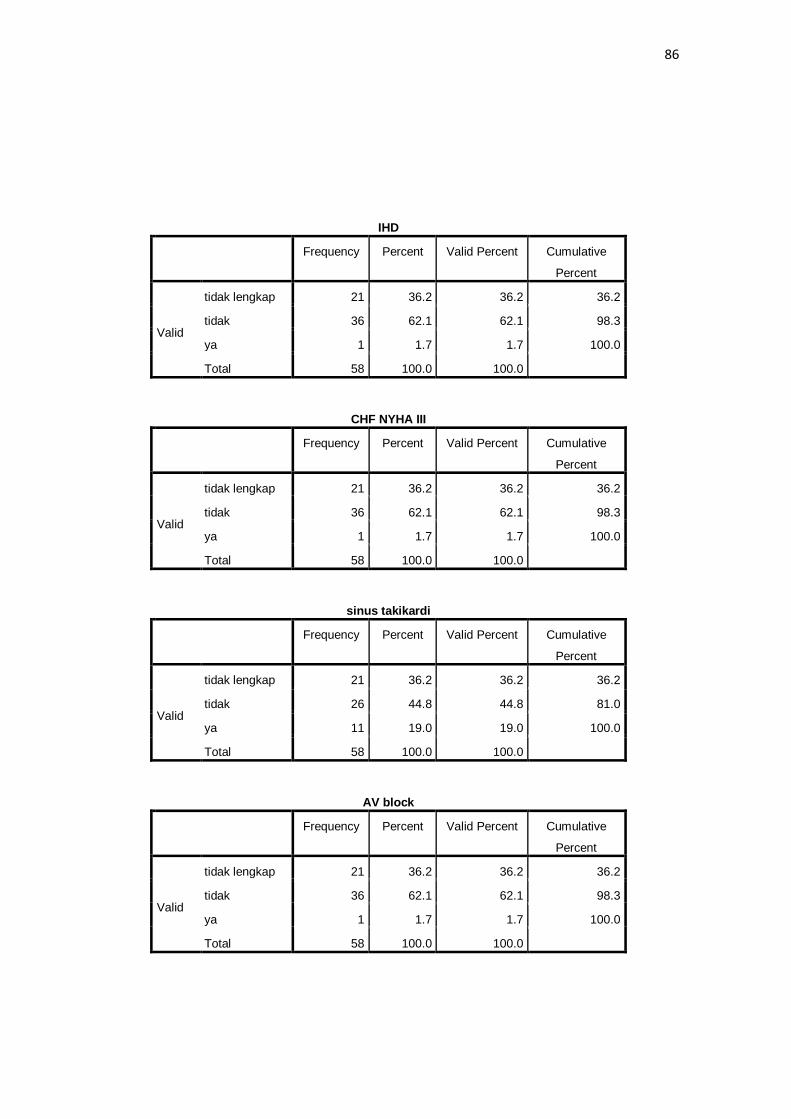
IHD
Frequency Percent Valid Percent Cumulative
Percent
Valid
tidak lengkap 21 36.2 36.2 36.2
tidak 36 62.1 62.1 98.3
ya 1 1.7 1.7 100.0
Total 58 100.0 100.0
CHF NYHA III
Frequency Percent Valid Percent Cumulative
Percent
Valid
tidak lengkap 21 36.2 36.2 36.2
tidak 36 62.1 62.1 98.3
ya 1 1.7 1.7 100.0
Total 58 100.0 100.0
sinus takikardi
Frequency Percent Valid Percent Cumulative
Percent
Valid
tidak lengkap 21 36.2 36.2 36.2
tidak 26 44.8 44.8 81.0
ya 11 19.0 19.0 100.0
Total 58 100.0 100.0
AV block
Frequency Percent Valid Percent Cumulative
Percent
Valid
tidak lengkap 21 36.2 36.2 36.2
tidak 36 62.1 62.1 98.3
ya 1 1.7 1.7 100.0
Total 58 100.0 100.0
87
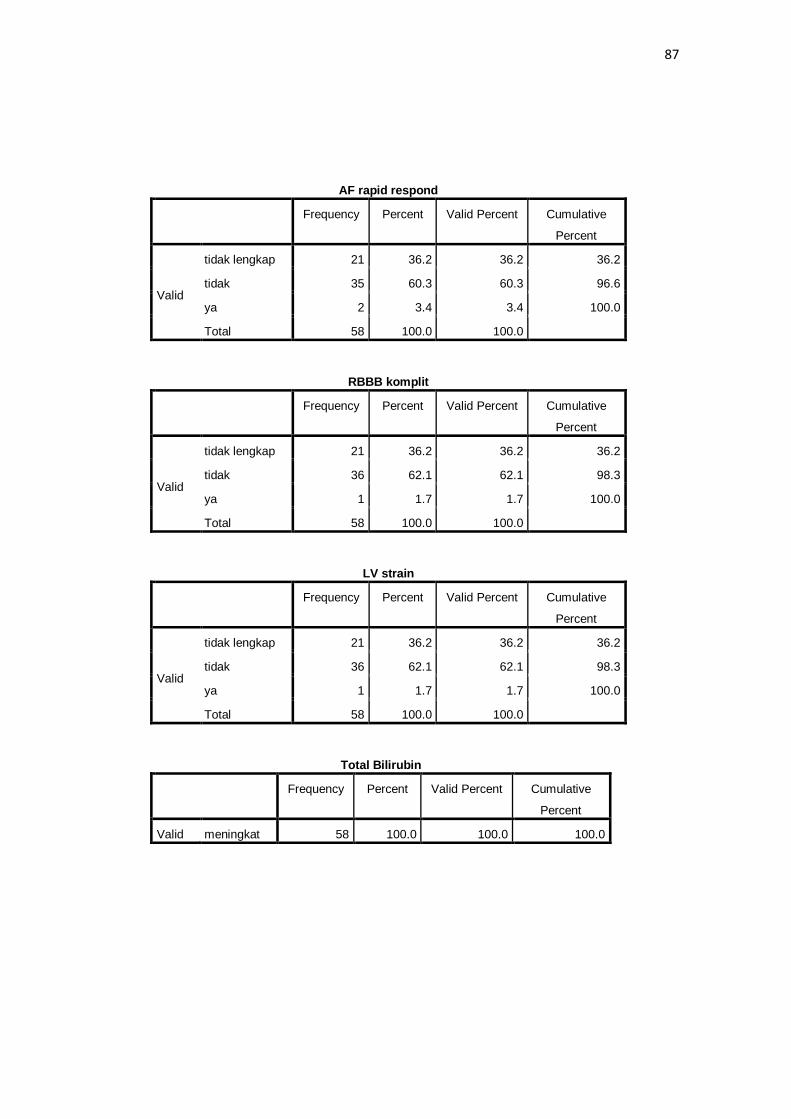
AF rapid respond
Frequency Percent Valid Percent Cumulative
Percent
Valid
tidak lengkap 21 36.2 36.2 36.2
tidak 35 60.3 60.3 96.6
ya 2 3.4 3.4 100.0
Total 58 100.0 100.0
RBBB komplit
Frequency Percent Valid Percent Cumulative
Percent
Valid
tidak lengkap 21 36.2 36.2 36.2
tidak 36 62.1 62.1 98.3
ya 1 1.7 1.7 100.0
Total 58 100.0 100.0
LV strain
Frequency Percent Valid Percent Cumulative
Percent
Valid
tidak lengkap 21 36.2 36.2 36.2
tidak 36 62.1 62.1 98.3
ya 1 1.7 1.7 100.0
Total 58 100.0 100.0
Total Bilirubin
Frequency Percent Valid Percent Cumulative
Percent
Valid meningkat 58 100.0 100.0 100.0
88
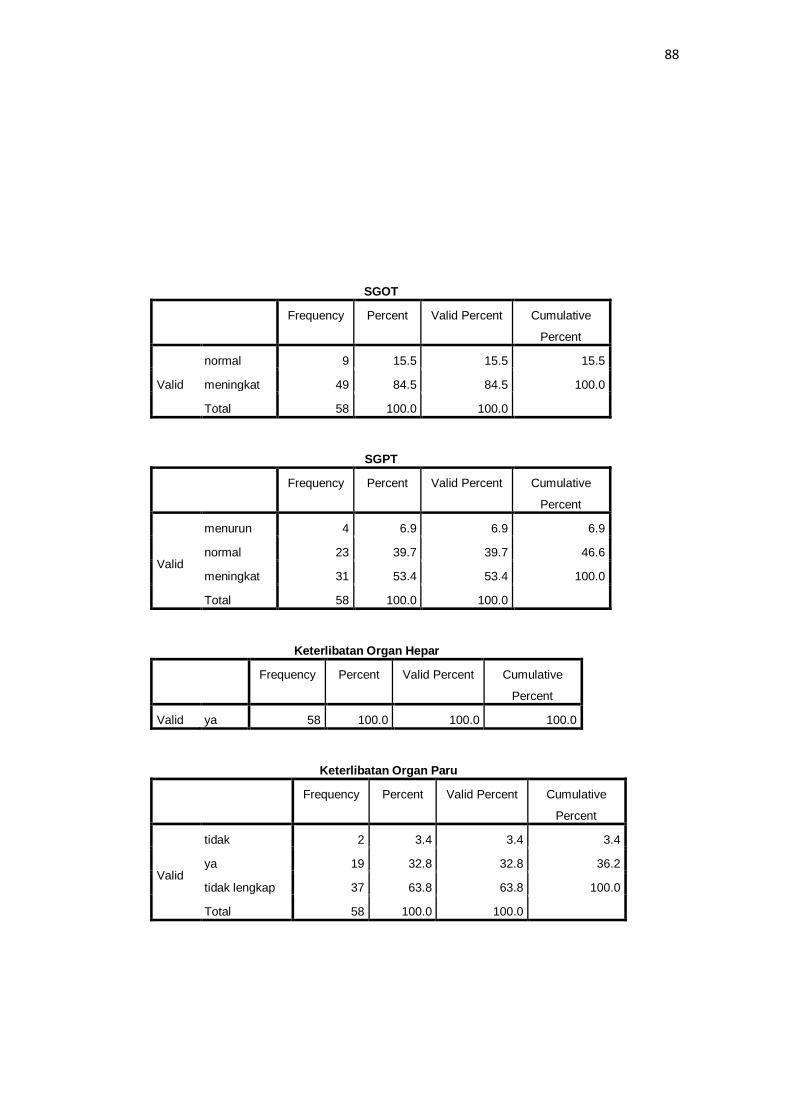
SGOT
Frequency Percent Valid Percent Cumulative
Percent
Valid
normal 9 15.5 15.5 15.5
meningkat 49 84.5 84.5 100.0
Total 58 100.0 100.0
SGPT
Frequency Percent Valid Percent Cumulative
Percent
Valid
menurun 4 6.9 6.9 6.9
normal 23 39.7 39.7 46.6
meningkat 31 53.4 53.4 100.0
Total 58 100.0 100.0
Keterlibatan Organ Hepar
Frequency Percent Valid Percent Cumulative
Percent
Valid ya 58 100.0 100.0 100.0
Keterlibatan Organ Paru
Frequency Percent Valid Percent Cumulative
Percent
Valid
tidak 2 3.4 3.4 3.4
ya 19 32.8 32.8 36.2
tidak lengkap 37 63.8 63.8 100.0
Total 58 100.0 100.0
89
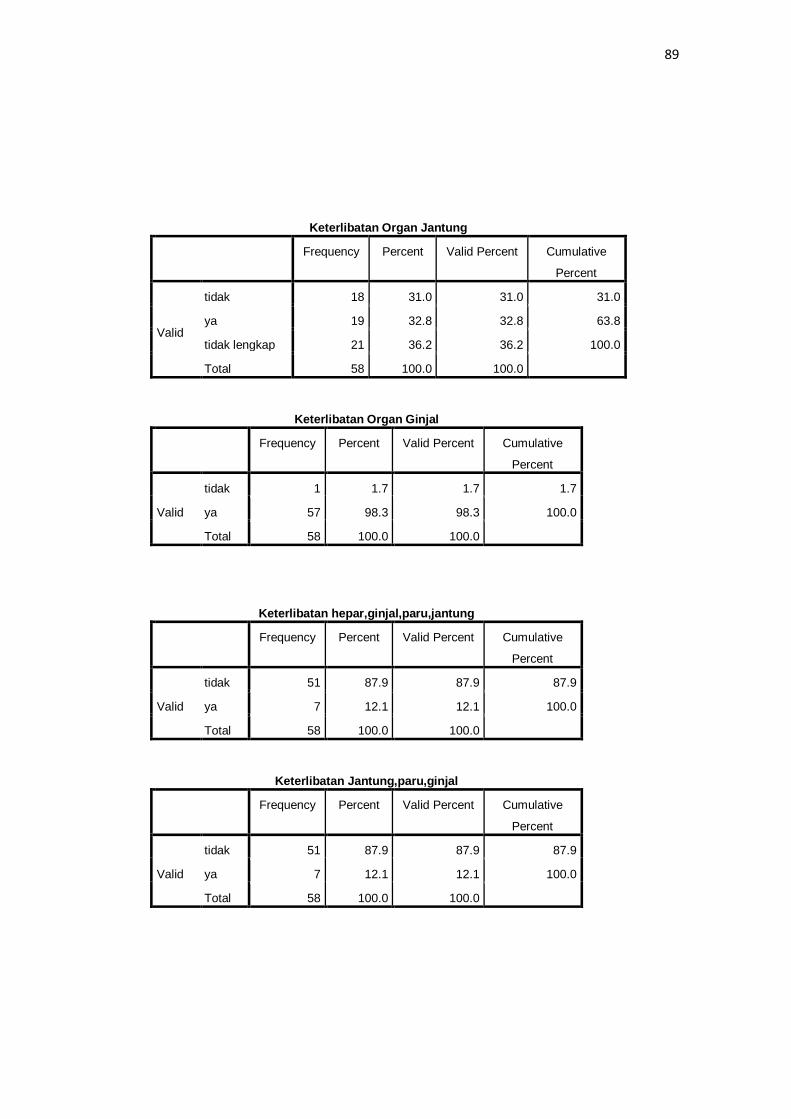
Keterlibatan Organ Jantung
Frequency Percent Valid Percent Cumulative
Percent
Valid
tidak 18 31.0 31.0 31.0
ya 19 32.8 32.8 63.8
tidak lengkap 21 36.2 36.2 100.0
Total 58 100.0 100.0
Keterlibatan Organ Ginjal
Frequency Percent Valid Percent Cumulative
Percent
Valid
tidak 1 1.7 1.7 1.7
ya 57 98.3 98.3 100.0
Total 58 100.0 100.0
Keterlibatan hepar,ginjal,paru,jantung
Frequency Percent Valid Percent Cumulative
Percent
Valid
tidak 51 87.9 87.9 87.9
ya 7 12.1 12.1 100.0
Total 58 100.0 100.0
Keterlibatan Jantung,paru,ginjal
Frequency Percent Valid Percent Cumulative
Percent
Valid
tidak 51 87.9 87.9 87.9
ya 7 12.1 12.1 100.0
Total 58 100.0 100.0
90
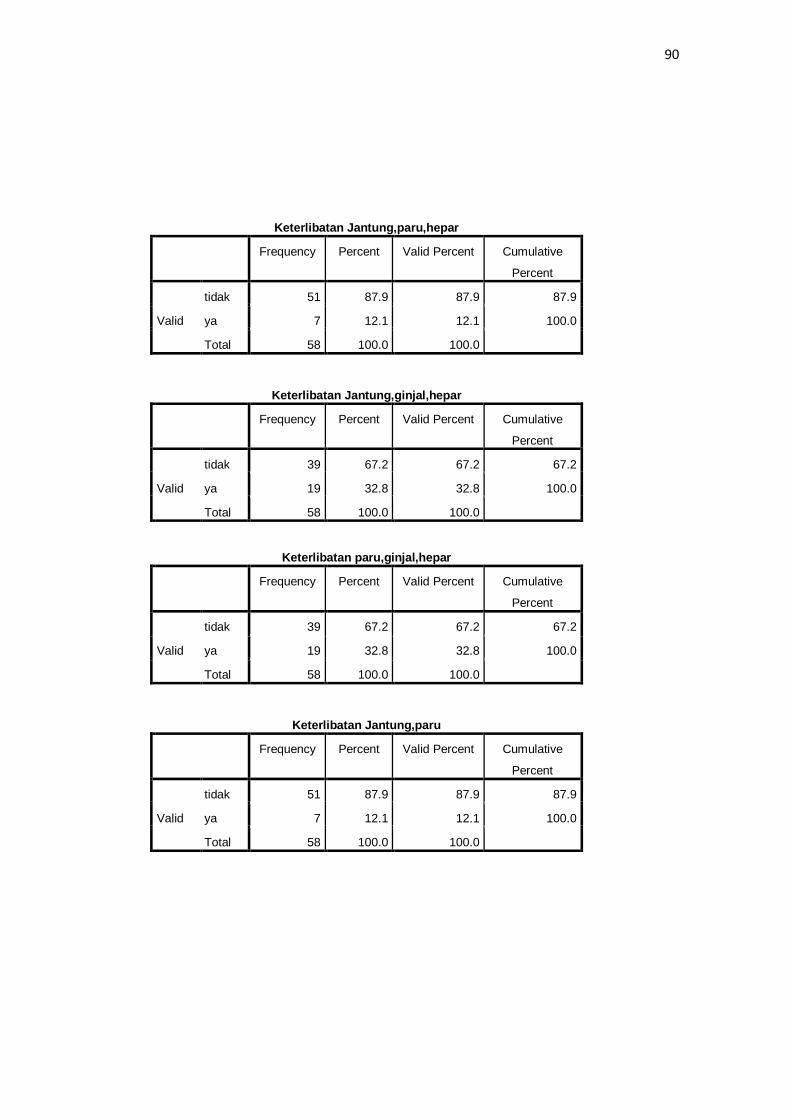
Keterlibatan Jantung,paru,hepar
Frequency Percent Valid Percent Cumulative
Percent
Valid
tidak 51 87.9 87.9 87.9
ya 7 12.1 12.1 100.0
Total 58 100.0 100.0
Keterlibatan Jantung,ginjal,hepar
Frequency Percent Valid Percent Cumulative
Percent
Valid
tidak 39 67.2 67.2 67.2
ya 19 32.8 32.8 100.0
Total 58 100.0 100.0
Keterlibatan paru,ginjal,hepar
Frequency Percent Valid Percent Cumulative
Percent
Valid
tidak 39 67.2 67.2 67.2
ya 19 32.8 32.8 100.0
Total 58 100.0 100.0
Keterlibatan Jantung,paru
Frequency Percent Valid Percent Cumulative
Percent
Valid
tidak 51 87.9 87.9 87.9
ya 7 12.1 12.1 100.0
Total 58 100.0 100.0
91
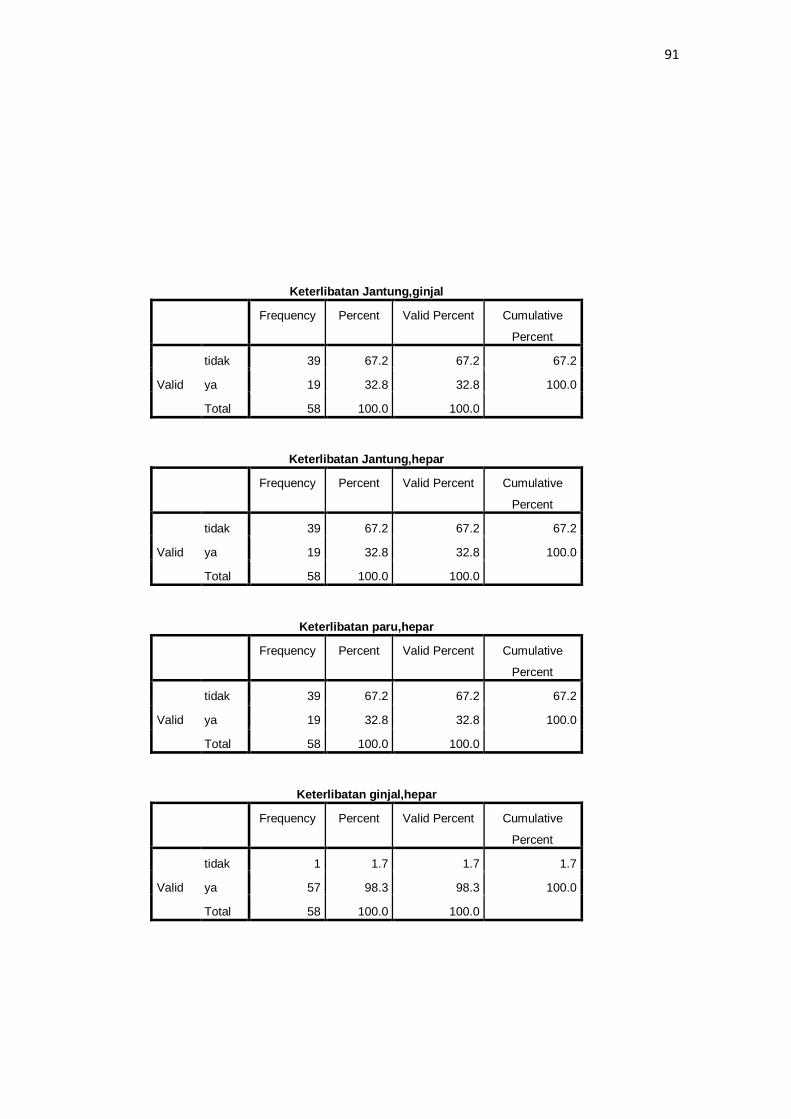
Keterlibatan Jantung,ginjal
Frequency Percent Valid Percent Cumulative
Percent
Valid
tidak 39 67.2 67.2 67.2
ya 19 32.8 32.8 100.0
Total 58 100.0 100.0
Keterlibatan Jantung,hepar
Frequency Percent Valid Percent Cumulative
Percent
Valid
tidak 39 67.2 67.2 67.2
ya 19 32.8 32.8 100.0
Total 58 100.0 100.0
Keterlibatan paru,hepar
Frequency Percent Valid Percent Cumulative
Percent
Valid
tidak 39 67.2 67.2 67.2
ya 19 32.8 32.8 100.0
Total 58 100.0 100.0
Keterlibatan ginjal,hepar
Frequency Percent Valid Percent Cumulative
Percent
Valid
tidak 1 1.7 1.7 1.7
ya 57 98.3 98.3 100.0
Total 58 100.0 100.0
92
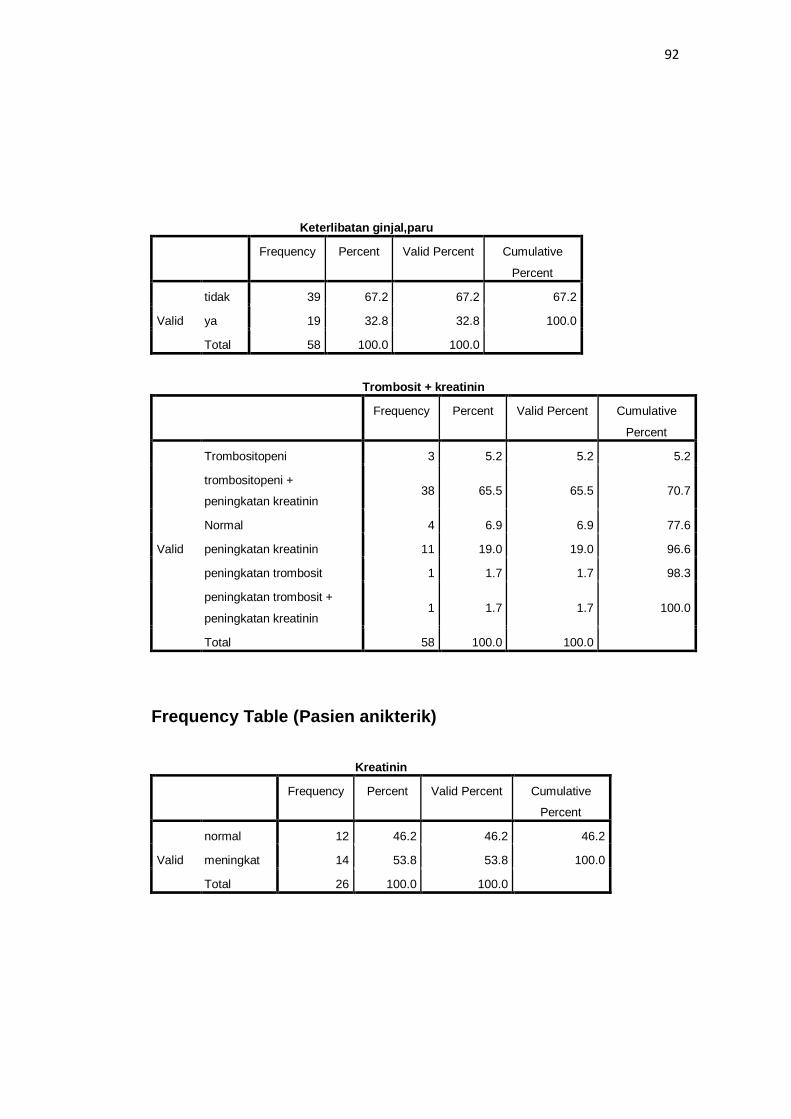
Keterlibatan ginjal,paru
Frequency Percent Valid Percent Cumulative
Percent
Valid
tidak 39 67.2 67.2 67.2
ya 19 32.8 32.8 100.0
Total 58 100.0 100.0
Trombosit + kreatinin
Frequency Percent Valid Percent Cumulative
Percent
Valid
Trombositopeni 3 5.2 5.2 5.2
trombositopeni +
peningkatan kreatinin 38 65.5 65.5 70.7
Normal 4 6.9 6.9 77.6
peningkatan kreatinin 11 19.0 19.0 96.6
peningkatan trombosit 1 1.7 1.7 98.3
peningkatan trombosit +
peningkatan kreatinin 1 1.7 1.7 100.0
Total 58 100.0 100.0
Frequency Table (Pasien anikterik)
Kreatinin
Frequency Percent Valid Percent Cumulative
Percent
Valid
normal 12 46.2 46.2 46.2
meningkat 14 53.8 53.8 100.0
Total 26 100.0 100.0
93
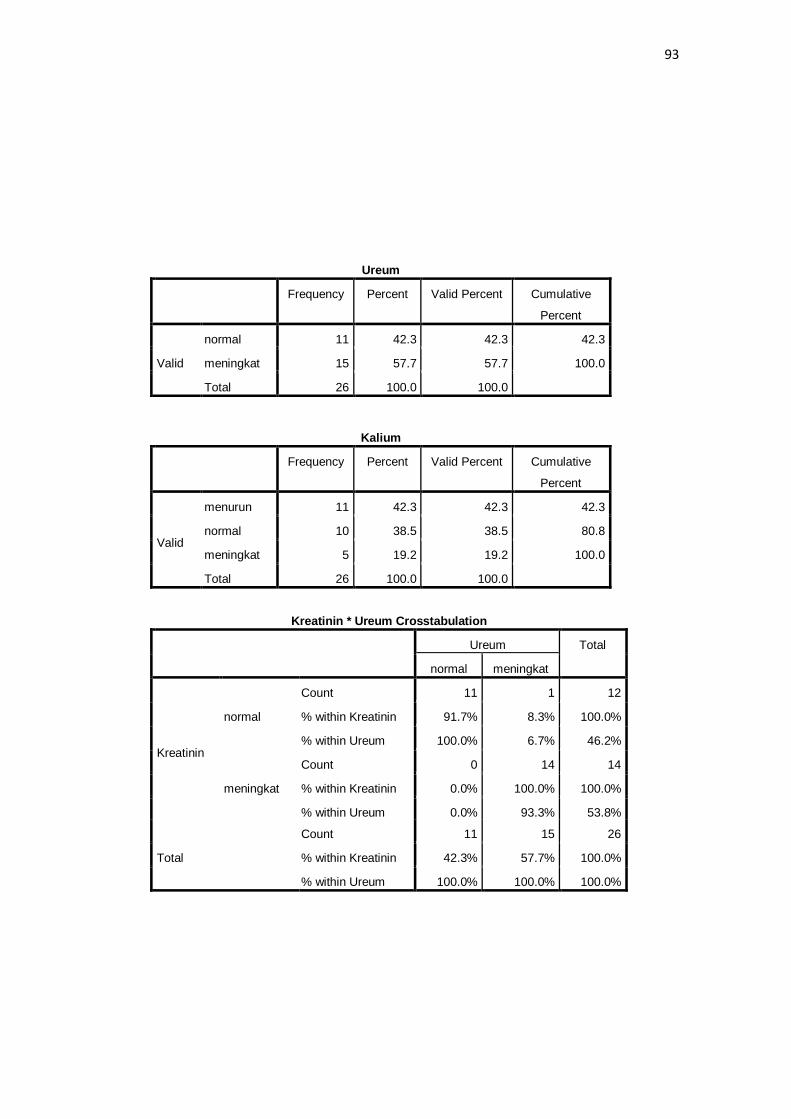
Ureum
Frequency Percent Valid Percent Cumulative
Percent
Valid
normal 11 42.3 42.3 42.3
meningkat 15 57.7 57.7 100.0
Total 26 100.0 100.0
Kalium
Frequency Percent Valid Percent Cumulative
Percent
Valid
menurun 11 42.3 42.3 42.3
normal 10 38.5 38.5 80.8
meningkat 5 19.2 19.2 100.0
Total 26 100.0 100.0
Kreatinin * Ureum Crosstabulation
Ureum Total
normal meningkat
Kreatinin
normal
Count 11 1 12
% within Kreatinin 91.7% 8.3% 100.0%
% within Ureum 100.0% 6.7% 46.2%
meningkat
Count 0 14 14
% within Kreatinin 0.0% 100.0% 100.0%
% within Ureum 0.0% 93.3% 53.8%
Total
Count 11 15 26
% within Kreatinin 42.3% 57.7% 100.0%
% within Ureum 100.0% 100.0% 100.0%
94
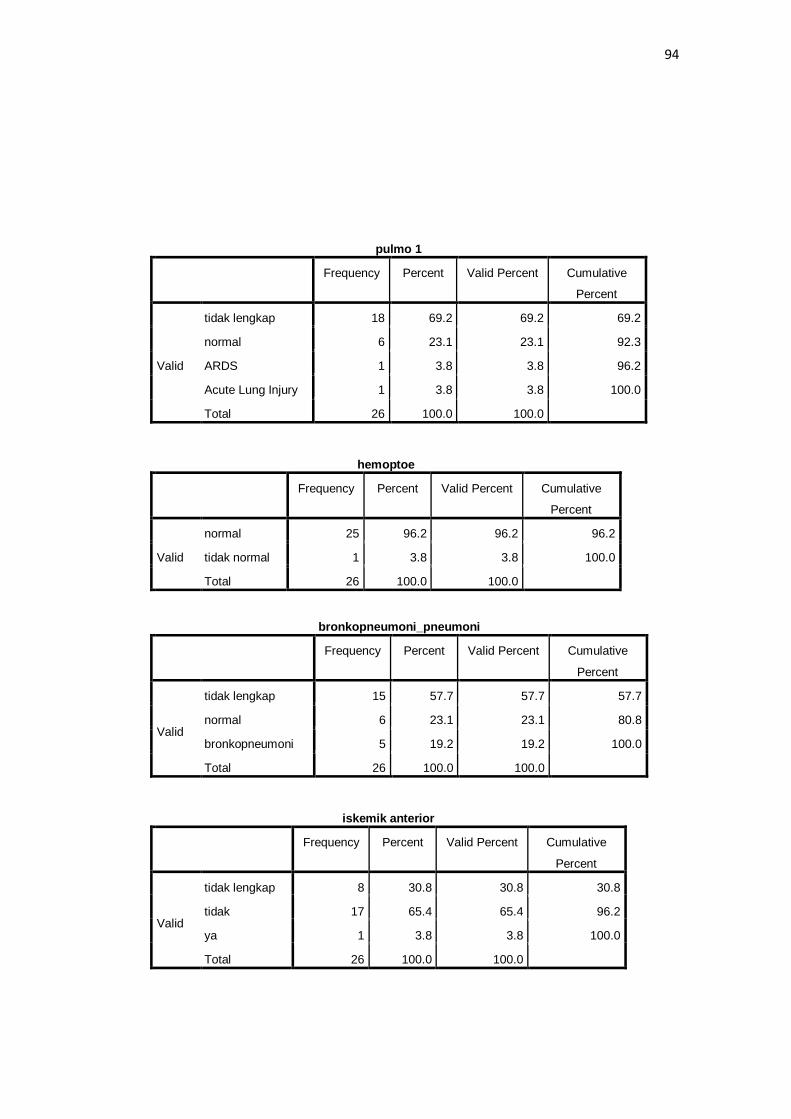
pulmo 1
Frequency Percent Valid Percent Cumulative
Percent
Valid
tidak lengkap 18 69.2 69.2 69.2
normal 6 23.1 23.1 92.3
ARDS 1 3.8 3.8 96.2
Acute Lung Injury 1 3.8 3.8 100.0
Total 26 100.0 100.0
hemoptoe
Frequency Percent Valid Percent Cumulative
Percent
Valid
normal 25 96.2 96.2 96.2
tidak normal 1 3.8 3.8 100.0
Total 26 100.0 100.0
bronkopneumoni_pneumoni
Frequency Percent Valid Percent Cumulative
Percent
Valid
tidak lengkap 15 57.7 57.7 57.7
normal 6 23.1 23.1 80.8
bronkopneumoni 5 19.2 19.2 100.0
Total 26 100.0 100.0
iskemik anterior
Frequency Percent Valid Percent Cumulative
Percent
Valid
tidak lengkap 8 30.8 30.8 30.8
tidak 17 65.4 65.4 96.2
ya 1 3.8 3.8 100.0
Total 26 100.0 100.0
95
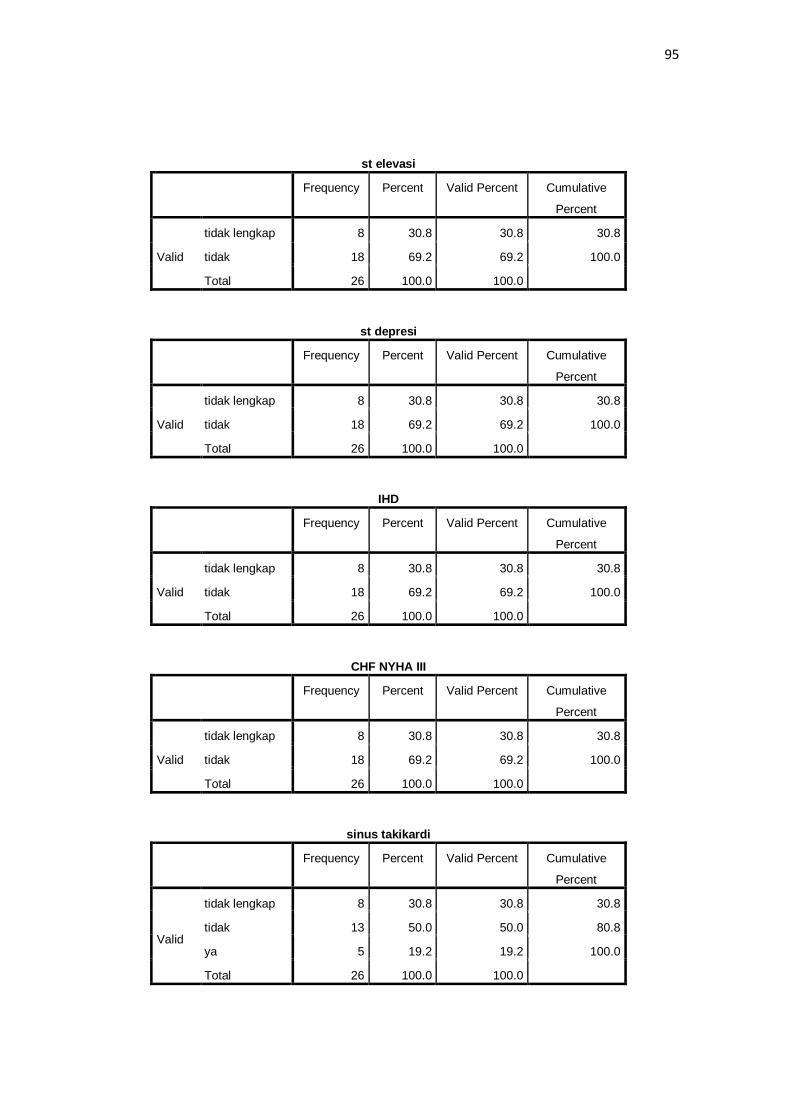
st elevasi
Frequency Percent Valid Percent Cumulative
Percent
Valid
tidak lengkap 8 30.8 30.8 30.8
tidak 18 69.2 69.2 100.0
Total 26 100.0 100.0
st depresi
Frequency Percent Valid Percent Cumulative
Percent
Valid
tidak lengkap 8 30.8 30.8 30.8
tidak 18 69.2 69.2 100.0
Total 26 100.0 100.0
IHD
Frequency Percent Valid Percent Cumulative
Percent
Valid
tidak lengkap 8 30.8 30.8 30.8
tidak 18 69.2 69.2 100.0
Total 26 100.0 100.0
CHF NYHA III
Frequency Percent Valid Percent Cumulative
Percent
Valid
tidak lengkap 8 30.8 30.8 30.8
tidak 18 69.2 69.2 100.0
Total 26 100.0 100.0
sinus takikardi
Frequency Percent Valid Percent Cumulative
Percent
Valid
tidak lengkap 8 30.8 30.8 30.8
tidak 13 50.0 50.0 80.8
ya 5 19.2 19.2 100.0
Total 26 100.0 100.0
96
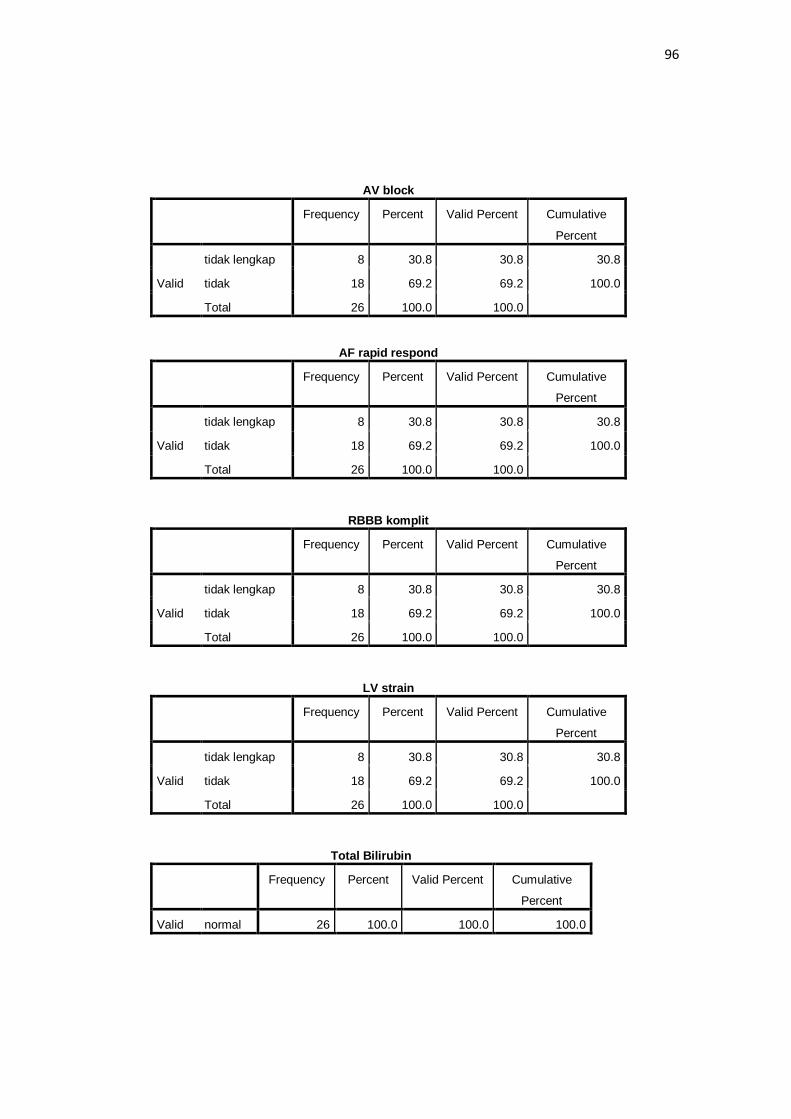
AV block
Frequency Percent Valid Percent Cumulative
Percent
Valid
tidak lengkap 8 30.8 30.8 30.8
tidak 18 69.2 69.2 100.0
Total 26 100.0 100.0
AF rapid respond
Frequency Percent Valid Percent Cumulative
Percent
Valid
tidak lengkap 8 30.8 30.8 30.8
tidak 18 69.2 69.2 100.0
Total 26 100.0 100.0
RBBB komplit
Frequency Percent Valid Percent Cumulative
Percent
Valid
tidak lengkap 8 30.8 30.8 30.8
tidak 18 69.2 69.2 100.0
Total 26 100.0 100.0
LV strain
Frequency Percent Valid Percent Cumulative
Percent
Valid
tidak lengkap 8 30.8 30.8 30.8
tidak 18 69.2 69.2 100.0
Total 26 100.0 100.0
Total Bilirubin
Frequency Percent Valid Percent Cumulative
Percent
Valid normal 26 100.0 100.0 100.0
97
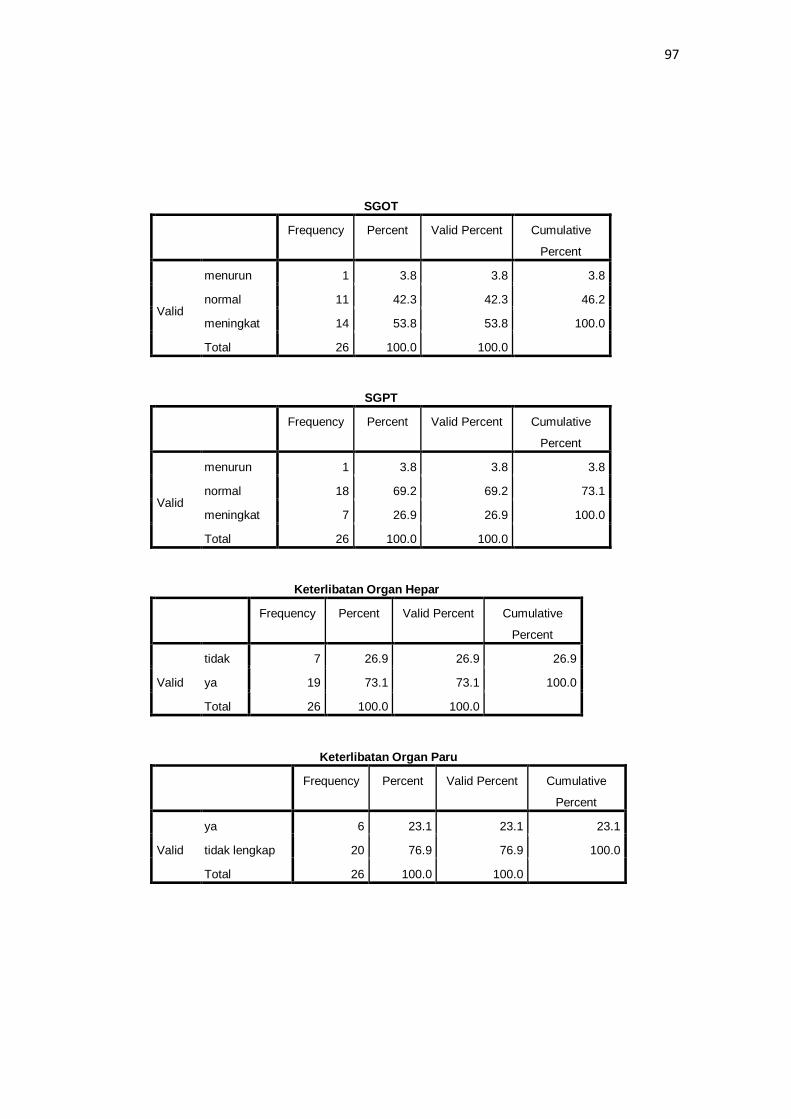
SGOT
Frequency Percent Valid Percent Cumulative
Percent
Valid
menurun 1 3.8 3.8 3.8
normal 11 42.3 42.3 46.2
meningkat 14 53.8 53.8 100.0
Total 26 100.0 100.0
SGPT
Frequency Percent Valid Percent Cumulative
Percent
Valid
menurun 1 3.8 3.8 3.8
normal 18 69.2 69.2 73.1
meningkat 7 26.9 26.9 100.0
Total 26 100.0 100.0
Keterlibatan Organ Hepar
Frequency Percent Valid Percent Cumulative
Percent
Valid
tidak 7 26.9 26.9 26.9
ya 19 73.1 73.1 100.0
Total 26 100.0 100.0
Keterlibatan Organ Paru
Frequency Percent Valid Percent Cumulative
Percent
Valid
ya 6 23.1 23.1 23.1
tidak lengkap 20 76.9 76.9 100.0
Total 26 100.0 100.0
98
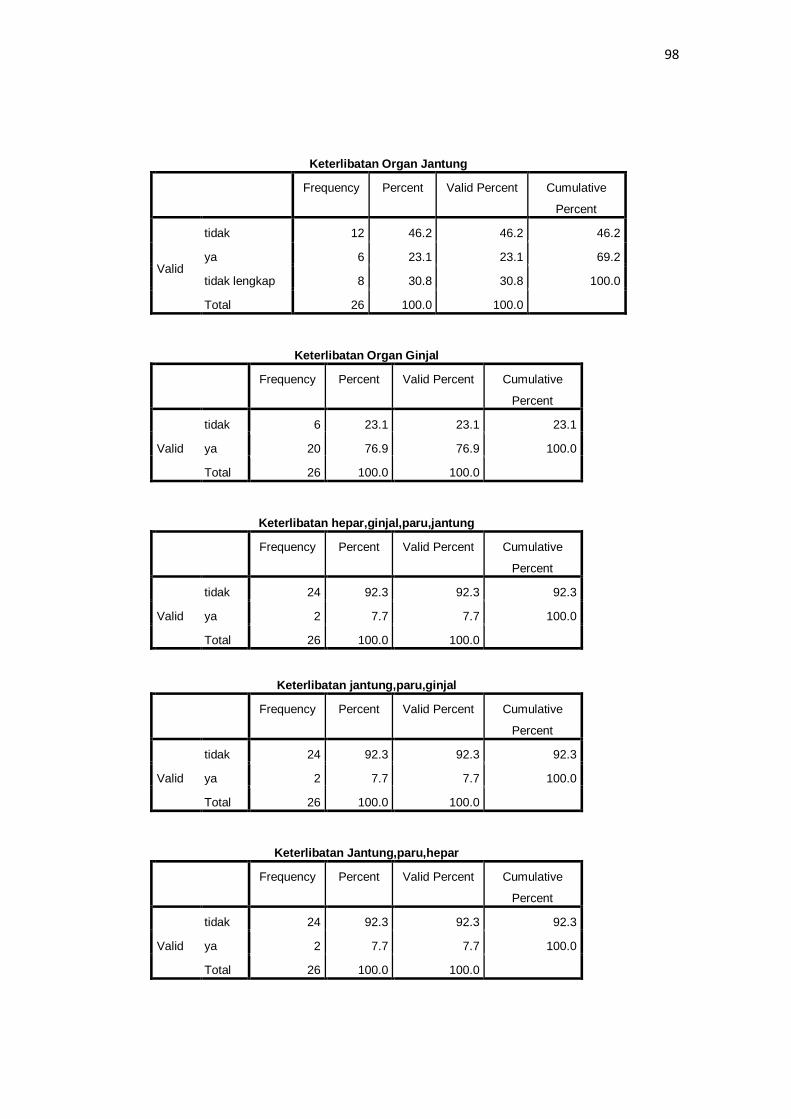
Keterlibatan Organ Jantung
Frequency Percent Valid Percent Cumulative
Percent
Valid
tidak 12 46.2 46.2 46.2
ya 6 23.1 23.1 69.2
tidak lengkap 8 30.8 30.8 100.0
Total 26 100.0 100.0
Keterlibatan Organ Ginjal
Frequency Percent Valid Percent Cumulative
Percent
Valid
tidak 6 23.1 23.1 23.1
ya 20 76.9 76.9 100.0
Total 26 100.0 100.0
Keterlibatan hepar,ginjal,paru,jantung
Frequency Percent Valid Percent Cumulative
Percent
Valid
tidak 24 92.3 92.3 92.3
ya 2 7.7 7.7 100.0
Total 26 100.0 100.0
Keterlibatan jantung,paru,ginjal
Frequency Percent Valid Percent Cumulative
Percent
Valid
tidak 24 92.3 92.3 92.3
ya 2 7.7 7.7 100.0
Total 26 100.0 100.0
Keterlibatan Jantung,paru,hepar
Frequency Percent Valid Percent Cumulative
Percent
Valid
tidak 24 92.3 92.3 92.3
ya 2 7.7 7.7 100.0
Total 26 100.0 100.0
99
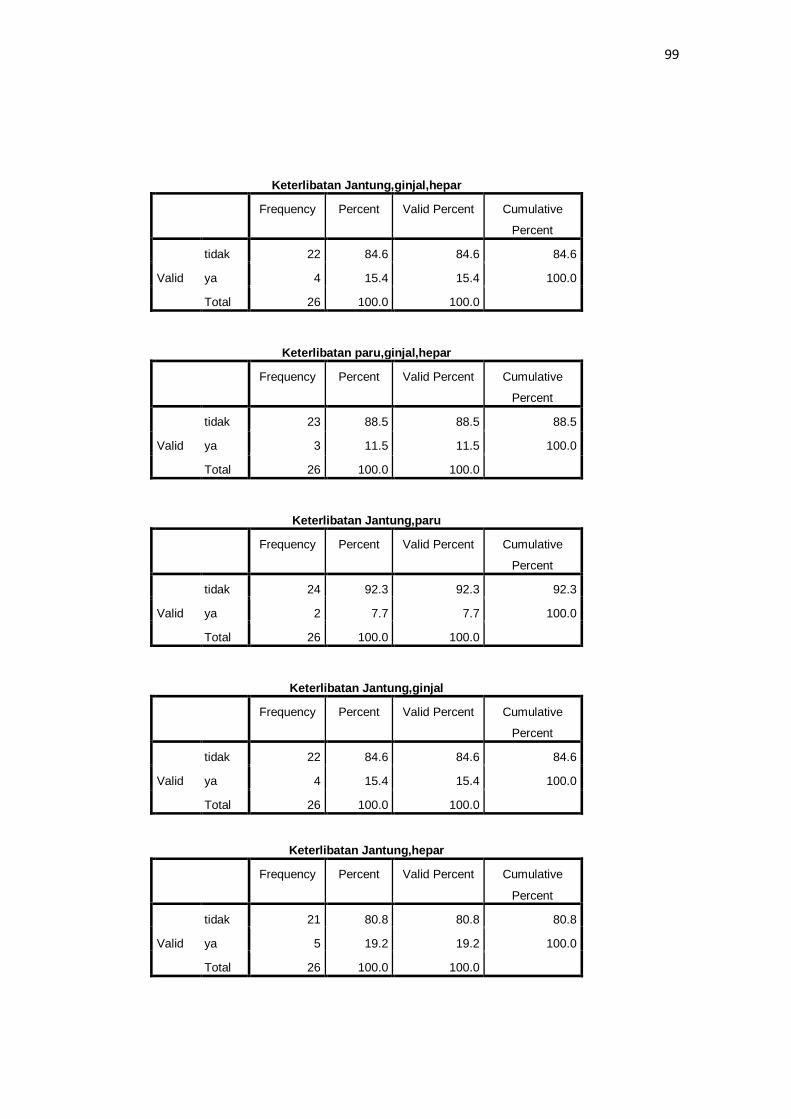
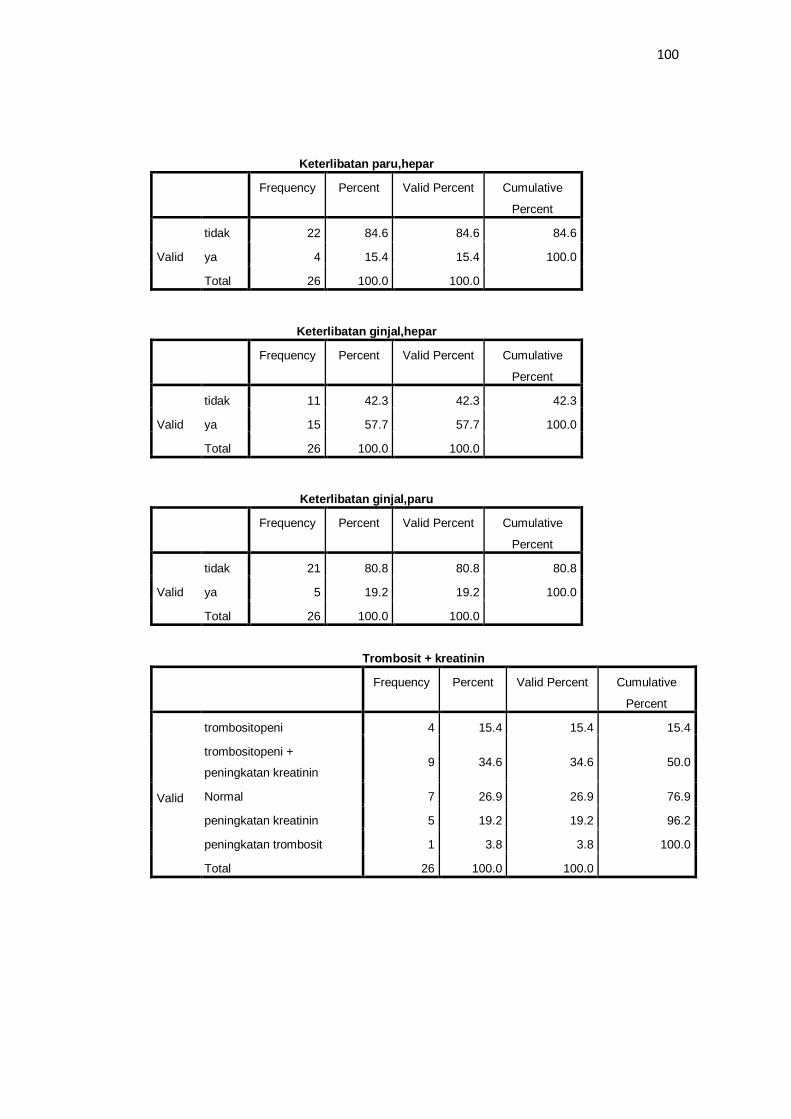
Keterlibatan Jantung,ginjal,hepar
Frequency Percent Valid Percent Cumulative
Percent
Valid
tidak 22 84.6 84.6 84.6
ya 4 15.4 15.4 100.0
Total 26 100.0 100.0
Keterlibatan paru,ginjal,hepar
Frequency Percent Valid Percent Cumulative
Percent
Valid
tidak 23 88.5 88.5 88.5
ya 3 11.5 11.5 100.0
Total 26 100.0 100.0
Keterlibatan Jantung,paru
Frequency Percent Valid Percent Cumulative
Percent
Valid
tidak 24 92.3 92.3 92.3
ya 2 7.7 7.7 100.0
Total 26 100.0 100.0
Keterlibatan Jantung,ginjal
Frequency Percent Valid Percent Cumulative
Percent
Valid
tidak 22 84.6 84.6 84.6
ya 4 15.4 15.4 100.0
Total 26 100.0 100.0
Keterlibatan Jantung,hepar
Frequency Percent Valid Percent Cumulative
Percent
Valid
tidak 21 80.8 80.8 80.8
ya 5 19.2 19.2 100.0
Total 26 100.0 100.0
100
Keterlibatan paru,hepar
Frequency Percent Valid Percent Cumulative
Percent
Valid
tidak 22 84.6 84.6 84.6
ya 4 15.4 15.4 100.0
Total 26 100.0 100.0
Keterlibatan ginjal,hepar
Frequency Percent Valid Percent Cumulative
Percent
Valid
tidak 11 42.3 42.3 42.3
ya 15 57.7 57.7 100.0
Total 26 100.0 100.0
Keterlibatan ginjal,paru
Frequency Percent Valid Percent Cumulative
Percent
Valid
tidak 21 80.8 80.8 80.8
ya 5 19.2 19.2 100.0
Total 26 100.0 100.0
Trombosit + kreatinin
Frequency Percent Valid Percent Cumulative
Percent
Valid
trombositopeni 4 15.4 15.4 15.4
trombositopeni +
peningkatan kreatinin 9 34.6 34.6 50.0
Normal 7 26.9 26.9 76.9
peningkatan kreatinin 5 19.2 19.2 96.2
peningkatan trombosit 1 3.8 3.8 100.0
Total 26 100.0 100.0
101
Crosstabs
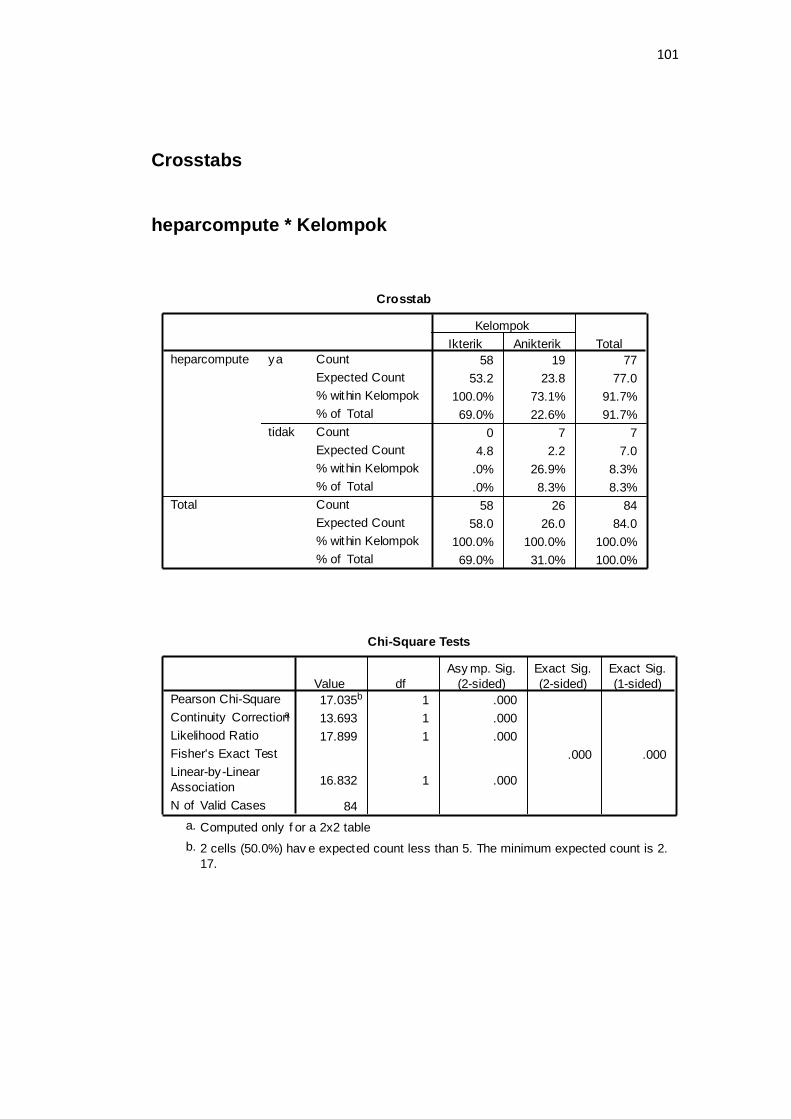
heparcompute * Kelompok
Crosstab
58 19 77
53.2 23.8 77.0
100.0% 73.1% 91.7%
69.0% 22.6% 91.7%
0 7 7
4.8 2.2 7.0
.0% 26.9% 8.3%
.0% 8.3% 8.3%
58 26 84
58.0 26.0 84.0
100.0% 100.0% 100.0%
69.0% 31.0% 100.0%
Count
Expected Count
% within Kelompok
% of Total
Count
Expected Count
% within Kelompok
% of Total
Count
Expected Count
% within Kelompok
% of Total
ya
tidak
heparcompute
Total
Ikterik Anikterik
Kelompok
Total
Chi-Square Tests
17.035b 1 .000
13.693 1 .000
17.899 1 .000
.000 .000
16.832 1 .000
84
Pearson Chi-Square
Continuity Correctiona
Likelihood Ratio
Fisher's Exact Test
Linear-by-Linear
Association
N of Valid Cases
Value df
Asy mp. Sig.
(2-sided)
Exact Sig.
(2-sided)
Exact Sig.
(1-sided)
Computed only f or a 2x2 tablea.
2 cells (50.0%) hav e expected count less than 5. The minimum expected count is 2.
17.
b.
102
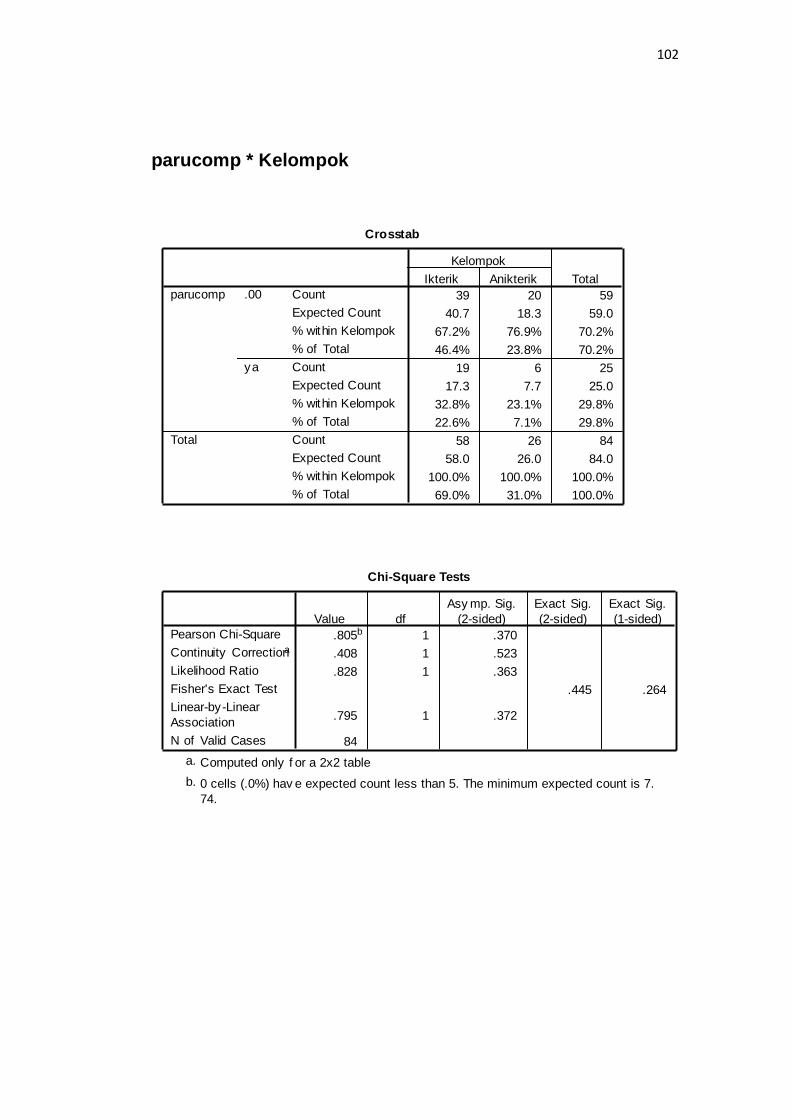
parucomp * Kelompok
Crosstab
39 20 59
40.7 18.3 59.0
67.2% 76.9% 70.2%
46.4% 23.8% 70.2%
19 6 25
17.3 7.7 25.0
32.8% 23.1% 29.8%
22.6% 7.1% 29.8%
58 26 84
58.0 26.0 84.0
100.0% 100.0% 100.0%
69.0% 31.0% 100.0%
Count
Expected Count
% within Kelompok
% of Total
Count
Expected Count
% within Kelompok
% of Total
Count
Expected Count
% within Kelompok
% of Total
.00
ya
parucomp
Total
Ikterik Anikterik
Kelompok
Total
Chi-Square Tests
.805b 1 .370
.408 1 .523
.828 1 .363
.445 .264
.795 1 .372
84
Pearson Chi-Square
Continuity Correctiona
Likelihood Ratio
Fisher's Exact Test
Linear-by-Linear
Association
N of Valid Cases
Value df
Asy mp. Sig.
(2-sided)
Exact Sig.
(2-sided)
Exact Sig.
(1-sided)
Computed only f or a 2x2 tablea.
0 cells (.0%) hav e expected count less than 5. The minimum expected count is 7.
74.
b.

103
jantungcomp * Kelompok
Crosstab
19 6 25
17.3 7.7 25.0
32.8% 23.1% 29.8%
22.6% 7.1% 29.8%
39 20 59
40.7 18.3 59.0
67.2% 76.9% 70.2%
46.4% 23.8% 70.2%
58 26 84
58.0 26.0 84.0
100.0% 100.0% 100.0%
69.0% 31.0% 100.0%
Count
Expected Count
% within Kelompok
% of Total
Count
Expected Count
% within Kelompok
% of Total
Count
Expected Count
% within Kelompok
% of Total
ya
tidak
jantungcomp
Total
Ikterik Anikterik
Kelompok
Total
Chi-Square Tests
.805b 1 .370
.408 1 .523
.828 1 .363
.445 .264
.795 1 .372
84
Pearson Chi-Square
Continuity Correctiona
Likelihood Ratio
Fisher's Exact Test
Linear-by-Linear
Association
N of Valid Cases
Value df
Asy mp. Sig.
(2-sided)
Exact Sig.
(2-sided)
Exact Sig.
(1-sided)
Computed only f or a 2x2 tablea.
0 cells (.0%) hav e expected count less than 5. The minimum expected count is 7.
74.
b.

104
ginjalcomp * Kelompok
Crosstab
57 20 77
53.2 23.8 77.0
98.3% 76.9% 91.7%
67.9% 23.8% 91.7%
1 6 7
4.8 2.2 7.0
1.7% 23.1% 8.3%
1.2% 7.1% 8.3%
58 26 84
58.0 26.0 84.0
100.0% 100.0% 100.0%
69.0% 31.0% 100.0%
Count
Expected Count
% within Kelompok
% of Total
Count
Expected Count
% within Kelompok
% of Total
Count
Expected Count
% within Kelompok
% of Total
ya
tidak
ginjalcomp
Total
Ikterik Anikterik
Kelompok
Total
Chi-Square Tests
10.715b 1 .001
8.102 1 .004
9.994 1 .002
.003 .003
10.588 1 .001
84
Pearson Chi-Square
Continuity Correctiona
Likelihood Ratio
Fisher's Exact Test
Linear-by-Linear
Association
N of Valid Cases
Value df
Asy mp. Sig.
(2-sided)
Exact Sig.
(2-sided)
Exact Sig.
(1-sided)
Computed only f or a 2x2 tablea.
2 cells (50.0%) hav e expected count less than 5. The minimum expected count is 2.
17.
b.
105
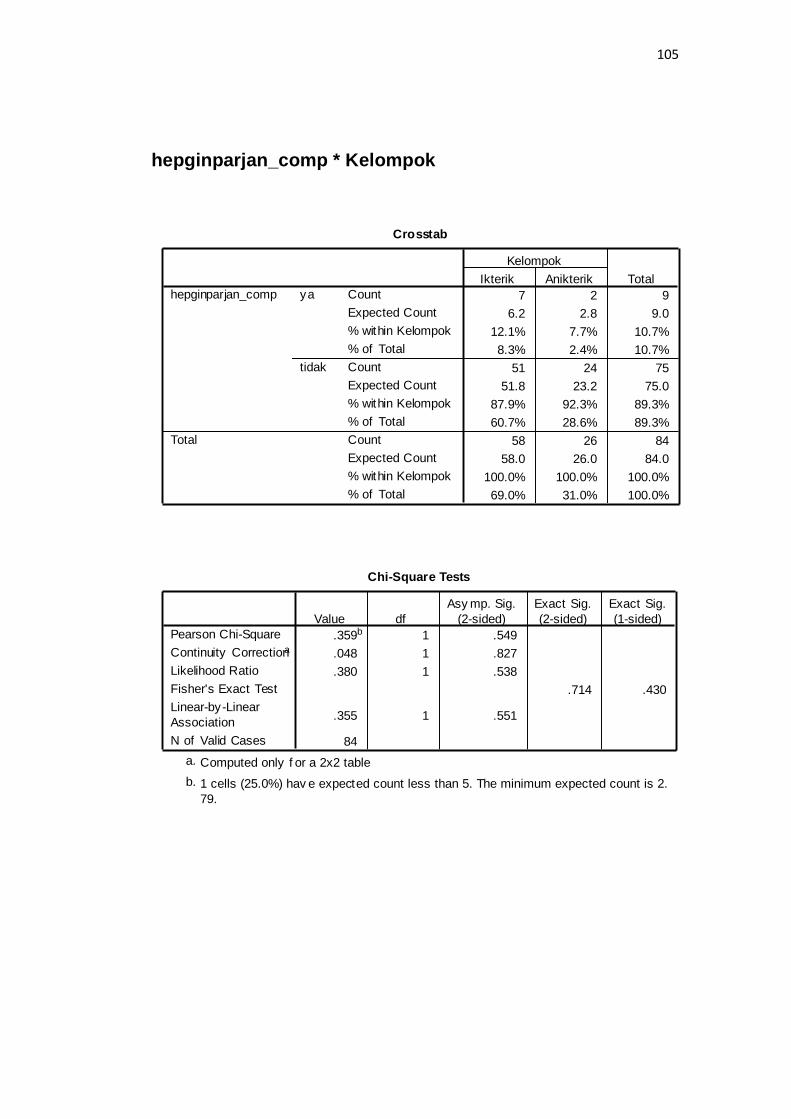
hepginparjan_comp * Kelompok
Crosstab
7 2 9
6.2 2.8 9.0
12.1% 7.7% 10.7%
8.3% 2.4% 10.7%
51 24 75
51.8 23.2 75.0
87.9% 92.3% 89.3%
60.7% 28.6% 89.3%
58 26 84
58.0 26.0 84.0
100.0% 100.0% 100.0%
69.0% 31.0% 100.0%
Count
Expected Count
% within Kelompok
% of Total
Count
Expected Count
% within Kelompok
% of Total
Count
Expected Count
% within Kelompok
% of Total
ya
tidak
hepginparjan_comp
Total
Ikterik Anikterik
Kelompok
Total
Chi-Square Tests
.359b 1 .549
.048 1 .827
.380 1 .538
.714 .430
.355 1 .551
84
Pearson Chi-Square
Continuity Correctiona
Likelihood Ratio
Fisher's Exact Test
Linear-by-Linear
Association
N of Valid Cases
Value df
Asy mp. Sig.
(2-sided)
Exact Sig.
(2-sided)
Exact Sig.
(1-sided)
Computed only f or a 2x2 tablea.
1 cells (25.0%) hav e expected count less than 5. The minimum expected count is 2.
79.
b.

106
janpargincom * Kelompok
Crosstab
7 2 9
6.2 2.8 9.0
12.1% 7.7% 10.7%
8.3% 2.4% 10.7%
51 24 75
51.8 23.2 75.0
87.9% 92.3% 89.3%
60.7% 28.6% 89.3%
58 26 84
58.0 26.0 84.0
100.0% 100.0% 100.0%
69.0% 31.0% 100.0%
Count
Expected Count
% within Kelompok
% of Total
Count
Expected Count
% within Kelompok
% of Total
Count
Expected Count
% within Kelompok
% of Total
ya
tidak
janpargincom
Total
Ikterik Anikterik
Kelompok
Total
Chi-Square Tests
.359b 1 .549
.048 1 .827
.380 1 .538
.714 .430
.355 1 .551
84
Pearson Chi-Square
Continuity Correctiona
Likelihood Ratio
Fisher's Exact Test
Linear-by-Linear
Association
N of Valid Cases
Value df
Asy mp. Sig.
(2-sided)
Exact Sig.
(2-sided)
Exact Sig.
(1-sided)
Computed only f or a 2x2 tablea.
1 cells (25.0%) hav e expected count less than 5. The minimum expected count is 2.
79.
b.
107
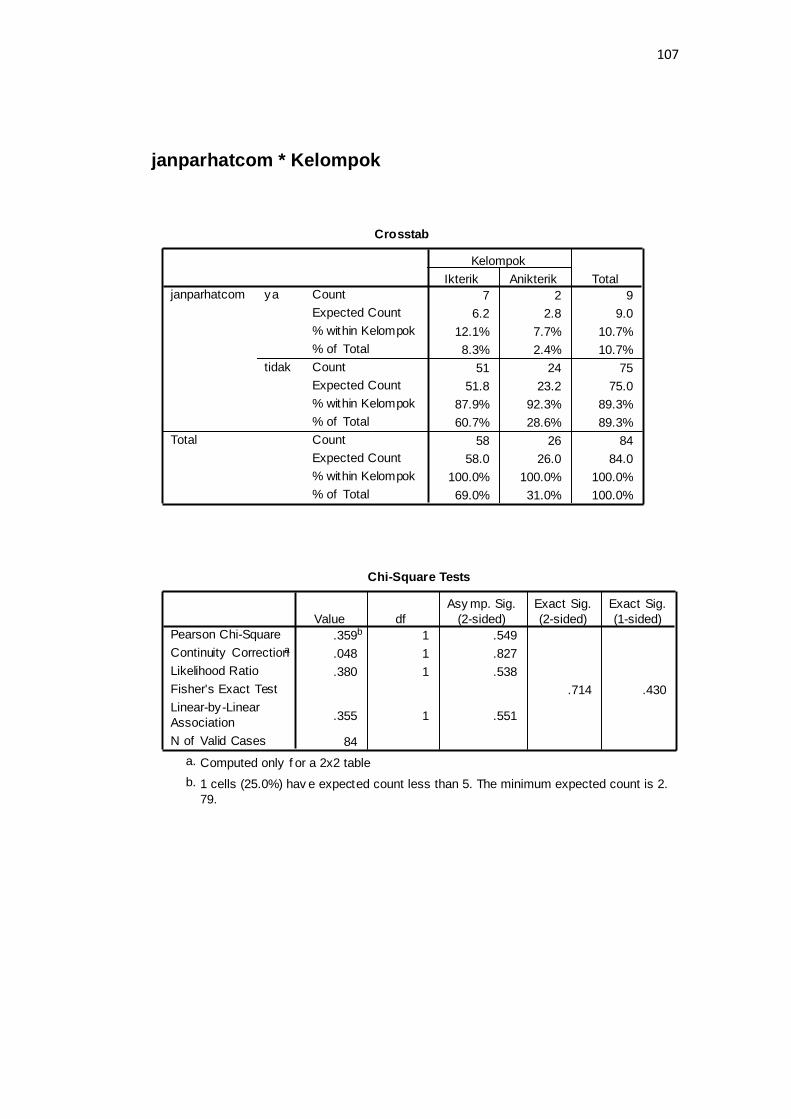
janparhatcom * Kelompok
Crosstab
7 2 9
6.2 2.8 9.0
12.1% 7.7% 10.7%
8.3% 2.4% 10.7%
51 24 75
51.8 23.2 75.0
87.9% 92.3% 89.3%
60.7% 28.6% 89.3%
58 26 84
58.0 26.0 84.0
100.0% 100.0% 100.0%
69.0% 31.0% 100.0%
Count
Expected Count
% within Kelompok
% of Total
Count
Expected Count
% within Kelompok
% of Total
Count
Expected Count
% within Kelompok
% of Total
ya
tidak
janparhatcom
Total
Ikterik Anikterik
Kelompok
Total
Chi-Square Tests
.359b 1 .549
.048 1 .827
.380 1 .538
.714 .430
.355 1 .551
84
Pearson Chi-Square
Continuity Correctiona
Likelihood Ratio
Fisher's Exact Test
Linear-by-Linear
Association
N of Valid Cases
Value df
Asy mp. Sig.
(2-sided)
Exact Sig.
(2-sided)
Exact Sig.
(1-sided)
Computed only f or a 2x2 tablea.
1 cells (25.0%) hav e expected count less than 5. The minimum expected count is 2.
79.
b.

108
janginhatcom * Kelompok
Crosstab
19 4 23
15.9 7.1 23.0
32.8% 15.4% 27.4%
22.6% 4.8% 27.4%
39 22 61
42.1 18.9 61.0
67.2% 84.6% 72.6%
46.4% 26.2% 72.6%
58 26 84
58.0 26.0 84.0
100.0% 100.0% 100.0%
69.0% 31.0% 100.0%
Count
Expected Count
% within Kelompok
% of Total
Count
Expected Count
% within Kelompok
% of Total
Count
Expected Count
% within Kelompok
% of Total
ya
tidak
janginhatcom
Total
Ikterik Anikterik
Kelompok
Total
Chi-Square Tests
2.725b 1 .099
1.922 1 .166
2.928 1 .087
.119 .080
2.693 1 .101
84
Pearson Chi-Square
Continuity Correctiona
Likelihood Ratio
Fisher's Exact Test
Linear-by-Linear
Association
N of Valid Cases
Value df
Asy mp. Sig.
(2-sided)
Exact Sig.
(2-sided)
Exact Sig.
(1-sided)
Computed only f or a 2x2 tablea.
0 cells (.0%) hav e expected count less than 5. The minimum expected count is 7.
12.
b.
109
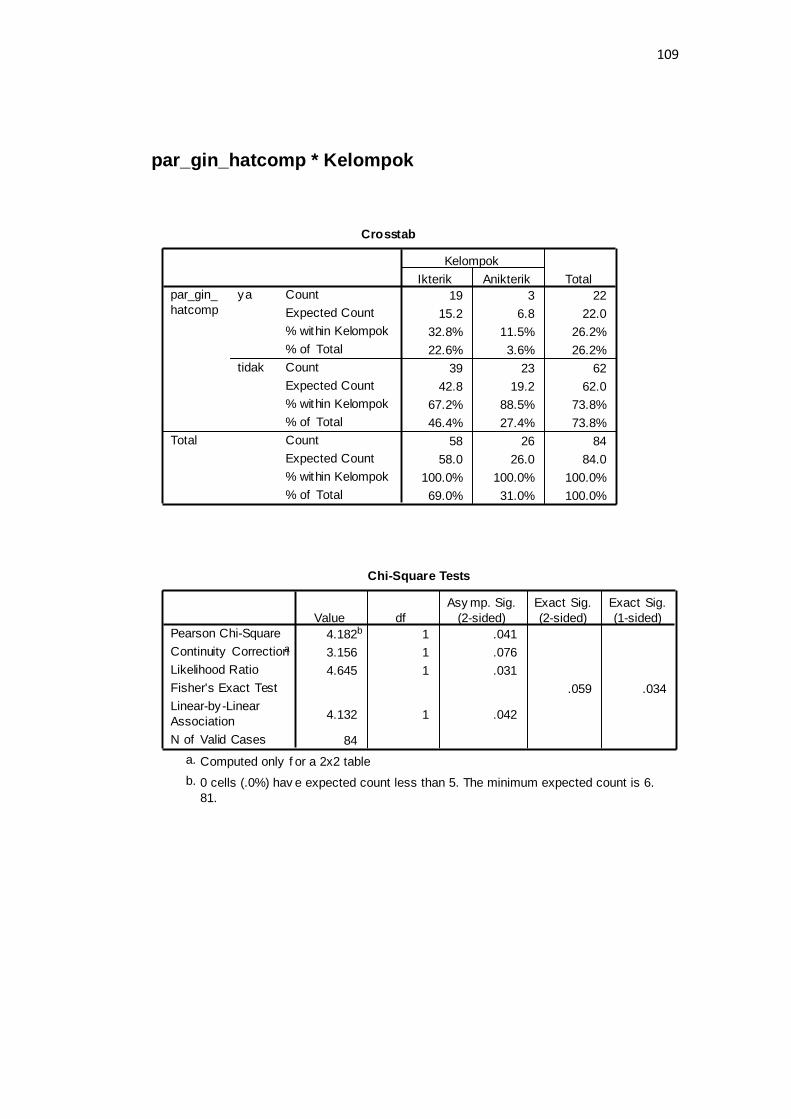
par_gin_hatcomp * Kelompok
Crosstab
19 3 22
15.2 6.8 22.0
32.8% 11.5% 26.2%
22.6% 3.6% 26.2%
39 23 62
42.8 19.2 62.0
67.2% 88.5% 73.8%
46.4% 27.4% 73.8%
58 26 84
58.0 26.0 84.0
100.0% 100.0% 100.0%
69.0% 31.0% 100.0%
Count
Expected Count
% within Kelompok
% of Total
Count
Expected Count
% within Kelompok
% of Total
Count
Expected Count
% within Kelompok
% of Total
ya
tidak
par_gin_
hatcomp
Total
Ikterik Anikterik
Kelompok
Total
Chi-Square Tests
4.182b 1 .041
3.156 1 .076
4.645 1 .031
.059 .034
4.132 1 .042
84
Pearson Chi-Square
Continuity Correctiona
Likelihood Ratio
Fisher's Exact Test
Linear-by-Linear
Association
N of Valid Cases
Value df
Asy mp. Sig.
(2-sided)
Exact Sig.
(2-sided)
Exact Sig.
(1-sided)
Computed only f or a 2x2 tablea.
0 cells (.0%) hav e expected count less than 5. The minimum expected count is 6.
81.
b.
110
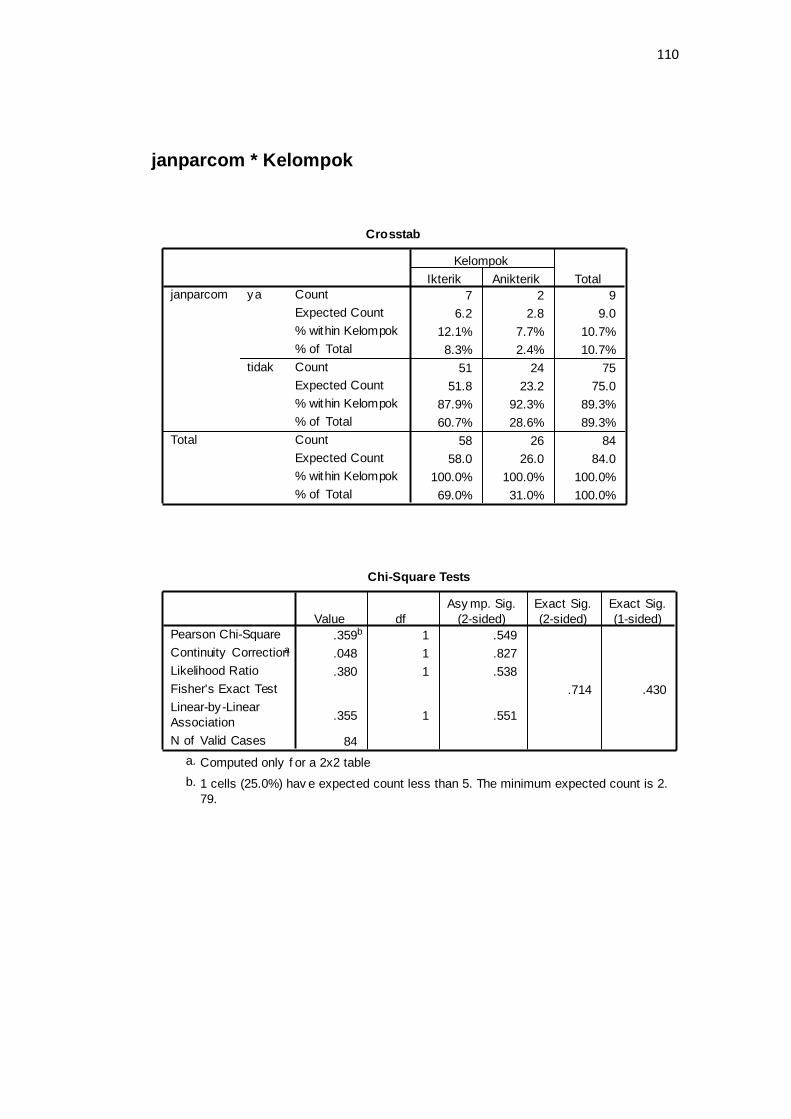
janparcom * Kelompok
Crosstab
7 2 9
6.2 2.8 9.0
12.1% 7.7% 10.7%
8.3% 2.4% 10.7%
51 24 75
51.8 23.2 75.0
87.9% 92.3% 89.3%
60.7% 28.6% 89.3%
58 26 84
58.0 26.0 84.0
100.0% 100.0% 100.0%
69.0% 31.0% 100.0%
Count
Expected Count
% within Kelompok
% of Total
Count
Expected Count
% within Kelompok
% of Total
Count
Expected Count
% within Kelompok
% of Total
ya
tidak
janparcom
Total
Ikterik Anikterik
Kelompok
Total
Chi-Square Tests
.359b 1 .549
.048 1 .827
.380 1 .538
.714 .430
.355 1 .551
84
Pearson Chi-Square
Continuity Correctiona
Likelihood Ratio
Fisher's Exact Test
Linear-by-Linear
Association
N of Valid Cases
Value df
Asy mp. Sig.
(2-sided)
Exact Sig.
(2-sided)
Exact Sig.
(1-sided)
Computed only f or a 2x2 tablea.
1 cells (25.0%) hav e expected count less than 5. The minimum expected count is 2.
79.
b.

111
jangincom * Kelompok
Crosstab
19 4 23
15.9 7.1 23.0
32.8% 15.4% 27.4%
22.6% 4.8% 27.4%
39 22 61
42.1 18.9 61.0
67.2% 84.6% 72.6%
46.4% 26.2% 72.6%
58 26 84
58.0 26.0 84.0
100.0% 100.0% 100.0%
69.0% 31.0% 100.0%
Count
Expected Count
% within Kelompok
% of Total
Count
Expected Count
% within Kelompok
% of Total
Count
Expected Count
% within Kelompok
% of Total
ya
tidak
jangincom
Total
Ikterik Anikterik
Kelompok
Total
Chi-Square Tests
2.725b 1 .099
1.922 1 .166
2.928 1 .087
.119 .080
2.693 1 .101
84
Pearson Chi-Square
Continuity Correctiona
Likelihood Ratio
Fisher's Exact Test
Linear-by-Linear
Association
N of Valid Cases
Value df
Asy mp. Sig.
(2-sided)
Exact Sig.
(2-sided)
Exact Sig.
(1-sided)
Computed only f or a 2x2 tablea.
0 cells (.0%) hav e expected count less than 5. The minimum expected count is 7.
12.
b.

112
janhatcom * Kelompok
Crosstab
19 5 24
16.6 7.4 24.0
32.8% 19.2% 28.6%
22.6% 6.0% 28.6%
39 21 60
41.4 18.6 60.0
67.2% 80.8% 71.4%
46.4% 25.0% 71.4%
58 26 84
58.0 26.0 84.0
100.0% 100.0% 100.0%
69.0% 31.0% 100.0%
Count
Expected Count
% within Kelompok
% of Total
Count
Expected Count
% within Kelompok
% of Total
Count
Expected Count
% within Kelompok
% of Total
ya
tidak
janhatcom
Total
Ikterik Anikterik
Kelompok
Total
Chi-Square Tests
1.610b 1 .205
1.015 1 .314
1.688 1 .194
.297 .157
1.591 1 .207
84
Pearson Chi-Square
Continuity Correctiona
Likelihood Ratio
Fisher's Exact Test
Linear-by-Linear
Association
N of Valid Cases
Value df
Asy mp. Sig.
(2-sided)
Exact Sig.
(2-sided)
Exact Sig.
(1-sided)
Computed only f or a 2x2 tablea.
0 cells (.0%) hav e expected count less than 5. The minimum expected count is 7.
43.
b.
113
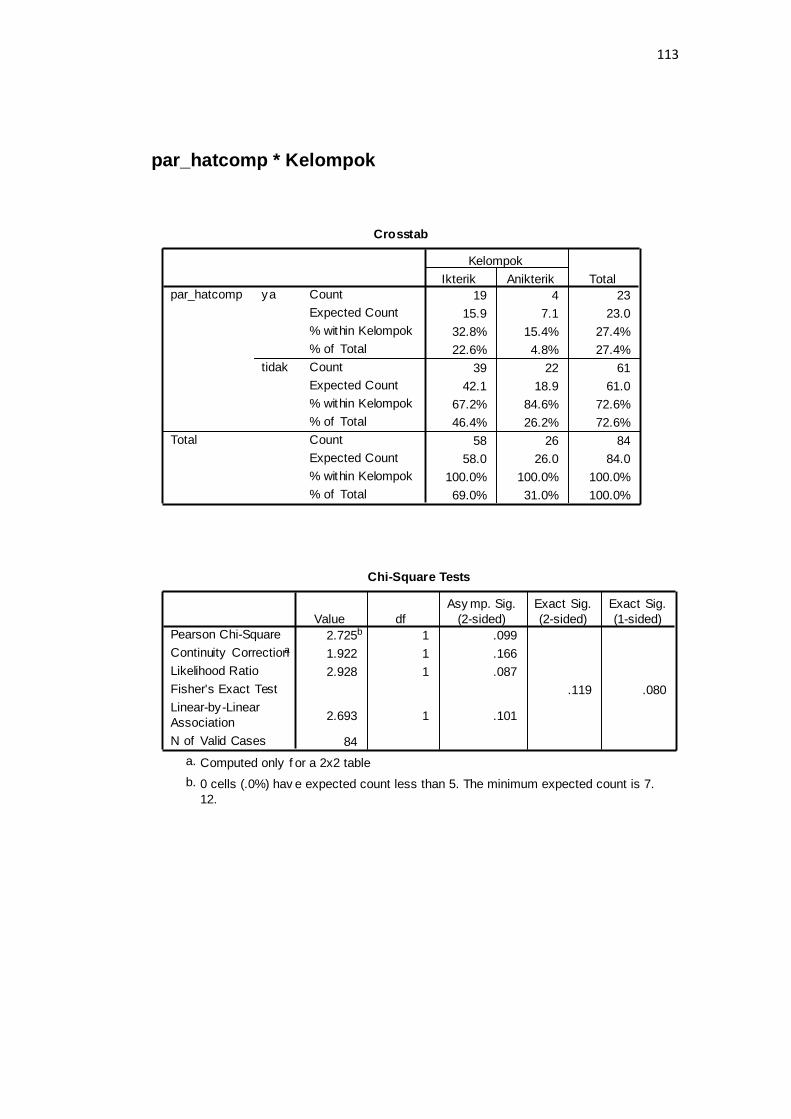
par_hatcomp * Kelompok
Crosstab
19 4 23
15.9 7.1 23.0
32.8% 15.4% 27.4%
22.6% 4.8% 27.4%
39 22 61
42.1 18.9 61.0
67.2% 84.6% 72.6%
46.4% 26.2% 72.6%
58 26 84
58.0 26.0 84.0
100.0% 100.0% 100.0%
69.0% 31.0% 100.0%
Count
Expected Count
% within Kelompok
% of Total
Count
Expected Count
% within Kelompok
% of Total
Count
Expected Count
% within Kelompok
% of Total
ya
tidak
par_hatcomp
Total
Ikterik Anikterik
Kelompok
Total
Chi-Square Tests
2.725b 1 .099
1.922 1 .166
2.928 1 .087
.119 .080
2.693 1 .101
84
Pearson Chi-Square
Continuity Correctiona
Likelihood Ratio
Fisher's Exact Test
Linear-by-Linear
Association
N of Valid Cases
Value df
Asy mp. Sig.
(2-sided)
Exact Sig.
(2-sided)
Exact Sig.
(1-sided)
Computed only f or a 2x2 tablea.
0 cells (.0%) hav e expected count less than 5. The minimum expected count is 7.
12.
b.

114
gin_hatcomp * Kelompok
Crosstab
57 15 72
49.7 22.3 72.0
98.3% 57.7% 85.7%
67.9% 17.9% 85.7%
1 11 12
8.3 3.7 12.0
1.7% 42.3% 14.3%
1.2% 13.1% 14.3%
58 26 84
58.0 26.0 84.0
100.0% 100.0% 100.0%
69.0% 31.0% 100.0%
Count
Expected Count
% within Kelompok
% of Total
Count
Expected Count
% within Kelompok
% of Total
Count
Expected Count
% within Kelompok
% of Total
ya
tidak
gin_hatcomp
Total
Ikterik Anikterik
Kelompok
Total
Chi-Square Tests
24.147b 1 .000
20.947 1 .000
23.370 1 .000
.000 .000
23.860 1 .000
84
Pearson Chi-Square
Continuity Correctiona
Likelihood Ratio
Fisher's Exact Test
Linear-by-Linear
Association
N of Valid Cases
Value df
Asy mp. Sig.
(2-sided)
Exact Sig.
(2-sided)
Exact Sig.
(1-sided)
Computed only f or a 2x2 tablea.
1 cells (25.0%) hav e expected count less than 5. The minimum expected count is 3.
71.
b.

115
gin_parcomp * Kelompok
Crosstab
19 5 24
16.6 7.4 24.0
32.8% 19.2% 28.6%
22.6% 6.0% 28.6%
39 21 60
41.4 18.6 60.0
67.2% 80.8% 71.4%
46.4% 25.0% 71.4%
58 26 84
58.0 26.0 84.0
100.0% 100.0% 100.0%
69.0% 31.0% 100.0%
Count
Expected Count
% within Kelompok
% of Total
Count
Expected Count
% within Kelompok
% of Total
Count
Expected Count
% within Kelompok
% of Total
ya
tidak
gin_parcomp
Total
Ikterik Anikterik
Kelompok
Total
Chi-Square Tests
1.610b 1 .205
1.015 1 .314
1.688 1 .194
.297 .157
1.591 1 .207
84
Pearson Chi-Square
Continuity Correctiona
Likelihood Ratio
Fisher's Exact Test
Linear-by-Linear
Association
N of Valid Cases
Value df
Asy mp. Sig.
(2-sided)
Exact Sig.
(2-sided)
Exact Sig.
(1-sided)
Computed only f or a 2x2 tablea.
0 cells (.0%) hav e expected count less than 5. The minimum expected count is 7.
43.
b.
116
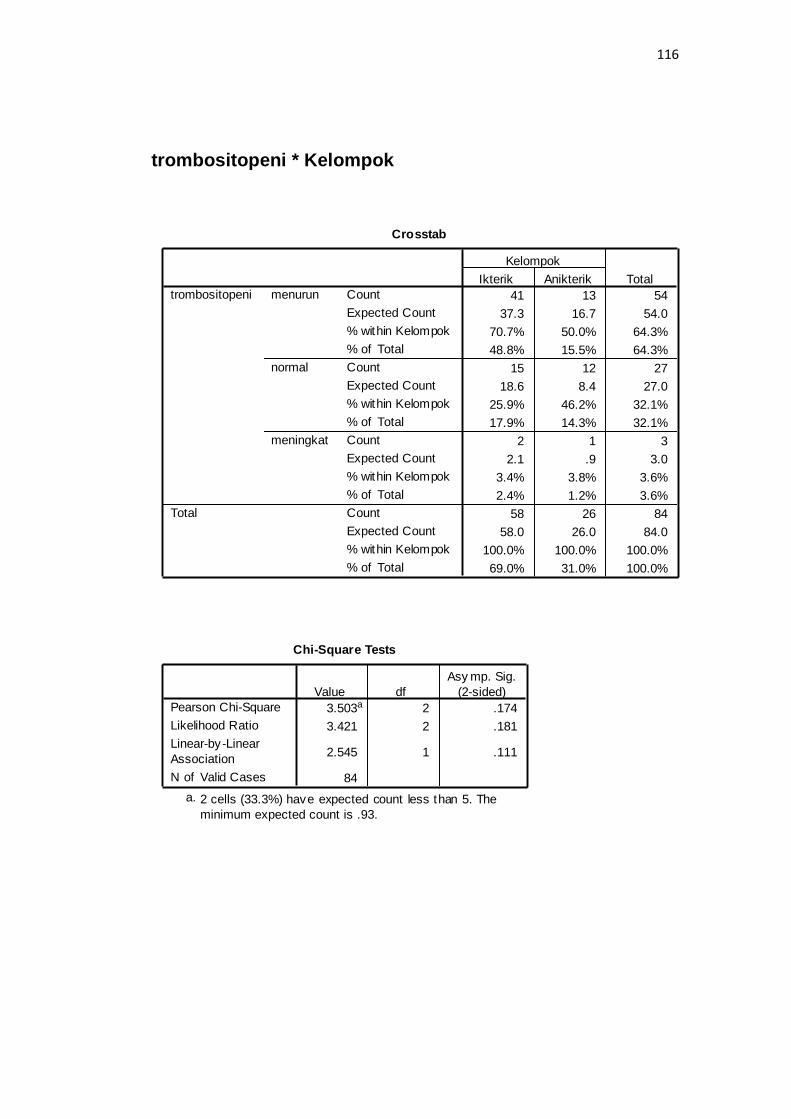
trombositopeni * Kelompok
Crosstab
41 13 54
37.3 16.7 54.0
70.7% 50.0% 64.3%
48.8% 15.5% 64.3%
15 12 27
18.6 8.4 27.0
25.9% 46.2% 32.1%
17.9% 14.3% 32.1%
2 1 3
2.1 .9 3.0
3.4% 3.8% 3.6%
2.4% 1.2% 3.6%
58 26 84
58.0 26.0 84.0
100.0% 100.0% 100.0%
69.0% 31.0% 100.0%
Count
Expected Count
% within Kelompok
% of Total
Count
Expected Count
% within Kelompok
% of Total
Count
Expected Count
% within Kelompok
% of Total
Count
Expected Count
% within Kelompok
% of Total
menurun
normal
meningkat
trombositopeni
Total
Ikterik Anikterik
Kelompok
Total
Chi-Square Tests
3.503a 2 .174
3.421 2 .181
2.545 1 .111
84
Pearson Chi-Square
Likelihood Ratio
Linear-by-Linear
Association
N of Valid Cases
Value df
Asy mp. Sig.
(2-sided)
2 cells (33.3%) have expected count less than 5. The
minimum expected count is .93.
a.
117
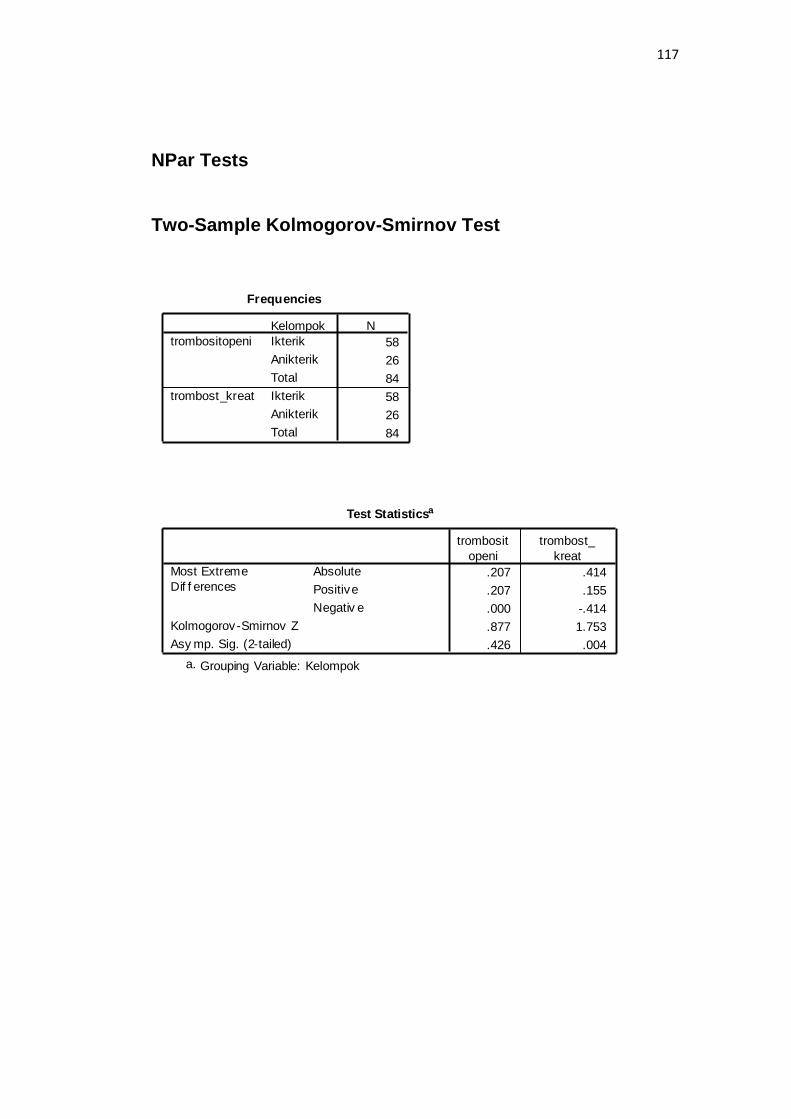
NPar Tests
Two-Sample Kolmogorov-Smirnov Test
Frequencies
58
26
84
58
26
84
Kelompok
Ikterik
Anikterik
Total
Ikterik
Anikterik
Total
trombositopeni
trombost_kreat
N
Test Statisticsa
.207 .414
.207 .155
.000 -.414
.877 1.753
.426 .004
Absolute
Positive
Negativ e
Most Extreme
Dif f erences
Kolmogorov-Smirnov Z
Asy mp. Sig. (2-tailed)
trombosit
openi
trombost_
kreat
Grouping Variable: Kelompoka.
118
Lampiran 4
BIODATA MAHASISWA
Identitas
Nama : R. Ernandy Aryo Hudoyo
NIM : 22010111120011
Tempat/tanggal lahir : Semarang/ 8 September 1993
Jenis Kelamin : Laki-laki
Alamat : Perum. Sinar Sawunggaling A2 Semarang
Nomor Telepon : 024 7460807
Nomor HP : 085641140566
Email : [email protected]
Riwayat Pendidikan Formal
SD : SD Islam Hidayatullah Semarang Lulus tahun: 2005
SMP : SMP Negeri 5 Kota Semarang Lulus tahun: 2008
SMA : SMA Negeri 1 Kota Semarang Lulus tahun: 2011
Keanggotaan Organisasi
1. Staff Hubungan Luar HIMA KU 2012
2. Staff KSKI ROHIS KU 2012
3. Staff Social Art AMSA 2012
4. Kabid Hubungan Luar HIMA KU 2013
5. PHW Pengmas ISMKI Wilayah III 2013
6. Kordep Hubungan Luar HIMA KU 2014
7. Anggota Paduan Suara Mahasiswa FK UNDIP 2011-2015

119