
DAFTAR PUSTAKA -...
47
71 DAFTAR PUSTAKA 1. F. Cunningham, Kenneth Leveno, Steven Bloom, John Hauth, Dwight Rouse CS. Williams Obstetrics: 23rd Edition McGraw-Hill’s AccessMedicine. 23rd ed. McGraw Hill Professional; 2009. 2. WHO, UNICEF, UNFPA, World Bank Group the and United Nations Populations Division. Trends in Maternal Mortality : 1990 to 2015. Organization. 2015;32(5):1-55. 3. World Health Organization (WHO). Making Pregnancy Safer. 2015:1-6. 4. Direktorat Bina Kesehatan Ibu Ditjen Bina Gizi dan Kesehatan Ibu dan Anak Kementrian Kesehatan RI. Upaya Percepatan Penurunan Angka Kematian Ibu. 2013:1-4. 5. Anggorowati D, Hadisaputra H. Kejadian Preeklampsia / Eklampsia di RSDK tahun 1997-1999. In: Kumpulan Makalah / Kuliah Utama. Denpasar Bali: KOGI X POGI Cabang Semarang; 2000. 6. Sibai B, Dekker G, Kupferminc M. Pre-eclampsia. Lancet. 2005;365(9461):785-799. 7. Dina S. Luaran Ibu dan Bayi Pada Penderita Preeklampsia Berat dan Eklampsia Dengan atau Tanpa Sindroma Hellp. 2008:10-40. 8. Padden MO. HELLP syndrome: recognition and perinatal management. Am Fam Physician. 1999;60(3):829-836, 839. 9. Raras AA. Pengaruh Preeklampsia Berat pada Kehamilan Terhadap Keluaran Maternal dan Perinatal di Rs Dr Kariadi Tahun 2010. 2011. 10. Prawirohardjo S, Wiknjosastro H. Ilmu Kebidanan. Jakarta: PT Bina Pustaka Sarwono Prawirohardjo; 2014. 11. Wibowo N, Irwinda R, Frisdiantiny E. Pedoman Nasional Pelayanan Kedokteran Diagnosis Dan Tata Laksana Pre-Eklampsia. Kementrian Kesehatan Republik Indonesia; 2011. 12. Kementerian Kesehatan RI. Buku Saku Pelayanan Kesehatan Ibu Di Fasilitas Kesehatan Dasar Dan Rujukan Pedoman Bagi Tenaga Kesehatan. Jakarta: Kementrian Kesehatan Republik Indonesia; 2013.
Transcript of DAFTAR PUSTAKA -...

71
DAFTAR PUSTAKA
1. F. Cunningham, Kenneth Leveno, Steven Bloom, John Hauth, Dwight
Rouse CS. Williams Obstetrics: 23rd Edition McGraw-Hill’s
AccessMedicine. 23rd ed. McGraw Hill Professional; 2009.
2. WHO, UNICEF, UNFPA, World Bank Group the and United Nations
Populations Division. Trends in Maternal Mortality : 1990 to 2015.
Organization. 2015;32(5):1-55.
3. World Health Organization (WHO). Making Pregnancy Safer. 2015:1-6.
4. Direktorat Bina Kesehatan Ibu Ditjen Bina Gizi dan Kesehatan Ibu dan
Anak Kementrian Kesehatan RI. Upaya Percepatan Penurunan Angka
Kematian Ibu. 2013:1-4.
5. Anggorowati D, Hadisaputra H. Kejadian Preeklampsia / Eklampsia di
RSDK tahun 1997-1999. In: Kumpulan Makalah / Kuliah Utama. Denpasar
Bali: KOGI X POGI Cabang Semarang; 2000.
6. Sibai B, Dekker G, Kupferminc M. Pre-eclampsia. Lancet.
2005;365(9461):785-799.
7. Dina S. Luaran Ibu dan Bayi Pada Penderita Preeklampsia Berat dan
Eklampsia Dengan atau Tanpa Sindroma Hellp. 2008:10-40.
8. Padden MO. HELLP syndrome: recognition and perinatal management. Am
Fam Physician. 1999;60(3):829-836, 839.
9. Raras AA. Pengaruh Preeklampsia Berat pada Kehamilan Terhadap
Keluaran Maternal dan Perinatal di Rs Dr Kariadi Tahun 2010. 2011.
10. Prawirohardjo S, Wiknjosastro H. Ilmu Kebidanan. Jakarta: PT Bina
Pustaka Sarwono Prawirohardjo; 2014.
11. Wibowo N, Irwinda R, Frisdiantiny E. Pedoman Nasional Pelayanan
Kedokteran Diagnosis Dan Tata Laksana Pre-Eklampsia. Kementrian
Kesehatan Republik Indonesia; 2011.
12. Kementerian Kesehatan RI. Buku Saku Pelayanan Kesehatan Ibu Di
Fasilitas Kesehatan Dasar Dan Rujukan Pedoman Bagi Tenaga
Kesehatan. Jakarta: Kementrian Kesehatan Republik Indonesia; 2013.
72
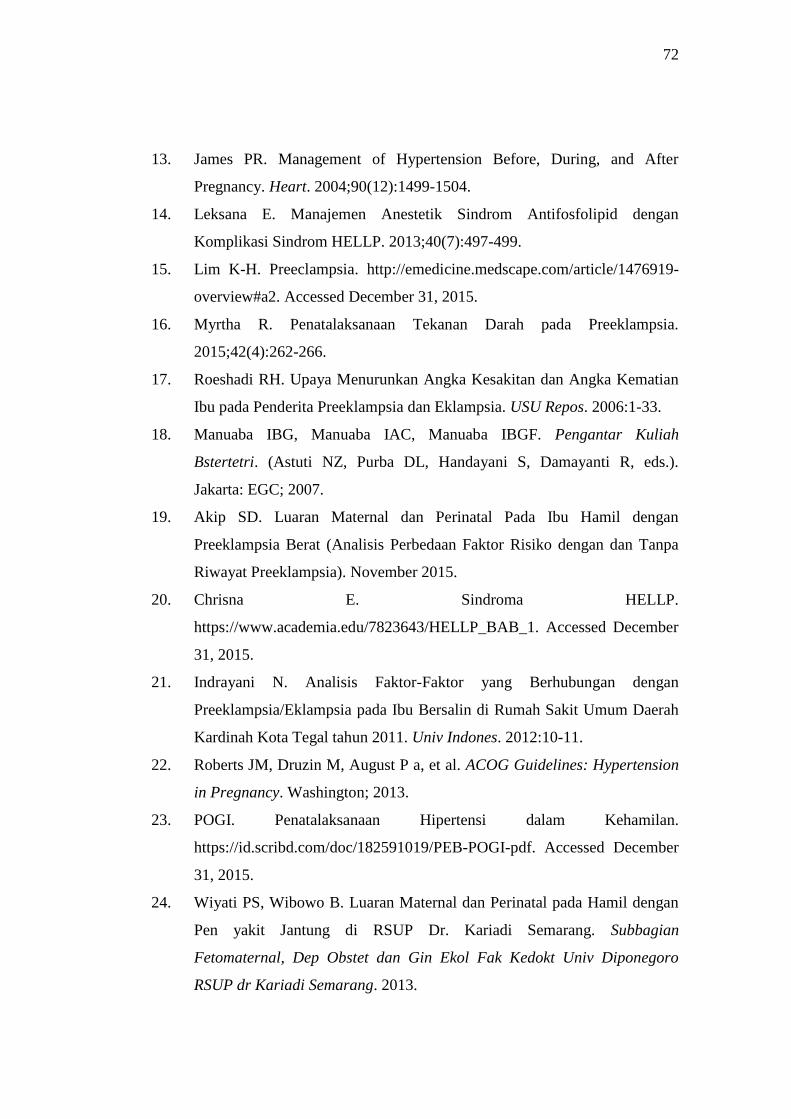
13. James PR. Management of Hypertension Before, During, and After
Pregnancy. Heart. 2004;90(12):1499-1504.
14. Leksana E. Manajemen Anestetik Sindrom Antifosfolipid dengan
Komplikasi Sindrom HELLP. 2013;40(7):497-499.
15. Lim K-H. Preeclampsia. http://emedicine.medscape.com/article/1476919-
overview#a2. Accessed December 31, 2015.
16. Myrtha R. Penatalaksanaan Tekanan Darah pada Preeklampsia.
2015;42(4):262-266.
17. Roeshadi RH. Upaya Menurunkan Angka Kesakitan dan Angka Kematian
Ibu pada Penderita Preeklampsia dan Eklampsia. USU Repos. 2006:1-33.
18. Manuaba IBG, Manuaba IAC, Manuaba IBGF. Pengantar Kuliah
Bstertetri. (Astuti NZ, Purba DL, Handayani S, Damayanti R, eds.).
Jakarta: EGC; 2007.
19. Akip SD. Luaran Maternal dan Perinatal Pada Ibu Hamil dengan
Preeklampsia Berat (Analisis Perbedaan Faktor Risiko dengan dan Tanpa
Riwayat Preeklampsia). November 2015.
20. Chrisna E. Sindroma HELLP.
https://www.academia.edu/7823643/HELLP_BAB_1. Accessed December
31, 2015.
21. Indrayani N. Analisis Faktor-Faktor yang Berhubungan dengan
Preeklampsia/Eklampsia pada Ibu Bersalin di Rumah Sakit Umum Daerah
Kardinah Kota Tegal tahun 2011. Univ Indones. 2012:10-11.
22. Roberts JM, Druzin M, August P a, et al. ACOG Guidelines: Hypertension
in Pregnancy. Washington; 2013.
23. POGI. Penatalaksanaan Hipertensi dalam Kehamilan.
https://id.scribd.com/doc/182591019/PEB-POGI-pdf. Accessed December
31, 2015.
24. Wiyati PS, Wibowo B. Luaran Maternal dan Perinatal pada Hamil dengan
Pen yakit Jantung di RSUP Dr. Kariadi Semarang. Subbagian
Fetomaternal, Dep Obstet dan Gin Ekol Fak Kedokt Univ Diponegoro
RSUP dr Kariadi Semarang. 2013.
73
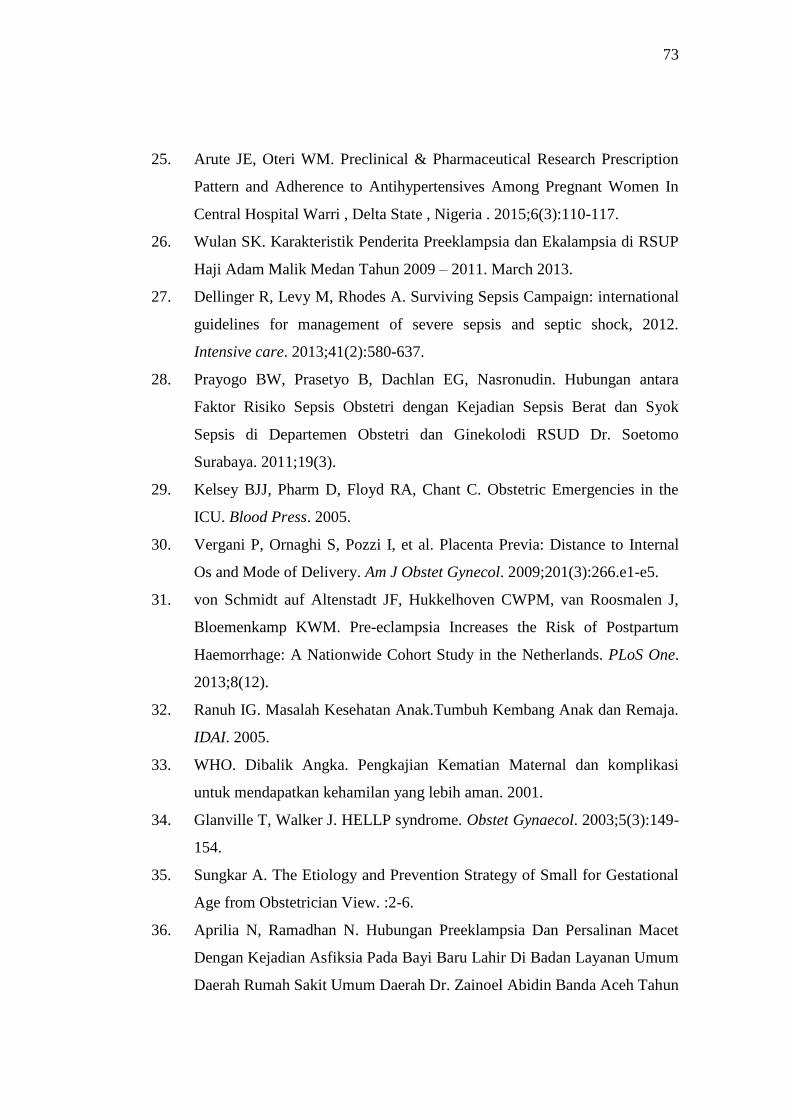
25. Arute JE, Oteri WM. Preclinical & Pharmaceutical Research Prescription
Pattern and Adherence to Antihypertensives Among Pregnant Women In
Central Hospital Warri , Delta State , Nigeria . 2015;6(3):110-117.
26. Wulan SK. Karakteristik Penderita Preeklampsia dan Ekalampsia di RSUP
Haji Adam Malik Medan Tahun 2009 – 2011. March 2013.
27. Dellinger R, Levy M, Rhodes A. Surviving Sepsis Campaign: international
guidelines for management of severe sepsis and septic shock, 2012.
Intensive care. 2013;41(2):580-637.
28. Prayogo BW, Prasetyo B, Dachlan EG, Nasronudin. Hubungan antara
Faktor Risiko Sepsis Obstetri dengan Kejadian Sepsis Berat dan Syok
Sepsis di Departemen Obstetri dan Ginekolodi RSUD Dr. Soetomo
Surabaya. 2011;19(3).
29. Kelsey BJJ, Pharm D, Floyd RA, Chant C. Obstetric Emergencies in the
ICU. Blood Press. 2005.
30. Vergani P, Ornaghi S, Pozzi I, et al. Placenta Previa: Distance to Internal
Os and Mode of Delivery. Am J Obstet Gynecol. 2009;201(3):266.e1-e5.
31. von Schmidt auf Altenstadt JF, Hukkelhoven CWPM, van Roosmalen J,
Bloemenkamp KWM. Pre-eclampsia Increases the Risk of Postpartum
Haemorrhage: A Nationwide Cohort Study in the Netherlands. PLoS One.
2013;8(12).
32. Ranuh IG. Masalah Kesehatan Anak.Tumbuh Kembang Anak dan Remaja.
IDAI. 2005.
33. WHO. Dibalik Angka. Pengkajian Kematian Maternal dan komplikasi
untuk mendapatkan kehamilan yang lebih aman. 2001.
34. Glanville T, Walker J. HELLP syndrome. Obstet Gynaecol. 2003;5(3):149-
154.
35. Sungkar A. The Etiology and Prevention Strategy of Small for Gestational
Age from Obstetrician View. :2-6.
36. Aprilia N, Ramadhan N. Hubungan Preeklampsia Dan Persalinan Macet
Dengan Kejadian Asfiksia Pada Bayi Baru Lahir Di Badan Layanan Umum
Daerah Rumah Sakit Umum Daerah Dr. Zainoel Abidin Banda Aceh Tahun
74
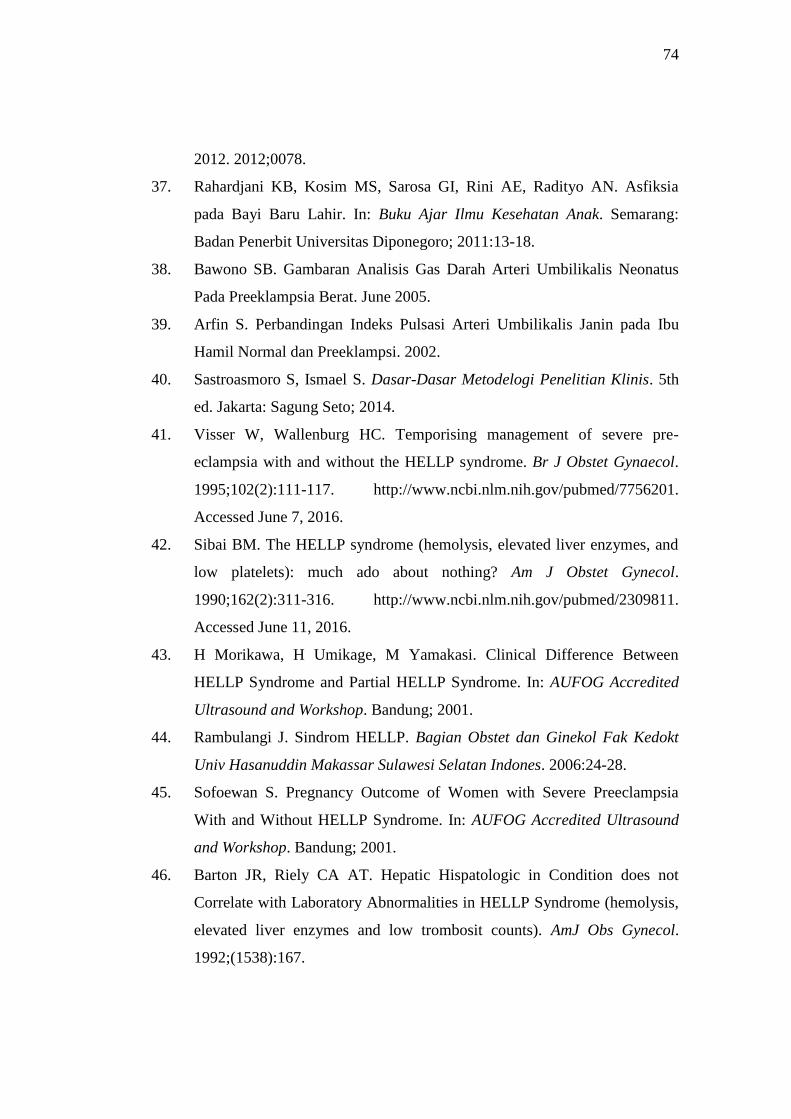
2012. 2012;0078.
37. Rahardjani KB, Kosim MS, Sarosa GI, Rini AE, Radityo AN. Asfiksia
pada Bayi Baru Lahir. In: Buku Ajar Ilmu Kesehatan Anak. Semarang:
Badan Penerbit Universitas Diponegoro; 2011:13-18.
38. Bawono SB. Gambaran Analisis Gas Darah Arteri Umbilikalis Neonatus
Pada Preeklampsia Berat. June 2005.
39. Arfin S. Perbandingan Indeks Pulsasi Arteri Umbilikalis Janin pada Ibu
Hamil Normal dan Preeklampsi. 2002.
40. Sastroasmoro S, Ismael S. Dasar-Dasar Metodelogi Penelitian Klinis. 5th
ed. Jakarta: Sagung Seto; 2014.
41. Visser W, Wallenburg HC. Temporising management of severe pre-
eclampsia with and without the HELLP syndrome. Br J Obstet Gynaecol.
1995;102(2):111-117. http://www.ncbi.nlm.nih.gov/pubmed/7756201.
Accessed June 7, 2016.
42. Sibai BM. The HELLP syndrome (hemolysis, elevated liver enzymes, and
low platelets): much ado about nothing? Am J Obstet Gynecol.
1990;162(2):311-316. http://www.ncbi.nlm.nih.gov/pubmed/2309811.
Accessed June 11, 2016.
43. H Morikawa, H Umikage, M Yamakasi. Clinical Difference Between
HELLP Syndrome and Partial HELLP Syndrome. In: AUFOG Accredited
Ultrasound and Workshop. Bandung; 2001.
44. Rambulangi J. Sindrom HELLP. Bagian Obstet dan Ginekol Fak Kedokt
Univ Hasanuddin Makassar Sulawesi Selatan Indones. 2006:24-28.
45. Sofoewan S. Pregnancy Outcome of Women with Severe Preeclampsia
With and Without HELLP Syndrome. In: AUFOG Accredited Ultrasound
and Workshop. Bandung; 2001.
46. Barton JR, Riely CA AT. Hepatic Hispatologic in Condition does not
Correlate with Laboratory Abnormalities in HELLP Syndrome (hemolysis,
elevated liver enzymes and low trombosit counts). AmJ Obs Gynecol.
1992;(1538):167.
75
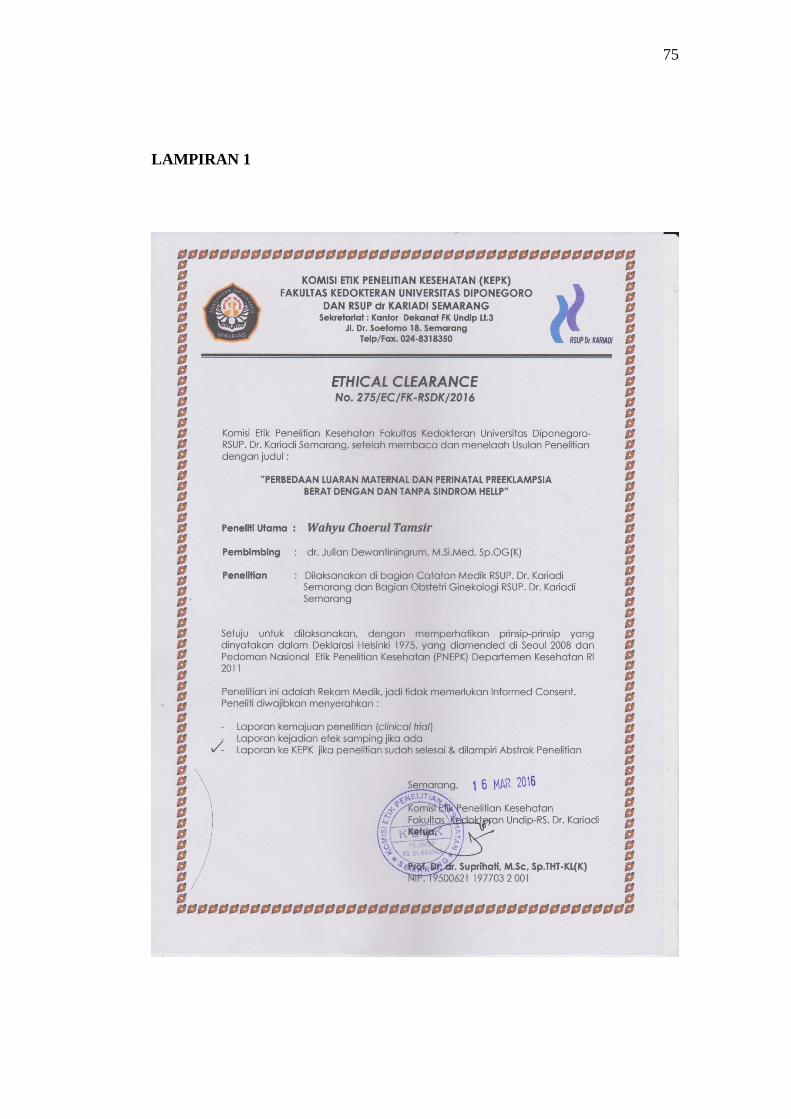
LAMPIRAN 1
76
LAMPIRAN 2

77
LAMPIRAN 3
Output SPSS
Frequency Table
Diagnosis
60 44.1 44.1 44.1
42 30.9 30.9 75.0
34 25.0 25.0 100.0
136 100.0 100.0
PEB
HELLP
Parsial
Total
Valid
Frequency Percent Valid Percent
Cumulat iv e
Percent
Mortalitas maternal
7 5.1 5.1 5.1
129 94.9 94.9 100.0
136 100.0 100.0
Ya
Tidak
Total
Valid
Frequency Percent Valid Percent
Cumulat iv e
Percent
DIC
1 .7 .7 .7
135 99.3 99.3 100.0
136 100.0 100.0
Ya
Tidak
Total
Valid
Frequency Percent Valid Percent
Cumulat iv e
Percent
Gagal ginjal akut
27 19.9 19.9 19.9
109 80.1 80.1 100.0
136 100.0 100.0
Ya
Tidak
Total
Valid
Frequency Percent Valid Percent
Cumulat iv e
Percent
Gangguan penglihatan
18 13.2 13.2 13.2
118 86.8 86.8 100.0
136 100.0 100.0
Ya
Tidak
Total
Valid
Frequency Percent Valid Percent
Cumulat iv e
Percent

78
Edema paru
24 17.6 17.6 17.6
112 82.4 82.4 100.0
136 100.0 100.0
Ya
Tidak
Total
Valid
Frequency Percent Valid Percent
Cumulat iv e
Percent
Eklampsia
23 16.9 16.9 16.9
113 83.1 83.1 100.0
136 100.0 100.0
Ya
Tidak
Total
Valid
Frequency Percent Valid Percent
Cumulat iv e
Percent
SIRS
6 4.4 4.4 4.4
130 95.6 95.6 100.0
136 100.0 100.0
Ya
Tidak
Total
Valid
Frequency Percent Valid Percent
Cumulat iv e
Percent
Perawatan ICU
46 33.8 33.8 33.8
90 66.2 66.2 100.0
136 100.0 100.0
Ya
Tidak
Total
Valid
Frequency Percent Valid Percent
Cumulat iv e
Percent
Sepsis
5 3.7 3.7 3.7
131 96.3 96.3 100.0
136 100.0 100.0
Ya
Tidak
Total
Valid
Frequency Percent Valid Percent
Cumulat iv e
Percent

79
Perdarahan post partum
5 3.7 3.7 3.7
131 96.3 96.3 100.0
136 100.0 100.0
Ya
Tidak
Total
Valid
Frequency Percent Valid Percent
Cumulat iv e
Percent
Mortalitas perinatal
15 11.0 11.0 11.0
121 89.0 89.0 100.0
136 100.0 100.0
Ya
Tidak
Total
Valid
Frequency Percent Valid Percent
Cumulat iv e
Percent
IUGR
87 64.0 64.0 64.0
49 36.0 36.0 100.0
136 100.0 100.0
Ya
Tidak
Total
Valid
Frequency Percent Valid Percent
Cumulat iv e
Percent
IUFD
16 11.8 11.8 11.8
120 88.2 88.2 100.0
136 100.0 100.0
Ya
Tidak
Total
Valid
Frequency Percent Valid Percent
Cumulat iv e
Percent
Asfiksia
44 32.4 32.4 32.4
92 67.6 67.6 100.0
136 100.0 100.0
Ya
Tidak
Total
Valid
Frequency Percent Valid Percent
Cumulat iv e
Percent

80
Gawat janin
20 14.7 14.7 14.7
116 85.3 85.3 100.0
136 100.0 100.0
Ya
Tidak
Total
Valid
Frequency Percent Valid Percent
Cumulat iv e
Percent
Kelahiran prematur
85 62.5 62.5 62.5
51 37.5 37.5 100.0
136 100.0 100.0
Ya
Tidak
Total
Valid
Frequency Percent Valid Percent
Cumulat iv e
Percent
Kelainan Doppler
34 25.0 25.0 25.0
102 75.0 75.0 100.0
136 100.0 100.0
Ya
Tidak
Total
Valid
Frequency Percent Valid Percent
Cumulat iv e
Percent

81
Crosstabs
Mortalitas maternal * Diagnosis
Crosstab
3 1 4
1.6 2.4 4.0
7.1% 1.7% 3.9%
39 59 98
40.4 57.6 98.0
92.9% 98.3% 96.1%
42 60 102
42.0 60.0 102.0
100.0% 100.0% 100.0%
Count
Expected Count
% within Diagnosis
Count
Expected Count
% within Diagnosis
Count
Expected Count
% within Diagnosis
Ya
Tidak
Mortalitas
maternal
Total
HELLP PEB
Diagnosis
Total
Chi-Square Tests
1.966b 1 .161
.782 1 .377
1.964 1 .161
.303 .188
1.947 1 .163
102
Pearson Chi-Square
Continuity Correctiona
Likelihood Ratio
Fisher's Exact Test
Linear-by-Linear
Association
N of Valid Cases
Value df
Asy mp. Sig.
(2-sided)
Exact Sig.
(2-sided)
Exact Sig.
(1-sided)
Computed only f or a 2x2 tablea.
2 cells (50.0%) hav e expected count less than 5. The minimum expected count is 1.
65.
b.
Risk Estimate
4.538 .455 45.224
1.885 1.018 3.489
.415 .075 2.284
102
Odds Rat io for Mortalitas
maternal (Ya / Tidak)
For cohort Diagnosis =
HELLP
For cohort Diagnosis =
PEB
N of Valid Cases
Value Lower Upper
95% Conf idence
Interv al

82
DIC * Diagnosis
Crosstab
42 60 102
42.0 60.0 102.0
100.0% 100.0% 100.0%
42 60 102
42.0 60.0 102.0
100.0% 100.0% 100.0%
Count
Expected Count
% within Diagnosis
Count
Expected Count
% within Diagnosis
TidakDIC
Total
HELLP PEB
Diagnosis
Total
Chi-Square Tests
.a
102
Pearson Chi-Square
N of Valid Cases
Value
No statistics are computed because DIC is a constant.a.
Risk Estimate
.aOdds Ratio for
DIC (Tidak / .)
Value
No statistics are computed because DIC is a constant.a.

83
Gagal ginjal akut * Diagnosis
Crosstab
9 9 18
7.4 10.6 18.0
21.4% 15.0% 17.6%
33 51 84
34.6 49.4 84.0
78.6% 85.0% 82.4%
42 60 102
42.0 60.0 102.0
100.0% 100.0% 100.0%
Count
Expected Count
% within Diagnosis
Count
Expected Count
% within Diagnosis
Count
Expected Count
% within Diagnosis
Ya
Tidak
Gagal ginjal
akut
Total
HELLP PEB
Diagnosis
Total
Chi-Square Tests
.703b 1 .402
.330 1 .566
.694 1 .405
.438 .281
.696 1 .404
102
Pearson Chi-Square
Continuity Correctiona
Likelihood Ratio
Fisher's Exact Test
Linear-by-Linear
Association
N of Valid Cases
Value df
Asy mp. Sig.
(2-sided)
Exact Sig.
(2-sided)
Exact Sig.
(1-sided)
Computed only f or a 2x2 tablea.
0 cells (.0%) hav e expected count less than 5. The minimum expected count is 7.
41.
b.
Risk Estimate
1.545 .556 4.296
1.273 .747 2.169
.824 .503 1.348
102
Odds Rat io for Gagal
ginjal akut (Ya / Tidak)
For cohort Diagnosis
= HELLP
For cohort Diagnosis
= PEB
N of Valid Cases
Value Lower Upper
95% Conf idence
Interv al

84
Gangguan penglihatan * Diagnosis
Crosstab
5 5 10
4.1 5.9 10.0
11.9% 8.3% 9.8%
37 55 92
37.9 54.1 92.0
88.1% 91.7% 90.2%
42 60 102
42.0 60.0 102.0
100.0% 100.0% 100.0%
Count
Expected Count
% within Diagnosis
Count
Expected Count
% within Diagnosis
Count
Expected Count
% within Diagnosis
Ya
Tidak
Gangguan penglihatan
Total
HELLP PEB
Diagnosis
Total
Chi-Square Tests
.356b 1 .551
.067 1 .796
.351 1 .553
.737 .393
.353 1 .552
102
Pearson Chi-Square
Continuity Correctiona
Likelihood Ratio
Fisher's Exact Test
Linear-by-Linear
Association
N of Valid Cases
Value df
Asy mp. Sig.
(2-sided)
Exact Sig.
(2-sided)
Exact Sig.
(1-sided)
Computed only f or a 2x2 tablea.
1 cells (25.0%) hav e expected count less than 5. The minimum expected count is 4.
12.
b.
Risk Estimate
1.486 .402 5.497
1.243 .637 2.425
.836 .440 1.589
102
Odds Rat io for Gangguan
penglihatan (Ya / Tidak)
For cohort Diagnosis =
HELLP
For cohort Diagnosis =
PEB
N of Valid Cases
Value Lower Upper
95% Conf idence
Interv al
85
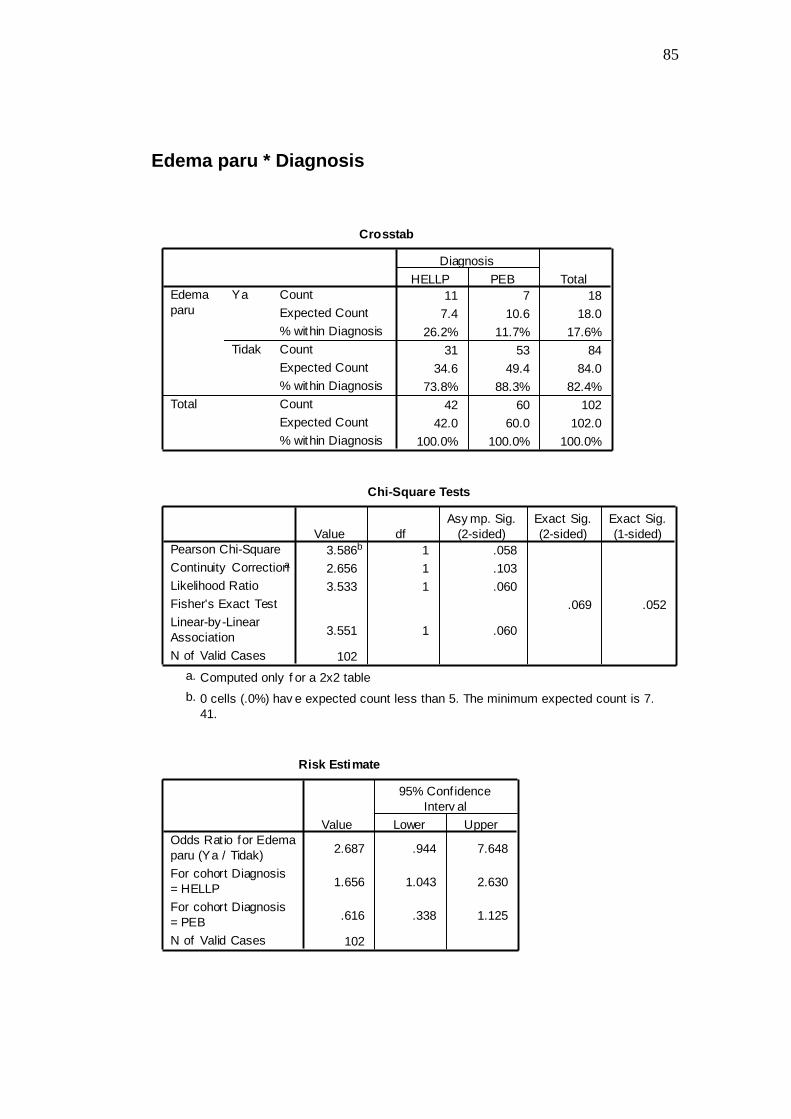
Edema paru * Diagnosis
Crosstab
11 7 18
7.4 10.6 18.0
26.2% 11.7% 17.6%
31 53 84
34.6 49.4 84.0
73.8% 88.3% 82.4%
42 60 102
42.0 60.0 102.0
100.0% 100.0% 100.0%
Count
Expected Count
% within Diagnosis
Count
Expected Count
% within Diagnosis
Count
Expected Count
% within Diagnosis
Ya
Tidak
Edema
paru
Total
HELLP PEB
Diagnosis
Total
Chi-Square Tests
3.586b 1 .058
2.656 1 .103
3.533 1 .060
.069 .052
3.551 1 .060
102
Pearson Chi-Square
Continuity Correctiona
Likelihood Ratio
Fisher's Exact Test
Linear-by-Linear
Association
N of Valid Cases
Value df
Asy mp. Sig.
(2-sided)
Exact Sig.
(2-sided)
Exact Sig.
(1-sided)
Computed only f or a 2x2 tablea.
0 cells (.0%) hav e expected count less than 5. The minimum expected count is 7.
41.
b.
Risk Estimate
2.687 .944 7.648
1.656 1.043 2.630
.616 .338 1.125
102
Odds Rat io for Edema
paru (Ya / Tidak)
For cohort Diagnosis
= HELLP
For cohort Diagnosis
= PEB
N of Valid Cases
Value Lower Upper
95% Conf idence
Interv al

86
Eklampsia * Diagnosis
Crosstab
10 5 15
6.2 8.8 15.0
23.8% 8.3% 14.7%
32 55 87
35.8 51.2 87.0
76.2% 91.7% 85.3%
42 60 102
42.0 60.0 102.0
100.0% 100.0% 100.0%
Count
Expected Count
% within Diagnosis
Count
Expected Count
% within Diagnosis
Count
Expected Count
% within Diagnosis
Ya
Tidak
Eklampsia
Total
HELLP PEB
Diagnosis
Total
Chi-Square Tests
4.718b 1 .030
3.564 1 .059
4.659 1 .031
.045 .030
4.671 1 .031
102
Pearson Chi-Square
Continuity Correctiona
Likelihood Ratio
Fisher's Exact Test
Linear-by-Linear
Association
N of Valid Cases
Value df
Asy mp. Sig.
(2-sided)
Exact Sig.
(2-sided)
Exact Sig.
(1-sided)
Computed only f or a 2x2 tablea.
0 cells (.0%) hav e expected count less than 5. The minimum expected count is 6.
18.
b.
Risk Estimate
3.438 1.079 10.950
1.813 1.154 2.847
.527 .253 1.098
102
Odds Rat io f or
Eklampsia (Ya / Tidak)
For cohort Diagnosis =
HELLP
For cohort Diagnosis =
PEB
N of Valid Cases
Value Lower Upper
95% Conf idence
Interv al
87
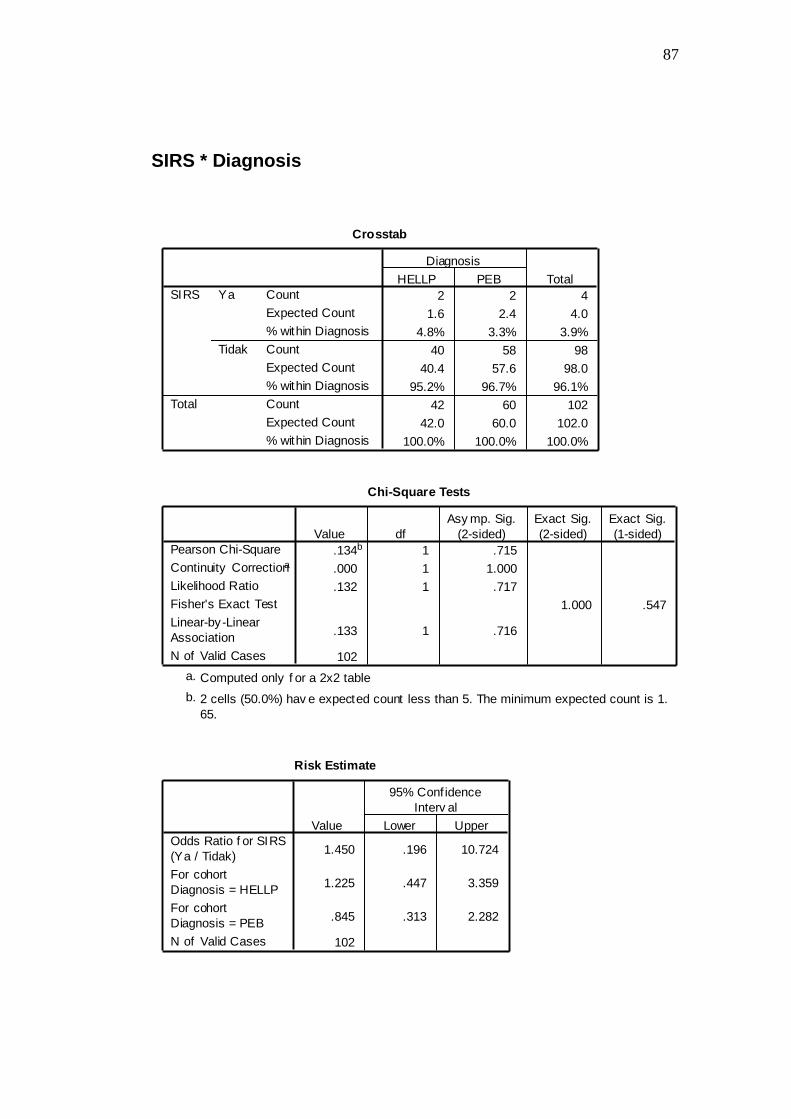
SIRS * Diagnosis
Crosstab
2 2 4
1.6 2.4 4.0
4.8% 3.3% 3.9%
40 58 98
40.4 57.6 98.0
95.2% 96.7% 96.1%
42 60 102
42.0 60.0 102.0
100.0% 100.0% 100.0%
Count
Expected Count
% within Diagnosis
Count
Expected Count
% within Diagnosis
Count
Expected Count
% within Diagnosis
Ya
Tidak
SIRS
Total
HELLP PEB
Diagnosis
Total
Chi-Square Tests
.134b 1 .715
.000 1 1.000
.132 1 .717
1.000 .547
.133 1 .716
102
Pearson Chi-Square
Continuity Correctiona
Likelihood Ratio
Fisher's Exact Test
Linear-by-Linear
Association
N of Valid Cases
Value df
Asy mp. Sig.
(2-sided)
Exact Sig.
(2-sided)
Exact Sig.
(1-sided)
Computed only f or a 2x2 tablea.
2 cells (50.0%) hav e expected count less than 5. The minimum expected count is 1.
65.
b.
Risk Estimate
1.450 .196 10.724
1.225 .447 3.359
.845 .313 2.282
102
Odds Ratio f or SIRS
(Ya / Tidak)
For cohort
Diagnosis = HELLP
For cohort
Diagnosis = PEB
N of Valid Cases
Value Lower Upper
95% Conf idence
Interv al

88
Perawatan ICU * Diagnosis
Crosstab
22 5 27
11.1 15.9 27.0
52.4% 8.3% 26.5%
20 55 75
30.9 44.1 75.0
47.6% 91.7% 73.5%
42 60 102
42.0 60.0 102.0
100.0% 100.0% 100.0%
Count
Expected Count
% within Diagnosis
Count
Expected Count
% within Diagnosis
Count
Expected Count
% within Diagnosis
Ya
Tidak
Perawatan
ICU
Total
HELLP PEB
Diagnosis
Total
Chi-Square Tests
24.628b 1 .000
22.416 1 .000
25.347 1 .000
.000 .000
24.386 1 .000
102
Pearson Chi-Square
Continuity Correctiona
Likelihood Ratio
Fisher's Exact Test
Linear-by-Linear
Association
N of Valid Cases
Value df
Asy mp. Sig.
(2-sided)
Exact Sig.
(2-sided)
Exact Sig.
(1-sided)
Computed only f or a 2x2 tablea.
0 cells (.0%) hav e expected count less than 5. The minimum expected count is 11.
12.
b.
Risk Estimate
12.100 4.037 36.265
3.056 2.015 4.633
.253 .113 .564
102
Odds Rat io for Perawatan
ICU (Ya / Tidak)
For cohort Diagnosis =
HELLP
For cohort Diagnosis =
PEB
N of Valid Cases
Value Lower Upper
95% Conf idence
Interv al

89
Sepsis * Diagnosis
Crosstab
1 2 3
1.2 1.8 3.0
2.4% 3.3% 2.9%
41 58 99
40.8 58.2 99.0
97.6% 96.7% 97.1%
42 60 102
42.0 60.0 102.0
100.0% 100.0% 100.0%
Count
Expected Count
% within Diagnosis
Count
Expected Count
% within Diagnosis
Count
Expected Count
% within Diagnosis
Ya
Tidak
Sepsis
Total
HELLP PEB
Diagnosis
Total
Chi-Square Tests
.078b 1 .779
.000 1 1.000
.080 1 .777
1.000 .632
.078 1 .780
102
Pearson Chi-Square
Continuity Correctiona
Likelihood Ratio
Fisher's Exact Test
Linear-by-Linear
Association
N of Valid Cases
Value df
Asy mp. Sig.
(2-sided)
Exact Sig.
(2-sided)
Exact Sig.
(1-sided)
Computed only f or a 2x2 tablea.
2 cells (50.0%) hav e expected count less than 5. The minimum expected count is 1.
24.
b.
Risk Estimate
.707 .062 8.063
.805 .160 4.056
1.138 .503 2.576
102
Odds Ratio f or
Sepsis (Ya / Tidak)
For cohort
Diagnosis = HELLP
For cohort
Diagnosis = PEB
N of Valid Cases
Value Lower Upper
95% Conf idence
Interv al

90
Perdarahan post partum * Diagnosis
Crosstab
2 1 3
1.2 1.8 3.0
4.8% 1.7% 2.9%
40 59 99
40.8 58.2 99.0
95.2% 98.3% 97.1%
42 60 102
42.0 60.0 102.0
100.0% 100.0% 100.0%
Count
Expected Count
% within Diagnosis
Count
Expected Count
% within Diagnosis
Count
Expected Count
% within Diagnosis
Ya
Tidak
Perdarahan
post partum
Total
HELLP PEB
Diagnosis
Total
Chi-Square Tests
.829b 1 .363
.099 1 .753
.816 1 .366
.567 .368
.821 1 .365
102
Pearson Chi-Square
Continuity Correctiona
Likelihood Ratio
Fisher's Exact Test
Linear-by-Linear
Association
N of Valid Cases
Value df
Asy mp. Sig.
(2-sided)
Exact Sig.
(2-sided)
Exact Sig.
(1-sided)
Computed only f or a 2x2 tablea.
2 cells (50.0%) hav e expected count less than 5. The minimum expected count is 1.
24.
b.
Risk Estimate
2.950 .259 33.636
1.650 .716 3.804
.559 .112 2.794
102
Odds Ratio f or
Perdarahan post
partum (Ya / Tidak)
For cohort
Diagnosis = HELLP
For cohort
Diagnosis = PEB
N of Valid Cases
Value Lower Upper
95% Conf idence
Interv al

91
Mortalitas perinatal * Diagnosis
Crosstab
9 1 10
4.1 5.9 10.0
21.4% 1.7% 9.8%
33 59 92
37.9 54.1 92.0
78.6% 98.3% 90.2%
42 60 102
42.0 60.0 102.0
100.0% 100.0% 100.0%
Count
Expected Count
% within Diagnosis
Count
Expected Count
% within Diagnosis
Count
Expected Count
% within Diagnosis
Ya
Tidak
Mortalitas
perinatal
Total
HELLP PEB
Diagnosis
Total
Chi-Square Tests
10.911b 1 .001
8.791 1 .003
11.617 1 .001
.001 .001
10.804 1 .001
102
Pearson Chi-Square
Continuity Correctiona
Likelihood Ratio
Fisher's Exact Test
Linear-by-Linear
Association
N of Valid Cases
Value df
Asy mp. Sig.
(2-sided)
Exact Sig.
(2-sided)
Exact Sig.
(1-sided)
Computed only f or a 2x2 tablea.
1 cells (25.0%) hav e expected count less than 5. The minimum expected count is 4.
12.
b.
Risk Estimate
16.091 1.952 132.650
2.509 1.781 3.534
.156 .024 1.007
102
Odds Rat io for Mortalitas
perinatal (Ya / Tidak)
For cohort Diagnosis =
HELLP
For cohort Diagnosis =
PEB
N of Valid Cases
Value Lower Upper
95% Conf idence
Interv al

92
IUGR * Diagnosis
Crosstab
38 23 61
25.1 35.9 61.0
90.5% 38.3% 59.8%
4 37 41
16.9 24.1 41.0
9.5% 61.7% 40.2%
42 60 102
42.0 60.0 102.0
100.0% 100.0% 100.0%
Count
Expected Count
% within Diagnosis
Count
Expected Count
% within Diagnosis
Count
Expected Count
% within Diagnosis
Ya
Tidak
IUGR
Total
HELLP PEB
Diagnosis
Total
Chi-Square Tests
27.943b 1 .000
25.816 1 .000
31.157 1 .000
.000 .000
27.669 1 .000
102
Pearson Chi-Square
Continuity Correctiona
Likelihood Ratio
Fisher's Exact Test
Linear-by-Linear
Association
N of Valid Cases
Value df
Asy mp. Sig.
(2-sided)
Exact Sig.
(2-sided)
Exact Sig.
(1-sided)
Computed only f or a 2x2 tablea.
0 cells (.0%) hav e expected count less than 5. The minimum expected count is 16.
88.
b.
Risk Estimate
15.283 4.819 48.471
6.385 2.466 16.530
.418 .298 .586
102
Odds Ratio f or IUGR
(Ya / Tidak)
For cohort
Diagnosis = HELLP
For cohort
Diagnosis = PEB
N of Valid Cases
Value Lower Upper
95% Conf idence
Interv al

93
IUFD * Diagnosis
Crosstab
8 1 9
3.7 5.3 9.0
19.0% 1.7% 8.8%
34 59 93
38.3 54.7 93.0
81.0% 98.3% 91.2%
42 60 102
42.0 60.0 102.0
100.0% 100.0% 100.0%
Count
Expected Count
% within Diagnosis
Count
Expected Count
% within Diagnosis
Count
Expected Count
% within Diagnosis
Ya
Tidak
IUFD
Total
HELLP PEB
Diagnosis
Total
Chi-Square Tests
9.277b 1 .002
7.243 1 .007
9.808 1 .002
.003 .003
9.186 1 .002
102
Pearson Chi-Square
Continuity Correctiona
Likelihood Ratio
Fisher's Exact Test
Linear-by-Linear
Association
N of Valid Cases
Value df
Asy mp. Sig.
(2-sided)
Exact Sig.
(2-sided)
Exact Sig.
(1-sided)
Computed only f or a 2x2 tablea.
1 cells (25.0%) hav e expected count less than 5. The minimum expected count is 3.
71.
b.
Risk Estimate
13.882 1.664 115.801
2.431 1.707 3.463
.175 .027 1.119
102
Odds Ratio f or IUFD
(Ya / Tidak)
For cohort
Diagnosis = HELLP
For cohort
Diagnosis = PEB
N of Valid Cases
Value Lower Upper
95% Conf idence
Interv al

94
Asfiksia * Diagnosis
Crosstab
18 8 26
10.7 15.3 26.0
42.9% 13.3% 25.5%
24 52 76
31.3 44.7 76.0
57.1% 86.7% 74.5%
42 60 102
42.0 60.0 102.0
100.0% 100.0% 100.0%
Count
Expected Count
% within Diagnosis
Count
Expected Count
% within Diagnosis
Count
Expected Count
% within Diagnosis
Ya
Tidak
Asf iksia
Total
HELLP PEB
Diagnosis
Total
Chi-Square Tests
11.339b 1 .001
9.837 1 .002
11.317 1 .001
.001 .001
11.227 1 .001
102
Pearson Chi-Square
Continuity Correctiona
Likelihood Ratio
Fisher's Exact Test
Linear-by-Linear
Association
N of Valid Cases
Value df
Asy mp. Sig.
(2-sided)
Exact Sig.
(2-sided)
Exact Sig.
(1-sided)
Computed only f or a 2x2 tablea.
0 cells (.0%) hav e expected count less than 5. The minimum expected count is 10.
71.
b.
Risk Estimate
4.875 1.861 12.771
2.192 1.443 3.332
.450 .248 .817
102
Odds Ratio f or
Asf iksia (Ya / Tidak)
For cohort
Diagnosis = HELLP
For cohort
Diagnosis = PEB
N of Valid Cases
Value Lower Upper
95% Conf idence
Interv al
95
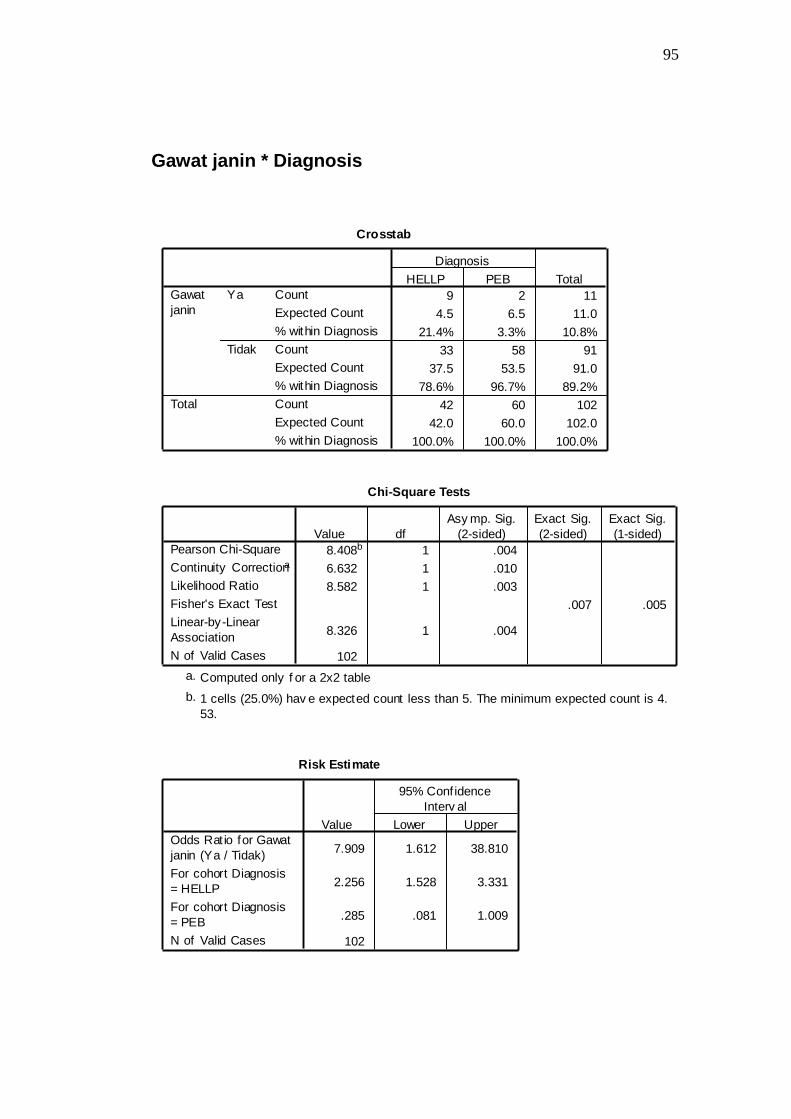
Gawat janin * Diagnosis
Crosstab
9 2 11
4.5 6.5 11.0
21.4% 3.3% 10.8%
33 58 91
37.5 53.5 91.0
78.6% 96.7% 89.2%
42 60 102
42.0 60.0 102.0
100.0% 100.0% 100.0%
Count
Expected Count
% within Diagnosis
Count
Expected Count
% within Diagnosis
Count
Expected Count
% within Diagnosis
Ya
Tidak
Gawat
janin
Total
HELLP PEB
Diagnosis
Total
Chi-Square Tests
8.408b 1 .004
6.632 1 .010
8.582 1 .003
.007 .005
8.326 1 .004
102
Pearson Chi-Square
Continuity Correctiona
Likelihood Ratio
Fisher's Exact Test
Linear-by-Linear
Association
N of Valid Cases
Value df
Asy mp. Sig.
(2-sided)
Exact Sig.
(2-sided)
Exact Sig.
(1-sided)
Computed only f or a 2x2 tablea.
1 cells (25.0%) hav e expected count less than 5. The minimum expected count is 4.
53.
b.
Risk Estimate
7.909 1.612 38.810
2.256 1.528 3.331
.285 .081 1.009
102
Odds Rat io for Gawat
janin (Ya / Tidak)
For cohort Diagnosis
= HELLP
For cohort Diagnosis
= PEB
N of Valid Cases
Value Lower Upper
95% Conf idence
Interv al

96
Kelahiran prematur * Diagnosis
Crosstab
35 24 59
24.3 34.7 59.0
83.3% 40.0% 57.8%
7 36 43
17.7 25.3 43.0
16.7% 60.0% 42.2%
42 60 102
42.0 60.0 102.0
100.0% 100.0% 100.0%
Count
Expected Count
% within Diagnosis
Count
Expected Count
% within Diagnosis
Count
Expected Count
% within Diagnosis
Ya
Tidak
Kelahiran
prematur
Total
HELLP PEB
Diagnosis
Total
Chi-Square Tests
19.025b 1 .000
17.289 1 .000
20.273 1 .000
.000 .000
18.838 1 .000
102
Pearson Chi-Square
Continuity Correctiona
Likelihood Ratio
Fisher's Exact Test
Linear-by-Linear
Association
N of Valid Cases
Value df
Asy mp. Sig.
(2-sided)
Exact Sig.
(2-sided)
Exact Sig.
(1-sided)
Computed only f or a 2x2 tablea.
0 cells (.0%) hav e expected count less than 5. The minimum expected count is 17.
71.
b.
Risk Estimate
7.500 2.866 19.626
3.644 1.792 7.412
.486 .348 .679
102
Odds Rat io for Kelahiran
prematur (Ya / Tidak)
For cohort Diagnosis =
HELLP
For cohort Diagnosis =
PEB
N of Valid Cases
Value Lower Upper
95% Conf idence
Interv al

97
Kelainan Doppler * Diagnosis
Crosstab
17 6 23
9.5 13.5 23.0
40.5% 10.0% 22.5%
25 54 79
32.5 46.5 79.0
59.5% 90.0% 77.5%
42 60 102
42.0 60.0 102.0
100.0% 100.0% 100.0%
Count
Expected Count
% within Diagnosis
Count
Expected Count
% within Diagnosis
Count
Expected Count
% within Diagnosis
Ya
Tidak
Kelainan
Doppler
Total
HELLP PEB
Diagnosis
Total
Chi-Square Tests
13.139b 1 .000
11.452 1 .001
13.188 1 .000
.001 .000
13.010 1 .000
102
Pearson Chi-Square
Continuity Correctiona
Likelihood Ratio
Fisher's Exact Test
Linear-by-Linear
Association
N of Valid Cases
Value df
Asy mp. Sig.
(2-sided)
Exact Sig.
(2-sided)
Exact Sig.
(1-sided)
Computed only f or a 2x2 tablea.
0 cells (.0%) hav e expected count less than 5. The minimum expected count is 9.
47.
b.
Risk Estimate
6.120 2.153 17.393
2.336 1.558 3.502
.382 .189 .772
102
Odds Rat io f or Kelainan
Doppler (Ya / Tidak)
For cohort Diagnosis =
HELLP
For cohort Diagnosis =
PEB
N of Valid Cases
Value Lower Upper
95% Conf idence
Interv al
98
Crosstabs
Mortalitas maternal * Diagnosis
Crosstab
3 1 4
1.4 2.6 4.0
8.8% 1.7% 4.3%
31 59 90
32.6 57.4 90.0
91.2% 98.3% 95.7%
34 60 94
34.0 60.0 94.0
100.0% 100.0% 100.0%
Count
Expected Count
% within Diagnosis
Count
Expected Count
% within Diagnosis
Count
Expected Count
% within Diagnosis
Ya
Tidak
Mortalitas
maternal
Total
Parsial PEB
Diagnosis
Total
Chi-Square Tests
2.728b 1 .099
1.254 1 .263
2.618 1 .106
.133 .133
2.699 1 .100
94
Pearson Chi-Square
Continuity Correctiona
Likelihood Ratio
Fisher's Exact Test
Linear-by-Linear
Association
N of Valid Cases
Value df
Asy mp. Sig.
(2-sided)
Exact Sig.
(2-sided)
Exact Sig.
(1-sided)
Computed only f or a 2x2 tablea.
2 cells (50.0%) hav e expected count less than 5. The minimum expected count is 1.
45.
b.
Risk Estimate
5.710 .570 57.209
2.177 1.156 4.103
.381 .069 2.096
94
Odds Rat io for Mortalitas
maternal (Ya / Tidak)
For cohort Diagnosis =
Parsial
For cohort Diagnosis =
PEB
N of Valid Cases
Value Lower Upper
95% Conf idence
Interv al

99
DIC * Diagnosis
Crosstab
1 0 1
.4 .6 1.0
2.9% .0% 1.1%
33 60 93
33.6 59.4 93.0
97.1% 100.0% 98.9%
34 60 94
34.0 60.0 94.0
100.0% 100.0% 100.0%
Count
Expected Count
% within Diagnosis
Count
Expected Count
% within Diagnosis
Count
Expected Count
% within Diagnosis
Ya
Tidak
DIC
Total
Parsial PEB
Diagnosis
Total
Chi-Square Tests
1.784b 1 .182
.084 1 .772
2.053 1 .152
.362 .362
1.765 1 .184
94
Pearson Chi-Square
Continuity Correctiona
Likelihood Ratio
Fisher's Exact Test
Linear-by-Linear
Association
N of Valid Cases
Value df
Asy mp. Sig.
(2-sided)
Exact Sig.
(2-sided)
Exact Sig.
(1-sided)
Computed only f or a 2x2 tablea.
2 cells (50.0%) hav e expected count less than 5. The minimum expected count is .
36.
b.
Risk Estimate
2.818 2.143 3.707
94
For cohort
Diagnosis = Parsial
N of Valid Cases
Value Lower Upper
95% Conf idence
Interv al

100
Gagal ginjal akut * Diagnosis
Crosstab
9 9 18
6.5 11.5 18.0
26.5% 15.0% 19.1%
25 51 76
27.5 48.5 76.0
73.5% 85.0% 80.9%
34 60 94
34.0 60.0 94.0
100.0% 100.0% 100.0%
Count
Expected Count
% within Diagnosis
Count
Expected Count
% within Diagnosis
Count
Expected Count
% within Diagnosis
Ya
Tidak
Gagal ginjal
akut
Total
Parsial PEB
Diagnosis
Total
Chi-Square Tests
1.844b 1 .174
1.178 1 .278
1.791 1 .181
.186 .139
1.825 1 .177
94
Pearson Chi-Square
Continuity Correctiona
Likelihood Ratio
Fisher's Exact Test
Linear-by-Linear
Association
N of Valid Cases
Value df
Asy mp. Sig.
(2-sided)
Exact Sig.
(2-sided)
Exact Sig.
(1-sided)
Computed only f or a 2x2 tablea.
0 cells (.0%) hav e expected count less than 5. The minimum expected count is 6.
51.
b.
Risk Estimate
2.040 .721 5.774
1.520 .866 2.668
.745 .457 1.214
94
Odds Rat io for Gagal
ginjal akut (Ya / Tidak)
For cohort Diagnosis
= Parsial
For cohort Diagnosis
= PEB
N of Valid Cases
Value Lower Upper
95% Conf idence
Interv al
101
Gangguan penglihatan * Diagnosis
Crosstab
8 5 13
4.7 8.3 13.0
23.5% 8.3% 13.8%
26 55 81
29.3 51.7 81.0
76.5% 91.7% 86.2%
34 60 94
34.0 60.0 94.0
100.0% 100.0% 100.0%
Count
Expected Count
% within Diagnosis
Count
Expected Count
% within Diagnosis
Count
Expected Count
% within Diagnosis
Ya
Tidak
Gangguan penglihatan
Total
Parsial PEB
Diagnosis
Total
Chi-Square Tests
4.205b 1 .040
3.027 1 .082
4.029 1 .045
.061 .043
4.161 1 .041
94
Pearson Chi-Square
Continuity Correctiona
Likelihood Ratio
Fisher's Exact Test
Linear-by-Linear
Association
N of Valid Cases
Value df
Asy mp. Sig.
(2-sided)
Exact Sig.
(2-sided)
Exact Sig.
(1-sided)
Computed only f or a 2x2 tablea.
1 cells (25.0%) hav e expected count less than 5. The minimum expected count is 4.
70.
b.
Risk Estimate
3.385 1.008 11.359
1.917 1.124 3.270
.566 .280 1.145
94
Odds Rat io for Gangguan
penglihatan (Ya / Tidak)
For cohort Diagnosis =
Parsial
For cohort Diagnosis =
PEB
N of Valid Cases
Value Lower Upper
95% Conf idence
Interv al

102
Edema paru * Diagnosis
Crosstab
6 7 13
4.7 8.3 13.0
17.6% 11.7% 13.8%
28 53 81
29.3 51.7 81.0
82.4% 88.3% 86.2%
34 60 94
34.0 60.0 94.0
100.0% 100.0% 100.0%
Count
Expected Count
% within Diagnosis
Count
Expected Count
% within Diagnosis
Count
Expected Count
% within Diagnosis
Ya
Tidak
Edema
paru
Total
Parsial PEB
Diagnosis
Total
Chi-Square Tests
.651b 1 .420
.246 1 .620
.634 1 .426
.536 .305
.644 1 .422
94
Pearson Chi-Square
Continuity Correctiona
Likelihood Ratio
Fisher's Exact Test
Linear-by-Linear
Association
N of Valid Cases
Value df
Asy mp. Sig.
(2-sided)
Exact Sig.
(2-sided)
Exact Sig.
(1-sided)
Computed only f or a 2x2 tablea.
1 cells (25.0%) hav e expected count less than 5. The minimum expected count is 4.
70.
b.
Risk Estimate
1.622 .497 5.294
1.335 .691 2.581
.823 .486 1.395
94
Odds Rat io for Edema
paru (Ya / Tidak)
For cohort Diagnosis
= Parsial
For cohort Diagnosis
= PEB
N of Valid Cases
Value Lower Upper
95% Conf idence
Interv al
103
Eklampsia * Diagnosis
Crosstab
8 5 13
4.7 8.3 13.0
23.5% 8.3% 13.8%
26 55 81
29.3 51.7 81.0
76.5% 91.7% 86.2%
34 60 94
34.0 60.0 94.0
100.0% 100.0% 100.0%
Count
Expected Count
% within Diagnosis
Count
Expected Count
% within Diagnosis
Count
Expected Count
% within Diagnosis
Ya
Tidak
Eklampsia
Total
Parsial PEB
Diagnosis
Total
Chi-Square Tests
4.205b 1 .040
3.027 1 .082
4.029 1 .045
.061 .043
4.161 1 .041
94
Pearson Chi-Square
Continuity Correctiona
Likelihood Ratio
Fisher's Exact Test
Linear-by-Linear
Association
N of Valid Cases
Value df
Asy mp. Sig.
(2-sided)
Exact Sig.
(2-sided)
Exact Sig.
(1-sided)
Computed only f or a 2x2 tablea.
1 cells (25.0%) hav e expected count less than 5. The minimum expected count is 4.
70.
b.
Risk Estimate
3.385 1.008 11.359
1.917 1.124 3.270
.566 .280 1.145
94
Odds Rat io f or
Eklampsia (Ya / Tidak)
For cohort Diagnosis =
Parsial
For cohort Diagnosis =
PEB
N of Valid Cases
Value Lower Upper
95% Conf idence
Interv al
104
SIRS * Diagnosis
Crosstab
2 2 4
1.4 2.6 4.0
5.9% 3.3% 4.3%
32 58 90
32.6 57.4 90.0
94.1% 96.7% 95.7%
34 60 94
34.0 60.0 94.0
100.0% 100.0% 100.0%
Count
Expected Count
% within Diagnosis
Count
Expected Count
% within Diagnosis
Count
Expected Count
% within Diagnosis
Ya
Tidak
SIRS
Total
Parsial PEB
Diagnosis
Total
Chi-Square Tests
.346b 1 .556
.003 1 .955
.333 1 .564
.618 .459
.342 1 .558
94
Pearson Chi-Square
Continuity Correctiona
Likelihood Ratio
Fisher's Exact Test
Linear-by-Linear
Association
N of Valid Cases
Value df
Asy mp. Sig.
(2-sided)
Exact Sig.
(2-sided)
Exact Sig.
(1-sided)
Computed only f or a 2x2 tablea.
2 cells (50.0%) hav e expected count less than 5. The minimum expected count is 1.
45.
b.
Risk Estimate
1.813 .244 13.486
1.406 .508 3.895
.776 .288 2.092
94
Odds Ratio f or SIRS
(Ya / Tidak)
For cohort
Diagnosis = Parsial
For cohort
Diagnosis = PEB
N of Valid Cases
Value Lower Upper
95% Conf idence
Interv al

105
Perawatan ICU * Diagnosis
Crosstab
19 5 24
8.7 15.3 24.0
55.9% 8.3% 25.5%
15 55 70
25.3 44.7 70.0
44.1% 91.7% 74.5%
34 60 94
34.0 60.0 94.0
100.0% 100.0% 100.0%
Count
Expected Count
% within Diagnosis
Count
Expected Count
% within Diagnosis
Count
Expected Count
% within Diagnosis
Ya
Tidak
Perawatan
ICU
Total
Parsial PEB
Diagnosis
Total
Chi-Square Tests
25.807b 1 .000
23.366 1 .000
25.721 1 .000
.000 .000
25.532 1 .000
94
Pearson Chi-Square
Continuity Correctiona
Likelihood Ratio
Fisher's Exact Test
Linear-by-Linear
Association
N of Valid Cases
Value df
Asy mp. Sig.
(2-sided)
Exact Sig.
(2-sided)
Exact Sig.
(1-sided)
Computed only f or a 2x2 tablea.
0 cells (.0%) hav e expected count less than 5. The minimum expected count is 8.
68.
b.
Risk Estimate
13.933 4.462 43.505
3.694 2.256 6.050
.265 .120 .584
94
Odds Rat io for Perawatan
ICU (Ya / Tidak)
For cohort Diagnosis =
Parsial
For cohort Diagnosis =
PEB
N of Valid Cases
Value Lower Upper
95% Conf idence
Interv al

106
Sepsis * Diagnosis
Crosstab
2 2 4
1.4 2.6 4.0
5.9% 3.3% 4.3%
32 58 90
32.6 57.4 90.0
94.1% 96.7% 95.7%
34 60 94
34.0 60.0 94.0
100.0% 100.0% 100.0%
Count
Expected Count
% within Diagnosis
Count
Expected Count
% within Diagnosis
Count
Expected Count
% within Diagnosis
Ya
Tidak
Sepsis
Total
Parsial PEB
Diagnosis
Total
Chi-Square Tests
.346b 1 .556
.003 1 .955
.333 1 .564
.618 .459
.342 1 .558
94
Pearson Chi-Square
Continuity Correctiona
Likelihood Ratio
Fisher's Exact Test
Linear-by-Linear
Association
N of Valid Cases
Value df
Asy mp. Sig.
(2-sided)
Exact Sig.
(2-sided)
Exact Sig.
(1-sided)
Computed only f or a 2x2 tablea.
2 cells (50.0%) hav e expected count less than 5. The minimum expected count is 1.
45.
b.
Risk Estimate
1.813 .244 13.486
1.406 .508 3.895
.776 .288 2.092
94
Odds Ratio f or
Sepsis (Ya / Tidak)
For cohort
Diagnosis = Parsial
For cohort
Diagnosis = PEB
N of Valid Cases
Value Lower Upper
95% Conf idence
Interv al
107
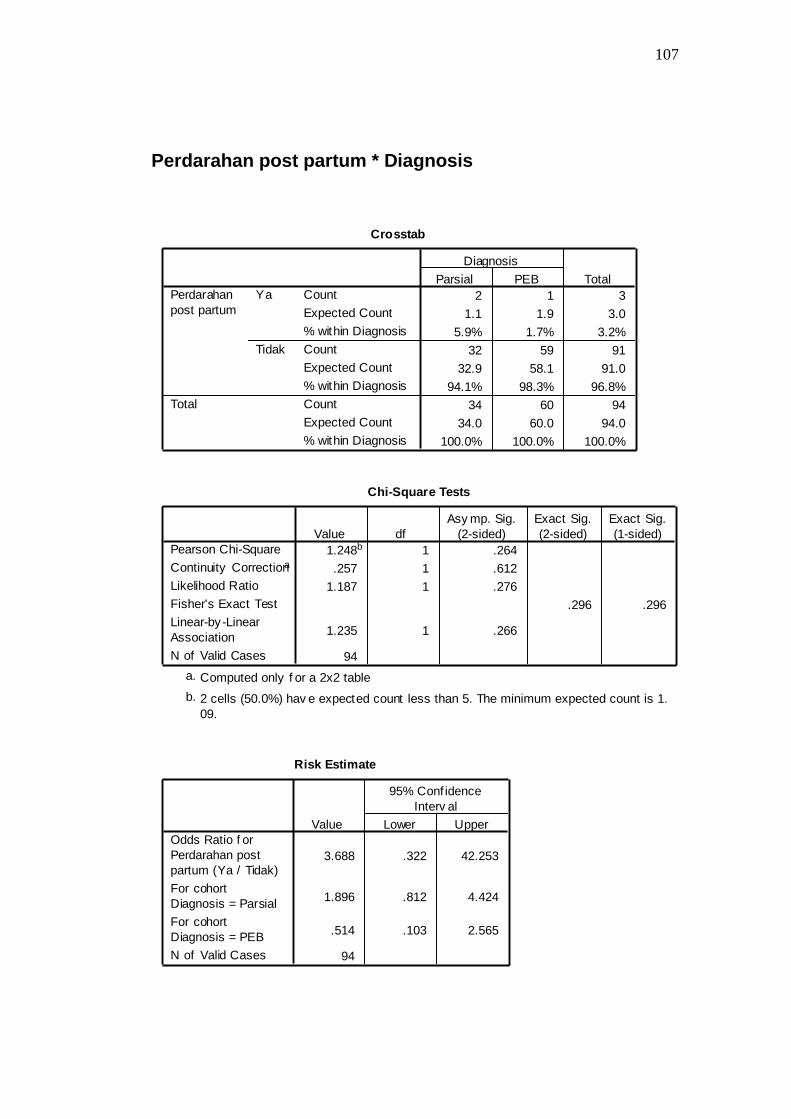
Perdarahan post partum * Diagnosis
Crosstab
2 1 3
1.1 1.9 3.0
5.9% 1.7% 3.2%
32 59 91
32.9 58.1 91.0
94.1% 98.3% 96.8%
34 60 94
34.0 60.0 94.0
100.0% 100.0% 100.0%
Count
Expected Count
% within Diagnosis
Count
Expected Count
% within Diagnosis
Count
Expected Count
% within Diagnosis
Ya
Tidak
Perdarahan
post partum
Total
Parsial PEB
Diagnosis
Total
Chi-Square Tests
1.248b 1 .264
.257 1 .612
1.187 1 .276
.296 .296
1.235 1 .266
94
Pearson Chi-Square
Continuity Correctiona
Likelihood Ratio
Fisher's Exact Test
Linear-by-Linear
Association
N of Valid Cases
Value df
Asy mp. Sig.
(2-sided)
Exact Sig.
(2-sided)
Exact Sig.
(1-sided)
Computed only f or a 2x2 tablea.
2 cells (50.0%) hav e expected count less than 5. The minimum expected count is 1.
09.
b.
Risk Estimate
3.688 .322 42.253
1.896 .812 4.424
.514 .103 2.565
94
Odds Ratio f or
Perdarahan post
partum (Ya / Tidak)
For cohort
Diagnosis = Parsial
For cohort
Diagnosis = PEB
N of Valid Cases
Value Lower Upper
95% Conf idence
Interv al
108
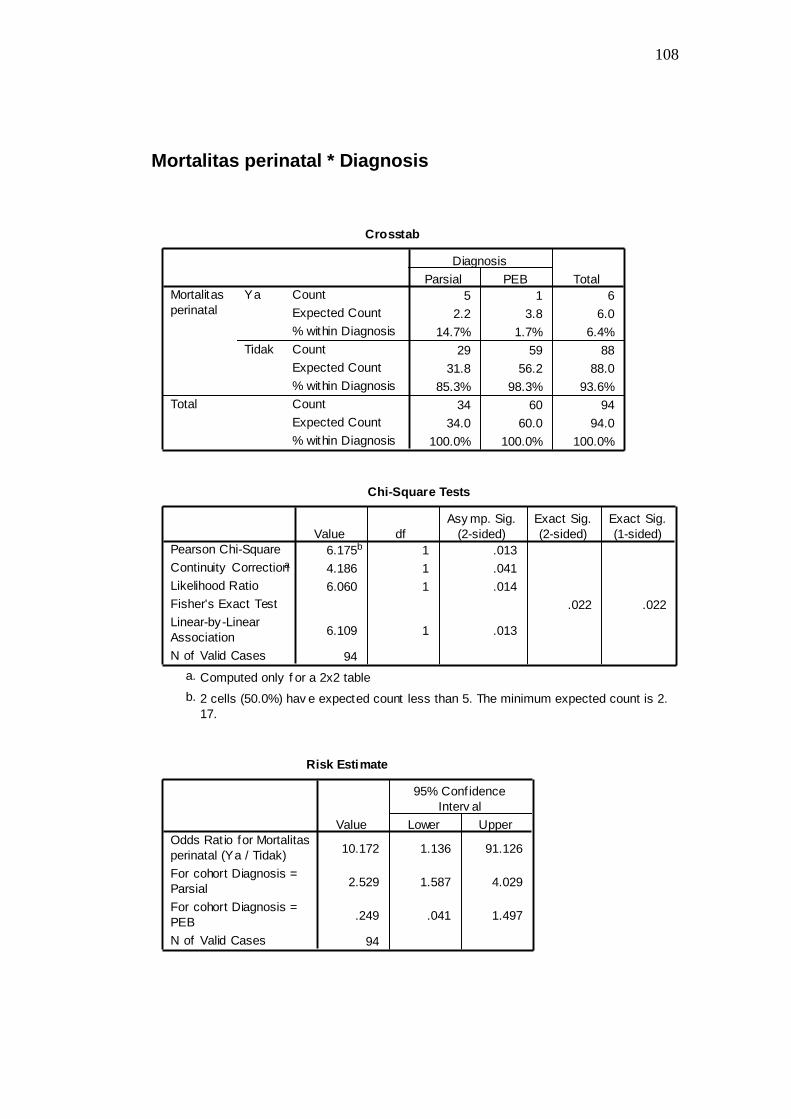
Mortalitas perinatal * Diagnosis
Crosstab
5 1 6
2.2 3.8 6.0
14.7% 1.7% 6.4%
29 59 88
31.8 56.2 88.0
85.3% 98.3% 93.6%
34 60 94
34.0 60.0 94.0
100.0% 100.0% 100.0%
Count
Expected Count
% within Diagnosis
Count
Expected Count
% within Diagnosis
Count
Expected Count
% within Diagnosis
Ya
Tidak
Mortalitas
perinatal
Total
Parsial PEB
Diagnosis
Total
Chi-Square Tests
6.175b 1 .013
4.186 1 .041
6.060 1 .014
.022 .022
6.109 1 .013
94
Pearson Chi-Square
Continuity Correctiona
Likelihood Ratio
Fisher's Exact Test
Linear-by-Linear
Association
N of Valid Cases
Value df
Asy mp. Sig.
(2-sided)
Exact Sig.
(2-sided)
Exact Sig.
(1-sided)
Computed only f or a 2x2 tablea.
2 cells (50.0%) hav e expected count less than 5. The minimum expected count is 2.
17.
b.
Risk Estimate
10.172 1.136 91.126
2.529 1.587 4.029
.249 .041 1.497
94
Odds Rat io for Mortalitas
perinatal (Ya / Tidak)
For cohort Diagnosis =
Parsial
For cohort Diagnosis =
PEB
N of Valid Cases
Value Lower Upper
95% Conf idence
Interv al
109
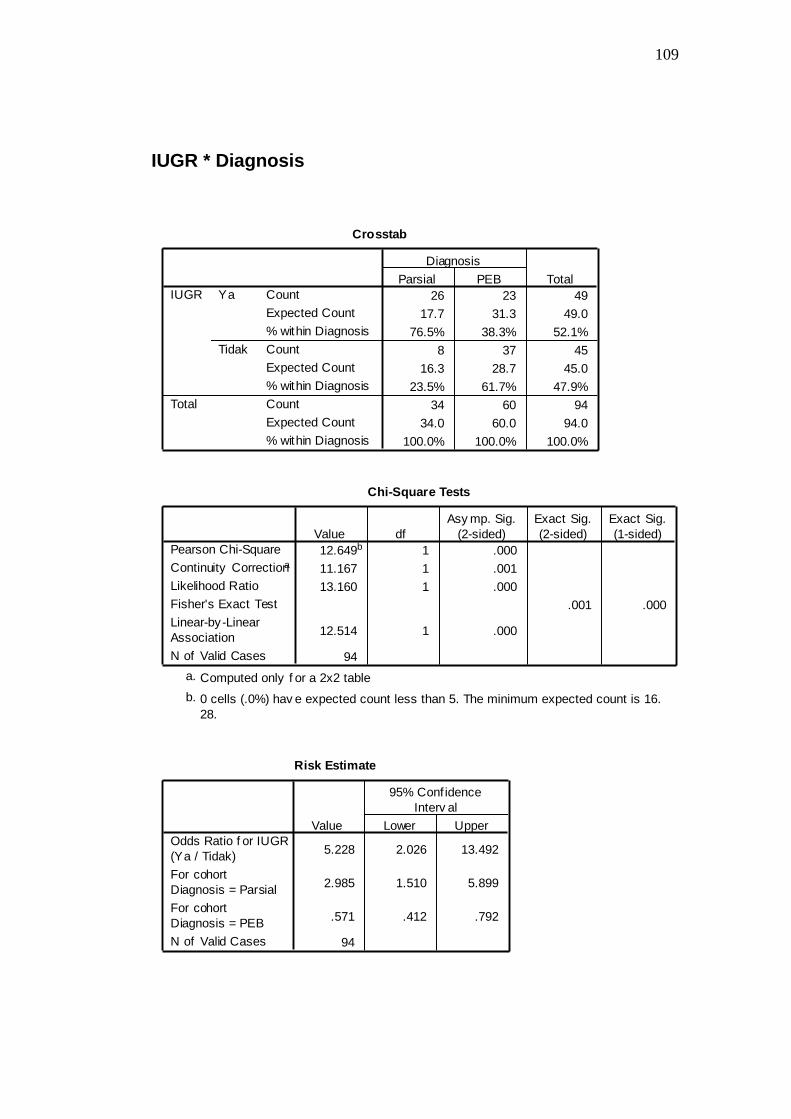
IUGR * Diagnosis
Crosstab
26 23 49
17.7 31.3 49.0
76.5% 38.3% 52.1%
8 37 45
16.3 28.7 45.0
23.5% 61.7% 47.9%
34 60 94
34.0 60.0 94.0
100.0% 100.0% 100.0%
Count
Expected Count
% within Diagnosis
Count
Expected Count
% within Diagnosis
Count
Expected Count
% within Diagnosis
Ya
Tidak
IUGR
Total
Parsial PEB
Diagnosis
Total
Chi-Square Tests
12.649b 1 .000
11.167 1 .001
13.160 1 .000
.001 .000
12.514 1 .000
94
Pearson Chi-Square
Continuity Correctiona
Likelihood Ratio
Fisher's Exact Test
Linear-by-Linear
Association
N of Valid Cases
Value df
Asy mp. Sig.
(2-sided)
Exact Sig.
(2-sided)
Exact Sig.
(1-sided)
Computed only f or a 2x2 tablea.
0 cells (.0%) hav e expected count less than 5. The minimum expected count is 16.
28.
b.
Risk Estimate
5.228 2.026 13.492
2.985 1.510 5.899
.571 .412 .792
94
Odds Ratio f or IUGR
(Ya / Tidak)
For cohort
Diagnosis = Parsial
For cohort
Diagnosis = PEB
N of Valid Cases
Value Lower Upper
95% Conf idence
Interv al

110
IUFD * Diagnosis
Crosstab
7 1 8
2.9 5.1 8.0
20.6% 1.7% 8.5%
27 59 86
31.1 54.9 86.0
79.4% 98.3% 91.5%
34 60 94
34.0 60.0 94.0
100.0% 100.0% 100.0%
Count
Expected Count
% within Diagnosis
Count
Expected Count
% within Diagnosis
Count
Expected Count
% within Diagnosis
Ya
Tidak
IUFD
Total
Parsial PEB
Diagnosis
Total
Chi-Square Tests
9.979b 1 .002
7.697 1 .006
9.974 1 .002
.003 .003
9.873 1 .002
94
Pearson Chi-Square
Continuity Correctiona
Likelihood Ratio
Fisher's Exact Test
Linear-by-Linear
Association
N of Valid Cases
Value df
Asy mp. Sig.
(2-sided)
Exact Sig.
(2-sided)
Exact Sig.
(1-sided)
Computed only f or a 2x2 tablea.
1 cells (25.0%) hav e expected count less than 5. The minimum expected count is 2.
89.
b.
Risk Estimate
15.296 1.792 130.558
2.787 1.854 4.190
.182 .029 1.146
94
Odds Ratio f or IUFD
(Ya / Tidak)
For cohort
Diagnosis = Parsial
For cohort
Diagnosis = PEB
N of Valid Cases
Value Lower Upper
95% Conf idence
Interv al
111
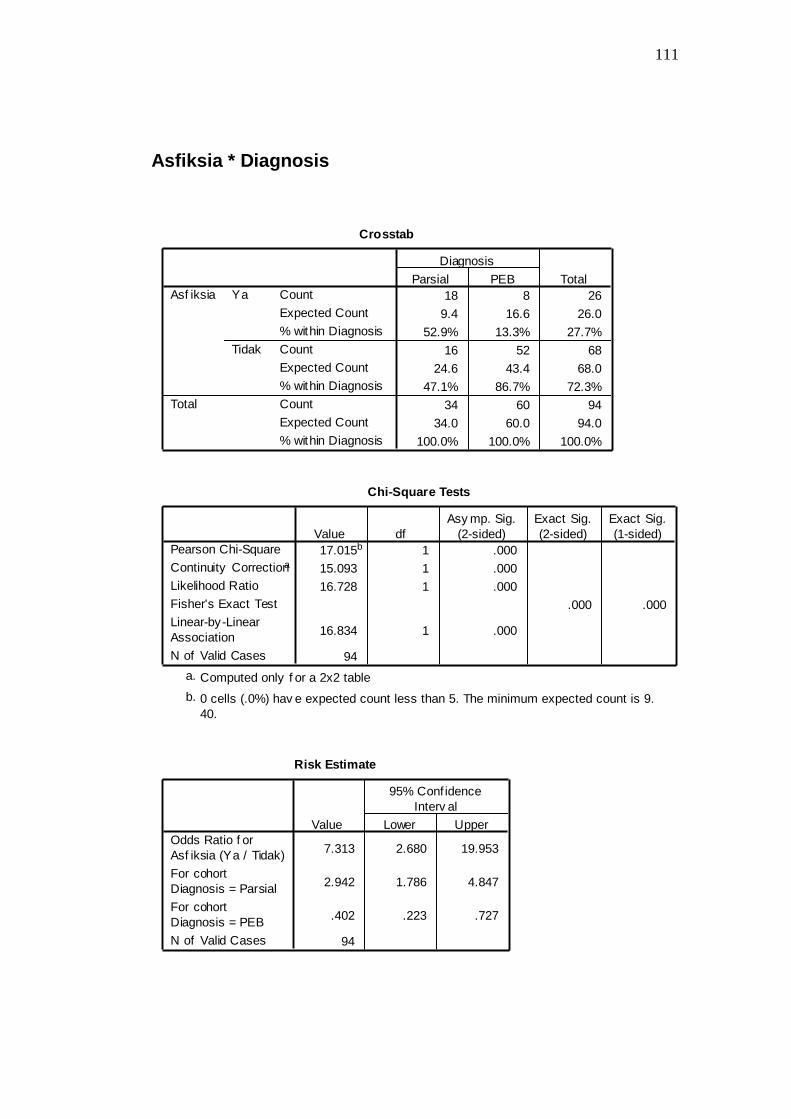
Asfiksia * Diagnosis
Crosstab
18 8 26
9.4 16.6 26.0
52.9% 13.3% 27.7%
16 52 68
24.6 43.4 68.0
47.1% 86.7% 72.3%
34 60 94
34.0 60.0 94.0
100.0% 100.0% 100.0%
Count
Expected Count
% within Diagnosis
Count
Expected Count
% within Diagnosis
Count
Expected Count
% within Diagnosis
Ya
Tidak
Asf iksia
Total
Parsial PEB
Diagnosis
Total
Chi-Square Tests
17.015b 1 .000
15.093 1 .000
16.728 1 .000
.000 .000
16.834 1 .000
94
Pearson Chi-Square
Continuity Correctiona
Likelihood Ratio
Fisher's Exact Test
Linear-by-Linear
Association
N of Valid Cases
Value df
Asy mp. Sig.
(2-sided)
Exact Sig.
(2-sided)
Exact Sig.
(1-sided)
Computed only f or a 2x2 tablea.
0 cells (.0%) hav e expected count less than 5. The minimum expected count is 9.
40.
b.
Risk Estimate
7.313 2.680 19.953
2.942 1.786 4.847
.402 .223 .727
94
Odds Ratio f or
Asf iksia (Ya / Tidak)
For cohort
Diagnosis = Parsial
For cohort
Diagnosis = PEB
N of Valid Cases
Value Lower Upper
95% Conf idence
Interv al

112
Gawat janin * Diagnosis
Crosstab
9 2 11
4.0 7.0 11.0
26.5% 3.3% 11.7%
25 58 83
30.0 53.0 83.0
73.5% 96.7% 88.3%
34 60 94
34.0 60.0 94.0
100.0% 100.0% 100.0%
Count
Expected Count
% within Diagnosis
Count
Expected Count
% within Diagnosis
Count
Expected Count
% within Diagnosis
Ya
Tidak
Gawat
janin
Total
Parsial PEB
Diagnosis
Total
Chi-Square Tests
11.244b 1 .001
9.116 1 .003
11.022 1 .001
.001 .001
11.124 1 .001
94
Pearson Chi-Square
Continuity Correctiona
Likelihood Ratio
Fisher's Exact Test
Linear-by-Linear
Association
N of Valid Cases
Value df
Asy mp. Sig.
(2-sided)
Exact Sig.
(2-sided)
Exact Sig.
(1-sided)
Computed only f or a 2x2 tablea.
1 cells (25.0%) hav e expected count less than 5. The minimum expected count is 3.
98.
b.
Risk Estimate
10.440 2.103 51.830
2.716 1.767 4.176
.260 .074 .919
94
Odds Rat io for Gawat
janin (Ya / Tidak)
For cohort Diagnosis
= Parsial
For cohort Diagnosis
= PEB
N of Valid Cases
Value Lower Upper
95% Conf idence
Interv al
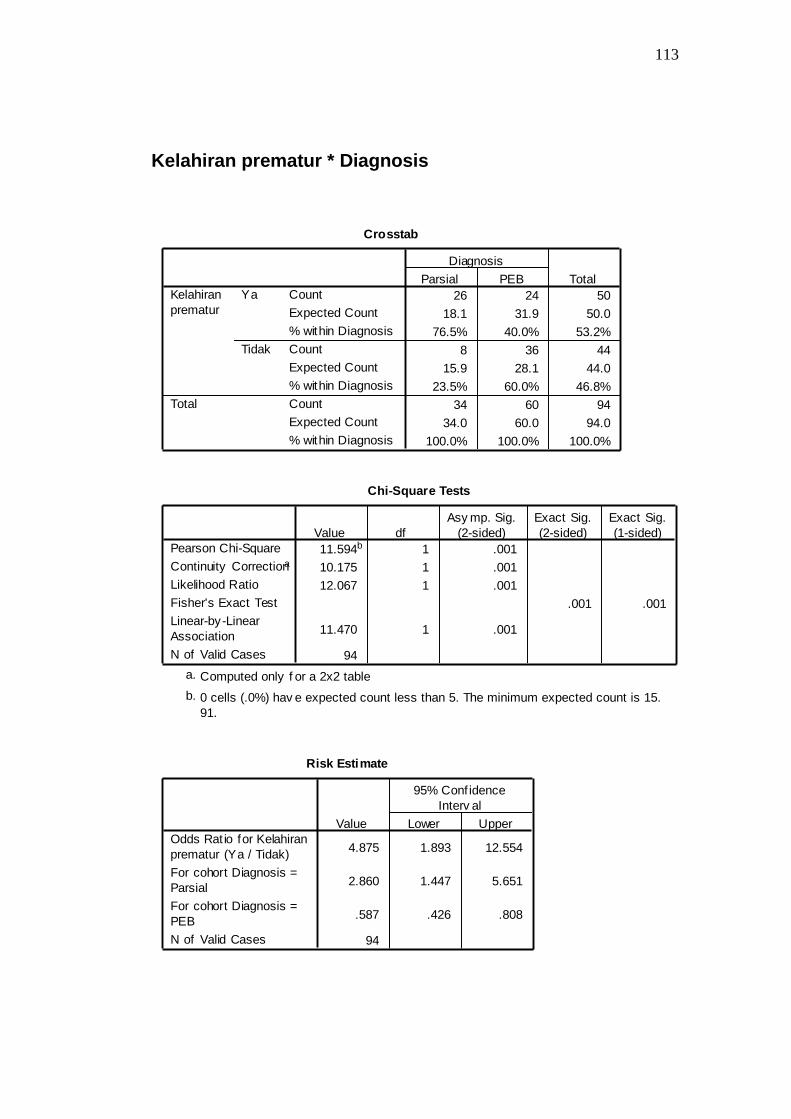
113
Kelahiran prematur * Diagnosis
Crosstab
26 24 50
18.1 31.9 50.0
76.5% 40.0% 53.2%
8 36 44
15.9 28.1 44.0
23.5% 60.0% 46.8%
34 60 94
34.0 60.0 94.0
100.0% 100.0% 100.0%
Count
Expected Count
% within Diagnosis
Count
Expected Count
% within Diagnosis
Count
Expected Count
% within Diagnosis
Ya
Tidak
Kelahiran
prematur
Total
Parsial PEB
Diagnosis
Total
Chi-Square Tests
11.594b 1 .001
10.175 1 .001
12.067 1 .001
.001 .001
11.470 1 .001
94
Pearson Chi-Square
Continuity Correctiona
Likelihood Ratio
Fisher's Exact Test
Linear-by-Linear
Association
N of Valid Cases
Value df
Asy mp. Sig.
(2-sided)
Exact Sig.
(2-sided)
Exact Sig.
(1-sided)
Computed only f or a 2x2 tablea.
0 cells (.0%) hav e expected count less than 5. The minimum expected count is 15.
91.
b.
Risk Estimate
4.875 1.893 12.554
2.860 1.447 5.651
.587 .426 .808
94
Odds Rat io for Kelahiran
prematur (Ya / Tidak)
For cohort Diagnosis =
Parsial
For cohort Diagnosis =
PEB
N of Valid Cases
Value Lower Upper
95% Conf idence
Interv al

114
Kelainan Doppler * Diagnosis
Crosstab
11 6 17
6.1 10.9 17.0
32.4% 10.0% 18.1%
23 54 77
27.9 49.1 77.0
67.6% 90.0% 81.9%
34 60 94
34.0 60.0 94.0
100.0% 100.0% 100.0%
Count
Expected Count
% within Diagnosis
Count
Expected Count
% within Diagnosis
Count
Expected Count
% within Diagnosis
Ya
Tidak
Kelainan
Doppler
Total
Parsial PEB
Diagnosis
Total
Chi-Square Tests
7.320b 1 .007
5.888 1 .015
7.048 1 .008
.011 .008
7.242 1 .007
94
Pearson Chi-Square
Continuity Correctiona
Likelihood Ratio
Fisher's Exact Test
Linear-by-Linear
Association
N of Valid Cases
Value df
Asy mp. Sig.
(2-sided)
Exact Sig.
(2-sided)
Exact Sig.
(1-sided)
Computed only f or a 2x2 tablea.
0 cells (.0%) hav e expected count less than 5. The minimum expected count is 6.
15.
b.
Risk Estimate
4.304 1.421 13.035
2.166 1.327 3.537
.503 .260 .974
94
Odds Rat io f or Kelainan
Doppler (Ya / Tidak)
For cohort Diagnosis =
Parsial
For cohort Diagnosis =
PEB
N of Valid Cases
Value Lower Upper
95% Conf idence
Interv al
115
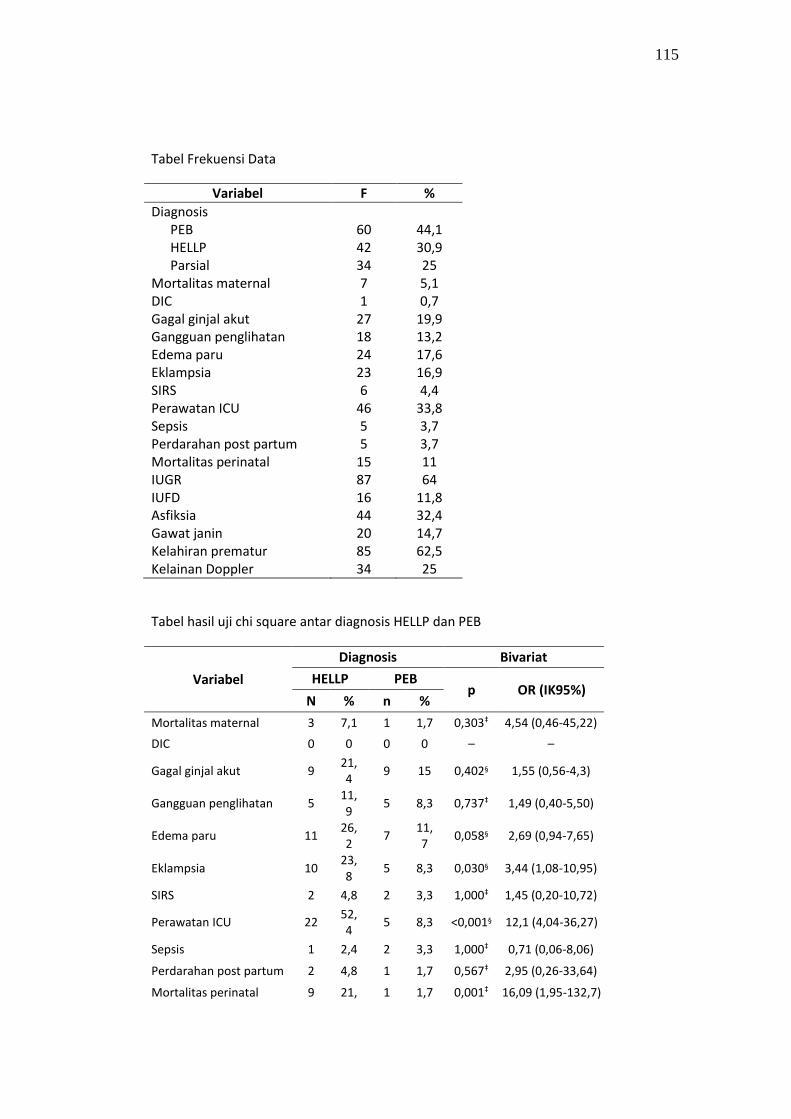
Tabel Frekuensi Data
Variabel F %
Diagnosis PEB 60 44,1 HELLP 42 30,9 Parsial 34 25 Mortalitas maternal 7 5,1 DIC 1 0,7 Gagal ginjal akut 27 19,9 Gangguan penglihatan 18 13,2 Edema paru 24 17,6 Eklampsia 23 16,9 SIRS 6 4,4 Perawatan ICU 46 33,8 Sepsis 5 3,7 Perdarahan post partum 5 3,7 Mortalitas perinatal 15 11 IUGR 87 64 IUFD 16 11,8 Asfiksia 44 32,4 Gawat janin 20 14,7 Kelahiran prematur 85 62,5 Kelainan Doppler 34 25
Tabel hasil uji chi square antar diagnosis HELLP dan PEB
Variabel
Diagnosis Bivariat
HELLP PEB p OR (IK95%)
N % n %
Mortalitas maternal 3 7,1 1 1,7 0,303‡ 4,54 (0,46-45,22)
DIC 0 0 0 0 – –
Gagal ginjal akut 9 21,4
9 15 0,402§ 1,55 (0,56-4,3)
Gangguan penglihatan 5 11,9
5 8,3 0,737‡ 1,49 (0,40-5,50)
Edema paru 11 26,2
7 11,7
0,058§ 2,69 (0,94-7,65)
Eklampsia 10 23,8
5 8,3 0,030§ 3,44 (1,08-10,95)
SIRS 2 4,8 2 3,3 1,000‡ 1,45 (0,20-10,72)
Perawatan ICU 22 52,4
5 8,3 <0,001§ 12,1 (4,04-36,27)
Sepsis 1 2,4 2 3,3 1,000‡ 0,71 (0,06-8,06)
Perdarahan post partum 2 4,8 1 1,7 0,567‡ 2,95 (0,26-33,64)
Mortalitas perinatal 9 21, 1 1,7 0,001‡ 16,09 (1,95-132,7)
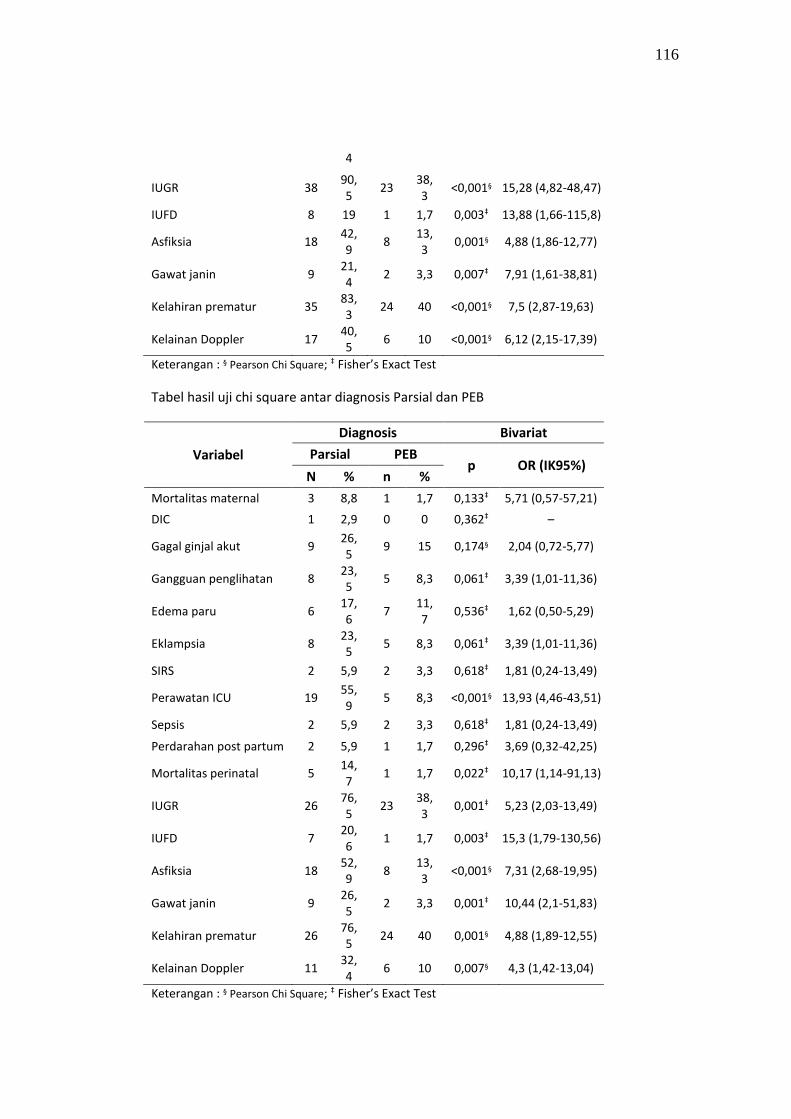
116
4
IUGR 38 90,5
23 38,3
<0,001§ 15,28 (4,82-48,47)
IUFD 8 19 1 1,7 0,003‡ 13,88 (1,66-115,8)
Asfiksia 18 42,9
8 13,3
0,001§ 4,88 (1,86-12,77)
Gawat janin 9 21,4
2 3,3 0,007‡ 7,91 (1,61-38,81)
Kelahiran prematur 35 83,3
24 40 <0,001§ 7,5 (2,87-19,63)
Kelainan Doppler 17 40,5
6 10 <0,001§ 6,12 (2,15-17,39)
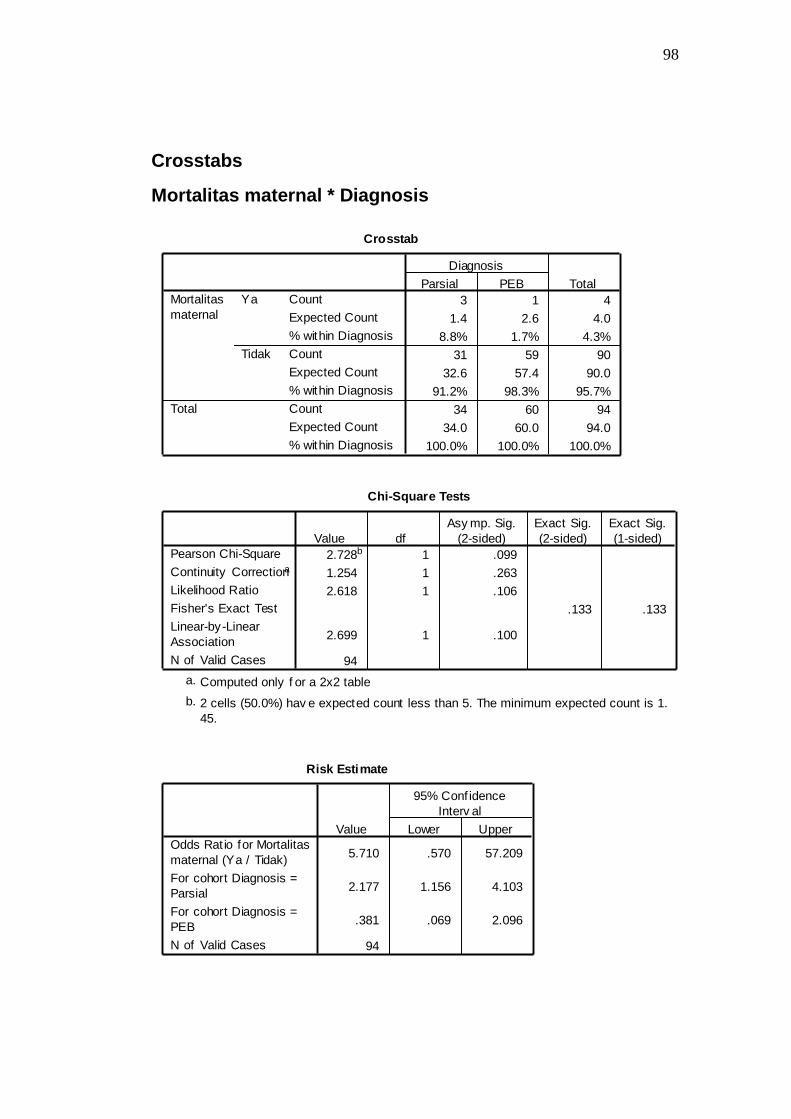
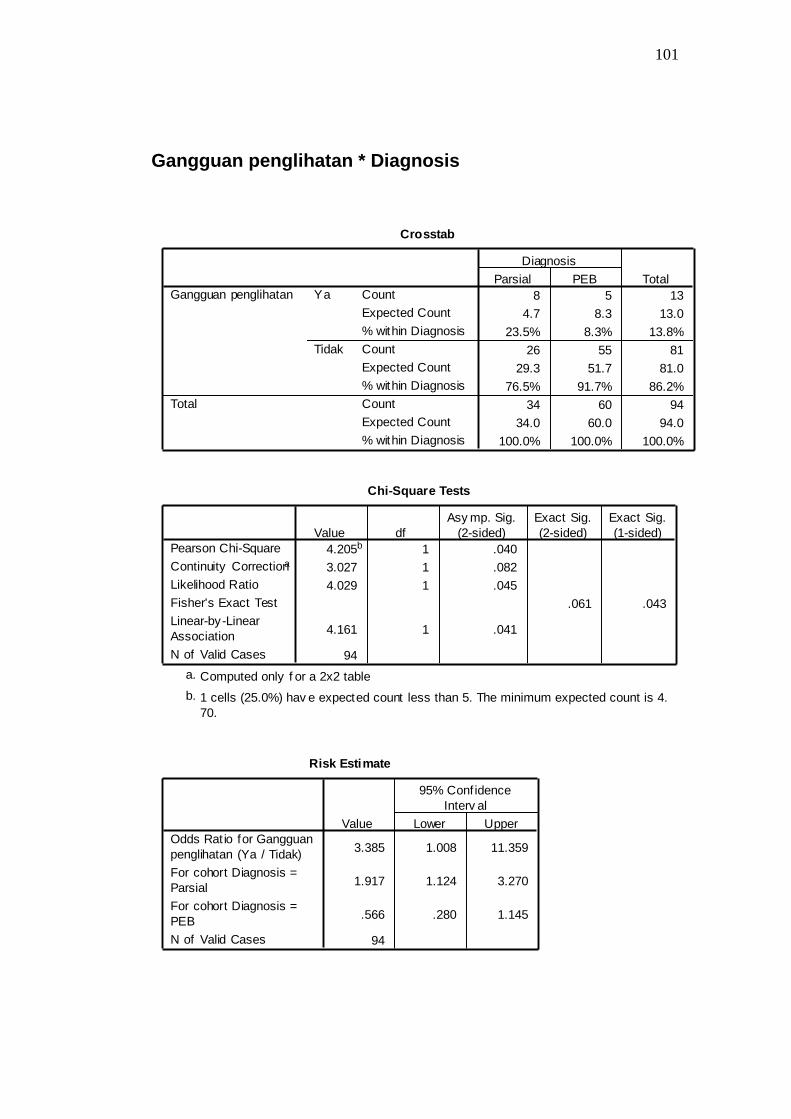
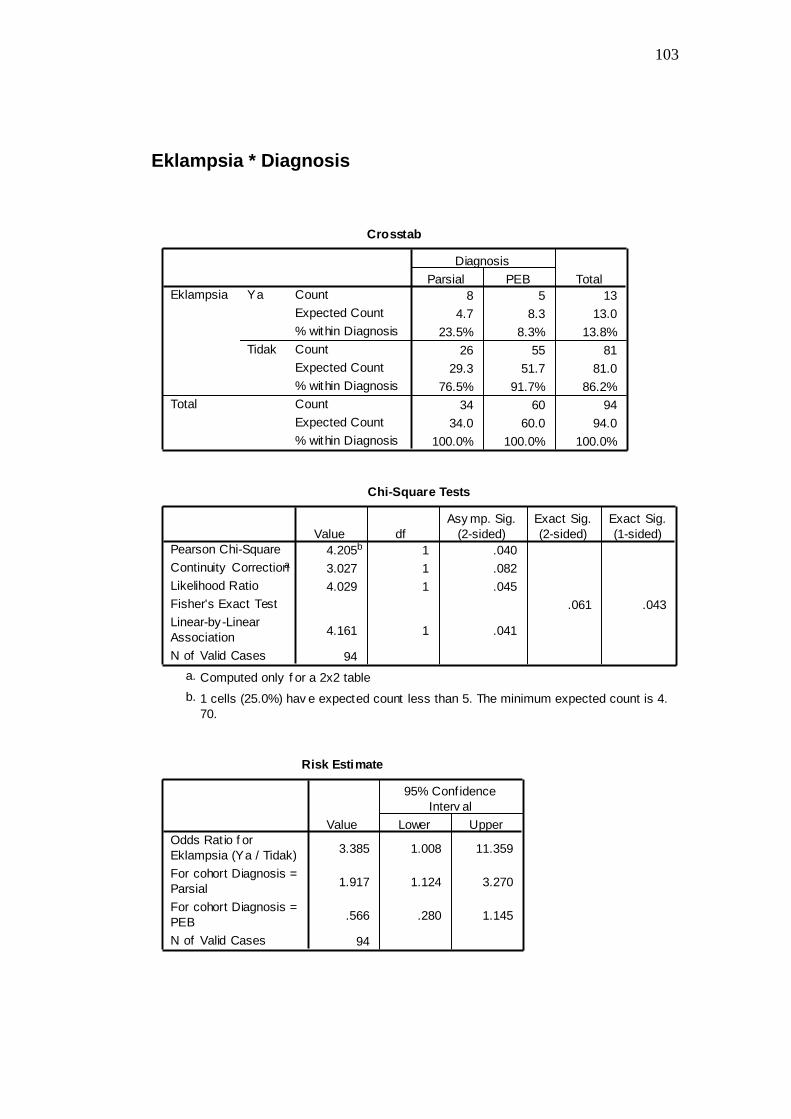
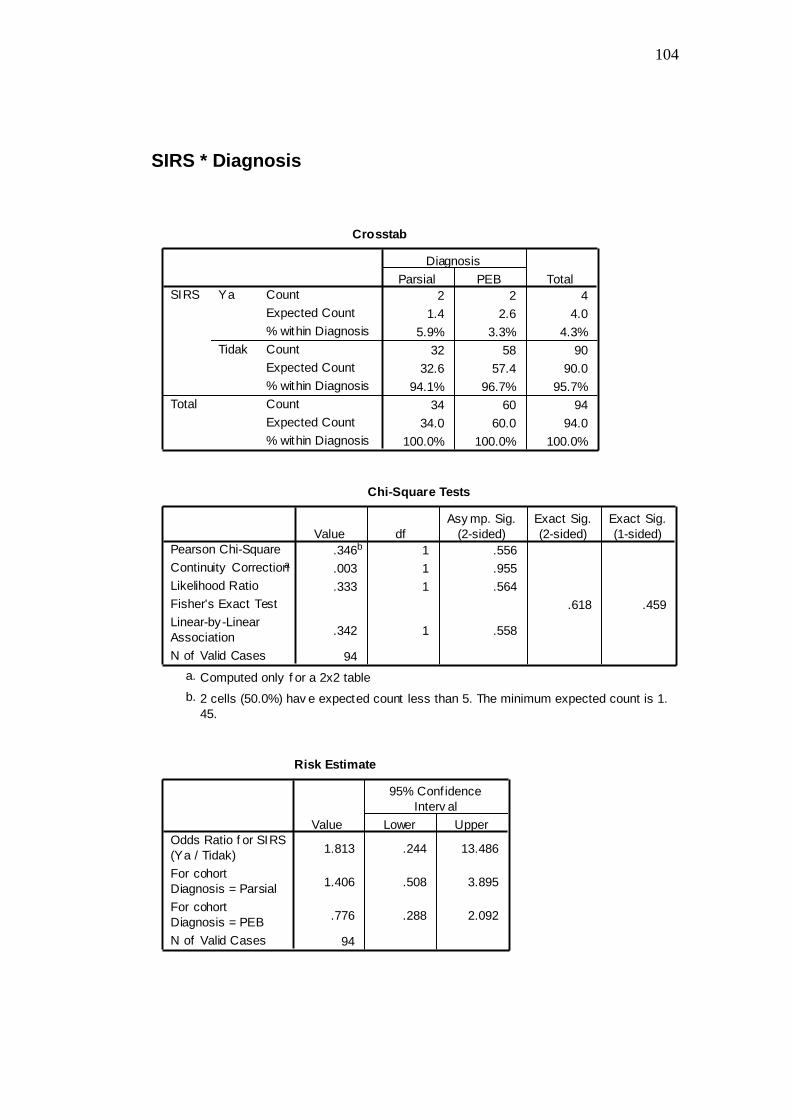
Keterangan : § Pearson Chi Square; ‡ Fisher’s Exact Test
Tabel hasil uji chi square antar diagnosis Parsial dan PEB
Variabel
Diagnosis Bivariat
Parsial PEB p OR (IK95%)
N % n %
Mortalitas maternal 3 8,8 1 1,7 0,133‡ 5,71 (0,57-57,21)
DIC 1 2,9 0 0 0,362‡ –
Gagal ginjal akut 9 26,5
9 15 0,174§ 2,04 (0,72-5,77)
Gangguan penglihatan 8 23,5
5 8,3 0,061‡ 3,39 (1,01-11,36)
Edema paru 6 17,6
7 11,7
0,536‡ 1,62 (0,50-5,29)
Eklampsia 8 23,5
5 8,3 0,061‡ 3,39 (1,01-11,36)
SIRS 2 5,9 2 3,3 0,618‡ 1,81 (0,24-13,49)
Perawatan ICU 19 55,9
5 8,3 <0,001§ 13,93 (4,46-43,51)
Sepsis 2 5,9 2 3,3 0,618‡ 1,81 (0,24-13,49)
Perdarahan post partum 2 5,9 1 1,7 0,296‡ 3,69 (0,32-42,25)
Mortalitas perinatal 5 14,7
1 1,7 0,022‡ 10,17 (1,14-91,13)
IUGR 26 76,5
23 38,3
0,001‡ 5,23 (2,03-13,49)
IUFD 7 20,6
1 1,7 0,003‡ 15,3 (1,79-130,56)
Asfiksia 18 52,9
8 13,3
<0,001§ 7,31 (2,68-19,95)
Gawat janin 9 26,5
2 3,3 0,001‡ 10,44 (2,1-51,83)
Kelahiran prematur 26 76,5
24 40 0,001§ 4,88 (1,89-12,55)
Kelainan Doppler 11 32,4
6 10 0,007§ 4,3 (1,42-13,04)
Keterangan : § Pearson Chi Square; ‡ Fisher’s Exact Test
117
LAMPIRAN 4
Biodata diri
Nama : Wahyu Choerul Tamsir
NIM : 22010112120024
Tempat/tanggal lahir : Batang, 4 Juni 1994
Jenis kelamin : Laki-laki
Nomor HP : 085741830070
e-mail : [email protected]
Riwayat Pendidikan Formal
1. SD : SDN PESAREN 02 Lulus tahun : 2006
2. SMP : SMP N 1 WARUNGASEM Lulus tahun : 2009
3. SMA : SMA N 1 BATANG Lulus tahun : 2012
Keanggotaan Organisasi
1. Anggota AMT Asy-Syifa Medical Team Tahun 2014/2015
2. Kabid Kaderisasi AMT Asy-Syifa Medical Team Tahun 2015/2016


![DAFTAR PUSTAKA - etd.repository.ugm.ac.idetd.repository.ugm.ac.id/downloadfile/96937/potongan/S1-2016... · 90 DAFTAR PUSTAKA DAFTAR PUSTAKA [1] Badan Standardisasi Nasional. “SNI](https://static.fdocuments.us/doc/165x107/5ccf188d88c99385278e02a1/daftar-pustaka-etd-90-daftar-pustaka-daftar-pustaka-1-badan-standardisasi.jpg)


![Daftar Pustaka [1724 KB]](https://static.fdocuments.us/doc/165x107/586771db1a28ab17578b5daa/daftar-pustaka-1724-kb.jpg)

![Daftar Pustaka [799.8 KB]](https://static.fdocuments.us/doc/165x107/5879e7431a28abd0398c04b0/daftar-pustaka-7998-kb.jpg)
