D5.4 – Impact of solubility uncertainties on the PA ... · D5.4 – Impact of solubility...
15
D5.4 – Impact of solubility uncertainties on the PA calculations SLOW PROCESSES IN CLOSE-TO-EQUILIBRIUM CONDITIONS FOR RADIONUCLIDES IN WATER/SOLID SYSTEMS OF RELEVANCE TO NUCLEAR WASTE MANAGEMENT SKIN COLLABORATIVE PROJECT (CP) Reporting period: 01/01/2011-31/12/2013 Grant agreement N°.: FP7-269688 Submitting organizations: Amphos21 Due date of deliverable: 28 Project Months Actual submission: 33 Project Months Start date of the project: 01 January 2011 Duration: 36 months Project co-funded by the European Commission under the Seventh Framework Programme of the European Atomic Energy Community (Euratom) for nuclear research and training activities (2007 to 2011) Dissemination Level PU Public × RE Restricted to a group specified by the partners of the project CO Confidential, only for partners of the project
-
Upload
truongtram -
Category
Documents
-
view
216 -
download
0
Transcript of D5.4 – Impact of solubility uncertainties on the PA ... · D5.4 – Impact of solubility...

D5.4 – Impact of solubility uncertainties on the PA calculations
SLOW PROCESSES IN CLOSE-TO-EQUILIBRIUM CONDITIONS FOR
RADIONUCLIDES IN WATER /SOLID SYSTEMS OF RELEVANCE TO NUCLEAR
WASTE MANAGEMENT SKIN
COLLABORATIVE PROJECT (CP) Reporting period: 01/01/2011-31/12/2013 Grant agreement N°.: FP7-269688 Submitting organizations: Amphos21 Due date of deliverable: 28 Project Months Actual submission: 33 Project Months Start date of the project: 01 January 2011 Duration: 36 months Project co-funded by the European Commission under the Seventh Framework Programme of the European Atomic Energy Community (Euratom) for nuclear research and training activities (2007 to 2011) Dissemination Level PU Public × RE Restricted to a group specified by the partners of the project CO Confidential, only for partners of the project

1
S K I NS K I N
1. Introduction High uncertainties in the solubility and sorption of some elements may be reflected in high uncertainties in the results of the calculations used to support safety assessments. The main objective of WP5 is to study the impact of the SKIN project in reducing the uncertainty of solubility and sorption data. The evaluation of the impact of new data obtained within SKIN project (together with results of previous studies of literature and field data) is assessed trough compartmental modelling. Figure 1 shows the methodology followed to achieve the aim of WP5. Firstly, a Reference Case will be defined using literature data. During the project, a compilation of solubility and sorption data will be generated. In a third step, input data of the Reference Case will be updated with data provided by the SKIN partners obtaining new results. At the end of the project, the impact of the SKIN project will be assessed considering the results of previous steps.
Figure 1: Methodology.
2
S K I NS K I N
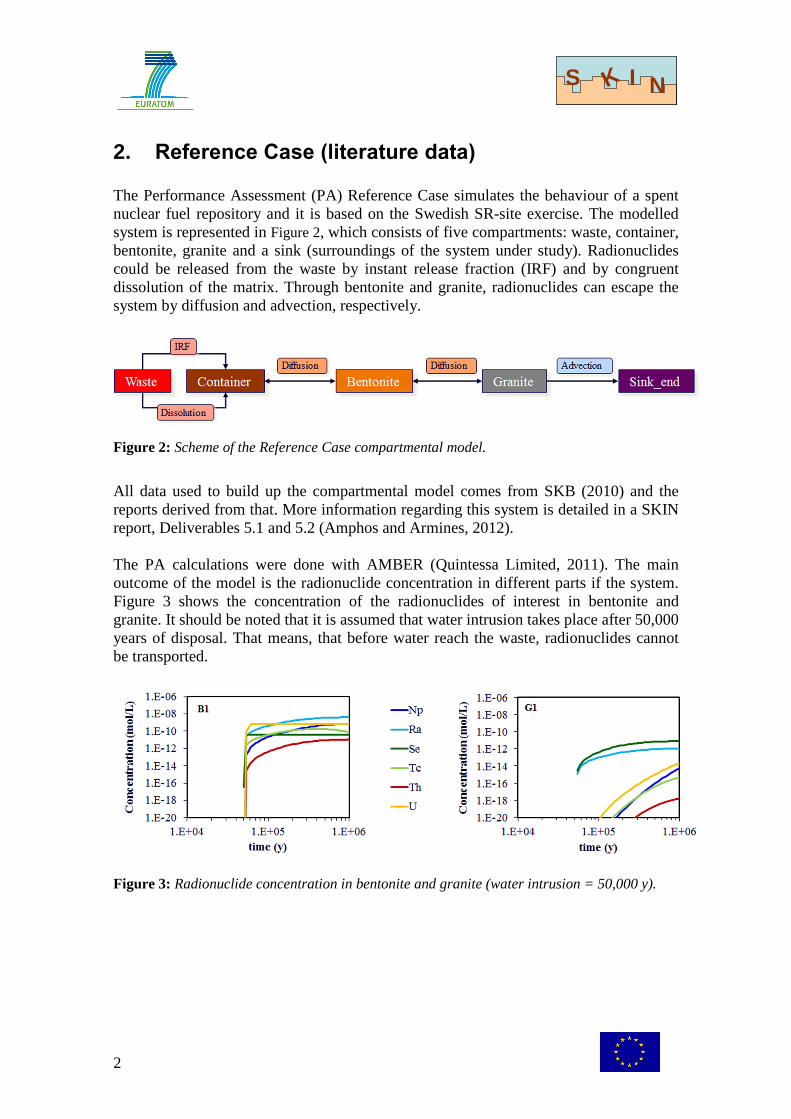
2. Reference Case (literature data) The Performance Assessment (PA) Reference Case simulates the behaviour of a spent nuclear fuel repository and it is based on the Swedish SR-site exercise. The modelled system is represented in Figure 2, which consists of five compartments: waste, container, bentonite, granite and a sink (surroundings of the system under study). Radionuclides could be released from the waste by instant release fraction (IRF) and by congruent dissolution of the matrix. Through bentonite and granite, radionuclides can escape the system by diffusion and advection, respectively.
Figure 2: Scheme of the Reference Case compartmental model.
All data used to build up the compartmental model comes from SKB (2010) and the reports derived from that. More information regarding this system is detailed in a SKIN report, Deliverables 5.1 and 5.2 (Amphos and Armines, 2012). The PA calculations were done with AMBER (Quintessa Limited, 2011). The main outcome of the model is the radionuclide concentration in different parts if the system. Figure 3 shows the concentration of the radionuclides of interest in bentonite and granite. It should be noted that it is assumed that water intrusion takes place after 50,000 years of disposal. That means, that before water reach the waste, radionuclides cannot be transported.
Figure 3: Radionuclide concentration in bentonite and granite (water intrusion = 50,000 y).
3
S K I NS K I N
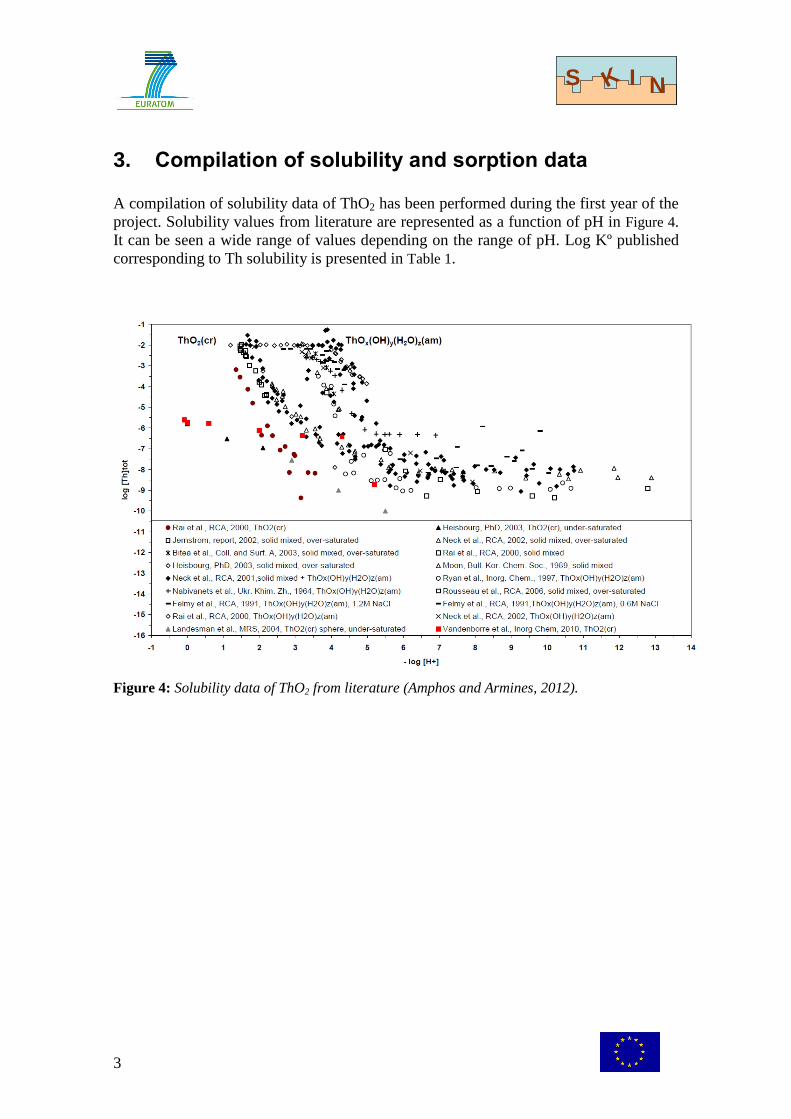
3. Compilation of solubility and sorption data A compilation of solubility data of ThO2 has been performed during the first year of the project. Solubility values from literature are represented as a function of pH in Figure 4. It can be seen a wide range of values depending on the range of pH. Log Kº published corresponding to Th solubility is presented in Table 1.
Figure 4: Solubility data of ThO2 from literature (Amphos and Armines, 2012).

4
S K I NS K I N
Table 1: Solubility product values from literature.
Solid log K°sp exp Publications
ThO
x(O
H) y
(H2O
) z(s
) -53.2 Rothe et al. (2002)
-49.2 Rai et al. (2000)
-52.8 Bundschuh et al. (2000)
-48.7 Östhols et al. (1994)
-47.0 Neck et al. (2001)
-52.9 Moon (1989) Neck et al. (2002)
-47.8 Neck et al. (2002)
-46.6 Moon (1989)
-45.5 Felmy et al. (1991)
-45.5 Rai et al. (1997)
-47.3 Ryan and Rai (1987)
-46.6 Nabivanets and Kudritskaya (1964) Baes et al (1965)
-46.2 Rai et al. (2000)
ThO2(cr) -56.9 Rai et al. (2000)
5
S K I NS K I N
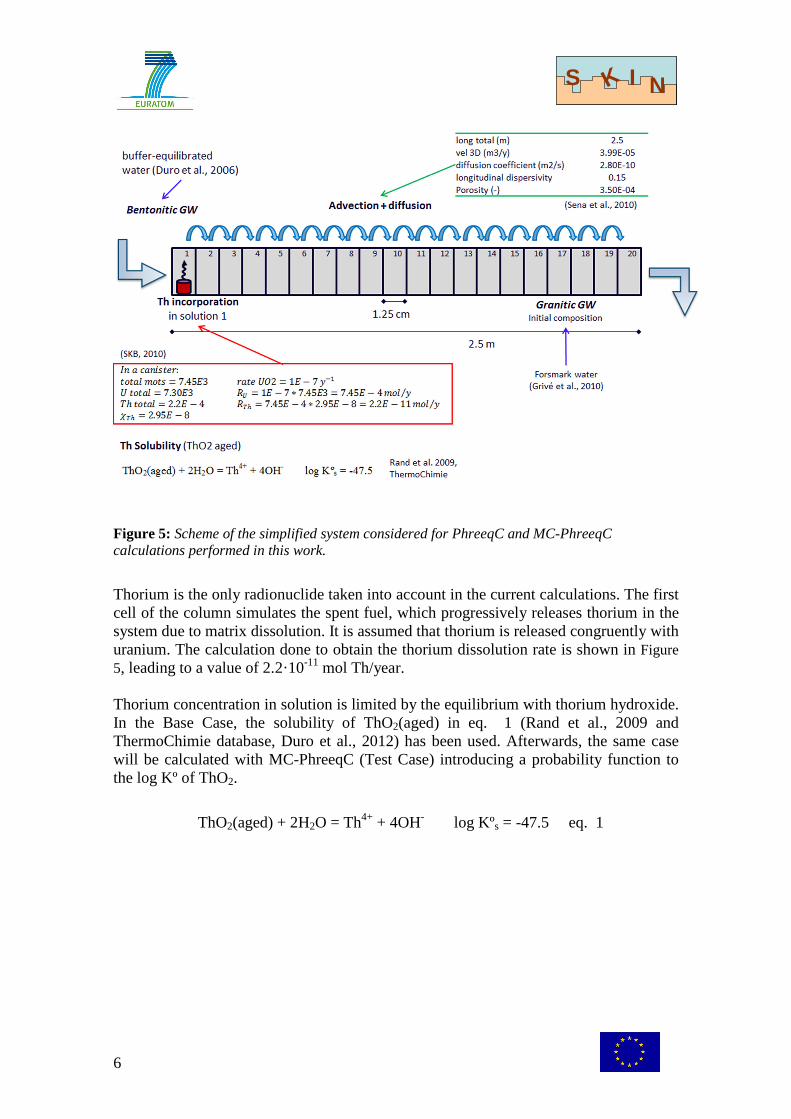
4. Reference Case (new input data) It is well known that the solubility of thorium hydroxide has a very high uncertainty. A compilation of literature data has been done and a wide range of solubility constants was observed (see Figure 4 and Table 1). This data will be used to evaluate the impact of the uncertainty of log Kº of ThO2 on thorium concentration. That exercise is carried out with PhreeqC (Parkhurst and Appelo, 1999) and MC-PhreeqC (Amphos, 2011). The software MC-PhreeqC provides a way to do Monte-Carlo simulations automatically, using a PhreeqC input file, a probability distribution (pdf) for each of the uncertain parameters and the settings for the Monte Carlo simulation. The main objective of the work done during the second year of the SKIN project within WP5 is testing MC-PhreeqC as a complementary tool of AMBER to achieve the final objective of WP5 (assessment of the SKIN impact on PA calculations). The reason of testing this tool is that AMBER cannot model geochemical processes. This means that you can implement a solubility limit for each element but it is not possible to calculate it using water composition as an input. Firstly, a simplified system has been calculated with PhreeqC as a Base Case. It consists in a granite column of 2.5m divided into 20 cells of 1.25cm each, as summarized in Figure 5. The composition of the granitic porewater is equal to the Forsmark groundwater composition reported in Grivé et al. (2010). Bentonitic porewater (Duro et al., 2006) is expected to enter the granite system as shown in Figure 5. Both advection and diffusion are considered to occur.
6
S K I NS K I N
Figure 5: Scheme of the simplified system considered for PhreeqC and MC-PhreeqC calculations performed in this work.
Thorium is the only radionuclide taken into account in the current calculations. The first cell of the column simulates the spent fuel, which progressively releases thorium in the system due to matrix dissolution. It is assumed that thorium is released congruently with uranium. The calculation done to obtain the thorium dissolution rate is shown in Figure 5, leading to a value of 2.2·10-11 mol Th/year. Thorium concentration in solution is limited by the equilibrium with thorium hydroxide. In the Base Case, the solubility of ThO2(aged) in eq. 1 (Rand et al., 2009 and ThermoChimie database, Duro et al., 2012) has been used. Afterwards, the same case will be calculated with MC-PhreeqC (Test Case) introducing a probability function to the log Kº of ThO2.
ThO2(aged) + 2H2O = Th4+ + 4OH- log Kºs = -47.5 eq. 1
7
S K I NS K I N
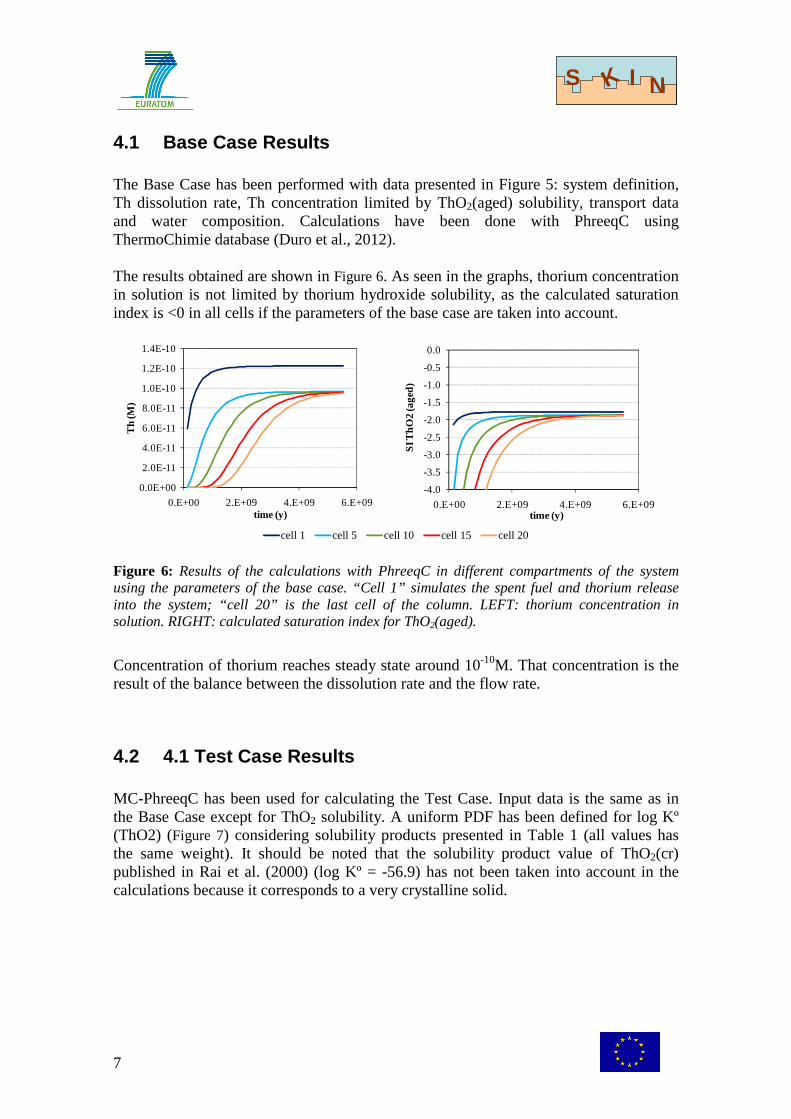
4.1 Base Case Results The Base Case has been performed with data presented in Figure 5: system definition, Th dissolution rate, Th concentration limited by ThO2(aged) solubility, transport data and water composition. Calculations have been done with PhreeqC using ThermoChimie database (Duro et al., 2012). The results obtained are shown in Figure 6. As seen in the graphs, thorium concentration in solution is not limited by thorium hydroxide solubility, as the calculated saturation index is <0 in all cells if the parameters of the base case are taken into account.
Figure 6: Results of the calculations with PhreeqC in different compartments of the system using the parameters of the base case. “Cell 1” simulates the spent fuel and thorium release into the system; “cell 20” is the last cell of the column. LEFT: thorium concentration in solution. RIGHT: calculated saturation index for ThO2(aged).
Concentration of thorium reaches steady state around 10-10M. That concentration is the result of the balance between the dissolution rate and the flow rate.
4.2 4.1 Test Case Results MC-PhreeqC has been used for calculating the Test Case. Input data is the same as in the Base Case except for ThO2 solubility. A uniform PDF has been defined for log Kº (ThO2) (Figure 7) considering solubility products presented in Table 1 (all values has the same weight). It should be noted that the solubility product value of ThO2(cr) published in Rai et al. (2000) (log Kº = -56.9) has not been taken into account in the calculations because it corresponds to a very crystalline solid.
0.0E+00
2.0E-11
4.0E-11
6.0E-11
8.0E-11
1.0E-10
1.2E-10
1.4E-10
0.E+00 2.E+09 4.E+09 6.E+09
Th
(M)
time (y)
-4.0
-3.5
-3.0
-2.5
-2.0
-1.5
-1.0
-0.5
0.0
0.E+00 2.E+09 4.E+09 6.E+09
SI T
hO
2 (a
ged
)
time (y)
cell 1 cell 5 cell 10 cell 15 cell 20
8
S K I NS K I N
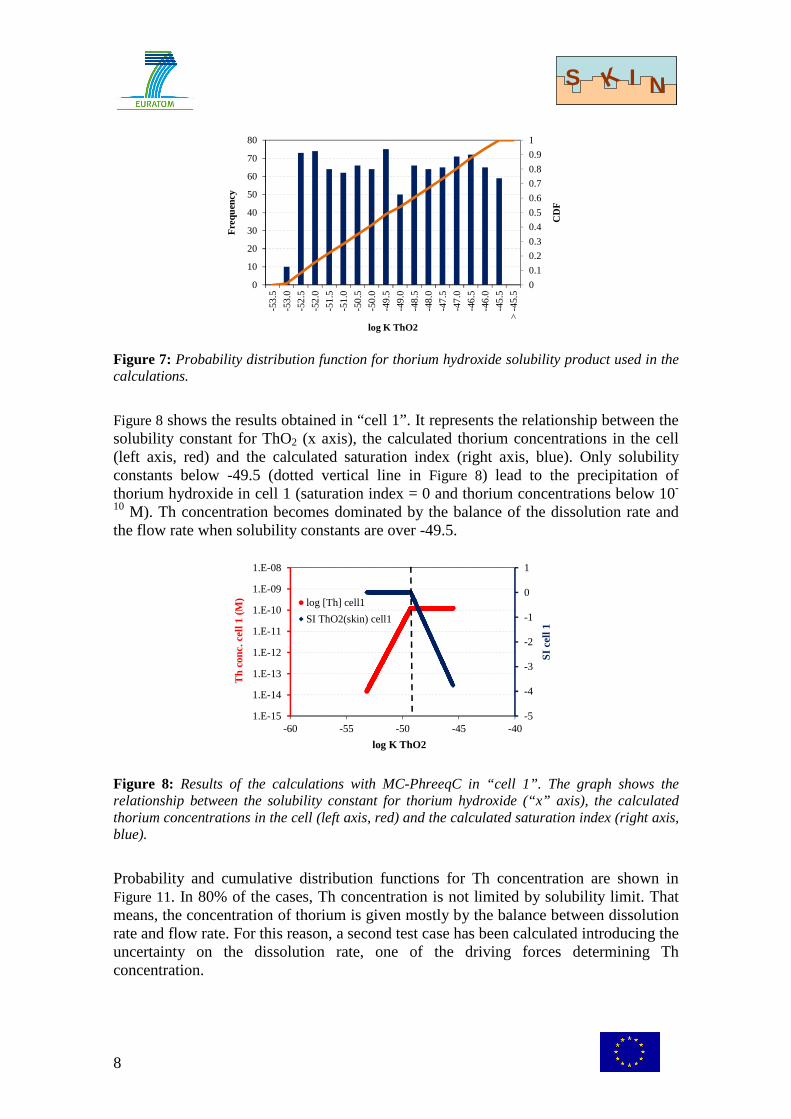
Figure 7: Probability distribution function for thorium hydroxide solubility product used in the calculations.
Figure 8 shows the results obtained in “cell 1”. It represents the relationship between the solubility constant for ThO2 (x axis), the calculated thorium concentrations in the cell (left axis, red) and the calculated saturation index (right axis, blue). Only solubility constants below -49.5 (dotted vertical line in Figure 8) lead to the precipitation of thorium hydroxide in cell 1 (saturation index = 0 and thorium concentrations below 10-
10 M). Th concentration becomes dominated by the balance of the dissolution rate and the flow rate when solubility constants are over -49.5.
Figure 8: Results of the calculations with MC-PhreeqC in “cell 1”. The graph shows the relationship between the solubility constant for thorium hydroxide (“x” axis), the calculated thorium concentrations in the cell (left axis, red) and the calculated saturation index (right axis, blue).
Probability and cumulative distribution functions for Th concentration are shown in Figure 11. In 80% of the cases, Th concentration is not limited by solubility limit. That means, the concentration of thorium is given mostly by the balance between dissolution rate and flow rate. For this reason, a second test case has been calculated introducing the uncertainty on the dissolution rate, one of the driving forces determining Th concentration.
0
0.1
0.2
0.3
0.4
0.5
0.6
0.7
0.8
0.9
1
0
10
20
30
40
50
60
70
80
-53
.5
-53
.0
-52
.5
-52
.0
-51
.5
-51
.0
-50
.5
-50
.0
-49
.5
-49
.0
-48
.5
-48
.0
-47
.5
-47
.0
-46
.5
-46
.0
-45
.5
> -
45.5
CD
F
Fre
quen
cy
log K ThO2
-5
-4
-3
-2
-1
0
1
1.E-15
1.E-14
1.E-13
1.E-12
1.E-11
1.E-10
1.E-09
1.E-08
-60 -55 -50 -45 -40
SI c
ell 1
Th
conc
. cel
l 1 (
M)
log K ThO2
log [Th] cell1
SI ThO2(skin) cell1

9
S K I NS K I N
Figure 9: Histograms of log [Th] obtained from the calculations with MC-PhreeqC in “cell 1” using the pdf for thorium hydroxide solubility in Figure 7.
This second test case has been calculated using the same data as in the Base Case with the exception of Th dissolution rate. In that case, ThO2(aged) solubility constant has been fixed at -47.5 (see eq.1). The dissolution rate value of 2.2·10-11 mol Th/y used in the Base Case is calculated considering the best estimate of the fuel conversion rate recommended in SKB (2010). In that report, it is published the associated uncertainty as a probability density function (Table 2). Thorium distribution rate has been adapted from triangular log-10 space to truncated normal ln-space, in order to fit the current capabilities of MC-PhreeqC version 2.0 software.
Table 2: Fuel conversion rates.
Element Lower limit
(year-1) Best estimate
(year-1) Upper limit
(year-1) Distribution Reference
U 1·10-8 1·10-7 1·10-6 Triangular, log-10 space
SKB (2010)
Th 2.2·10-12 2.2·10-11 2.2·10-10 Truncated normal, ln-space
Calculated from uranium conversion rate, used in present work
The probability distribution function (PDF) for rate dissolution used in the calculations is shown in Figure 10.
0.0
0.1
0.2
0.3
0.4
0.5
0.6
0.7
0.8
0.9
1.0
0
100
200
300
400
500
600
-13
.8-1
3.6
-13
.4-1
3.2
-13
-12
.8-1
2.6
-12
.4-1
2.2
-12
-11
.8-1
1.6
-11
.4-1
1.2
-11
-10
.8-1
0.6
-10
.4-1
0.2
-10
-9.8
> -
9.8
CD
F
Fre
quen
cy
log (Th conc.)

10
S K I NS K I N
Figure 10: Probability distribution function for thorium rate used in the calculations. Values in “x” axis are neperian logarithm of the thorium dissolution rate.
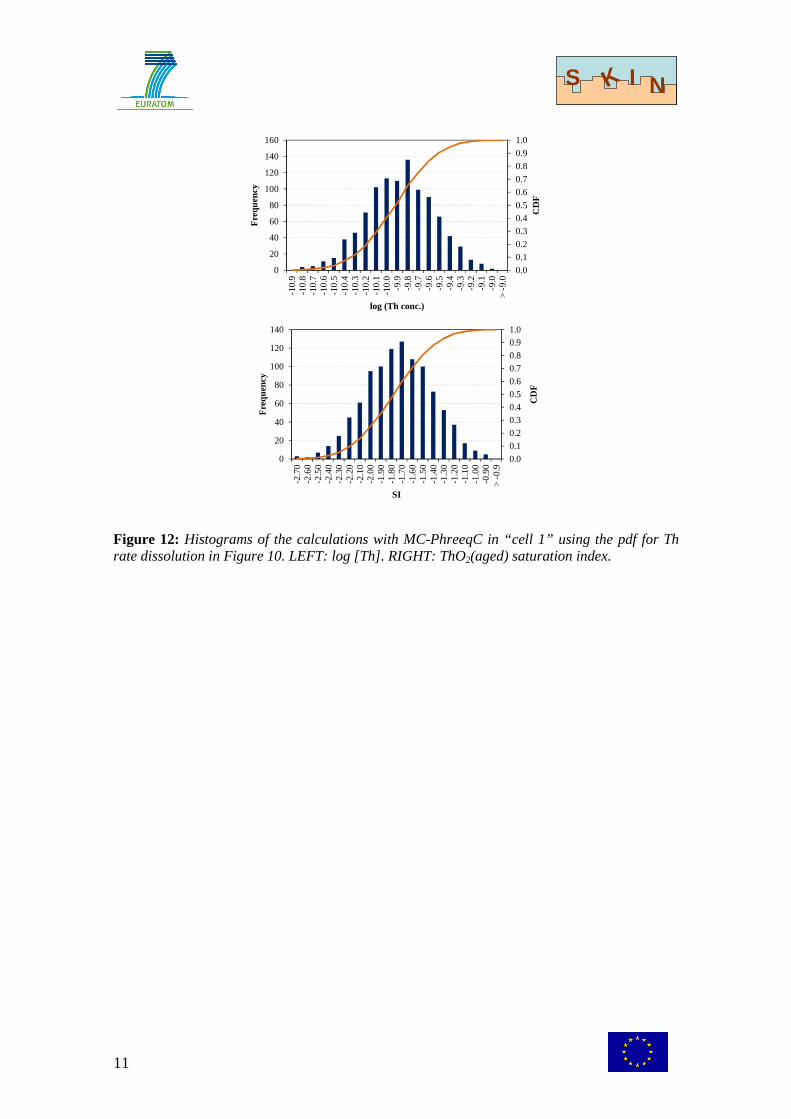
Results obtained in calculations for “cell 1” are shown in Figure 11 and Figure 12. The graphs indicate that thorium hydroxide does not precipitate under the studied conditions, as saturation index is <0 in all simulations.
Figure 11: Results of the calculations with MC-PhreeqC in “cell 1”. The graph shows the relationship between the logarithm of the dissolution rate and the calculated log [Th] in the cell.
0.00.10.20.30.40.50.60.70.80.91.0
0
20
40
60
80
100
120
140
160
-26.
5-2
6.3
-26.
0-2
5.8
-25.
6-2
5.3
-25.
1-2
4.9
-24.
6-2
4.4
-24.
2-2
3.9
-23.
7-2
3.5
-23.
3-2
3.0
-22.
8-2
2.6
-22.
3>
-22.
3
CD
F
Fre
quen
cy
ln (Th dissolution rate ) (y-1)
1.E-11
1.E-10
1.E-09
-12.0 -11.5 -11.0 -10.5 -10.0 -9.5
log
(Th
conc
. cel
l 1)
(M)
log (Th diss. rate)
11
S K I NS K I N
Figure 12: Histograms of the calculations with MC-PhreeqC in “cell 1” using the pdf for Th rate dissolution in Figure 10. LEFT: log [Th]. RIGHT: ThO2(aged) saturation index.
0.0
0.10.2
0.30.40.5
0.60.7
0.80.9
1.0
0
20
40
60
80
100
120
140
160
-10.
9-1
0.8
-10.
7-1
0.6
-10.
5-1
0.4
-10.
3-1
0.2
-10.
1-1
0.0
-9.9
-9.8
-9.7
-9.6
-9.5
-9.4
-9.3
-9.2
-9.1
-9.0
> -
9.0
CD
F
Fre
quen
cy
log (Th conc.)
0.0
0.1
0.2
0.3
0.4
0.5
0.6
0.7
0.8
0.9
1.0
0
20
40
60
80
100
120
140
-2.7
0-2
.60
-2.5
0-2
.40
-2.3
0-2
.20
-2.1
0-2
.00
-1.9
0-1
.80
-1.7
0-1
.60
-1.5
0-1
.40
-1.3
0-1
.20
-1.1
0-1
.00
-0.9
0>
-0.
9
CD
F
Fre
quen
cy
SI

12
S K I NS K I N
5. Conclusions and further work The main conclusions of this work are summarized below:
- MC-PhreeqC has proven to be useful to assess the impact of uncertainty in the results.
- Under the simplified calculation hypothesis, the concentration of Th is given mostly by the balance between dissolution rate and flow rate
During the third year of the SKIN project it is foreseen to improve the calculations with MC-PhreeqC in terms of:
- Proper definition of PDF for log Kº (currently all log Kº values are given the same weight in the calculations)
- Calculation of the system by assuming the bentonite compartment where thorium is only transported by diffusion (it is expected the precipitation of ThO2)
- Calculation of the system defining a PDF for log Kº, dissolution rate and flow rate at the same time
- Calculation with more radionuclides In addition, the Performance Assessment compartmental model (Reference Case) will be calculated with data generated along the SKIN project. Finally, the assessment of the impact of SKIN on PA calculation will be done based on the conclusions obtained from both calculation with AMBER and MC-PhreeqC.

13
S K I NS K I N
6. References Amphos (2011) MC-Phreeqc A tool for PHREEQC Monte-Carlo simulations. Amphos 21. http://www.Amphos21.com/software
Amphos and Armines (2012) Literature Review and First Year Synthesis and preliminary report on consequences of solubility uncertainties. SKIN deliverable D5.1 and D5.2.
Baes, C.F., Meyer, N.J., Roberts, C.E. (1965) The Hydrolysis of Thorium(IV) at 0 and 95°. Inorg. Chem., 4, 518-527
Bundschuh, T., Knopp, R., Müller, R., Kim, J.I., Neck, V., Fanghänel, Th. (2000) Application of LIBD to the determination of the solubility product of thorium (IV)-colloids. Radiochim. Acta, 88, 625-629
Duro, L., Grivé, M., Giffaut, E. (2012) ThermoChimie, the ANDRA Thermodynamic Database. Scientific Basis for Nuclear Waste Management XXXV, MRS Proceedings Volume 1475
Duro, L., Grivé, M., Cera, E., Gaona, X., Domènech, C., Bruno, J. (2006) Determination and assessment of the concentration limits to be used in SR-Can. SKB Technical Report, TR-06-32
Felmy, A.R., Rai, D., Mason, M.J. (1991) The solubility of hydrous thorium(IV) oxide in chloride media : development of an aqueous ion-interaction model. Radiochim. Acta, 55, 177-185
Grivé, M., Domènech, C., Montoya, V., García, D., Duro, L. (2010) Determination and assessment of the concentration limits to be used in SR-Can. Supplement to TR-06-32. SKB Report, R-10-50
Moon, H.C. (1989) Equilibrium ultrafiltration of hydrolized thorium (IV) solutions. Bull. Korean Chem. Soc., 10, 270-272
Nabivanets, B., Kudritskaya, L.N. (1964) Hydrocomplexes of thorium(IV). Ukr. Khim. Zh., 30, 891-895
Neck, V., Kim, J.I. (2001) Solubility and hydrolysis of tetravalent actinides. Radiochim. Acta, 9, 1-16
Neck, V., Müller, R., Bouby, M., Altmaier, M., Rothe, J., Denecke, M.A., Kim, J.I. (2002) Solubility of amorphous Th(IV) hydroxide - application of LIBD to determine the solubility product and EXAFS for aqueous speciation. Radiochim. Acta, 90, 485-494
Östhols, E., Bruno, J., Grenthe, I. (1994) On the influence of carbonate on mineral dissolution: III. The solubility of microcrystalline ThO2 in CO2-H2O media. Geochim. Cosmochim. Acta, 58, 613-623
Parkhurst, D.L., Appelo, C.A.J. (1999) User's Guide to PHREEQC (Version 2)-A Computer Program for Speciation, Batch-Reaction, One-Dimensional Transport, and Inverse Geochemical Calculations. U.S. Geological Survey Water-Resources Investigations Report 99-4259.
14
S K I NS K I N
Quintessa Limited (2011) AMBER 5.5 Reference Guide. QE-AMBER-1, Version 5.5
Rai, D., Felmy, A.R., Sterner, S.M., Moore, D.A., Mason, M.J., Novak, C.F. (1997) The solubility of Th(IV) and U(IV) hydrous oxides in concentrated NaCl anf MgCl2 solutions. Radiochim. Acta, 79, 239-247
Rai, D., Moorw, D.A., Oakes, C.S., Yui, M. (2000) Thermodynamic model for the solubility of thorium dioxide in the Na+-Cl--OH--H2O system at 23°C and 90°C. Radiochim. Acta, 88, 297-306
Rand, M., Fuger, J., Grenthe, I., Neck, V., Rai, D. (2009) Chemical thermodynamics of thorium. In: Chemical Thermodynamics. Vol. 11 (Mompean, F. J., Perrone, J., Illemassène,M., eds.) Elsevier, North-Holland, Amsterdam.
Rothe, J., Denecke, M.A., Neck, V., Müller, R., Kim, J.I. (2002) XAFS investigation of the structure of aqueous Thorium(IV) species, colloids, and solid Thorium(IV) oxide/hydroxide. Inorg. Chem., 41, 249-258
Ryan, J.L., Rai, D. (1987) Thorium(IV) hydrous oxide solubility. Inorg. Chem., 26, 4140-4142
Sena, C., Salas, J., Arcos, D. (2010) Aspects of geochemical evolution of the SKB near field in the frame of SR-Site. SKB Technical Report, TR-10-59
SKB (2010) Data report for the safety assessment SR-Site. SKB Technical Report, TR-10-52