d Original Contribution
14
d Original Contribution ENDOVASCULAR SHEAR STRAIN ELASTOGRAPHY FOR THE DETECTION AND CHARACTERIZATION OF THE SEVERITY OFATHEROSCLEROTIC PLAQUES: IN VITRO VALIDATION AND IN VIVO EVALUATION YOUNES MAJDOULINE,* J ACQUES OHAYON, yz ZAHRA KESHAVARZ-MOTAMED,* MARIE-H EL ENE ROY CARDINAL,* DAMIEN GARCIA,* xk LOUISE ALLARD,* SOPHIE LEROUGE, {# FR ED ERIC ARSENAULT , k ** GILLES SOULEZ, k ** and GUY CLOUTIER* k * Laboratory of Biorheology and Medical Ultrasonics, University of Montreal Hospital Research Center (CRCHUM), Montr eal, Qu ebec, Canada; y Laboratory TIMC-IMAG/DyCTiM, University Joseph-Fourier, CNRS UMR 5525, Grenoble, France; z University of Savoie, Polytech Annecy-Chambery, Le Bourget du Lac, France; x Research Unit of Biomechanics and Imaging in Cardiology, University of Montreal Hospital Research Center (CRCHUM), Montr eal, Qu ebec, Canada; k Department of Radiology, Radio-Oncology and Nuclear Medicine, and Institute of Biomedical Engineering, University of Montreal, Montr eal, Qu ebec, Canada; { Laboratory of Endovascular Biomaterials, University of Montreal Hospital Research Center (CRCHUM), Montr eal, Qu ebec, Canada; # Department of Mechanical Engineering, Ecole de technologie sup erieure, Montr eal, Qu ebec, Canada; and **Department of Radiology, University of Montreal Hospital (CHUM), Montr eal, Qu ebec, Canada (Received 5 July 2013; revised 4 December 2013; in final form 6 December 2013) Abstract—This work explores the potential of shear strain elastograms to identify vulnerable atherosclerotic pla- ques. The Lagrangian speckle model estimator (LSME) elasticity imaging method was further developed to esti- mate shear strain elasticity (SSE). Three polyvinyl alcohol cryogel vessel phantoms were imaged with an intravascular ultrasound (IVUS) scanner. The estimated SSE maps were validated against finite-element results. Atherosclerosis was induced in carotid arteries of eight Sinclair mini-pigs using a combination of surgical tech- niques, diabetes and a high-fat diet. IVUS images were acquired in vivo in 14 plaques before euthanasia and his- tology. All plaques were characterized by high magnitudes in SSE maps that correlated with American Heart Association atherosclerosis stage classifications (r 5 0.97, p , 0.001): the worse the plaque condition the higher was the absolute value of SSE, i.e. jSSEj (e.g., mean jSSEj was 3.70 ± 0.40% in Type V plaques, whereas it was reduced to 0.11 ± 0.01% in normal walls). This study indicates the feasibility of using SSE to highlight atheroscle- rotic plaque vulnerability characteristics. (E-mail: [email protected]) Ó 2014 World Federation for Ultrasound in Medicine & Biology. Key Words: Vascular elastography, Vulnerable plaques, Shear strain, Atherosclerotic plaque image processing, Swine model, Intravascular ultrasound. INTRODUCTION The rupture of a vulnerable atherosclerotic plaque in cor- onary arteries is recognized as a major cause of acute cor- onary syndrome (Ambrose et al. 1998; Fuster et al. 2005). Histologic studies have found that vulnerable plaques (i.e., those liable to rupture with thromboembolic complications) are typically characterized by a large extracellular necrotic core, a high inflammatory cell burden and a thin fibrous cap infiltrated by macrophages (Vengrenyuk et al. 2006; Virmani et al. 2006). The histopathology of symptomatic carotid plaques was observed to be equivalent to that of culprit coronary plaques (Redgrave et al. 2006). Morphologic indicators of vulnerable plaques can be imaged by intravascular ultrasound (IVUS) (Carlier and Tanaka 2006; Rioufol et al. 2002), optical coherence tomography (Jang et al. 2002; Tearney et al. 2008), computed tomography (Fayad et al. 2002) and magnetic resonance imaging (Briley-Saebo et al. 2007). However, because morphologic features are insufficient predictors of risk (Loree et al. 1992; Ohayon et al. 2008), prospective prediction of plaque rupture is still imprecise. The identification of plaque mechanical and composi- tional properties is a promising alternative to morphologic Address correspondence to: Guy Cloutier, Laboratory of Bio- rheology and Medical Ultrasonics, University of Montreal Hospital Research Center (CRCHUM), Tour Viger (Room R11-464), 900 rue Saint-Denis, Montr eal, QC, Canada H2X 0A9. E-mail: guy.cloutier@ umontreal.ca 890 Ultrasound in Med. & Biol., Vol. 40, No. 5, pp. 890–903, 2014 Copyright Ó 2014 World Federation for Ultrasound in Medicine & Biology Printed in the USA. All rights reserved 0301-5629/$ - see front matter http://dx.doi.org/10.1016/j.ultrasmedbio.2013.12.008
Transcript of d Original Contribution

Ultrasound in Med. & Biol., Vol. 40, No. 5, pp. 890–903, 2014Copyright � 2014 World Federation for Ultrasound in Medicine & Biology
Printed in the USA. All rights reserved0301-5629/$ - see front matter
/j.ultrasmedbio.2013.12.008
http://dx.doi.org/10.1016d Original Contribution
ENDOVASCULAR SHEAR STRAIN ELASTOGRAPHY FOR THE DETECTION ANDCHARACTERIZATION OF THE SEVERITY OFATHEROSCLEROTIC PLAQUES:
IN VITRO VALIDATION AND IN VIVO EVALUATION
YOUNES MAJDOULINE,* JACQUES OHAYON,yz ZAHRA KESHAVARZ-MOTAMED,*MARIE-H�EL�ENE ROY CARDINAL,* DAMIEN GARCIA,*xk LOUISE ALLARD,* SOPHIE LEROUGE,{#
FR�ED�ERIC ARSENAULT,k** GILLES SOULEZ,k** and GUY CLOUTIER*k
*Laboratory of Biorheology andMedical Ultrasonics, University of Montreal Hospital Research Center (CRCHUM), Montr�eal,Qu�ebec, Canada; yLaboratory TIMC-IMAG/DyCTiM, University Joseph-Fourier, CNRS UMR 5525, Grenoble, France;
zUniversity of Savoie, Polytech Annecy-Chambery, Le Bourget du Lac, France; xResearch Unit of Biomechanics and Imaging inCardiology, University of Montreal Hospital Research Center (CRCHUM), Montr�eal, Qu�ebec, Canada; kDepartment of
Radiology, Radio-Oncology and Nuclear Medicine, and Institute of Biomedical Engineering, University of Montreal, Montr�eal,Qu�ebec, Canada; {Laboratory of Endovascular Biomaterials, University of Montreal Hospital Research Center (CRCHUM),Montr�eal, Qu�ebec, Canada; #Department of Mechanical Engineering, �Ecole de technologie sup�erieure, Montr�eal, Qu�ebec,
Canada; and **Department of Radiology, University of Montreal Hospital (CHUM), Montr�eal, Qu�ebec, Canada
(Received 5 July 2013; revised 4 December 2013; in final form 6 December 2013)
ArheologResearSaint-Dumontr
Abstract—This work explores the potential of shear strain elastograms to identify vulnerable atherosclerotic pla-ques. The Lagrangian speckle model estimator (LSME) elasticity imaging method was further developed to esti-mate shear strain elasticity (SSE). Three polyvinyl alcohol cryogel vessel phantoms were imaged with anintravascular ultrasound (IVUS) scanner. The estimated SSE maps were validated against finite-element results.Atherosclerosis was induced in carotid arteries of eight Sinclair mini-pigs using a combination of surgical tech-niques, diabetes and a high-fat diet. IVUS images were acquired in vivo in 14 plaques before euthanasia and his-tology. All plaques were characterized by high magnitudes in SSE maps that correlated with American HeartAssociation atherosclerosis stage classifications (r 5 0.97, p , 0.001): the worse the plaque condition the higherwas the absolute value of SSE, i.e. jSSEj (e.g., mean jSSEj was 3.70 ± 0.40% in Type V plaques, whereas it wasreduced to 0.11 ± 0.01% in normal walls). This study indicates the feasibility of using SSE to highlight atheroscle-rotic plaque vulnerability characteristics. (E-mail: [email protected]) � 2014 World Federation forUltrasound in Medicine & Biology.
Key Words: Vascular elastography, Vulnerable plaques, Shear strain, Atherosclerotic plaque image processing,Swine model, Intravascular ultrasound.
INTRODUCTION
The rupture of a vulnerable atherosclerotic plaque in cor-onary arteries is recognized as a major cause of acute cor-onary syndrome (Ambrose et al. 1998; Fuster et al. 2005).Histologic studies have found that vulnerable plaques(i.e., those liable to rupture with thromboemboliccomplications) are typically characterized by a largeextracellular necrotic core, a high inflammatory cellburden and a thin fibrous cap infiltrated by macrophages
ddress correspondence to: Guy Cloutier, Laboratory of Bio-y and Medical Ultrasonics, University of Montreal Hospitalch Center (CRCHUM), Tour Viger (Room R11-464), 900 rueenis, Montr�eal, QC, Canada H2X 0A9. E-mail: [email protected]
890
(Vengrenyuk et al. 2006; Virmani et al. 2006). Thehistopathology of symptomatic carotid plaques wasobserved to be equivalent to that of culprit coronaryplaques (Redgrave et al. 2006).
Morphologic indicators of vulnerable plaques can beimaged by intravascular ultrasound (IVUS) (Carlier andTanaka 2006; Rioufol et al. 2002), optical coherencetomography (Jang et al. 2002; Tearney et al. 2008),computed tomography (Fayad et al. 2002) and magneticresonance imaging (Briley-Saebo et al. 2007). However,because morphologic features are insufficient predictorsof risk (Loree et al. 1992; Ohayon et al. 2008),prospective prediction of plaque rupture is still imprecise.
The identification of plaquemechanical and composi-tional properties is a promising alternative to morphologic

SSE for atherosclerotic plaque detection d Y. MAJDOULINE et al. 891
predictors (Finet et al. 2004). In this context, severalIVUS-based technologies were developed for the evalua-tion of vessel lesion characteristics and for therapy plan-ning, namely, endovascular elastography (EVE) (deKorte et al. 2000, 2002), palpography (C�espedes et al.2000; Schaar et al. 2006) and virtual histology (VH)(Nair et al. 2002, 2007), the latter two methodsreceiving significant attention. Initial clinical reports onpalpography and VH revealed promising study endpointachievements (Van Mieghem et al. 2006; Serruys et al.2008). However, these technologies later becamecontroversial with reported high variability (Brugalettaet al. 2012; Frutkin et al. 2007; Murray et al. 2013). Ata median follow-up of 3.4 y, palpography for patientswith coronary syndromes did not identify fibroatheromasat high risk of rupture or major adverse cardiac events(Brugaletta et al. 2012). VH also failed to properly quan-tify the necrotic core area, can yield artifact in the pres-ence of calcium and is unable to differentiate athrombus from a fibrotic or fibrofatty plaque (Maeharaet al. 2012; Thim et al. 2010). Combining palpographywith VH did not provide any additional informationwith respect to the identification of fibroatheromas athigher risk of rupture (Brugaletta et al. 2012). Rare tech-nologies aimed at identifying plaque components accord-ing to their elasticity modulus (i.e., IVUS modulography)are being developed (Baldewsing et al. 2008; Le Floc’het al. 2009; Richards and Doyley 2011). The lattertechnologies still need to be clinically validated.Alternatively for superficial arteries, acoustic radiationforce impulse imaging has been proposed, but it alsoremains to be clinically validated (Allen et al. 2011).
Differences in the stiffness of plaque componentsmay change structural shear stresses (Vito et al. 1990)and, thus, shear strains. Shear failure may also arise atthe interface of tissue components with different stiffness(Dickson and Gotlieb 2003; Falk et al. 1995). There isthus increasing evidence supporting the hypothesis thatelevated shear strain initiates and/or stimulates thedevelopment of a plaque into a plaque liable to rupture(Cinthio et al. 2006; Idzenga et al. 2009, 2012). Theshear strain induced in the adventitial layer by theaxial movement of the artery may promote theneovascularization of the vasa vasorum, which, in turn,may accelerate plaque progression through intraplaqueinflammation and bleeding (Idzenga et al. 2009). Simi-larly, Lawrence-Brown et al. (2011) hypothesized thatshear stresses cause repeated intramural microhemorrh-ages followed by a healing process leading to plaquedevelopment and progression. Identifying shear strainwithin the arterial wall not only has the potential toimprove our knowledge of the properties of the arterialwall in vascular diseases, but also can improve our abilityto detect early abnormalities in arterial wall function.
In the context of EVE imaging over a cross sectionof an artery, early advances relied on intraplaque radial(de Korte et al. 1998; Wan et al. 2001) andcircumferential (Liang et al. 2008; Maurice et al. 2008)strain estimates. For a cross-sectional IVUS image, theradial strain corresponds to the deformation along theultrasound (US) beam, whereas the circumferential strainis orthogonal to it. Shear strain elasticity (SSE) was firstreported in vivo in three patients with coronary athero-sclerotic plaques (Maurice et al. 2007), but according tothe new implementation proposed in this study, those re-sults could include artifacts. Indeed, in IVUS imaging, ifthe transducer is not centered in the artery lumen, USbeams are not in the direction of the applied pressure.Therefore, calculated strains along the US beam are notpurely radial strains. Few studies have quantified the in-fluence of catheter position on IVUS elastograms(Baldewsing et al. 2004; de Korte et al. 1999; Perreyet al. 2001). De Korte et al. (1999) suggested theoreticalfunctions to correct radial strains for catheter eccentricityor tilt. Their derivation can be applied to non-circularvessel walls as well. Shi et al. (2003, 2005) laterderived a more general form of correction for radialstrains that included both eccentricity and tilt effects atthe same time, but the formulation applies only tocylindrical vessels. To deal with tilt, both of theseworks relied on prior knowledge of the tilt angle.
The objectives of this study, therefore, were: (i) tofurther develop EVE based on the Lagrangian specklemodel estimator (LSME, which allows estimation of thefull 2-D strain tensor) (Maurice et al. 2004) to correctlyestimate SSE, and (ii) to present a compensation schemebased on polar coordinate transformations to correct the2-D strain tensor (i.e., radial strain, circumferential strainand shear strain) for catheter eccentricity. This schemehandles the general geometric shape (not necessarily cir-cular) of the vessels. Because of practicality concerns for2-D IVUS, this work does not deal with estimating the tiltangle and correcting the strains in that regard.
METHODS
Experimental in vitro study with polyvinyl alcoholcryogel vessel phantoms
Polyvinyl alcohol cryogel (PVA-C) tissue-mimick-ing material was used to build vascular phantoms. Theprotocol followed the methodology described elsewhere(Le Floc’h et al. 2010; Maurice et al. 2005). Thestiffness of PVA-C increases with the number of freeze-thaw cycles. A temperature-controlled chamber wasused to induce solidification and polymerization ofPVA-C samples made with a solution of 10% polyvinylalcohol in pure water. Samples were obtained by one tosix 24-h freezing-thawing cycles, with temperatures and

Fig. 1. (a) Sections of two polyvinyl alcohol cryogel (PVA-C) phantoms. (b) Corresponding B-mode intravascular ultra-sound (IVUS) images. (c) Diagram of the experimental setup comprising a water tank, the PVA-C phantom, a water col-
umn system to pressurize the phantom and the ultrasound acquisition system.
892 Ultrasound in Medicine and Biology Volume 40, Number 5, 2014
rates of change of620 �C and60.2 �C/min, respectively.Three cylindrical vessel phantoms were made (Fig. 1):one homogeneous, one with a soft inclusion and anotherwith two soft inclusions. The homogeneous vesselphantom underwent one freeze-thaw cycle. The two-composite vessel phantoms experienced six freeze-thawcycles. Before the last cycle, inclusions mimicking softnecrotic cores were filled with PVA-C undergoing onlyone freeze-thaw cycle. Simultaneously, similar PVA-Chomogeneous cylindrical samples were prepared formechanical testing using an Eplexor rheometer (Gabo,Ahlden, Germany, load cell of 25 N, sensor sensitivityof 1024 at full range). Young’s moduli of the stiff (sixfreeze-thaw cycles) and soft (one freeze-thaw cycle)PVA-C samples were 145.4 6 31.8 and 17.6 6 3.4 kPa,respectively.
A circuit was used to apply quasi-static pressureswithin arterial phantoms with a water column, as illus-trated in Figure 1. During experiments, the water temper-ature was maintained at 25 6 1 �C. An IVUS scanner(In-Vision Gold, Volcano Therapeutics, Rancho Cordova,CA, USA) equipped with a solid-state 20-MHz catheter(Avanar F/X, Volcano Therapeutics) was used to acquireradiofrequency (RF) signals digitized at 100MHzwith anexternal data acquisition system (Remora model, VolcanoTherapeutics). Cross-sectional RF images were acquiredfrom each phantom at 10 successive pressure steps of0.5 kPa (i.e., 50 mm of water height) covering the pres-sure range 0 to 5 kPa.
Finite-element simulationsPressurization of vessel phantoms was simulated by
static finite-element analysis using COMSOL Multiphy-sics software (Structural Mechanics Module, Version
3.5, COMSOL, Grenoble, France). Plaque geometrieswere meshed with approximately 1500 six-node trian-gular elements. Finite-element models were solved underthe assumption of plane strains. For each vessel phantom,10 successive pressure steps were imposed, correspondingto pressure increases from 0 to 5 kPa. A free boundarycondition was assumed on the external contour of the ar-teries, and pressure was applied on the lumen boundary.The stiff (mimicking fibrosis) and soft (mimicking lipid)PVA-C phantom components were modeled as isotropicand quasi-incompressible (Poisson’s ratio 5 0.49), withYoung’s moduli Efibrosis 5 145 kPa and Elipid 5 17 kPa,as experimentally determined (Le Floc’h et al. 2010).
Animal experimentsA complete description of animal preparation and
measurements can be found in Soulez et al. (2012);only a brief summary is provided here. Protocols foranimal experiments were approved by the animal carecommittee of the Centre Hospitalier de l’Universit�e deMontreal. Eight Sinclair male mini-pigs (SinclairResearch Center, Auxvasse, MO, USA) with a meanage of 211 6 36 d and mean weight of 35 6 8 kg at thebeginning of the protocol were included in this study.Common carotid arteries were partially ligated with a1.3-mm spacer on the external surface of the vessel,4 cm below the carotid bifurcation (Ishii et al. 2006).Removing the spacer before closing the incision resultedin 70%–80% stenosis. The carotid on each side of theneck was randomly ligated with a permanent or anabsorbable suture, the latter promoting inflammation.One week after surgery, a 4-F Glidecath catheter (Ter-umo, Tokyo, Japan) was inserted through a femoralapproach to induce diabetes by selective injection of
Fig. 2. Schematic of the image acquisition protocol. (a) Different sections with respect to the position of the partial liga-tion of common carotid arteries. (b) B-mode intravascular ultrasound (IVUS) images reconstructed from radiofrequency
(RF) data. (c) Histology sections.
SSE for atherosclerotic plaque detection d Y. MAJDOULINE et al. 893
streptozotocin into splenic and gastroduodenal arteries(120 mg/kg). One week after diabetes induction, a high-fat, high-cholesterol diet (TD.96366 Swine High FatDiet, Harlan Teklad, Madison, WI, USA) was started toinduce hypercholesterolemia, and lasted 20 wk, at whichpoint animals were euthanized.
Angiography of both carotid arteries was per-formed through a femoral approach with a 4-F Glide-cath catheter (Terumo) before euthanasia, to grade theseverity of stenoses in diameter reduction. Mild to se-vere carotid stenoses were observed (stenosis sever-ity 5 80.4 6 12.4% with permanent sutures and48.8 6 39.0% with absorbable sutures). Permanent su-tures resulted in more advanced atherosclerotic lesions(Soulez et al. 2012). Under fluoroscopy guidance,IVUS pullback scans were done on both carotid arteriesusing an automatic positioning system set at 0.5 mm/s.IVUS B-mode images were acquired with a 3.5-F 20-MHz probe (Avanar F/X, Volcano Therapeutics) at aframe rate of 30/s. Then, atherosclerotic plaques of in-terest were imaged again with static positioning of theIVUS catheter along the artery to acquire RF data ofthe pulsating vessel. The exact position of the IVUS
catheter tip was identified under fluoroscopy and thedistance from the carotid bifurcation was noted. As re-ported earlier (Soulez et al. 2012), we observed athero-sclerotic lesions upstream and downstream of theligation site (see Fig. 2 for a schematic of the imageacquisition protocol).
Histologic analysesTo prepare carotid arteries for sectioning, they were
perfused with saline for 5 min followed by 10% bufferedformalin at 150 mm Hg for 1 h. For every 5 mm of spec-imens, sections 6 mm thick were made. Additional serialsections were collected when a plaque was detected.Three stains were employed: (i) Hematoxylin phloxinesaffron stain was used to differentiate collagen (yellow),nuclei (blue) and muscle or cytoplasm (pink). (ii) Movatstain was chosen to differentiate elastic fibers (black),collagen (yellow-green), nuclei (dark blue), cytoplasm(pink-brown) and calcium (brown). (iii) If Movat stainingsuggested the presence of calcium, a more quantitativevon Kossa stain was employed to highlight calcium nod-ules in black. Picrosirius red stain was also used forcollagen and lipid analyses. A pathologist blinded to
Table 1. American Heart Association classification ofatherosclerotic lesions
Lesion type Description
I Initial lesion with foam cells (intimal xanthomaor fatty streak)
II Fatty streak with multiple foam cell layersIII Pre-atheroma with extracellular lipid poolsIV Atheroma with a confluent extracellular lipid coreV Fibro-atheromaVI Complex plaque with possible surface defect or
hemorrhage or thrombus or some combinationVII Calcified plaqueVIII Fibrotic plaque without lipid core
894 Ultrasound in Medicine and Biology Volume 40, Number 5, 2014
the location or type of suture classified plaques accordingto the American Heart Association (AHA) atheroscle-rosis stage classification (Table 1), which summarizesthe natural history of atherosclerosis (Soulez et al.2012; Stary 2000). An in-house semi-automatic segmen-tation method developed in MATLAB (Version 6.5. TheMathWorks, Natick, MA, USA) and adapted to ImageJsoftware (National Institutes of Health open source, Be-thesda, MD, USA) was used for histomorphometricanalyses.
Registration between radiofrequency data and histologyAs mentioned above, IVUS scanning of the left and
right carotid vessels was performed under angiographyguidance to identify sites with stenoses. IVUS scanningwas started at the bifurcation junction and then repeatedeight times at spatial steps of 1 cm below the junctionalong the vessel. The specific scan in which the plaqueappeared was used for further analysis. The histologyslice used for validation was the slice at the same locationof the scan. Because the initial (on removal from thebody) and final (before slicing) lengths of the vesselwere known, tissue shrinkage was calculated to locatethe correct position of the slice. Registration betweenRF data and histology was done using the location ofthe plaque identified by a radiologist before performingelastographic calculations.
Plaque strain reconstruction
Image segmentation. IVUS reconstructed B-modeimages (from acquired RF data with Hilbert transforma-tion and logarithm compression) were segmented todetect the lumen boundary using a fast-marching modelcombining region and contour information (RoyCardinal et al. 2006). The outer contour was computedby shifting the detected lumen boundary outwardly by adistance of 1 mm radially. Resulting contours were vali-dated by a radiologist (G.S.) before further processing.Remaining analyses were done on a region of interest
(ROI) that included the artery wall, as defined by thearea between the lumen boundary and the outer contour.The ROI included some portion or the entire plaque area,as well as normal regions of the vessel wall.
LSME elastography algorithm. The LSME methodwas described in detail elsewhere (Maurice et al. 2004).We provide a succinct description herein that will helpin understanding the new implementation described inAppendix A.
In the context of EVE, we aimed to find componentsof the strain tensor within the artery wall. Consequently,displacements at any locations, as well as their spatial de-rivatives, are required. For this purpose, the LSME wasadapted to process RF IVUS data in the polar coordinatesystem.
Radiofrequency images were first registered tocompensate for rigid motion caused by catheter move-ment artifacts. For this purpose, overlapping measure-ment windows (MWs) within ROIs of two consecutivetemporal images were analyzed. For each MW, 2-D cor-relation coefficients between images were calculated, andthe motion of the catheter was determined as the shifts ofthe maximum correlation point.
The second temporal image was then compensatedfor this translation artifact. At each point within a MW,the optical flow equation in polar coordinates wasexpanded around the center of the MW (M0), usingTaylor series, making an over-determined system ofequations in terms of the optical flow components andtheir partial spatial derivatives. The least-squares solu-tion of this system of equations was obtained. The 2-Ddisplacement gradient matrix (D) in polar coordinatecan be defined as
D5
�Drr Drq
Dqr Dqq
�5
"vUr
vr1r
�vUr
vq2Uq
�vUq
vr1r
�vUq
vq1Ur
�#
(1)
Components of the strain tensor in polar coordinatesεij 5 ½(Dij 1 Dji) can be calculated as
ε5
�εrr εrq
εqr εqq
�5
"Drr
12ðDrq1DqrÞ
12ðDrq1DqrÞ Dqq
#(2)
Here, D, ε and U are the displacement gradient tensor,strain tensor and displacement vector, respectively. Inthis work, because of the known variability in estimatinglateral strains with US elastography methods, only onecomponent of the shear strain ðDrqÞ was investigatedand validated against experimental data. More detailsabout calculating displacement gradient tensors basedon the above description are reported in Appendix A.
In this study, sizes of 2-D MWs were 120 lines and30 sample points (0.924 mm 3 0.48 radian), with 90%

Fig. 3. Performance of the Lagrangian speckle model estimator (LSME) in quantifying shear strain elasticity (SSE) usingexperimental intravascular ultrasound (IVUS) images acquired on three polyvinyl alcohol cryogel (PVA-C) phantoms.First column: Sections of three PVA-C vascular phantoms. Second column: Segmented B-mode IVUS imagesreconstructed from radiofrequency data. Third column: Reference SSEmap simulated by finite-element modeling. Fourthcolumn: Estimated SSE map obtained with the LSME. The red circle on each SSE panel indicates a region of quantitative
comparisons (see Fig. 4).
SSE for atherosclerotic plaque detection d Y. MAJDOULINE et al. 895
radial and circumferential overlaps. Each SSE map wascalculated based on a pair of consecutive RF data (phan-tom: 512 lines and 1120 sample points; mini-pig: 512lines and 800 sample points). For phantom experiments,the reported SSE maps were arbitrarily chosen at a givenpressure from 0 to 5 kPa, whereas for the pig study, SSEmaps were obtained during diastole. SSE maps weresmoothed using a 5 3 5 median filter padded with sym-metric expansion at the boundaries. For display purposes,in vivo SSE maps were zoomed in so they had differentdimension scales compared with their respecting IVUSimages (see the caption of Fig. 5).
Compensation for the eccentricity of thecatheter. One issue limiting the performance of IVUSelastography is the eccentricity of the catheter withinthe vessel lumen, caused by pulsatile flow and cardiacmotion, potentially leading to erroneous strain estimatesfrom geometric artifacts. Compensating for the eccentriccatheter position (Baldewsing et al. 2004; de Korte et al.1999; Perrey et al. 2001; Shi et al. 2003, 2005) is achallenging task in IVUS elastography. In this study, amethod was developed to estimate the eccentricity andto correct the strains in the polar coordinate system.Unlike previously suggested methods, our approach
does not assume sole radial motion as in Shapo et al.(1996) and corrects the complete strain tensor withoutany restricting assumptions on the vessel morphology.Details and complete equations of the method are re-ported in Appendix B.
Statistical analysesResults were expressed as means 6 standard devia-
tions (SD). Statistical analyses were performed usingSigmaStat software (Version 3.1, Systat Software, SanJose, CA, USA). Analyses of variance and Pearson corre-lations were performed to detect any significant relationbetween SSE and AHA classifications of atheroscleroticlesions. One-way analysis of variance was used tocompare SSE results for plaques with those for normalvessel walls.
RESULTS
Shear strains are amplified in the mimicked thin-capfibroatheroma
Figure 3 illustrates the performance of the newLSME implementation to estimate SSE and its reliabilityby comparing results with finite-element simulations. Allthree investigated cases are included in this figure: a
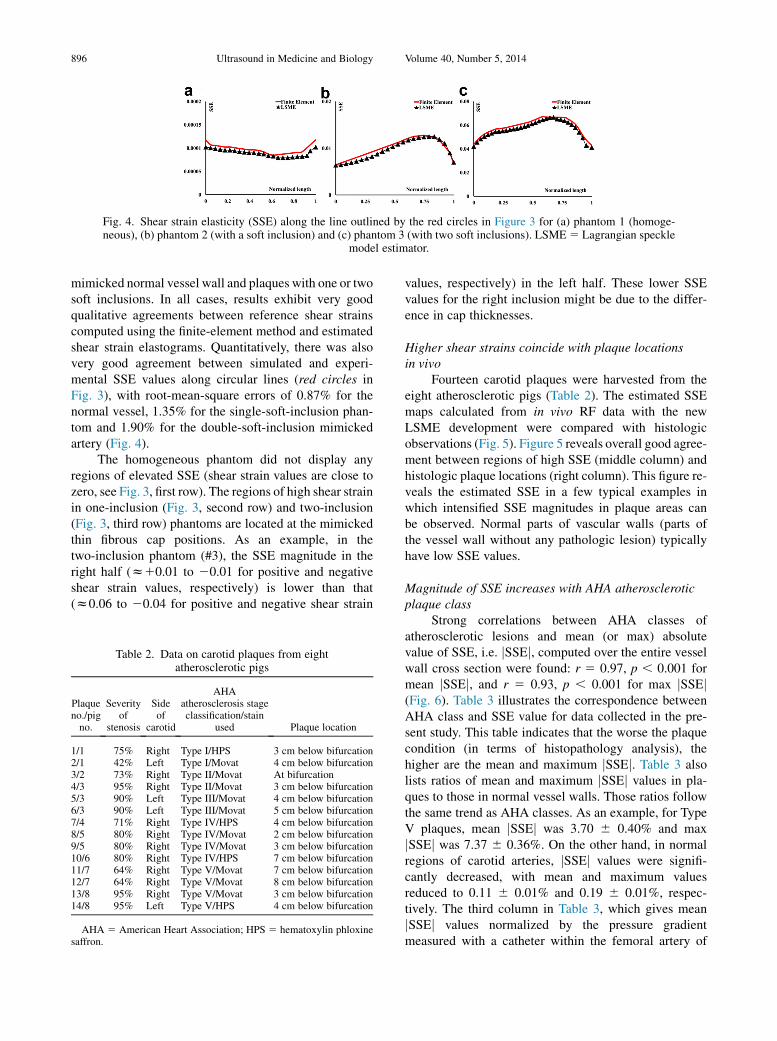
Fig. 4. Shear strain elasticity (SSE) along the line outlined by the red circles in Figure 3 for (a) phantom 1 (homoge-neous), (b) phantom 2 (with a soft inclusion) and (c) phantom 3 (with two soft inclusions). LSME5 Lagrangian speckle
model estimator.
896 Ultrasound in Medicine and Biology Volume 40, Number 5, 2014
mimicked normal vessel wall and plaques with one or twosoft inclusions. In all cases, results exhibit very goodqualitative agreements between reference shear strainscomputed using the finite-element method and estimatedshear strain elastograms. Quantitatively, there was alsovery good agreement between simulated and experi-mental SSE values along circular lines (red circles inFig. 3), with root-mean-square errors of 0.87% for thenormal vessel, 1.35% for the single-soft-inclusion phan-tom and 1.90% for the double-soft-inclusion mimickedartery (Fig. 4).
The homogeneous phantom did not display anyregions of elevated SSE (shear strain values are close tozero, see Fig. 3, first row). The regions of high shear strainin one-inclusion (Fig. 3, second row) and two-inclusion(Fig. 3, third row) phantoms are located at the mimickedthin fibrous cap positions. As an example, in thetwo-inclusion phantom (#3), the SSE magnitude in theright half (z10.01 to 20.01 for positive and negativeshear strain values, respectively) is lower than that(z0.06 to 20.04 for positive and negative shear strain
Table 2. Data on carotid plaques from eightatherosclerotic pigs
Plaqueno./pigno.
Severityof
stenosis
Sideof
carotid
AHAatherosclerosis stageclassification/stain
used Plaque location
1/1 75% Right Type I/HPS 3 cm below bifurcation2/1 42% Left Type I/Movat 4 cm below bifurcation3/2 73% Right Type II/Movat At bifurcation4/3 95% Right Type II/Movat 3 cm below bifurcation5/3 90% Left Type III/Movat 4 cm below bifurcation6/3 90% Left Type III/Movat 5 cm below bifurcation7/4 71% Right Type IV/HPS 4 cm below bifurcation8/5 80% Right Type IV/Movat 2 cm below bifurcation9/5 80% Right Type IV/Movat 3 cm below bifurcation10/6 80% Right Type IV/HPS 7 cm below bifurcation11/7 64% Right Type V/Movat 7 cm below bifurcation12/7 64% Right Type V/Movat 8 cm below bifurcation13/8 95% Right Type V/Movat 3 cm below bifurcation14/8 95% Left Type V/HPS 4 cm below bifurcation
AHA 5 American Heart Association; HPS 5 hematoxylin phloxinesaffron.
values, respectively) in the left half. These lower SSEvalues for the right inclusion might be due to the differ-ence in cap thicknesses.
Higher shear strains coincide with plaque locationsin vivo
Fourteen carotid plaques were harvested from theeight atherosclerotic pigs (Table 2). The estimated SSEmaps calculated from in vivo RF data with the newLSME development were compared with histologicobservations (Fig. 5). Figure 5 reveals overall good agree-ment between regions of high SSE (middle column) andhistologic plaque locations (right column). This figure re-veals the estimated SSE in a few typical examples inwhich intensified SSE magnitudes in plaque areas canbe observed. Normal parts of vascular walls (parts ofthe vessel wall without any pathologic lesion) typicallyhave low SSE values.
Magnitude of SSE increases with AHA atheroscleroticplaque class
Strong correlations between AHA classes ofatherosclerotic lesions and mean (or max) absolutevalue of SSE, i.e. jSSEj, computed over the entire vesselwall cross section were found: r 5 0.97, p , 0.001 formean jSSEj, and r 5 0.93, p , 0.001 for max jSSEj(Fig. 6). Table 3 illustrates the correspondence betweenAHA class and SSE value for data collected in the pre-sent study. This table indicates that the worse the plaquecondition (in terms of histopathology analysis), thehigher are the mean and maximum jSSEj. Table 3 alsolists ratios of mean and maximum jSSEj values in pla-ques to those in normal vessel walls. Those ratios followthe same trend as AHA classes. As an example, for TypeV plaques, mean jSSEj was 3.70 6 0.40% and maxjSSEj was 7.37 6 0.36%. On the other hand, in normalregions of carotid arteries, jSSEj values were signifi-cantly decreased, with mean and maximum valuesreduced to 0.11 6 0.01% and 0.19 6 0.01%, respec-tively. The third column in Table 3, which gives meanjSSEj values normalized by the pressure gradientmeasured with a catheter within the femoral artery of

Fig. 5. Left column: In vivo intravascular ultrasound images. Middle column: Estimated shear strain elasticity (SSE)maps. Right column: Histologic stained samples of excised lesions for which SSE was obtained. SSE maps(middle) were calculated with the RF data used to produce the B-mode image of the first column. For better visu-alization, the SSE map was zoomed with respect to its B-mode image (by 145%). Note that higher shear strainscoincide with plaque location. American Heart Association class: (a) Type I, (b) Type II, (c) Type III, (d) Type IV,
(e) Type V.
SSE for atherosclerotic plaque detection d Y. MAJDOULINE et al. 897
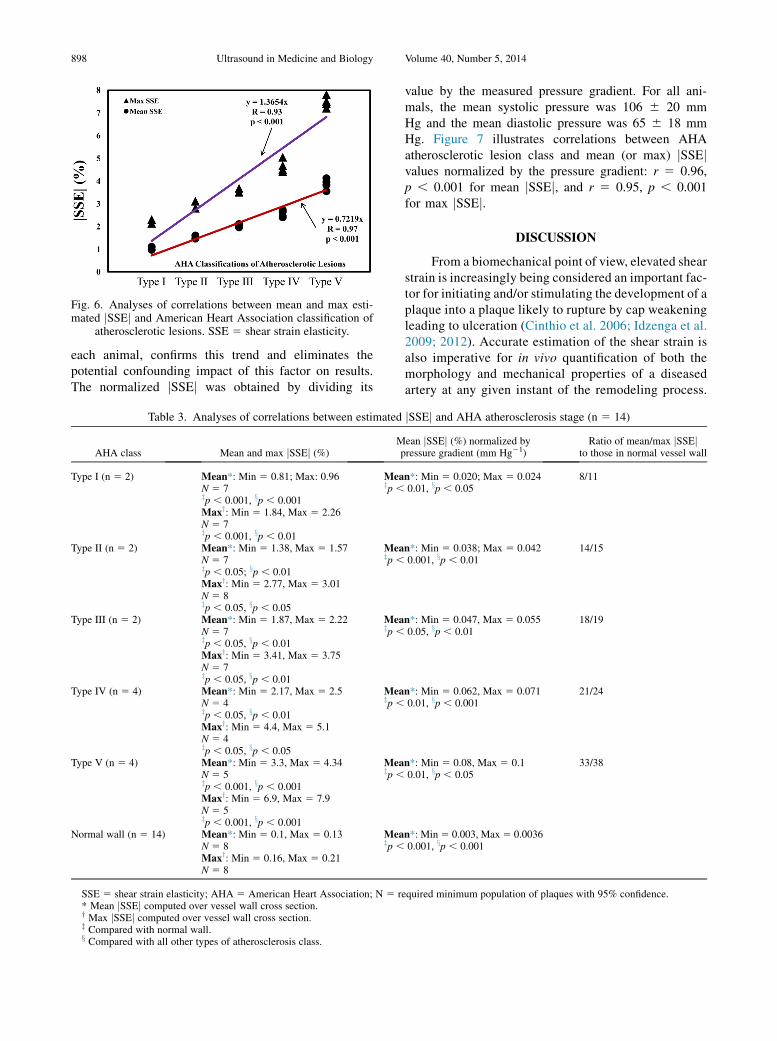
Fig. 6. Analyses of correlations between mean and max esti-mated jSSEj and American Heart Association classification of
atherosclerotic lesions. SSE 5 shear strain elasticity.
898 Ultrasound in Medicine and Biology Volume 40, Number 5, 2014
each animal, confirms this trend and eliminates thepotential confounding impact of this factor on results.The normalized jSSEj was obtained by dividing its
Table 3. Analyses of correlations between estimated
AHA class Mean and max jSSEj (%)Mp
Type I (n 5 2) Mean*: Min 5 0.81; Max: 0.96N 5 7zp , 0.001, xp , 0.001
Meazp ,
Maxy: Min 5 1.84, Max 5 2.26N 5 7zp , 0.001, xp , 0.01
Type II (n 5 2) Mean*: Min 5 1.38, Max 5 1.57N 5 7zp , 0.05; xp , 0.01
Meazp ,
Maxy: Min 5 2.77, Max 5 3.01N 5 8zp , 0.05, xp , 0.05
Type III (n 5 2) Mean*: Min 5 1.87, Max 5 2.22N 5 7zp , 0.05, xp , 0.01
Meazp ,
Maxy: Min 5 3.41, Max 5 3.75N 5 7zp , 0.05, xp , 0.01
Type IV (n 5 4) Mean*: Min 5 2.17, Max 5 2.5N 5 4zp , 0.05, xp , 0.01
Meazp ,
Maxy: Min 5 4.4, Max 5 5.1N 5 4zp , 0.05, xp , 0.05
Type V (n 5 4) Mean*: Min 5 3.3, Max 5 4.34N 5 5zp , 0.001, xp , 0.001
Meazp ,
Maxy: Min 5 6.9, Max 5 7.9N 5 5zp , 0.001, xp , 0.001
Normal wall (n 5 14) Mean*: Min 5 0.1, Max 5 0.13N 5 8
Meazp ,
Maxy: Min 5 0.16, Max 5 0.21N 5 8
SSE 5 shear strain elasticity; AHA 5 American Heart Association; N 5 re* Mean jSSEj computed over vessel wall cross section.y Max jSSEj computed over vessel wall cross section.z Compared with normal wall.x Compared with all other types of atherosclerosis class.
value by the measured pressure gradient. For all ani-mals, the mean systolic pressure was 106 6 20 mmHg and the mean diastolic pressure was 65 6 18 mmHg. Figure 7 illustrates correlations between AHAatherosclerotic lesion class and mean (or max) jSSEjvalues normalized by the pressure gradient: r 5 0.96,p , 0.001 for mean jSSEj, and r 5 0.95, p , 0.001for max jSSEj.
DISCUSSION
From a biomechanical point of view, elevated shearstrain is increasingly being considered an important fac-tor for initiating and/or stimulating the development of aplaque into a plaque likely to rupture by cap weakeningleading to ulceration (Cinthio et al. 2006; Idzenga et al.2009; 2012). Accurate estimation of the shear strain isalso imperative for in vivo quantification of both themorphology and mechanical properties of a diseasedartery at any given instant of the remodeling process.
jSSEj and AHA atherosclerosis stage (n 5 14)
ean jSSEj (%) normalized byressure gradient (mm Hg21)
Ratio of mean/max jSSEjto those in normal vessel wall
n*: Min 5 0.020; Max 5 0.0240.01, xp , 0.05
8/11
n*: Min 5 0.038; Max 5 0.0420.001, xp , 0.01
14/15
n*: Min 5 0.047, Max 5 0.0550.05, xp , 0.01
18/19
n*: Min 5 0.062, Max 5 0.0710.01, xp , 0.001
21/24
n*: Min 5 0.08, Max 5 0.10.01, xp , 0.05
33/38
n*: Min5 0.003, Max5 0.00360.001, xp , 0.001
quired minimum population of plaques with 95% confidence.

Fig. 7. Analyses of correlations between mean and max esti-mated jSSEj, normalized by the pressure gradient measuredwith a catheter within the femoral artery of each animal, andAmerican Heart Association classification of atherosclerotic
lesions.
SSE for atherosclerotic plaque detection d Y. MAJDOULINE et al. 899
The morphology and mechanical properties are crucialfor prediction of plaque rupture (Cheng et al. 1993;Finet et al. 2004) and may also guide the developmentof specific therapies for prevention of acute events.
The most important findings of the present study areas follows:
1. Stary (2000) recommended the AHA atherosclerosisstage classification to convey results of an inquiryinto compositions of atherosclerotic lesions asthey silently develop. Results of the present studyindicated a link between estimated SSE and AHAatherosclerosis class. We observed that the absolutevalue of SSE was statistically higher in plaques inhigher AHA classes and, therefore, with highervulnerability. This correspondence needs to befurther investigated with larger samples and prefer-ably in humans.
2. Results also revealed that areas with elevated jSSEjvalues may be used to detect plaque locations. Inaddition, normal parts of the vascular wall had muchlower SSE values. Therefore, the SSE-enabledLSME technique may have the potential to localizeand identify plaque features in vivo.
3. Our results suggest that SSE may allow evaluation ofthe thin-cap fibroatheroma stress amplitude, which ap-pears to be a good biomechanical predictor of plaquerupture (Ohayon et al. 2008).
Potential clinical implicationsThe data presented in this study were based on a
rather small population with data acquired in a pig model.However, the aforementioned results indicate the poten-tial for integration of SSE into clinical practice for earlyevaluation of atherosclerotic plaques before they becomevulnerable. More specifically, the following issues can beconsidered:
1. The in vivo quantification of mechanical properties ofvulnerable plaque components at any given instantof the remodeling process remains a major issue.It could lead to the development of specific therapiesfor prevention of acute coronary events (Cheng et al.1993; Finet et al. 2004; Libby 2001). Supplementingconventional IVUS elastograms with SSE mapsmay help in improving the accuracy of in vivoquantification of plaque mechanical properties.However, this needs to be assessed in humans and tobe clinically validated afterward.
2. Our in vivo data suggest that high shear strains arelinked to AHA atherosclerosis class and, therefore,may become a potential quantity for predictingfuture events. Therefore, supplementing the currentclinical procedure with SSE can be useful to iden-tify patients who are at a high risk and in need ofcloser follow-up and further investigation, as wellas to improve risk stratification and clinical decisionmaking.
3. It is recognized that a very small structural change ina vulnerable plaque can change its stability (Le’Flochet al. 2010; Libby et al. 2002). Clinical use of theproposed LSME imaging method to determine SSEmay thus allow monitoring of the state ofatherosclerotic plaque evolution and its response totherapies. This may help in decisions on timelyinterventions to prevent myocardial infarctions andstrokes.
4. Finally, once clinically validated, the proposedmethod may allow the comparison of different pa-tients with different atherosclerotic plaque propertiesor the same patient between different follow-ups. Inthis regard, SSE may be a useful quantity in moni-toring the level of plaque vulnerability. Therefore,the proposed method may be helpful in confirmingwhether an intervention has been useful in stabilizinga vulnerable plaque.
LimitationsThis study was performed on a small population
because of the high cost associated with each pig experi-ment. Nevertheless, this study did reveal the advantagesof SSE and how it is connected to plaque vulnerability.Other studies with less expensive animal models on largerpopulations and, preferably, an extension to human pla-ques are required to confirm our results. Furthermore,because inflammation is a major determinant in the detec-tion of vulnerable plaques (Naghavi et al., 2003), futurestudies should also be dedicated to assessing the correla-tion between SSE maps and inflammation status. Finally,it should be noted that the thick vessel walls in some his-tology images may have been caused by incomplete fix-ation of the elastic recoil.
900 Ultrasound in Medicine and Biology Volume 40, Number 5, 2014
Acknowledgments—This research was supported by the Natural Sci-ences and Engineering Research Council of Canada (CollaborativeHealth Research Program 323405-6 and Strategic Program 381136-09) and by the Canadian Institutes of Health Research (CPG-80085).Zahra Keshavarz-Motamed was supported by a Fonds de la Recherchedu Qu�ebec Postdoctoral Grant (FQRNT).
REFERENCES
Allen JD, Ham KL, Dumont DM, Sileshi B, Trahey GE, Dahl JJ. Thedevelopment and potential of acoustic radiation force impulse(ARFI) imaging for carotid artery plaque characterization. VascMed 2011;16:302–311.
Ambrose JA, TannenbaumMA, Alexopoulos D, Hjemdahl-Monsen CE,Leavy J, Weiss M, Borrico S, Corlin R, Fuster V. Angiographic pro-gression of coronary artery disease and the development of myocar-dial infarction. J Am Coll Cardiol 1998;12:56–62.
Baldewsing RA, Danilouchkine MG, Mastik F, Schaar JA, Serruys PW,van der Steen AF. An inverse method for imaging the local elasticityof atherosclerotic coronary plaques. IEEE Trans Inf Technol Biomed2008;12:277–289.
Baldewsing RA, de Korte CL, Schaar JA, Mastik F, van der Steen AF.Finite element modeling and intravascular ultrasound elastographyof vulnerable plaques: Parameter variation. Ultrasonics 2004;42:723–729.
Briley-Saebo KC, Mulder WJ, Mani V, Hyafil F, Amirbekian V,Aguinaldo JG, Fisher EA, Fayad ZA. Magnetic resonance imagingof vulnerable atherosclerotic plaques: Current imaging strategiesand molecular imaging probes. J Magn Reson Imaging 2007;26:460–479.
Brugaletta S, Garcia-Garcia HM, Serruys PW, Maehara A, Farooq V,Mintz GS, de Bruyne B, Marso SP, Verheye S, Dudek D,Hamm CW, Farhat N, Schiele F, McPherson J, Lerman A,Moreno PR, Wennerblom B, Fahy M, Templin B, Morel MA, vanEs GA, Stone GW. Relationship between palpography and virtualhistology in patients with acute coronary syndromes. JACC Cardio-vasc Imaging 2012;5:19–27.
Carlier SG, Tanaka K. Studying coronary plaque regression with IVUS:A critical review of recent studies. J Interv Cardiol 2006;19:11–15.
C�espedes EI, de Korte CL, van der Steen AFW. Intraluminal ultrasonicpalpation: Assessment of local and cross-sectional tissue stiffness.Ultrasound Med Biol 2000;26:385–396.
Cheng GC, Loree HM, Kamm RD, Fishbein MC, Lee RT. Distributionof circumferential stress in ruptured and stable atherosclerotic le-sions: A structural analysis with histopathological correlation. Cir-culation 1993;87:1179–1187.
Cinthio M, Ahlgren AR, Bergkvist J, Jansson T, Persson HW,Lindstrom K. Longitudinal movements and resulting shear strainof the arterial wall. Am J Physiol Heart Circ Physiol 2006;291:394–402.
De Korte CL, Cespedes EI, van der Steen AFW. Influence of catheter po-sition on estimated strain in intravascular elastography. IEEE TransUltrason Ferroelectr Freq Control 1999;46:616–625.
DeKorte CL, PasterkampG, van der SteenAFW,WoutmanHA, BomN.Characterization of plaque components with intravascular ultra-sound elastography in human femoral and coronary arteriesin vitro. Circulation 2000;102:617–623.
De Korte CL, Sierevogel MJ, Mastik F, Strijder C, Schaar JA, Velema E,Pasterkamp G, Serruys PW, van der Steen AFW. Identification ofatherosclerotic plaque components with intravascular ultrasoundelastography in vivo: A Yucatan pig study. Circulation 2002;105:1627–1630.
De Korte CL, van der Steen AF, C�espedes EI, Pasterkamp G. Intravas-cular ultrasound elastography in human arteries: Initial experiencein vitro. Ultrasound Med Biol 1998;24:401–408.
DicksonBC, GotliebAI. Towards understanding acute destabilization ofvulnerable atherosclerotic plaques. Cardiovasc Pathol 2003;12:237–248.
Falk E, Shah PK, Fuster V. Coronary plaque disruption. Circulation1995;92:657–671.
Fayad ZA, Fuster V, Nikolaou K, Becker C. Computed tomography andmagnetic resonance imaging for noninvasive coronary angiographyand plaque imaging: Current and potential future concepts. Circula-tion 2002;106:2026–2034.
Finet G, Ohayon J, Rioufol G. Biomechanical interaction between capthickness, lipid core composition and blood pressure in vulnerablecoronary plaque: Impact on stability or instability. Coronary ArteryDis 2004;15:13–20.
Frutkin AD,Mehta SK,McCrary JR, Marso SP. Limitations to the use ofvirtual histology-intravascular ultrasound to detect vulnerable pla-que. Eur Heart J 2007;28:1783–1784.
Fuster V, Moreno PR, Fayad ZA, Corit R, Badimon JJ. Atherothrombo-sis and high-risk plaque: Part I. Evolving concepts. J Am Coll Car-diol 2005;46:937–954.
Idzenga T, Holewijn S, Hansen HHG, de Korte CL. Estimating cyclicshear strain in the common carotid artery using radiofrequency ultra-sound. Ultrasound Med Biol 2012;38:2229–2237.
Idzenga T, Pasterkamp G, de Korte CL. Shear strain in the adventitiallayer of the arterial wall facilitates development of vulnerable pla-ques. Biosci Hypoth 2009;2:339–342.
Ishii A, Vinuela F, Murayama Y, Yuki I, Nien YL, Yeh DT, Vinters HV.Swine model of carotid artery atherosclerosis: Experimental induc-tion by surgical partial ligation and dietary hypercholesterolemia.Am J Neuroradiol 2006;27:1893–1899.
Jang IK, Bouma BE, Kang DH, Park SJ, Park SW, Seung KB, Choi KB,Shishkov M, Schlendorf K, Pomerantsev E, Houser SL, Aretz HT,Tearney GJ. Visualization of coronary atherosclerotic plaques in pa-tients using optical coherence tomography: Comparison with intra-vascular ultrasound. J Am Coll Cardiol 2002;39:604–609.
Lawrence-Brown M, Stanley BM, Sun Z, Semmens JB, Liffman K.Stress and strain behaviour modelling of the carotid bifurcation.ANZ J Surg 2011;81:810–816.
Le Floc’h S, Ohayon J, Tracqui P, Finet G, Gharib A, Maurice RL,Cloutier G, Pettigrew RI. Vulnerable atherosclerotic plaque elastic-ity reconstruction based on a segmentation-driven optimization pro-cedure using strain measurements: Theoretical framework. IEEETrans. Med. Imaging 2009;28:1126–1137.
Le Floc’h S, Cloutier G, Finet G, Tracqui P, Pettigrew RI, Ohayon J. Onthe potential of a new IVUS elasticity modulus imaging approach fordetecting vulnerable atherosclerotic coronary plaques: In vitrovessel phantom study. Phys Med Biol 2010;55:5701–5721.
Liang Y, Zhu H, Friedman MH. Estimation of the transverse straintensor in the arterial wall using IVUS image registration. UltrasoundMed Biol 2008;34:1832–1845.
Libby P. Current concepts of the pathogenesis of the acute coronary syn-dromes. Circulation 2001;104:365–372.
Libby P, Ridker PM,Maseri A. Inflammation and atherosclerosis. Circu-lation 2002;105:1135–1143.
Loree HM, Kamm RD, Stringfellow RG, Lee RT. Effects of fibrous capthickness on peak circumferential stress in model atheroscleroticvessels. Circ Res 1992;71:850–858.
Maehara A, Cristea E, Mintz GS, Lansky AJ, Dressler O, Biro S,Templin B, Virmani R, de Bruyne B, Serruys PW, Stone GW. Defi-nitions and methodology for the grayscale and radiofrequency intra-vascular ultrasound and coronary angiographic analyses. J Am CollCardiol Cardiovasc Imaging 2012;5:1–9.
Maurice RL, Fromageau J, Brusseau E, Finet G, Rioufol G, Cloutier G.On the potential of the Lagrangian estimator for endovascular ultra-sound elastography: In vivo human coronary artery study. Ultra-sound Med Biol 2007;33:1199–1205.
Maurice RL, Fromageau J, Roy Cardinal MH, Doyley M, de Muinck E,Robb J, Cloutier G. Characterization of atherosclerotic plaques andmural thrombi with intravascular ultrasound elastography: A poten-tial method evaluated in an aortic rabbit model and a human coro-nary artery. IEEE Trans Inf Technol Biomed 2008;12:290–298.
Maurice RL, Ohayon J, Finet G, Cloutier G. Adapting the Lagrangianspeckle model estimator for endovascular elastography: Theoryand validation with simulated radio-frequency data. J Acoust SocAm 2004;116:1276–1286.
Maurice RL, Ohayon J, Stoyanova E, Foster FS, Cloutier G. Non-inva-sive high-frequency vascular ultrasound elastography. Phys MedBiol 2005;50:1611–1628.

SSE for atherosclerotic plaque detection d Y. MAJDOULINE et al. 901
Murray SW, Stables RH, Hart G, Palmer ND. Defining the magnitude ofmeasurement variability in the virtual histology analysis of acutecoronary syndrome plaques. Eur Heart J Cardiovasc Imaging2013;14:167–174.
Naghavi M, Libby P, Falk E, Casscells W, Litovsky S, Rumberger J,Badimon JJ, Stefanadis C, Moreno P, Pasterkamp G, Fayad Z,Stone PN, Waxman S, Raggi P, Madjid M, Zarrabi A, Burke A,Yuan C, Fitzgerald PJ, Siscovick DS, de Korte CL, Aikawa M,Airaksinen J, Assmann G, Becker CR, Chesebro JH, Farb A,Galis ZS, Jackson C, Jang IK, Koenig W, Lodder RA, March K,Demirovic J, Navab M, Priori SG, Rekhter MD, Bahr R,Grundy SM, Mehran R, Colombo A, Boerwinkle E, Ballantyne C,Insull W, Schwartz RS, Vogel R, Serruys PW, Hansson GK,Faxon DP, Kaul S, Drexler H, Greenland P, Muller JE, Virmani R,Ridker PM, Zipes DP, Shah PK, Willerson JT. From vulnerable pla-que to vulnerable patient: A call for new definition and risk assess-ment strategies: Part I. Circulation 2003;108:1664–1672.
Nair A, Kuban BD, Tuzcu EM, Schoenhagen P, Nissen SE,Vince DG. Coronary plaque classification with intravascular ul-trasound radiofrequency data analysis. Circulation 2002;106:2200–2206.
Nair A, Margolis MP, Kuban BD, Vince DG. Automated coronary pla-que characterization with intravascular ultrasound backscatter:Ex vivo validation. EuroIntervention 2007;3:113–120.
Ohayon J, Finet G, Gharib AM, Herzka DA, Tracqui P, H�eroux J,Rioufol G, Kotys MS, Elagha A, Pettigrew RI. Necrotic core thick-ness and positive arterial remodeling index: Emergent biomechan-ical factors for evaluating the risk of plaque rupture. Am J PhysiolHeart Circ Physiol 2008;295:717–727.
Perrey C, Wilkening W, Brendel B. A modified synthetic aperturefocusing technique for the correction of geometric artefacts in intra-vascular ultrasound elastography. In: Proceedings, 2001 Interna-tional IEEE Ultrasonics Symposium, Atlanta, Georgia, 7–10October. New York: IEEE, 2001;2:1585–1588.
Redgrave JNE, Lovett JK, Gallagher PJ, Rothwell PM. Histologicalassessment of 526 symptomatic carotid plaques in relation to the na-ture and timing of ischemic symptoms: The Oxford Plaque Study.Circulation 2006;113:2320–2328.
Richards MS, Doyley MM. Investigating the impact of spatial priors onthe performance of model-based IVUS elastography. Phys Med Biol2011;56:7223–7246.
Rioufol G, Finet G, Ginon I, Andre-Fouet X, Rossi R, Vialle E,Desjoyaux E, Convert G, Huret JF, Tabib A. Multiple athero-sclerotic plaque rupture in acute coronary syndrome: A three-vessel intravascular ultrasound study. Circulation 2002;106:804–808.
Roy Cardinal MH, Meunier J, Soulez G, Maurice RL, Therasse E,Cloutier G. Intravascular ultrasound image segmentation: A threedimensional fast-marchingmethod based on gray level distributions.IEEE Trans Med Imaging 2006;25:590–601.
Schaar JA, van der Steen AF, Mastik F, Baldewsing RA, Serruys PW.Intravascular palpography for vulnerable plaque assessment. J AmColl Cardiol 2006;18:86–91.
Serruys PW, Garcia-Garcia HM, Buszman P, Erne P, Verheye S,Aschermann M, Duckers H, Bleie O, Dudek D, Botker HE, vonBigelen C, D’Amico D, Hutchinson T, Zambanini A, Mastik F,van Es GA, van der Steen AFW, Vince DG, Ganz P,Hamm CW, Wjns W, Zalewski A, for the Integrated Biomarkerand Imaging Study-2 Investigators. Effects of the directlipoprotein-associated phospholipase A(2) inhibitor darapladibon human coronary atherosclerotic plaque. Circulation 2008;118:1172–1182.
Shapo BM, Crowe JR, Erkamp R, Emelianov SY, Eberle MJ,O’Donnell M. Strain imaging of coronary arteries with intraluminalultrasound: Experiments on an inhomogeneous phantom. UltrasonImaging 1996;18:173–191.
Shi H, Chen Q, Varghese T. A general solution for catheter positioneffects for strain estimation in intravascular elastography. Ultra-sound Med Biol 2005;31:1509–1526.
Shi H, Varghese T, Chen Q, Gimelli G. Correction for simultaneouscatheter eccentricity and tilt in intravascular elastography. UltrasonImaging 2003;25:262–283.
Soulez G, Lerouge S, Allard L, Rom�eo P, Qi S, H�eon H, Tardif JC,Cloutier G. Vulnerable carotid atherosclerotic plaque creation in aswine model: Evaluation of stenosis creation using absorbable andpermanent suture in a diabetic dyslipidemic model. J. Vasc IntervRadiol 2012;23:1700–1708.
Stary HC. Natural history and histological classification of atheroscle-rotic lesions: an update. Arterioscler Thromb Vasc Biol 2000;20:1177–1178.
Tearney GJ, Waxman S, Shishkov M, Vakoc BJ, Suter MJ, Freilich MI,Desjardins AE, Oh WY, Bartlett LA, Rosenberg M, Bouma BE.Three-dimensional coronary artery microscopy by intracoronary op-tical frequency domain imaging. JACC Cardiovasc Imaging 2008;1:752–761.
Thim T, Hagensen MK, Wallace-Bradley D, Granada JF, Kaluza GL,Drouet L, Paaske WP, Botker HE, Falk E. Unreliable assessmentof necrotic core by virtual histology intravascular ultrasound inporcine coronary artery disease. Circ Cardiovasc Imaging 2010;3:384–391.
Van Mieghem CA, McFadden EP, de Feyter PJ, Bruining N, Schaar JA,Mollet NR, Cademartiri F, Goedhard D, de Winter S, Granillo GR,Valgimigli M, Mastik F, van der Steen AF, van der Giessen WJ,Sianos G, Backx B, Morel MA, van Es GA, Zalewski A,Serruys PW. Noninvasive detection of subclinical coronary athero-sclerosis coupled with assessment of changes in plaque characteris-tics using novel invasive imaging modalities: The IntegratedBiomarker and Imaging Study (IBIS). J Am Coll Cardiol 2006;47:1134–1142.
Vengrenyuk Y, Carlier S, Xanthos S, Cardoso L, Ganatos P, Virmani R,Einav S, Gilchrist L, Weinbaum S. A hypothesis for vulnerable pla-que rupture due to stress-induced debonding around cellular micro-calcifications in thin fibrous caps. Proc Natl Acad Sci USA 2006;103:14678–14683.
Virmani R, Burke AP, Farb A, Kolodgie FD. Pathology of the vulnerableplaque. J Am Coll Cardiol 2006;47:13–18.
Vito RP, Whang MC, Giddens DP, Zarins CK, Glagov S. Stress analysisof the diseased arterial cross-section. ASMEAdv Bioeng Proc 1990;19:273–276.
Wan M, Li Y, Li J, Cui Y, Zhou X. Strain imaging and elasticity recon-struction of arteries based on intravascular ultrasound video images.IEEE Trans Biomed Eng 2001;48:116–120.
APPENDIX A: ELASTOGRAPHYALGORITHM
Because our aim was to find components of the strain tensorwithin the artery wall, displacements at any location as well as theirspatial derivatives were required. For this purpose, the LSME developedin the context of EVE was adapted to process IVUS-derived RF signalsin the polar coordinate system.
First-order optical flow constraint equationThe LSME algorithm is based on the optical flow constraint equa-
tion (OFCE), which assumes that the signal intensity corresponding toeach material point remains unchanged over time. This assumption isgenerally true whenever the signal acquisition conditions are notchanged from one frame to the next and tissue displacements are small.The OFCE can be written using the material derivative of the intensitysignal I as
DI
Dt5 0 (A1)
where t refers to time. For a specific spatial point Pi, eqn (A1) can berewritten as
vI
vtðPi; tÞ1 v!ðPi; tÞ$V
/
IðPi; tÞ5 0; (A2)
where the nabla operator V stands for the gradient. This equation resultsin an under-determined system of equations. To overcome this problem,the first-order Taylor series expansion about a given point M0 is used.The speckle velocity v! at point Pi can then be expanded as
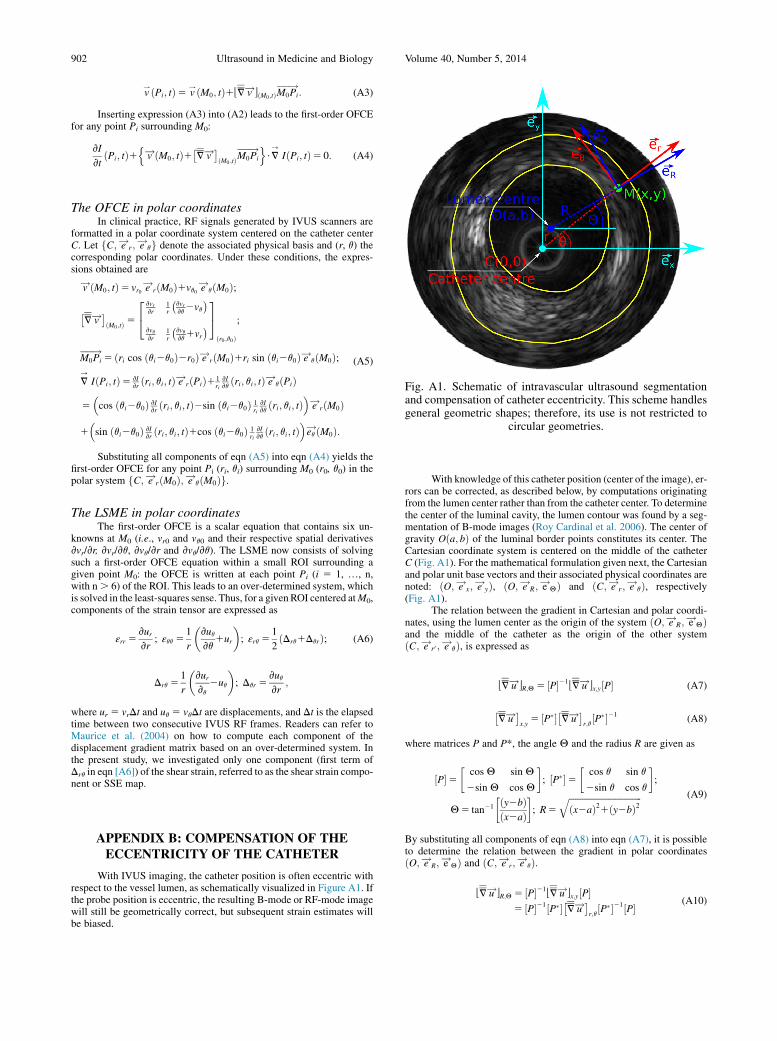
Fig. A1. Schematic of intravascular ultrasound segmentationand compensation of catheter eccentricity. This scheme handlesgeneral geometric shapes; therefore, its use is not restricted to
circular geometries.
902 Ultrasound in Medicine and Biology Volume 40, Number 5, 2014
v.ðPi; tÞ5 v
.ðM0; tÞ1PV v!RðM0 ;tÞM0Pi��!
: (A3)
Inserting expression (A3) into (A2) leads to the first-order OFCEfor any point Pi surrounding M0:
vI
vtðPi; tÞ1
nv!ðM0; tÞ1
�V v!�
ðM0 ;tÞM0Pi��!o
$V/
IðPi; tÞ5 0: (A4)
The OFCE in polar coordinatesIn clinical practice, RF signals generated by IVUS scanners are
formatted in a polar coordinate system centered on the catheter centerC. Let fC; e!r; e
!qg denote the associated physical basis and (r, q) the
corresponding polar coordinates. Under these conditions, the expres-sions obtained are
v!ðM0; tÞ5 vr0 e!
rðM0Þ1vq0 e!
qðM0Þ;
�V v!�
ðM0 ;tÞ 5
24 vvr
vr1r
�vvrvq2vq
�vvqvr
1r
�vvqvq1vr
�35
ðr0 ;q0Þ
;
M0Pi��!
5 ðri cos ðqi2q0Þ2r0Þ e!rðM0Þ1ri sin ðqi2q0Þ e!qðM0Þ;
V/
IðPi; tÞ5 vIvrðri; qi; tÞ e!rðPiÞ11
ri
vIvqðri; qi; tÞ e!qðPiÞ
5cos ðqi2q0Þ vI
vrðri; qi; tÞ2sin ðqi2q0Þ 1
ri
vIvqðri; qi; tÞ
e!rðM0Þ
1sin ðqi2q0Þ vI
vrðri; qi; tÞ1cos ðqi2q0Þ 1
rivIvqðri; qi; tÞ
eq!ðM0Þ:
(A5)
Substituting all components of eqn (A5) into eqn (A4) yields thefirst-order OFCE for any point Pi (ri, qi) surrounding M0 (r0, q0) in thepolar system fC; e!rðM0Þ; e!qðM0Þg.
The LSME in polar coordinatesThe first-order OFCE is a scalar equation that contains six un-
knowns at M0 (i.e., vr0 and vq0 and their respective spatial derivativesvvr/vr, vvr/vq, vvq/vr and vvq/vq). The LSME now consists of solvingsuch a first-order OFCE equation within a small ROI surrounding agiven point M0: the OFCE is written at each point Pi (i 5 1, ., n,with n. 6) of the ROI. This leads to an over-determined system, whichis solved in the least-squares sense. Thus, for a givenROI centered atM0,components of the strain tensor are expressed as
εrr 5vurvr
; εqq 51
r
�vuqvq
1ur
�; εrq 5
1
2ðDrq1DqrÞ; (A6)
Drq 51
r
�vurvq
2uq
�; Dqr 5
vuqvr
;
where ur 5 vrDt and uq 5 vqDt are displacements, and Dt is the elapsedtime between two consecutive IVUS RF frames. Readers can refer toMaurice et al. (2004) on how to compute each component of thedisplacement gradient matrix based on an over-determined system. Inthe present study, we investigated only one component (first term ofDrq in eqn [A6]) of the shear strain, referred to as the shear strain compo-nent or SSE map.
APPENDIX B: COMPENSATION OF THEECCENTRICITY OF THE CATHETER
With IVUS imaging, the catheter position is often eccentric withrespect to the vessel lumen, as schematically visualized in Figure A1. Ifthe probe position is eccentric, the resulting B-mode or RF-mode imagewill still be geometrically correct, but subsequent strain estimates willbe biased.
With knowledge of this catheter position (center of the image), er-rors can be corrected, as described below, by computations originatingfrom the lumen center rather than from the catheter center. To determinethe center of the luminal cavity, the lumen contour was found by a seg-mentation of B-mode images (Roy Cardinal et al. 2006). The center ofgravity Oða; bÞ of the luminal border points constitutes its center. TheCartesian coordinate system is centered on the middle of the catheterC (Fig. A1). For the mathematical formulation given next, the Cartesianand polar unit base vectors and their associated physical coordinates arenoted: ðO; e!x; e
!yÞ, ðO; e!R; e
!QÞ and ðC; e!r ; e
!qÞ, respectively
(Fig. A1).The relation between the gradient in Cartesian and polar coordi-
nates, using the lumen center as the origin of the system ðO; e!R; e!
QÞand the middle of the catheter as the origin of the other systemðC; e!r0 ; e
!qÞ, is expressed as
PV u!RR;Q 5 ½P�21PV u!Rx;y½P� (A7)
�V u!�
x;y5 ½P���V u!�
r;q½P��21
(A8)
where matrices P and P*, the angle Q and the radius R are given as
½P�5�
cosQ sinQ
2sinQ cosQ
�; ½P��5
�cos q sin q
2sin q cos q
�;
Q5 tan21
�ðy2bÞðx2aÞ
�; R5
ffiffiffiffiffiffiffiffiffiffiffiffiffiffiffiffiffiffiffiffiffiffiffiffiffiffiffiffiffiffiffiffiffiðx2aÞ21ðy2bÞ2
q (A9)
By substituting all components of eqn (A8) into eqn (A7), it is possibleto determine the relation between the gradient in polar coordinatesðO; e!R; e
!QÞ and ðC; e!r ; e
!qÞ.
PV u!RR;Q 5 ½P�21PV u!Rx;y½P�5 ½P�21½P���V u!�
r;q½P��21½P� (A10)
SSE for atherosclerotic plaque detection d Y. MAJDOULINE et al. 903
By considering the matrix [Q] defined as
½Q�21 5 ½P�21½P��5�
C S2S C
�(A11)
or
½Q�5 ½P��21½P�5�C 2SS C
�
where C and S are cos (Q–q) and sin (Q–q), respectively, provides thetransformation between the two polar systems:
�V u!�
R;Q5 ½Q�21�
V u!�r;q½Q� (A12)
Also, the displacement gradient tensor in the physical basisðO; e!R; e
!QÞ according to the physical basis ðC; e!r ; e
!qÞ can be
rewritten as
�DRR DRQ
DRQ DQQ
�ð e!R ; e
!QÞ5
�C S2S C
��Drr Dqr
Drq Dqq
�ð e!r ; e
!qÞ
�C 2SS C
�(A13)
or 8>>>>>>>>>><>>>>>>>>>>:
εRR 5DRR 5 εrrC212εrqCS1εqqS
2
εQQ 5DQQ 5 εrrS222εrqCS1εqqC
2
DRQ 52εrrCS2DqrS21DrqC
21εqqCS
DQR 52εrrCS1DqrC21DrqS
21εqqCS
εRQ 5 12ðDRQ1DQRÞ52εrrCS1εrq
C
22S
21εqqCS
(A14)
Note that the general formulations developed in Appendices Aand B are based on a geometric transformation between Cartesian andpolar coordinates; no assumption on the shape of the vessels isrequired (not necessarily circular).