DÂ - naldc.nal.usda.gov
19
U.S» Dept.-» of Agriculture Agricultural Marketing Service Idaho Department of Agriculture Cooperating Federal-State ^^'^^£}^^_ß^^ ^E7lP2^ ji'ruit and Vegetable Division •x.iARKETIí.G DÂ ¿T'W iPl '/^\\ VN. 3 O T A T C ;c-i., Season of 1953-1954 By ALU.-^. HEÍ.RY 206 Federal Building Idaho Falls, Idaho April 15, 1954
Transcript of DÂ - naldc.nal.usda.gov

U.S» Dept.-» of Agriculture Agricultural Marketing
Service
Idaho Department of Agriculture Cooperating
Federal-State ^^'^^£}^^_ß^^ ^E7lP2^
ji'ruit and Vegetable Division
•x.iARKETIí.G
DÂ ¿T'W iPl '/^\\
VN.
3 O T A T C ;c-i.,
Season of
1953-1954
By
ALU.-^. HEÍ.RY
206 Federal Building Idaho Falls, Idaho
April 15, 1954

Most of the trade felt the holdings report was top low, but that the heavy oullage would offset the over supply^ Eastern buying continued slow the remainder of the month with little change in prices*
After much disagreement and discussion, the agreement to limit the minimum size on grades other than U.S. No» 1 to 8 ounce minimum was changed to 6 ounce minimum» This became effective on February 27, 1954 and prices immediately began to decline for the lower gradeso Throughout the month of February, the demand was light and the market prices dropped off to the low of the season. G-roWers prices for TJ.S» No«l quality were »ßO-l.OO aiid »15*o25 for U^. S« No» 2 quality» ' •
The low prices continue*d into the first part of March but the- farmers again held for higher prices causing the offerings'to be light resulting in an, increase in prices« About. January 19 rumors beg;àn circulating that tlie government was planning to give some type of help for the potato industryf This causeçt confusion and unsettlodness within the trade as no one knew what was to happen or whether they wanted any help at all» After the .Secretary of Agriculture announced that some assistance would be made available, the demand for potatoes increased slightly and prices rose about 30 cont-s por cwt loaded» These prices continued into the first . part of Aprils,but demand álowed do^vn and prices deoliiied (^lightly as this report is being released» • ' ; , . ,
Although the total produo-tion of potatoes in Idaho was larger than usiial,- the shipments by rail are not expeotöd to be great due to the heavy cullage and lack of demand throughout the season o At present 39,454 cars have been shipped' from Idaho this season». It is estimated that about 3,000 cars will be shipped the remainder of the' season»
*j|ía(t*:íe.íi^*****3|c**:í;** üf :^ :fn
TABLE 0 F G 0 N T E N T S
TABLÉ NO.
1» Acreage^ Yield and Production, Season 1953^ with Comparisons » 2» Praduotion and Farm Disposition in the 36 Late and Intermediate States 3» Acreage Harvested in 18 Late- Producing-.Strate •4» Potato .Yields per Acre-in 18 Late Producting States 5» Potato Production in 16 Late Producing States" ., 6# Potato Shipments in 18 Late Producing States 1, Acreage, Yield per Acre, Production and Shipments - Idaho Pótateos 8» Carlot Shipments of Idaho Potatoes by Month 9, Truck. Movement of Idaho Potatoes by Month
10» Carlot. Shipments of,Potatoes in certain States 195S-1954 Season il» Carlot Shipments from Idaho by Billing Stations, Year 1953 12, Carlot Inspections of Idaho Potatoes by Variety, Grade and Containers 13• Carlot Inspections of Idaho Potatoes by Variety, Grade and Containers 14» Weekly Shipments & Price Range Idaho Russets at Shipping Point 15» Prices to Growers, Bulk per" cwt ID» Weekly Price Range Potatoes at Chicago 17, Weekly Price Range Idaho Russets at Los Angeles 18» Weekly Price Range Idaho Russets at Other Eastern Markets . .• 19, Idaho Potato Production, Stocks en Hand January 1, and Shipments to and from
January 1, Past 10 Seasons 12 20. Carlot Unloads of Potatoes during 1953 in 100 Cities and 5 Canadian Cities,
Including Boat Converted to Carlot Equivalents 13-14 21» Indicated Pot.ato Plantings for 19 53, with Comparisons 15 22t Merchantable Stocks in Hands of Growers and Local Dealers, January 1,
in the 35 Late and Intermediate States» 1953 and 1954» 16
PAGE 1 2 3 3 4
■ 4- . 5-
5 5
>6 6-7-8
8 9
10 10 11 11 12

PEDER/ÜL-SmTE MARKET IJEWS ^SBE7ICE
MMlKBTING IDAHO POTATOES • ■ •" _ '
1955 CROP ■
FORWARD{ The Federalr-State Market Neivs Service issued daily market* reports on
Potatoes at Pavette^ Idaho^^ from August 6 to .September 25, 1.953 and at,Idaho Falls^ Idaho from September 28^ 1953. to April .15,- 19S4c î'rom these reports and from reports published by the U© S* Department of i^gr;i6ultare, Crop Reporting._ Board and^Idaho Inspection Service, the tables in the : following review,'were, obtained» ' As the review is being released while the marke ting'of potatoes is still in progress^ the figures published herein are subject to revision« •
PHODUCTIONj The Crop Reportii>g Board" estimated the production of potatoes in Idaho at 45,900,000 bushels as-ioompare.4 with ¡th^ final survey for 1952 of 42,780,000 bushels« From the 1952 crop 47,774 cars were shipped by rail and 3,672 cars were shipped by truck» The estimated yields for Idaho for 1953 were 300 bushels per acre .äS compared with 310 bushels for,1952* The total United .^tates production was. estimated at 373,711^000 bushels as ooÄt)arod with 249,098,000 "bushels'far 19,52 with yields, of 247,8 bushels and 249,»0 bushels respectively»
HARVESTINGt 'The îdaHo potato harvest started in the Western Section about July • 1Ü witn tne digging,of Round Redsa Long l/l/hites started about July 23 and Early Russets were dug about August 1© îho Twin Falls^^Burloy Area shipped a few cars of potatoesthe first week of Soptembor, but did not get under way to any extent until about September 15 at which time, the Upper Valley started to harvest« The weather was good for harvesting except for some rain and light snow about the 22nd of October« Night time temperatures were warnier than should have been for ideal storage conditionso A larger percentage of the potatoes went into storage than in previous years due to the low price to growers » 'By the end of October all the potatoes were under cover, although some were in temporary as storage space was c-aroe» ihe quality of ttLO crop was reported only fair fron the beginning with ño:ne lots sorting as high as 50 percent culls, but most lots running about 20-3Ô percent culls« The largest oullage factor reported was cuts and bruises with some greening and wire wormo •.,
MARKET COMMENTS I The demand for Idaho Potatoes started slow with many cars 'rolling
as soon as the harvest was well under wayV The first few cars of early Routed Reds but of the Western section brought $2:9'50 .for U*S* No» 1, but soon dropped.off to <80«-'l*90# The first Long lihites so ld>at, ,$1«50-lç55 and Early Russets brought $l«90-2,10é At thß close of.the Early deal .ïlussets were selling at i'ip2«55-2>75 for U©S» N04 !• The late deal started off. si ovf, with growers getting i|l »40-1 «70. for . U«S^ No# 1 quality delivered to the wâ,rel;ipuse and continued at those prices until the harvesting was finished and potatoes, started to move from storage«. At this, time the growers prices were! |1«50-1«7.5 for U.S» No# 1 at the growers cellars and iip«4Ö-#50 for U«S«,No#2*
'From the start of the season buyers were looking for best large stock and special, packs of Bakers« Splitting the packs to make special large sizes placed a large amount of anall size potatoes on the market^ These were mostly packed in 10 Ibo bags and practically demoralized the s,mall package^: marke t*» At this time a rec- ommendation was sent to the Department -of Agriculture to restrict the shipments of potatoes of lessor, grades than. U.S« No^^.l to 8 ounce minimum and all. U« S»No« JL to size A« The agreement'went into effect on December 28, 1953« This caused the U« S. No« 2 to-become' scarce as ra^ojiy were thrown into the culls and 'the price advanced about to20 per cwto
The month of .January savf the best demand and movement of the. season^ On January 8th 355 cfeirs were shipped from Idaho and, heavy shipments continued throughout most of the monthty When the Stocks on Hand report VJUS released on Jeoiuary 20th the demand declined slightly and the farmers bogan holding for higher prices©
Continued on next pagOc

PAG-E '"' TABLE NO^ 1, I POTATOESj. ACREAGE, YIELD- AND PRODUCTION. SEASQg .19 53 WITH_COMPARI^SgN__ GHOUP' X
AIID <_ Ac£o^g£ HaTve^ßt^ed ^ j_ -."^fi^^i^d^p^r^A^re^ ^ $_ ^P£C>du£ti^cn STATE ^Av'eragei ' « . î Average « ""l "': Average s i í}9^2^oU _ lߧßl _ L^k^l IPi^Z^L 1 J-t^l L^l^l i^i^2-512 J'ißl^ 19 53
Thousawi Aores Busheis. Thousand Bushels LATE STATESt ' " - • - - Maine 175 151 156 364 360 ^370 61^943 54,360 57,720 New Hampshire 6^0 , .4,1 4o.2 206 .255 255 1,182 1,046 1,071 V,eiiiiont 8*4 4»3 4.1 167 l80 190 1,308 774 779 Massachusetts 16^8 8,3 8*7 V195 205 240 3,078 1*702 2*088 lihole Island 5^8 4.7 4,5 228 245 285 1^302 1,152 1.282 Connecticut: 14<»7 8,9 9,6 226 255 280 3cl32 2,270 2^688 N,Y,.-L,i. • 61 53 55 277 325 320 16,:633 17,225 17.600 N.Y,.Up-State 97 54 51 186 250 260 16,486 13^500 13,260 Pennsylvania 118 64 62 178 225 210 19^466 14,400 13,020 Wûst Virginia 25 1^5 15 101 _S'0 90 _._ ¿,496 1^350 lj.350_ 3 EA'STERN 527*6 367,3 ^ 370|1 252^3^ ^^Í<^Í ^îj't L^l'9ßl^ 107,779 nO.,858 Ohio '^ 49"" ^2A "" "^24 ' 166"" "" "^ 200 "" 200 7,170^' "^ 4,800.' 47800^ Ir.diana 28 12«0 12.5 163 210 245 4,109 2,.52Ó\- 3.062 Illinois 17.0 ' '6,5 5*5 93 80 75 1,49? 520".. 412 VU^hlgan 130 56. 58 132 185 185 16,036 • 10,36C/ 10^730 Wisconsin 107 - 56 61 131 215 235 12,363 13.040 14,335 ?4innesota 140 68 78 130 18Ó 160 1Ç,792 12,240 12,480 Towa, 23 10 7 112 125 90 2,483 1,250 630 North Dakota 136 80 94 151 1:80 165 19,744. 14,400 1^,'510 South Dakota ''26 11 l2.5 103 130 150 "2^458 1,430 1>875
9 CENTRAL elöTo^ ^ l^l'^l 11^1*1 I I^I^I I J^I}l\7}F}J}7 ^î'^îZ^l'^'^é^^ Nebraska 58 ""30 28 182 ^ 235 209 10tl46'^ 7,050 5,852""" Montana 14.9 1G<,0 10.5 168 230 215 2,391 2,300 2,258 Idaho 160 138 153 253 310 300 40,236 42,780 45,900 Wyoming 11^0 " .6*9 6.1 184 220 230 1,946 1,518 1.403 Colorado 71 50 54 253 385 335 17,598 19,250 18,090 New Mexico > ''2^8 ,8 .6 106 100 125 270 80 ' 75 Utah 15,1 12.4 14*0 199 255 245 2,981 3,162- 3,430 Nevuda 2.4 1*7 1,7 216 310 320 497 527 544 Washington 34 26 28 310 400 400 10,310 10*400 11,200 Oregon 42 33 37 270 345 320 11,214 11,385 11^840 Cbilifornia l/ 39 42 4£^ _ _338 .400 _ SgO 13,167 _ 16^800_ 15j^l20_
11 WESTERN ' 450_^3 350.8 ^ 37 4*9 £49o£ J^_328^5_30ej^6^il^0^654^ l}l'^^J'h-lJl'KL^
2S ÍATS * •.- ' ' ' ' .' ,/. •' "' ' - ST4TES 1,634.0_ it041^^6_lj_097^5 ;^6^6 ^271 ♦S_264ji^6_320^330^ Í^l*£^i ^^L'^Ë,'^^
IH^SRMEDIAt»' STATES r>>- -,. ' " :' . . " ' "^ New Jersey 54 , 26.3 24^, 6?" 218" 185 265 . 11,226 4,866^ 6,519 Delaware 3*4 4,9 6.6 114 176 269 * ' 394 . 862. .^775 Maryland 14^3 6.4 6.6 125 122 132 1,703 781^ 871 Virginia 59 34 36 ' 148 138 175 8,359 4,692 6,300 Kentucky 34 . 19 17 92 82 87 3^,125 1,558 l.v479 Missouri 25 ' 12 11: 111 90 62 2,711 1,080 682 Kansas \ _ 15^0 ], JÍ 3_i_5 95 _55 38 _ ¿^^#104 220 _i33_ ""? INTERMED. ^ '^ ';•*'" -'■.."'
STATES ^204^8 iOÍ*Í _ IP^^l ^ '^^l'h JLZI^J.6B^^^[26^922 ^^^^^T^:¿7t^_ 36""LATE à INTERMED. ' .. ""
STATES 1,838*7 1,148o2 1,202.8 200*2 ' 258*4 256.2 349,252 296,650 308,163
TOTAL ^ ' . • . , -. U.S. ,2,265^2^^ 1,401^.9 1_,508,3 ^. Í^Í*^£ ^249 ;0__24?*8 4n^007 _349^0£8^37 3/711_
1^/ Early & Late crops shown separately for Calif «<? combined for all other states >' As published by the Crop Reporting Board, Washington^ D« C., December 17, 1953«

Page 2 Table No^ 2 ' . -• .•;•■'.-.,. v ]PaSÀTOES| (IRlSH)r PBODUCTÎON^ AND FARM DISPOSITION IN THE 36 LATE AND IITTERMIODIATE
STATES. CROP bF:i9-53 (Preliminary)
• . • c " . i • '■■■•' •; i I ' .V ' . '-'**. INDICATED j FARM DISPOSITION
GROUP AND STATE PRODUCTlON^f.^J tf lÍlí' (Used and ^ •saved for»
Sa-v-ed fori seed on }
» Percent • Í of
^ ^stock, shrink* -1 farm i farms i Quantity Í Crop ^ * ^^§®• ^^^ loss ihousehQ-Jdi wh^re 1 I ■ •-..
. . .' 1 -, '. rafter harbest j •-■used; ; grown 1 • ^:. s ■• '; £■ ' . " thousand Bus bels - Percent
LATE-STATES^ - '
Maine 57,720 lr731 474 2,953 52f562 '' SI New Hampshire 1,071 59 128 16 868 . , 81 Vermont 779 43 211 67 458- 59 Massachusettô 2,088 115 .132 5 1,836. 88 Rhqd^'Island 1,282 64 - 17 2 1,199- .94 . Connecticut 2,688 201 93' 6 2,388 '89 New York - 1*1* 17,600 457 . 56 126 16,961 96 Fe« York •* Bpitatel3|26u 1*326 ,806 - 678 10*450 79 Pennsylvania West_Vir£inia ,_
13,020 1,094 986 480 10,460 80 lj^350 n5 9i8_ _ 80 237_ 18
9 EASTERN _.^.._ 110,858 5,205 '2,821 4,413 " 97,419 87.9
Ohio -v"" 4,800 312" 726 ,." 118 3,644 ' ■76 Indiana ♦■^ 3,.062 306 376 ' 39 2,341 76 Illinoio * ' - 4râ B4 250 17 91 22 Michigan - 10,7 30 1,502■ 1(216 - 835 7,177 • 67 Wisconsin 14,335 1,434 1,350" 638 10,915 .-76. Minnesota 12,480 , 1,372 1,035 - 906 9,167 73 lo^a 630 41 298 31 260 41 North Dakota 15,510 1,318 550 ■■ 1,125 12,517 81 South Dakota 1,875 187 304_ _;_ 78_ _ .- _li.306_ 70_ 9 ' CENTRAL \^ 63^834 6JL526 ^6,105' 3,787 * 47,416 74,.3.'^ Nebraska 5,852 497 420 , Í258 4,677 -; 80^ Montana 2,258 373 143 125 1,617 72 Idaho 45,900 4,590 • 240 . . 1,716 39 »354 86 Wyoming 1,ÍQ3 238 . 32 62 1,071 :76 , Colorado 18 »,090 2,261 ;'120 1,161 14,548 80. New Mexico ..75 6 . 9 .2 .58 ■ 77 Utah 3,430 446 , 99 112. '2,773 . .81 Nevada 544 , - 54 , '.' 21 ' ' , -¿Ô'; '440 ': 81 Washington 11,200 1.904 156 76 9,064 81. Oregon 11,840, lt598 ;,,•.:-■■165 , , 468 • 9 ¡.609. 81:: California - La be 15,120_ --JS?- . ' '53 294 ■ 1:3, |51 92_
11 WESTERN 11.5_L712 i'SjLÖ?^.. I 290.404 34,6Í5;~
.1,463. 4,.303 _ "97,072 84,4" 2ár^LATE SPATES _ -^i'l^i -I' _ _^2^%3_ _241_^90?_ _ Í2i3_^
INTERMEDIATE STATES 1' ,:x ♦ ' ^
New-Jersey 6,519 v; 373 •: ' 1 52 53 6,036 ■93 . Delaware ... 1.77.5 72 54 18 1,631 92 ■ Maryland V-. i : . 871 31 ■■ 188 22 630 72 Virginia Kentucky
6,300 - 208 ■ 595 ' 57 5,440 86 ■ ■ 1,479 81 "980 48 370 25 "
Missouri 682 ,. ,. 31 : vj567. .. - 8 76 ■ :11 .. Kansas _ _;: _133^- _ ■_ ■i2_ ._ '-.-•Uo _ " 4 _ 27 20 _ __■ 7 INTERMED. STA TES 1.7,759 813 ~ 2,526 . _ w J'lP-. 1-4,210 _ 1*^JL°_ _ _ 36 LTTE & INTER *• ■""'■■*'•
- ~ MEDIATE STATES^ _308_j_l63 IhSL^^ _ 13,915 _ 12,713 256,117 83,1
mm. —» ^-« •« — •- . — «i» — —
l/ Consists of potatoes BQld ijnd to be so,Id'for all purposes^ including food^ seedt "■ processing and aivestock^eedç -- -- .' ; . ¿ '' .

TABLE mt 3t POTATO ACREAGiil-HAEVESTED. IN 16 LATE PHODüCIIiq-. STAÍL^ES ^ÏHOUSAliD.^CRES :'(000) OMITTED^'
STATE 1946 ,1947 1948 1949 1950 1951
CAGE^3
1952 1953
California * 38 . . 34 41 45 44 ^, 32 Colorado 86 ^74 78 66 56 . :'. 45 IDAHO "■* 178 ,-. 130 150 144 164 .' 134 Maine V 219 ' .. ' 184 193 \ 149 132 103 Michigan 149 ;: .118 -109 '104 85 60 Minnesota 151 : 121 .:::;108 :100 93 70 Montana' . 17 . - ,. ' 13 ;;^ 16 ' ,'15 12 10 Nebraska '■' 67 ' ^: 52 '/, 53 52 43 30 Nevada' 3^2 '■ 2,3 ' 1*8 1^8 1*6 1»4 New York @ 176 .. 142 146 130 110 , 102 North Dakota; 150 •• 128 125 . 109 112 82 Oregon 52 ' 38 ^ 41 41 38 34 Pennsylvania 127 - : 109 '105 103 83 69 South Dakota 29 23 - 22 .. ' 18 14 11 Utah 18 13*5 : 15,1 15,4 13,5 11,3 '.'Tash'ington 44 ■' . : 35 . , 40 . \ 36 31 29 Wisconsin 113 ' . • 96 ' 87 ;.-• . 80 67 53 Wyoming 12,4' ' 10,5 12^0 11 -' 7^5 6^5
TOTAL 1629.6 1323^3 1342*9 1220o2 1106,6 883á2 945^0 1001,8
TOTAL U^ S. 1598,5 2100»9 2109,3, 1901^3 1696*4 1353^ 6401*9 1508*3
l|l< # *. H^ tH.ï ijf. <|- j^
TABLE NOt 4t POTATO YIELDS PER ACRE IN 18 LATE PRODUCING STATES BUSHELS!
STATE 1946 1947 1948 1949 1950 1951 1952 1953
California. . ■. 350 .'365 360 360 400. 400 360 Colorado , 230 2:50 275 275 325 255 385 335 IDAHO ,255. . .220 300 • 240 300 280 310 300 Maine ,558 a-,350 ,385, ■ 450 480 445 360 370 Michigan. ■Ï^Z ■ 105 • • X :150 • 165 180 .180 185 185 Minnesota 115 140 •-• 160 160 175 170 180 160 Montana .130 . 145 160 , 140 225 215 230 215 iîebraska 175 ,. 155 195 " 170 260 200 235 209 Nevada 210 ■ 210 200 190 260 . 260 310 320 New York 244 245 268 235 320 , '27 5 285 270 North Dakota' 125 - 160 160 ' ;; .170 190 ■ 190 180 165 Oregon 260 250 310 290 340 . 330 345 320 Pennsylvania 158 165 185 . 186 240 . 236 225 210 South Dakota 88 ■■' 85 125 i 56 150 150 130 150 Utah 185 ■; 185 210 . ;195 245 205 255 245 Washington 230 . 280 , 315 280 380 400 400 400 Wisconsin -. 105 105 i ■v ; 150 170 200 185 215 235 Wyoming 205 195 - 190 170 240 185 220 230
AVERAGE ■ ABOVE- 18 . 204,4 204»5 243,2 . .237,8 283*2 267,6 269.3 259.9
♦California Late Crop Only^. © Inc'ludes Upstate and Long Island^ New York^, #By Crop Reporting Boards
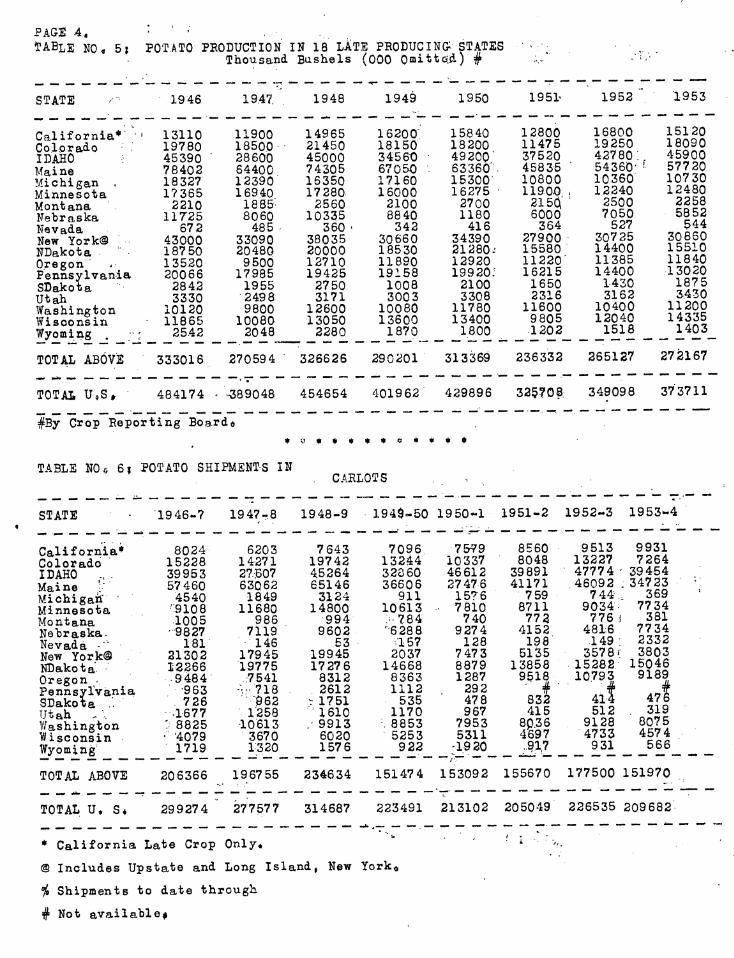
PAGE A, TABLE NO. 5j POTATO PBODUCTION IN 18 LATE PRODUCING STATES
Thousand Bushels (OOO Qmiiiteß.) #
STATE 1946 1947. 1948 1949 1950 1951- 1952 1953
California* "' 13110 11900 14965 16200" 15840 12800 16800 |5120 Coloreo 19780 18500 21450 18150 18200, 11475 19250 18090 IDAHO 45390 ' 28600 45000 3456-0 ' 49200 37520 42780.. 45900 Maine 78402 64400 74305 67050 63360' . 45835 54360; '- 57720 Michigan . 18327 12390 16350 17160 15300 10800 10360 10730 Minnesota 17365 16940 17280 16000 16275- 11900, 12240 12480 Montana 2210 1885- 2560 2100 2700 215dl ' 2500 2258 Nebraska 11725 8060 10335 8840 1180 6000 7050 5852 Nevada 672 485 360 ■ 342 416 364 527 ^544 New York® 43000 33090 38035 30660 34390 27900. 30725 30860 NDakota 18750 20480 20000 18530 21280.' 15580. 14400 15510 Oregon- - 13520 9500 12710 11890 12920 11220 11385 11840 PenEsylvania 20066 17985 19425 19158 19920: 16215 14400 13020 SBakola 2842 1955 2750 1008 2100 1650 1430 1875 UtaS 3330 2498 3171 3003 3308 2316 3162 3-430 Washington 10120 9800 12600 10080 11780 11600 10400 11200 Wisconsin ■ 11865 10080 13050 13600 13400 9805 12040 14335 Wyoming . _ ■_r _ _25^42 _ _ 2048 2280 _ _ 1,8?0 1.800 __ _ 1202 ^1518 _ _ 1,403_
TOTAL ABOVE 333016 270594 326626 290201 313369 236332 265127 272167
TOTAL U,S » 484174 - -389048 454654 401962 429896 325708; 349098 373711
#By Crop Reporting Board« «a«*««««***. *
TABLE NO6 6î POTATO SHIPMENTS IN . CARLOTS , , .
STATE 1946^7 1947-8 1948-9 1949-50 1950-1 1951-2 1952-3 1953-4
California* 8024 6203 7643 7096 75V9 8560 9513 9931 Colorado 15228 14271 19742 13244 10337 8048 13227 7264 IDAHO -. . 39953 27507 45264 32360 46612 39891 47774 ■ 39454 Maine '■ 57460 63062 65146 36606 27476 41171 46092.34723 Michigan- 4540 1849 3124 911 1576 759 744. 369 Minnoiota '9108 11680 14800 10613 ■ 7810 8711 9034^ 7734 Montana 1005 986 994 :-784 740 772 776 f 381 Nebraska. -9827 7119 9602 '6288 9274 4152 4816 7734 Nevada - 181 146 53 157 128 198 149; 2332 New York® 21302 17945 19945 2037 7473 5135 3578f 3803 NDakota 12266 19775 17276 14668 8879 13858 15288 15046 Oregon -9484 ,7541 8312 8363 1287 9518 10.793 918? Pennsylvania 963 •;,•• 718 2612 1112 . 292 ' # é SDakota '. 726 -962 -1751 535 478 832 414 47( Utah ■:. --1677 1258 1610 1170 967 415 512 .319 Washington : 8825 10613 .-9913 8853 7953 80.36 9128 8075 Wisconsin • 4079 3670 6020 5253 5311 4697 4733 4574 Wyoming Jl^î. Í^l° '^1^1 .^Í^_ _ wi^_ _ ^1 î i - - - -
TOTAL ABOVE 206366 196755 234634 151474 153092 155670 177500 151970
TOTAL U, S« 299274 277577 314687 223491 213102 205049 226535 209682
* California Late Crop Only« * '1 „.
@ Includes Upstate and Long Island, New York«
^ Shipments to date through
# Hot available»

PAG-E 5i. TABLE ^0* 7i ACBEAGE» OELD PER' ACSEJ PRODUCTION., AND SHIPMENTS-.-1DAHO 'POTATOES
.,., ?^ ;_^ /. .. • PAST 10 SEASONS '--M,
SEASON •,: ACREAGE#
Acres
YIELD P5:R ACRE#
• Bushels.
1944 ^ 170,000 : ':. 2^0
1Ö45 . 200^000 ,\'f- 225
1946 178,000 255
19 47 130,000 220
1948 '• 150,000'• « ' •.:..:. 300,,..
19'49 ' .' v.: 144^^000^,. ,250.
1950 158^000 ' ' 295
1951 ^ 13.4,00a ., . -280
.1952 138^000' ' ;' ; 310
1953 153,000 - ' - - ' 300^ .
#By Bureau, of Agricultural Economics"^ - ... ;' '
- -■■- "■■ . . ■■,, ■ ''..■■■ • ■ .^
TABLE NO* 8{- CARLOT SHIHÍENTS OF IDAHO POTATOES BY MONTH (CAST 8 SEASONS)
BSC^UCTIOîI# CAELOT SHIiMEHTS
. ;'-'rBu sha.l s ■Cars
39^100,000 34,065
45,000,000 .4L, 8-20. i
45,380,000 39,953.
28,600,000 27, 607 • ;
45,000,000 45,264
3.6,000,000 *■■ 32,860 ■
49,20,0,000 46,612
37 ».520,000 39;,891
42,-780,000 47,774
45,900,000 • 39-^454
, MONTH. 1946 '. Í947 1948 . 1949 •' 1950 .1951 1952 .. 19 53^, ^^.^ — — — — ^ — . — — :-. — ■ — ,-- — —.. — —
. July August September
.' Ocliober
1537 1331 985 987 643 -■ ■889 1-059. ■■ •■ 732 1554 1-109 ' 2070 .. 2284 1212 1910 2073 . ■- 1824 3947 3007 458 3 3522 • 3062 -2662' 47 35 2165 4840 3903 5623 4211 4657 5284 ' 6807 • , 5554
November 4870 ' 3846 . 5345 4337 5437 ,v6342 5339 • 4901 December 4254 ., ■ 2767 5447 •. 3806 5222 ;:5683 6182 5435 Jauúaífy .4395 5957 • 4741 4325 6059 -,4'184- - • 6998 6269 February March
4103 30'80 3931 3781 - 5140 ,■ 5313 5293, 4420 4235 . ,3169 .. 6596 4866 6 408 4842 • - 5582 ,. 6110
April May June
4335 -■ -1214. - .4^75 4lSl 5410 2399 2888 1790 ... 214 1556 1286 28 53 ■ -352. 807 •
94 ■' 19 ■: 12 91 509 29 21 ■' ■ • _, . «« — — - — — -T - . ... 1i^ „^ „^ m^ ■ — — 7- -r-.--^-' —
TOTAL 39953 .;•'.'■ 27607 45264 ■ 37 627 46612* ''39891 47774. ;■
TABLE NO* 91 'TRUCK MOVÀENÎ OF IDAHO POTATOES BY MOOT H (OÁELOT Ei^UIVALEOTs!) l¡ YEAR"" "JAN^ ' !PEB'" MAE APR MAY JUi 7 ^.JUL . .AUG SES' OCT NOV: DEC ~ ."TOT*"
';" 1949 •' 209 203 223'/ 21Ö 84 '3 '28 ,62.;, 164 257 248 228 .1927 •^ 19 50 280 307 356- .363. 235 •24 20 . 64-,: 246, 260 384 . 382 29 21
1951 260 362 '357- 234 324 69 • ;.- 43 - 13 40
■ 98 - 175'. 312. 343 335 2912 1952 317 418 '292-' 207- 34... ' '99.:"'- '340 406 440 507 . 3103 1953 541 475 430 265 122 7 25 69' - 166 372 448,- 530 .- 3490
• 1954% 509^. - 47 6, ' 474" . _ 1 -^ _ .'_ ^ I. _ — J1 _ — — > ., *
. »mm wmm ««• _ i
^ij^res for 1954 inco.eiplete. Shipments to date through April 13^ 1954^ subject to'^correction^" ^^ • - ^. .. . " * '- t-: -
<: * l/ figures represent inter**state movement only^ intra-state not shown* Figures "compiled from data furnished: by Jederal-St^te Inspection Servicei>
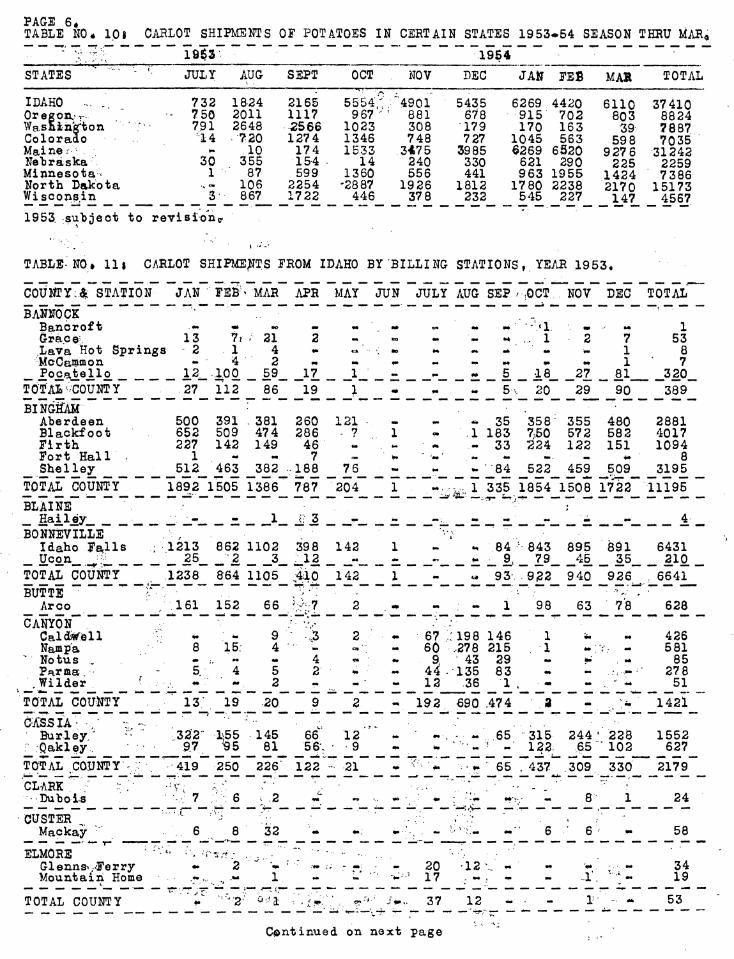
PAGE 6* TABLE NO 4 101 CARLOT SHIPMEOTS OF POTATOES IN CERTAIN STATES 1953ii.54 SEASON THRU KÍAR^
- '.- -r. •:. 19$3 19B4
STATES " "■ " '' JULY AUG SEPT OCT NOV DEC JA» 7ES MAH TOTAL
IDAHO •^. . 732 1824 2165 5554;:. ''4901 5435 6269 4420 6110 37410 Oregoiv>r-. Wasûlâ'giion ■' ■-
' 750 2011 1117 967" 881 678 915 702 803 8824 791 2648 2566 1023 308 179 170 163 39 7887
Coloraao 14 720 1274 1346 748 727 1045 563 598 7035 Mainer-. »• .10 174 1533 3475 3985 6269 6 320 927 6 31242 Ne'bráska 30 35S 154 - 14 240 330 621 290 225 2259 Minnesota ' 1 87 599 1360 556 441 963 1955 1424 7386 North Dakota ," 106 2254 -2887 1926 1812 1780 2238 2170 15173 Wisconsin 3' 867 1722 446 378 232 545 227 147 4567 1953. subject to revisionc
TABLE-NO » 111 CARLOT SHIPME;NTS FROM IDAHO BY BILLING STATIONS,. YEAR 1953*
COUIÎTY:,* STATION JAN ■ FEB- •MAR APR MAY JUN JULY AUG SEP > ■ ,OCT. NOV DEC TOTAL
BAîmOCK Bancroft . *• m •o . «» ** V» *m m ' •-'>1, 1W «* 1 Grace, 13 7, - 21 2 - u M '«• •♦ ,. 1 2 7 53 Lava Hot Spring! i - 2 1 4 ** .:* •■ *» K 0* •» « '«■ 1 8 McCatamon > ' 4 2 *• *m «I» •« •^ #♦ fw ** 1 7 Pocatallo 12 .100 59 17 1 «• ,. f» 5 18 27 81 320
TOTAL'COUNTY 27 112 86 19 1 m *• ém 5-.. 20 29 90 389 BINGÖAM
Aberdeen 500 391 . 381 260 121 - «• *ié 35 358 355 480 2881 Blackfoot 652 509 474 286 ^ ? 1 «• 1 183 7,50 572 582 4017 Firth 227 142 149 46 ^ ». •>• «• 33 :á24 122 151 1094 Port Hall . 1 ~ - 7 cm ¥• ' -«' ^ «I* 4* 8 Shelley 512 463 382 • 188 76 - ^ •• •84 522 459 509 3195
TOTAL COUNTY 1892 1505 1386 787 204 1 , - ■ ■■ ¡¿i-l 335 1854 1508 1722 11195
BLAINE il—•)
■ . Hailey ■ ■ ■ « - 1 í; 3 . à.
-■... «.* •# ~ '• •* 4 BONNEVILLE
Idaho Pajlls ; 1213 862 1102 398 142 1 _ M 84 • 843 895 8âi 6431 Ucon _^:^ 25 2 3 12 m» -*• « ¥* 9, 79 45 35 210
TOTAL COUNTY 1238 864 1105 ,4^10 142 1 » <* 93 932 940 926 . 6641 BUTTE ~ ^ '■' ■, ■ . ■ ■"- '■-' ,
Arco 161 152 66 '.::'■; 7 2 . - - : •* 1 98 63 78 628 CANYON
Calás!^.oll 4>« 4» 9 .3 2 ' 4m 67 . :i98 146 1 ÍM P* 426 Nam pa 8 15. 4 «3» ' ■ m 60 -278 215 1 *• ••;. •* 581
' Notus , M ^ m 4 «» ' «w % 43 29 *• if>' : ^ 85 Parma. 5. 4 S 2 «• M U - 135 83 •• *•
.::••••* ■ ' 278 .Wilder ^
■ "** - 2 - - 13 36 1 , - 51
TOTAL COUNTY 13' 19 20 9 2 «* 192 €90 .474 3 - , •• 1421
ÓASSÍÁ- ■/ -: -. Burley.' 33'2- 1)55 145 66 12 *m ♦• • . ' ' m .65 316 244 ' ' 228 1552
: Oakley. .9.7 ^5 81 56'- • -9 «I» tM ■i 122 .6,5 ' ■ 102 627
TOTAL COUNTY - .. 419 250 226" 122 - 21 m *• ": • ^ 65 , 437 .309 330 2179
CLARK "^ ~ ~ :.-: ■ •■ r ."• / ■ ' ■- - --•
• Dubois 7 ;'/■: 6 ; .2 *m •» •* ' 4» ' -^ ♦*"T' - 8 1 24
CUSTEH , ■ '.C »' - .' . ■
Maokay "' - .. 6 8 32 «» ♦•.■ •• •• ■ *•
'■■: ' ■.'.- ••' 6 • 6 •• 58
ELMORE tj ; ".^ ; j '"i.i ■ *- ■ . .
Glenn Si ..-Ferry «» 2 •» ■ .'♦# - :, - m: « 20 •12 w* •# '«* .... - 34 Mountain Home .*• -,.
.. 'r 1 *• - '♦.-• ^ 17 . *♦ «I» - ■ ï. , ** 19
TOTAL COUNTY ■'"■2- o-..'.i •• ' L r-. .' .-. ??'* J ♦• V 37 12 - —'-rr;
- _ - 1 '. «* 53
Continued on nQxt page
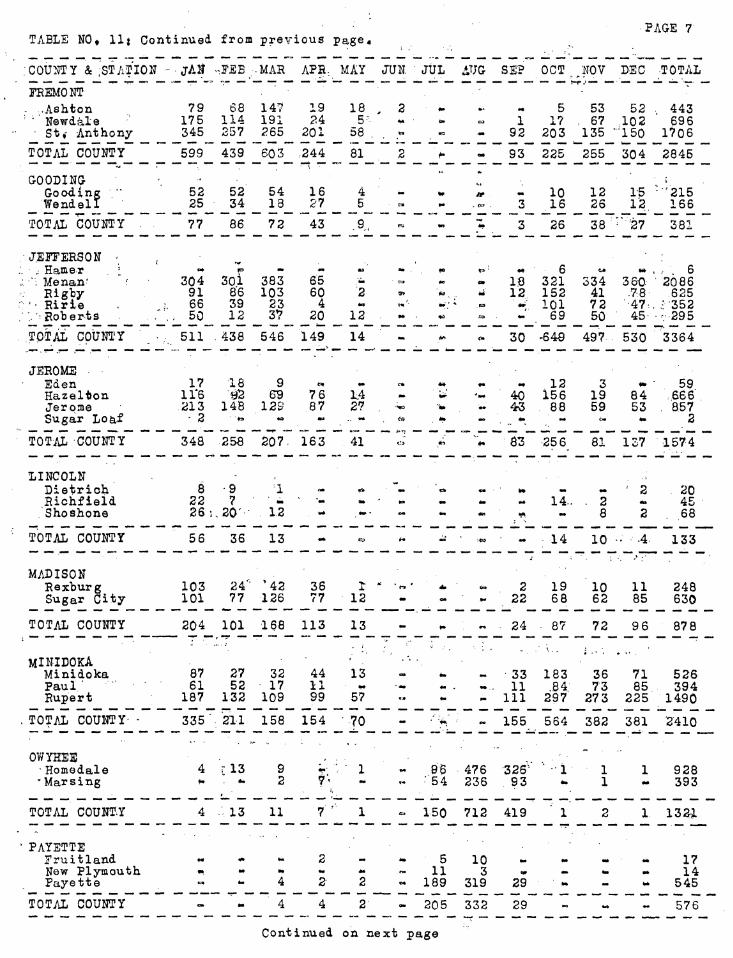
TABLE NO^ lit Continued from previous page^ PAGE 7
COUNTY & .STAIION ■ ■ jAH ^.FEE -MAR APH, MAY JUn " JUL ¿TJC SEP OCT. mV DEC TOTAL
FREMONT -Ashton
' Newdale • Stf Anthony
JEFFERSON . Earner
'^; Menan' Rigty
'- Rirle :. '■ Roberts
79 68 14^ 175 114 191 <^4 345 257 265 201
18 5"
58
5 53 52 . 443 1 17 , 67 .102 ' 696
92 203 135 -'150 1706
TOTAL COUNTY 599 439 603 ,244 81 2 ^ ^M 93 225 255 304 2845
GOODING Goodíng •• Wendell
52 25
52 34
54 13
16 27
4 5 z%
^ t» . pa . 3
10 16
12 26
1-5 1'2.
■■'215 166
TOTAL COUHTY - 77 86 72 43 .9,., m «» ém 3 26 38 "" '27 381
304 301 383 65 91 86 103 60 66 39 23 4 50 12 37 20
2
12
14
18 321 334 360- 2086 12 152 41 78 625 '4 101 72 47.. v 352
69 50 45 - 295
TOTAL COUNTY 511 . 438 546 149 30 '648 497 530 3364
JEROME - Eden Hazelton Jerome Sugar Loaf
17 ire 213
18 92
148
g 69
12S 76 87
1.4 2?
■ 2 ■ '^ *a *» ,. «-*
40 43
12 156
88
3 19 59
<• ■
84 53
59 666 857
«• - M *• 2
TOTAL COUNTY 348 258 207 163 41 Ö3 256 81 137 1574
LINCOLN Dietrich Hichfieid Shoahone
8 9 22 7 26 1.20' 12
14.. 2 8
2 20 45
2 , 68
TOTAL COUNTY 56 36 13 «• o ■#* « * ■■K>9 • - 14 10 • ■ -4 133
MADISON Eexburg Sugar City
103 101
24"' 77
•42 126
36 77 12
■ t9 * ém 2 22
19 68
10 62
11 85
248 630
TOTAL COUNTY 204 101 168 113 13 - ♦• ■ " - 24 87 72 96 87 8
MINIDOKA Minidoka Paul' Rupert
87 27 32 44 61 52 17 11
187 132 109 99
13
57
70
- 33 183 -.. 11 ,.84. - Ill 297
36 71 526 73 85 394
27 3 225 1490
TOTAL COUNTY- 335". 211 158 154 155 564 382 381 2410
OWYHEB 'Homedale 'Marsing
4 r 13 9 ^ . *. 2
4 . 13 11
7'
7
96 476 326" 54 236 93
1 1
928 393
TOTAL COUNT.Y - 150 712 419 1 132i
PAYETTE Fruitland New Plymouth Payette
2
2
-5 10 ~ 11 3 ^ 189 319 29
29
17 14
545
TOTAL COUNTY 4 4 2 - 205 332
Continued on next page
576
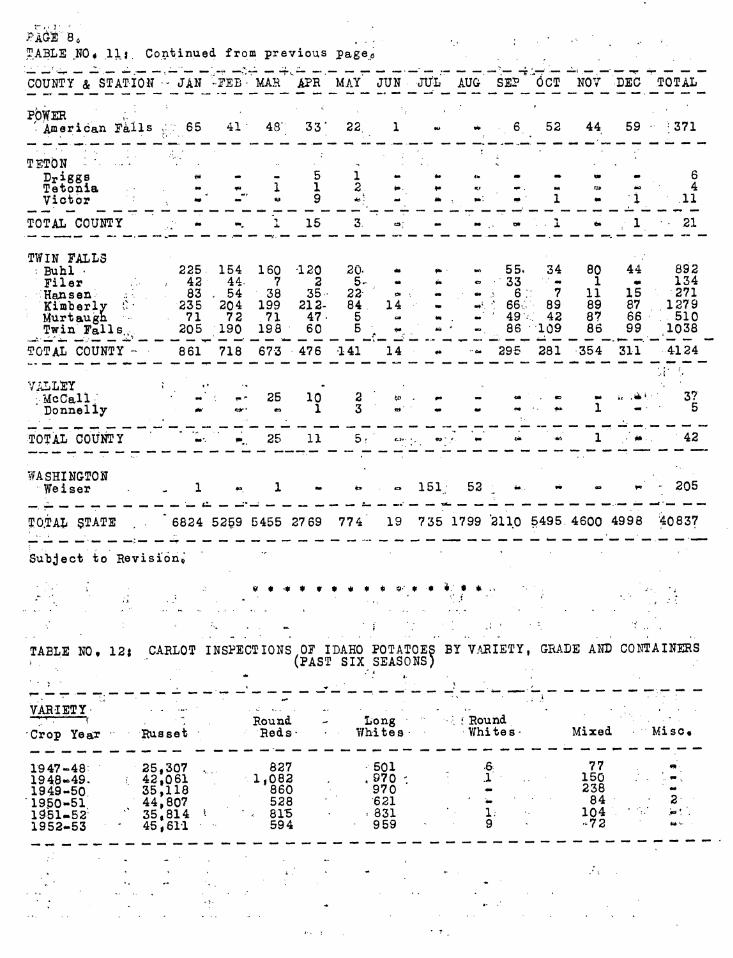
TABLE NO^ llî. Continued from previous page.ö
COUNTY & STATION ■ - JAN •TEB ■ MAK APR MAY JTJN JTJL AUG SE? OCT NOY DEC TOTAL
pbwîs '• Amarican Falls ¡: :;: 65 41- 48' 33; 22. 1 M> «è- ■ 6. 52 44 59 ; 371
TETON - Briggs Tetonia Victor
5 1 9
1 2
6 4
11
TOTAL COUNTY 16 21
TWIN FALLS : Buhl ^ Filer Hansen Kimberly t^- Murtaugh Twin Falls.,^
TOTAL COUNTY^-
225- 42 83
235 71 205
154 160 44. 7 54 38
204 199 72 71 190 19 8
120 2
35 212- 47. 60
20. 5^
22 84 5 5
861 718 673 476 141
14
14
55. 34 80 44 892 33 -' 4M 1 m 134
6:: 7 11 15 271 66v 89 89 87 1279 49 • . 42 87 66 510 86 ■ 109 86 99 ,1038
296 281 354 311 4124
«* «? mé i< .¿'. 37 «• f*- 1 « - 5
VALLEY ; McCall; Donnelly
25 10 1
2 3
TOTAL COUNTY ••*. ■ ».. 25 11 5- ' CJ»- « - / •• •• •> 1 ■ *» 42
WASHINGTON Weiser 1 1 M» It» . ^ 151; 52 ^ *. - - H -; 205
TO.TAL STATE . . * 6824 5259 5455 27 69 774 19 735 1799 '2110 5495 4600 4998 40837
Subject to Revision^
« 4r ^« * * 4» « 4> ^^ «<^ « « Üí. • «.
TABLE NOt 12i CARLOT INSPECTIONS OF IDAHO POTATOES BY V.'^RIETY, GRADE AND CONTAINERS > , (PAST SIX SEASONS)
VARIETY- ;. '^ ■ —<
Crop YeaT Russet Round Reds-
Long Whites
Round Whites- Mixed Mise«
1947-48: 1948^49, 1949-50 1950-51 1951-52 1952-53
25,307 42,061 35,118 44,807 35,814 45,611
827 1,082
860 528
. 815 594
501 .6 77 . 970 -.
^. 150 970 mm 238 621 W 84
■ 831 1; 104 959 9 ■'72

TABLE NO» 121 Continued from previous p;age< PAGE 9
GRADE Crop Year, îotal Cars ÙSEXTHA Ut S^ '^Stan- U* Si
1947^48 1948-49 1949-50 1950^51 1951-52 1952^53
CQíTAIíEB
Crop Year
26j718 ^,264: 37,186 46|042
.37^565 47¿245
100 lb Bags
197 .. 365
:7"26 1,343
.• 643 .1,655
50 lb Bagó
18,388 30,964 24^931 34,481
•573 858, 87 3.
i689 34,401 .. i^by 18,786 .2,836 32,232 1,056
25 lb Bags
*15 tb Bagç
' 210 1,131.
422 3^374 5,950 5,247
10 lb Bags
2,745 2,427 3,815
105 '99
4,353 8,127 6,275 5>'5'06 8,640 6,795
252 388 142 €49 625 161
100 lb Mise, & Bulk Crates Mixed
1947«48 - 1943-49^ 1949*.50- 1950-5Ï' 1951*.52' 1952-53-
21,092 35,499
,26,895 30,^850
'28,622 32^991
• 538 • / 777
1 rl04 2^359
•2,166 .3,369
22 4 1
42 XO
8
33 23
8 39 .10
0
1,464 2p281 2,791 4,079 1,9,74 3i:a23-
"226 :318
17 369
. 0 • 0
3,-343 5,362 S',370 8,324 46783 7»054
15
Information in above tables-supplied by- Federal-Statue - inspection Servioe« «#«♦««4141
TABLE .NO«.-13i CARLOT cINSPEGOÎIONS OF IDAHa.POT-AÏOES BY YARIBTY, GRABE ATO ßONTAllTEBS •:-.: .\.i... (FOE YEAR 19&3;>' ■- • "'
VARIETY' . " JAÑT' yEB - MAR APR MAY JUN "T^-JUL ""^ AUG "* SEP "~ Oci" "" NOV "".DEC
Rusâets . ' 697:6 S433 5439 2769 758 l?" *a 539 2068 5525 4813 5324 Long Whites • Netted (?e'ms
•• 1 9 1 ' •o . M. . ll3 832 37 3 1 ^ :, 6 11 ■ 38 12 ■ ],'i *i. we ^
Rnund Reds '■ 2 1 m 1 mm ^ • 475 229 12 •» ♦• ^ llixoa. •* w 1 - «- ,• 4 75 11 8 1* *. !;!^ánominee ' «f« 1 'm'' _ •N» «¿ . tm -••' I ^ ^' ^ White Rose •• " «. . 1 w ^■- ' ^ ^, ' i" ^^ . ^ ; ^ Round Whites •■ *9 4 - - - hm - ■ Í - f- -
TOTAL niSPECTED "^ 69 84 5447 6491 2784- 757 17 592 1675 ' ."2129 5536 4814 '5'324
GRADE U*S. Extra NoÍ 1 85 89 . 64 . 28 '2 ,. ta. 35 409 Í66 ■■•381 204 288 U*S» No» 1 4809 3.771 3870 20 i9 519 11 .486 842 1183 3808 3286 3656 U*S# Nop 2 IDAHO StaAiaxds
919 635 626 312 76 3 9 ^ 172 337 ■ '49'3 565 *599 103 133 152 81 ■ 16^ 1 V '^ 17 145 90 80 ; 85
IDAHO Utility 3- 1 3 >. ,*!• ^ ■*»• «»
Mixed = Grades 995- ■. 795 735 330. 139. 2 6J. 234 29 i 762 678 695 Unclassified m ' - w ^•.
*»■- ■» m , ym ■»
Percentage - 6 1 —■■ ' "i •í •^■' 3 3 m #b ; 1 Fail to grade 1 ■ 4 3 1 ■' * ^ 1\ / *» •» ^ 1 C^rtiflxjd Sieed • & 7 37 11. ■ 5 ta r*" !>^ .'•; . * ■ . 2
^ - ■»
Condition only 2 V ■ ^
> 2 • • 4 .'■ .^■ ^\ .
. t«
•■—" r~ — -. — —. — — - - — ■— — —' 'i— —. — — "T- '— "iv." i-»-* i-W
« -•? «^ — -~ ■ „^ -I'"
CONTAINER'S '■ * ' '
• - • * ■ '
'"^ ••
100 I Bag-S' \ 4321-' 3 426 3784 1986 642 16 :533 1505 1505 3655 3048- 3258 50 f Bags 540 408 391 223 31 1 16 ■ 62 178 500 486 %IZ 30 f Bags 4 3 1 1 «* ^ '^
Í* 1 ' '4 25 1 Bags . .... - ,. , •• . 1 ♦» •*. . .. ^ «• *4 2 10 1- 1 15 # Bags •* #« m 4» m f» ^
■•*> . ••
10 f Bag*6. 7.71; ■ 57^9 •528 205 : .-g?--.'.-- *» _ . ■■ ■ 22 ■.-. ^
'124 416 Ui- "587 5 # Bags - 6 '5 ,; ï 5 ••■■•2- • \*. •• ^ i» "••■; 2
Mixed Containers 1342 10'25 ' r&i 367 ^T'-- in • 21 75' 32Ô" 955 829 1059
Information in above table supplied by Federal-'State Inspection Service«

PAGE 10» TABLE NO_j_ 1,4j_ Wî^KLY_SHIPlffiNTSJ:_PRICE_RANGE ^DAHO HUSSETS AT^SHIPPlNG P0I.NT£l9.53*»54Í
WEEK SHIPMENTS ENDING U.S. i IDAHO
^Oct« 3 3247 • ■v':69.6'- -O-Gt-«' ■ 10 4011 1190 Oct. 16 3458 .', 1070 Oct. 23 2881 ■; 1143 :Oct, 30 .' 2è34 ■1114 Nov« 6 ;• 27^54 ' 831 Nov. 13 -2:669 ■■ :•: £155 Nov. 20 ;2844 •■" 945 Uov« 21 2417 905 Dec» 4 2841 1025 Dec, 11., •2803 '■ 1025. Dec» 1Ô 2652 1073 Deo»^, 2,3 ,; 1615 • -605- Deb»' 31 2626 •• 934 J^aii» . 8- ' 4302 .; :/Ï572
• Jan* 15 4085 • ■'14.48 Jan^ 22 ' 3413 • .1:220 Jan« 29 • 3131 . , '957 Feb» 5 3428 : ; ■ 862 Jo-b, 12 3956. 1014 Veb-» , •19 ' 4050 ,, .. -gg?"^ Feb*- 36 3559 7 62 ;vig.r< ,/• 5 •■ 4231 1007 iviar,, . .12 •4063 . 1062 .. >iar| -^ 19 ■ 4687 1317 Mar « 26 4364 .1266 Apr, •2 ■ 4294 1065 , Apr, . 9 4045 , .978
SALES F*Oi.B. CASH TRACK
.100 lb sacks.
DELrVEHED SALES SHIPPIITCr POINT BASIS. kWD E.O.B-.o
_U^3^ |l^ _, JK^ VoS^_t2 _ _ _ loo lb sacks.
2'4Í0V3Í35 «65« »90 ¡.■■.■: 2,20-2t,50 :•: «85-i,,10v 2o00«2«45 %65- ,90' , 2,lÜ-2<,55. ,80-lélO
'Io90^2»45 •,65-1,00■ ■ . 2.05-2,55/, . ■ ■,,80'*t,10 ■ »i„95i.2,40 >x90-l,25 ...2* 10*2,50 .■ •. l,00f»1.35.- 2o05;2v45 1„20-'1(,45.' .■ . 2.10-2,60 ■• .l,20-r»5&;n^ 2,05-2,45 Itf25-lí:í5:'' ^ ■ • 2c15-2*55 - 1,25-1,55- 2,15-2,40 lc35*l,5"0 • ' • 2,15-2,60 l,35»lv5Ö^;,.. 2c0D«2*55 1,10^1»40 2,00-2c45 .1»25-1,55 i <, 80-2, 25 „90-16 25., ■: 2,00-2*35 1,00-1«30. .; 1„70<.2,20 »70-1 oco;,., 1,80-2,30 ,85-1,10 .lo60-2*05 ,70" «85 ' 1,70-2,20 ,80<.1,00 ■Io60«2o05 0 70'= *90 1,70-2.10 û80'-l»00 l,60°2p05 „70- «80' 1,70-2,10 ... ' , <.80'- ,95 1665^2^10 ioOO-l,iO .1,80*2,,20 ('■■ .li,10"lft25 1^65-2^10 1*00«1,15 t,.75-2,20 . 1,15*1«35 loeO^Î^OB 1,00-1,25 E',:70-2cl5 : :lol5-lí35" 1<,65-^2V10 1»15«.1»25 .iv75-2»16 '. a,20-1035- 1..Ö5~2,06 ia5"lo25 ,l,;75>.2ol5 1,2.5-1.440. 1 «75-2,05 ■. Ioi5".lc25 .1,75*2-, 10' • Ic 2-5-1 »30 l¿60«2o06 , : 1,15..1#25 ■ 1.^5-2^0 lo25-1,35
■.'Is55ii.2(,û5 1,10»1,25 ;95*I,15 .
1,65-2,10 1,20-1,35 lo40~l,85 li,50*lfl95":.- ■ lc05"l,25
.l,30»l«80 .,■¿80-1', 00 1,40-1*85 ,85-1,15 r,30"l,g'í) • .ff8Ô" ,90 ,4,45-2<,00 ,90„1,00 1,£5.>2<;10 -08O" «95 ':l,'6'5i.2,20 .85-1,05
'1.55"2„05 .70.- «90 1,70-2«2S ,80-1,00 '.1«80<»2|>30 ,70- i85-' l,95-2e40' ,75*1,00 ; :lo65-2»15 670- ,85 1,80-2,30 «75;- ,95
. I.S3 - =î.a7 1.0 1 ' í.A.¿
Shipment-figures subject to .Correctioaq ol.cS ^..Shlpmeûts iiicluding - .
ÎÂBLE HOr* 15-1 PRICES TO GROWERS, BULK PER C}VT, (SEASON 1953'-54) '
:?5miNG U,S> #1 UoS, #2 WEES ENDING U,S. #1
A/<:5-
U.S. #2
Oct« Oct4 001#..: Oct».
lie.'/,.
Hov., Deo, Sec« Dec, Deo» Deo, ■Tan^
3 10 16
•23 30
6 13 20 27
4 11 18 23 31
8
l,30»'l4 60 ,25 « l»40-l,70i ; »25 «> 1¿35»1,70,; ...•■,15" #25 i*4:o-ifl66;;. ■X\t>25f ,50 1 i 50-1 »75 : , .35- r50 1,40«1>75 • .40- «60 l»50'='l8 75. ,50- »60 1»25-1,50' m »50 1,15-1,50 ,30- .40 1,00-1<,35 . (,30- ,35
,90-ló25 «20- «25 .90-1,30 ,20- .25 ♦90»1,25 . »20- ,25
1»00-1,35 .25«. ,35 1,10-1,40 »25- .40
Jan 4 • Jallo Febo FeW Febijt, ■ Fe\i
Mar^
Mar ^. • Apr^ Apr*
15 V. 22 . 29,:.
5 12- 19 26
5 12 19 , 26
2 9
Ii00t.lo40 1¿1Q-Itr40 Io00^>lc40 lcl0<.ló-40
ö90-li»35 ,90-1^30 ^75-1,00 ö65-*liiU0 ♦ 75-loÏ5
lp00^1ö;35 lo00-l*.40 lt00-l»60 1^05-.1»50
.251.; ^40 i>ZO^ '#40' *30-? .v4Ö- ♦ 30^ ♦ 30- ■ e3ü-* s^25*-
a5- V^o'\ ,15- »30- ' ♦15-» ç25 ♦ 15- l3ö ' as- i3o
.o40
••¿40 «35
^¡0 Pripes in above two tables ào ncrfe include extremes of high a3ûd low tradings C^uotations apply, to stocks grading* size T^^ 2 inch and^ larg.er^ include Utility stock^^',. Shipment figures 'subject to obrrebtionc
U^ S% #2 quotati'eîls-;

■ • ^ PAGE 11« TABLS NO» 16» ffïJEKLY PRICE RANGE-PCrATOES AT CHICAGO (CAHLOT SALES, SEASIÔN 1953-54)
Extremes of High and Low Omitted V Sacked per owt»
WEEK ENDING
AEBIVALS
TOTAL IDAHO
.IDAHO RUSSETS • Washed
U.S. #1 U.S. #2
COLORADO McCLURES
U, S» #1
MINN-NDAK. y. S. #1 A
PONTUCS
Oct* 3 -265 26 3.60: Oct. 10 623 115 3,50- Oct* 16 565 .128 3,40- Octé 23 660 • M84 3,15- Oct^ •30 522 .:244 3.30- No V * 6 630 • :228 3o25. :NOV. -13 479 ; •187 3;45. .NoVé 20 645 .' 245 3,35. Nov, 27 499 . 241 3.45. Deo* 4 469 217 3.00- Deo« il 501 ■ 197 '3;00r,. DesC« 18 455- 178 : sao. Be Of,. .23. 383 - 166 . -3..10^ 'Deßj^ ■• •ais ;333 '147 ': -S.^OS. Jan* .-■8 C465 .1-46 ■ •á.as. .jçin-».. 15 578-• 223 ■3,15. Jan^- 22 604 266 • V3,05. Jant. 29: •573 241 ; -SilO- Tfeb^., 5 '659 leo • sao- rebl. 12 640 - 166 sao- ?;eb^. 19 666.: 185 3«25- ^•"OIDQ 26 516 16-7 2,80, î.ia,r é 5 530 174 2.55- vr^?. , 1? 449 188 2 »60. Mar# 19 532 169 3.10- Ma-r# , :2é 634 212 3.10 Apr*. ■ ... â 427 17Ô sao ÄT>r 4 9 489 228 sao
3.65 -2,00-2,10 «w M
5.90 m ' -m •• 4»
3»75 •^ «* « «» 3.75 - 2,20 . *» «■
3,70 • — .m ■■''*•» *■
3,75 *» . ' m •2,90-3,25 3.65 'M : «» - 3,00' 3,85 * : 2,75 ' - 2,90 3.75 2.40-2,70 2125*2«50 3.60 .2,20-2,25 " 2'85 3,45 2,20-2*35 2,85 3.65 2,25-2,35 2.60-2,65 3-« 55 2,15-2.25 2.60-2,70 •3,45 2,20-2,30 -•■ 2-, 20-2,85 3,55 2,,40-2<,50 ■ K 2,65-2«85- 3.55 2,.60'-2,65 2,70-.i2.95 3,45 - 2,55 -■" ' Nûf35«2»95 3,40 ' ,-•■2,55 2,60-2,85 3,40 ,.",-•:. 2,70 2.70-2,85 3,60 r2;65-2^70 2.40-2,65 3,55 '. * ;'2-,75 2.60-2.65 Sí 25 .2..45-2 ,60 - 2,50 3,25 ; 2c45-2.50 .• 2,50 3,25 2«25-2,40 •• ■>; ^
3^50 2,25-2,35 - 2« 40 .3.40 2a 5-2 <, 25 :- 2,50 •3.50 2.10-2,35 M «*
-3,50 2,00-2,20 •* m
2a0-2^60 1*90-2*60 2,25-?*50 2a5*2t55 2*20-2^85 2,3542,85 2* 30-2 «,50 2^15*.2t50 1*95*2^65 2^30-2460 2*15-2,40 2^00-*2t3'5 2^15-^2^50 2>l0-2<,50 2«10**2«50 2.20*-2^50 2 ♦20-2^50 2a5-2ft50 1*,90«*18*40 l.;85«2;*25 1*75-2^40 1,70-2*00 14 70-2^^45 1^65-2,00 1^75-2*25 l460^l475 l,75-.2tl0 1,75^2^25
TABLK -NO; 17> YÍEEKLY PHICE HANGE IDAHO RUSSETS AT I,OS ANGELES (SEASON 19Bä-54 100 Ib» saoks)
IfEEK U, S EîîDING 2 inc: Cet. ■3 *>•. . "0 01 i 10 *• Cet» . 16 'm
Cet, 23 2,85. Cet». 30 ■■ 3,00- IJov »■ . .6 3,00. Nov* , 13 2.75. i'TOT, ■ 20 2,90- NîT,.-'- -?7; 3,00- I'se« 4 2.25- ^^3 0 a: U ■ 2,40- Í.-Í3C,' la 2.50. -QC«. •23 ■ 2,50- 1-30, 31 2,50- Jan, 8 2,40-
(CARLOT end Sprit Cà.rlot Salea) tl .••■-^■Ui S, #2 WEEK lin. ■■•■/• ENDING
:3a0 -3 «35 ^3*35 -3»25; -3*25 -3.35 ¿3,20 ?2»9Q. -3.1Q -3*0ö' -s>oa- -3,00 -sao;
- 1,75
, 2,10-2,15 • ... 2,26
; ^ ^ 2i,25
"v i;50-2,00 1.50^1^75
: d^65*.l475 ' lt50-1^75
^ 1«60
Jan« Jan, Jan I Jebe ïeb» Tebt Feb# Mar 6 Mar, Mar, .Mar^ Apr, Apr,
15 2.40- 22 2,50- 29 2,50-
5 2,50. 12 2,50- 19 2,45. 26 2,25.
5 2.00- 12 2,00- 19 2,25. 26 2,45.
2 2,40- •9 2,40.
u, S» #1 2 inch min«
^sToö ~ -3.00 • 2,90 -2(^75 .2t85 .2,65 -2,75 • 2,65 .2,50 • 2*85 •2,85 • 2*65 .2,60
U,S.#2
2,00-2,10 2,00r2-tl0
1,75-.Í.90
- 2,00 1.75-2.05 1,80-1,90 1»95-2,10 1,85-2,15
- 1,80 1,65-1.85
« • « *

PAGE 12
TABLE NO* 18I WESKLY PRICE RANGE IDAHO RUSSETS AT OTHER EASTERN MARKETS (SEASON 1953^54 100 lb sacks)
WEEK KANSAS CITY • ENDING CARLOT SALES
U.S» #1 UoSö #2
S*T, LOUIS LESS CARLOT SALES
Uo So#l U^S» #2
DETROIT LESS CARLOT SALES
U^So #1 U*S* #2
OötV 3 Oct» 10 Oct.; 16 Oot, 23. Oct, 3Û Mvk 6 1ÍÓV» 13 K6v« - 2Ö Nov» 27 Ceo» 4 Deo» ■ li Deo. - IS B^io,' 23 Dec* - 31 Îaû» 8 Jaiû.^ .15 JäJir 22 iláil*' 29 Pe*, " 5 f%li .12 P«t*" 19 Pel) i Mai;"
26, 5'
M^t;;: 12- i9 26
APFÍ- ■•■■ 2; APF-
3#10-3o5& 3^15-3t,70 3620-3^55 3^10*-3r50 3^15-3<.70 3.00-3<56a 3#Û0c3r,55 3*05^3í>.45> 2*85**3o50 2*80*3í40. 2o80-3o30 ^ 2»7o*3é20 2,75^3,15 2^75-3^25- 2*85^3^35* 2*70*3o26' 2*70-3<,20 2,75-3o20'- 2»65i-3é20- 2,70-3*15 2^55-3510-^ 2«50«3¿€)0 2*35 «-gbBS- 2,45-3'#00 2^65w3ol5 2c65-.3(,10 2^80-3*30 2,85*.3*35
'1 Q8b^2ol0 1^90-2ol5 l,85t.2a0
2<}20^2cS0 2e45-*2^65 2,40«2d60 .3^15^2^50 2«15^2c30 lc85«2o30 U80«2i00 1<,85-1<595 1,75-1^95 Ií90-2c00 2^20^-2030 2,20«2û25 2 à 25«»2o35 2<,25*=2û40 2.25-2e,40 2*30.2ö45 2^25*.2»40 2^10-^2^30
' l(^90-2ol5 '-1^95«-^2ç05 -1^90-2^05 l,80«^l695 l#80<=>2o00
•1*75-1,95
3o7 5c;)i¿25 3o80r-4^00 3oS5..'4,0û-
.3'c65^3î>85 ^3*50-3^90 '3c50^3a85 .3<.50^*3t85 ,3o50<r>3<j85
3¿> 50-5475 3o50^4<>OÛ '3^4;0-»4<,OC 3,40-3^.65 3^35^^3,^60 3á55*.3,50 3o40-3o6Û 3c40-3o60 3 o 25<^^3, 5C* 3c25-3«50 3O15P.3O50 3e.25«*?3,B0 3O35«3950
.3Q 25^3^65 ^ 3^10«-3«65 3<>00-3^50
- 3ííl5«3ö50 3ö25«3a50 SoSS'-j'S^ 65 3« 35ö3c55
2^50^->2.75 2,50-2,75 2,40^2,70 2çZ5^2^5Q ^c35«2,75 2o35-3#00 2,S5-3oO0 2*05-3oOe 2(^60*3^00 2<,50-^2é90 2ç,25«2*75 2oä5-2,75 20;&5'*2#5O â«25^2<,50 2<,35-2e5C $0 35**2<i50
t2«^3Ç^2o50 j2ö50f'2o85 ',2^60^2^85 . è;^.65*>2i85
•' 2 0 50^2*85 :.-:2c60-2-a75 fj2,50«2o75
2^'^^0^2ci7S .3;^ 45.^2 c 60 2ç:40**2^60 ?c35^2*60 2 {j.25£».2o65
4oOO«4^25 4,00-4ç,35 3,75-4925 3 4 75^4025 3,75^4o25 3c75f.>4425 3^75-4^25 3475-4i>25 3,75-4ol5 3050-4015 3,50'^4a5 3,65*4t^00 3o65-4600 30 60^4-^00 3,60«4o00 3^70-4tj00 3o65-.4eOO 3,65*»4o00 S*i50-3o90 3^50^3^90 3,50-3o90 3,50**3485 3o50^3*75 3^40-3^85 3Q50**3485 3o60o3o90 3,60-4o00
2ô40'^-*2,65 2450-2,75 2,^50*-3^0û
•* 3ô 25 ^ 3»25
3,20-3o25 ^ 3^^5
'3oOO-3olO 2^)75-3,10 2650-3400 2^50-2075 2#50-2//5 2^,50-2^.75 3., 60-2,75
- 3,00 2*90-3^25 3^0û-3ol5 3,00-3*25 3,10-3o25 3,10-3^25 3í00<='3A25 3ç00-3(il5 2«75<^3,00 2,70-3,G0 2,65-*2o85 2,€0-*2,75 2,65-2.75
Prices quoted in ablove table are for washed Sî-JOCIC only^ * • . "
,t f « <i 1» « ^ 4i. « , «
TABLE NOi 191 IDAHO POTATO PRODUCTION, STOCKS ON HAND; JANUARY 1, AND SHIPMENTS TO AND FROM Janua'r-y Ift Past Ten Seasôûô« ^^;
CROP .YEAR
PRODUCTIONi SHIPMENTS TO JAN^ i| STOCKS ON •-«SHIPMENTS JAN, 1| (Thousand i i Percent a HAilD-Jan liTO END OF SEASON|
' Burshels)« CARS j of i(Thousand i ^Percent ' Í I Total Î Bushels; ft
TOTAL
CARS Cars ¡of Total? SHIPPED
4'9'43 - • 1944 ' 194B'
»19-46 * : 1947- ;-Í94& •4949- *19'&0 ' •1551- ^19f52- 1953
• 43,470 \ -v39ijl00 . - 45^000 ,''•• 45^390 * -28)^600 / ' 45^000
•. * 34^560 •.■ - 46«-610 •♦Í-- 3'2V520 »¿^.i42y780 •-'- 45V900
20,242 21^011 20^175 21,291 15,914 24r053 19,147 19,856 22^165 25,891 2Dí412
51 62 49 54 58 53 51 42 55 54
, 18,500 14,600 20 I, 620 23,250 12^000
. 20,720 , 16,720 ^ 16,600
14,040 . 19,010
r 20,000
18,764 13,054 21,645 18.662 11,693^ 21^211^ 18,480 27.756 17,726 21,893 19,032
49 38 51 46 42 47 49 58 45 46
39,006 34,065 41,820 39,9 53 27.607 45,264 37,627 46,612 39,891 47,774 39,454
ííShipments to date through April 13, 1954^'^6uhjôot to correction
# By Crop Reporting Board,
nu
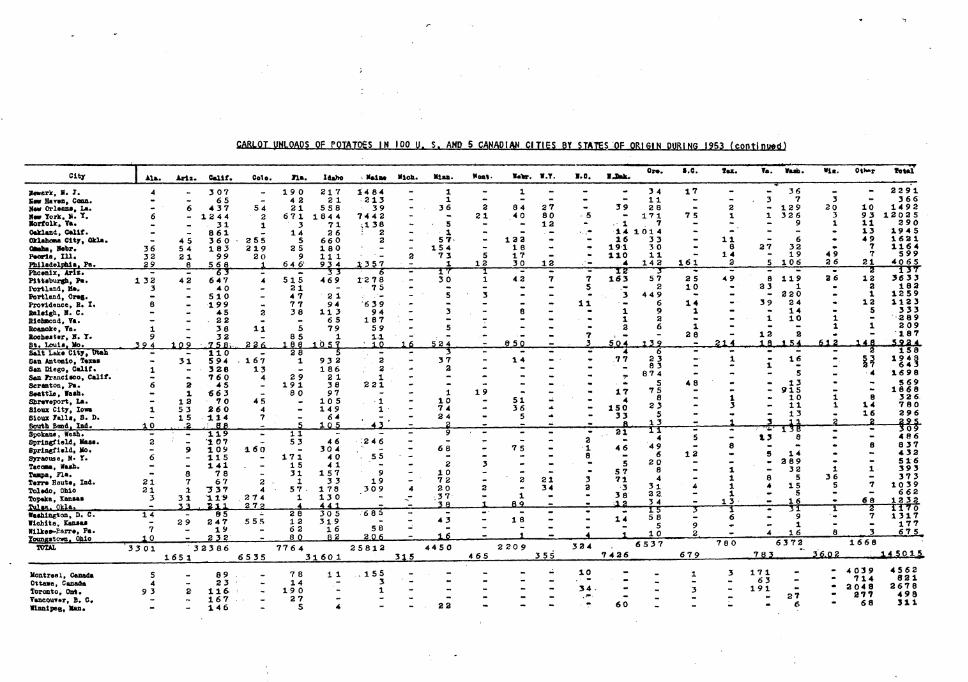
Ora. 1.0. faz. Ta. «aifa. Via, OtHr fetal City AU. ▲rla. Oalif. CoTa. fla. Idaho Naiaa Mioh. Mian. Mont. Water W.T. i.o. IJtek.
9«»erk. M. J. 4 _ 307 . 19 0 217 14 84 „ 1 . 1 » « « 34 17 - 5 36 « . 22 91
Km Bñrmn, Cana. ~ » 65 - 4 2 2 1 213 - 1 - - - « — 11 «■ - 3 7 3 •- 366 ÜMf Orlaos«, lA. • 6 437 54 21 558 3 9 - 36 2 84 27 -» 39 28 - 2 - 129 20 10 1492 Um Tork. M. Y. 6 1244 2 671 184 4 7442 - - 21 ■^o 80 - 5 — 171 75 1 1 326 3 93 12025 Morfolk, Va. _ 31 1 3 71 ;138 - 5 ~ ~ 12 . - . 1 7 - - - 9 1 11 290 OakUiid, Calif. • _ 861 14 26 2 - 1 •. — . - ... .• 14 1014 — - ' - — - 13 1945
„ 4 5 360 ^ 255 5 660 2 . 57- -^ 122 « — 16 33 « 11 - 6 • 49 1621 Otaha» Itabr. 36 5 4 183 219 25 180 - - 154 - 18 — • 191 30 «• 8 27 32 • 7 1164 PMVla, 111. 32 2 1 99 20 9 111 • - 2 73 5 17 — • no 11 — 14 - 19 49 7 599 Fblladelphla. Pa. 29 8 56 8 ^ 6 4 6^ 93 4 13 57 1 12 30 12 ,■» ..4 142 161 2 5 106 2 6 21 4065 Phoenix, Arix. ■ êT «. 53 ^ ' & - 17 1 - - - 12 ¿ — - - — - 2 137 Plttabursb, Pa. I 32 42 647 4 515 469 12 7 8 - 30 1 42 7 7 163 57 2 5 49 B 119 2 6 12 3633 Portlasd, Ha. 3 40 21 75 - — - -> — 5 .— 2 10 - ■ 23 1 - 2 182 Portle&d, Oras» . 510 ^ 47 2 1 ■_. - 5 3 - - - 3 449 — - *- 220 - 1 1259 Profldeuce, R. I. 6 . 199 ^ 77 94 6 39 • - ~ - ~ — 11 ■■ — 6 14 - • 39 24 • 12 1123 Balaish, ». C. . « 45 2 38 11 3 94 - 3 - 8 - — 1 9 1 ■» » 14 - S 3 33 ßleteond, Ta. « _ 22 65 187 - — - - — - 1 2 — - 1 10 1 * 2 8 9 Boanoke, Ta. 1 _ 38 11 5 79 59 - 5 - - — - 2 6 1 * — — 1 1 2 09 Hoobester, B. T. 9 ^ 32 85 1 11 -■ - .- . > • 7 ., — - 28 - 12 2 • ~ 187 Si, Lcmia^ Mo. 3 9 4 10 9 7 5 Br- 2 26 18 8 10 5 7 * 10 16 524 . - 850 . 3 504 , 139 — ?14 ^^ ^K4 6^.2 ., X,4Q, , 5 92i. Sait Laka City, Itab no ■-^-ii' 1, .^ i - - • 4 6 - 5 158 San Antonio, Taxaa - 31 594 167 1 93 2 2 - 37 - 1 4 - • - 77 2 3
83 87 4
-■ 1 l 16 •■ 1?
. 4 16 9 6 fian Diego, Calif. 1 . 32© 13 «. 186 2 ■* 2 - — — "■ — " *" 5 "
San Pfanelaoo, Calif. - . 760 4 29 2 1 1 - - » - — ~ T " Seranton, Pa. 6 2 45 191 38 221 - - - - — "- ■ * 5 48 • " 13 " •" 5 69
1868 32 6 780 296
—IM-
SaattlA. ffaah. 1 «63 _ 80 97 ^ 1 19 — • • 17 7 5 8
23 5
13
*" " ~ 915 10 11 13
1 1
8 14 16
2
Shraraport, La. Sioux City, low 1
12 5 3
70 26 0
45 4
105 149
1 1 « 10
74 ■■ 51
36 ■" . 4
150 - 1 3 -
Sioux 7alla, 8. D. South Bond. Ind. 1 0
15 . . -2
114 ■ 8 8
7 5
11
64 1Q$ ' 4? '
~ 24 z 5 "* ^ 33 » 1 3 2
Spokane, Wash. -Tti~ _ - 9 ■ - - - - 21 11 '4
4 9 6
20 8 4
31 2 2 34
5 13
5
8 4
1 58 3 • 2 3 09
486 Sprincfleld, Maaa. 8prln«fiald, Mo, Syracuse, N« T. TaooM, Waah. TaHpa, na. 7mm Bauta, Ind. Tdado, Ohio
2
6
21 21
9
8 7 1
107 109 115 141
78 67
:337
160
2 4
53
171 1 5 31
1 57
46 304
40 4 1
157 33
1 78
; 2 4 6
.55
9 19
309 4
68
2 10 72 20
3
2
75
2 21 34
2 1 8
3 2
46
5 57 71
3
12
4
8
1 1 1 1
13
14 289
32 5
15 5
1 36
5
8
1
7
837 432 516 393 373
1039 6 62
Topaka, Kanaaa Tul an Okla.
3 31 3 3
274 2 72
1 4
130 4 4 1
- _"■ 37 38 1
1 89 I ^ 3 8
4S - - 16 —4- -TTTÍ ffaahlncton, D. C. 14 ''^is 28 305 68 5 - - -
14 15 5 8
3 1 5
■" 31 9
1 2 7
1. 1 f 0 1317
Wichita, Kanaaa - 29 247 5 55 12 319 - ~ 4 3 ~ 1 8 "■ " 5
10 9 2.
^ 1 „ 177 Wilkea-Earra, Pa. 7
1 0 - 19
C» X 5» - 6 2
8 0 16 ß 2
58 2 06 I 16 « 1 « 4 1 - 4 16 8 .3 675
«ounpsxown. uoio TOTAL '3 3 01 323 86 7764 25812 4450 2 20 9 324 6537 780 6370 1668
165 1 65 35 31601 315 465 355 7426 679 .79 2, J.i.OS li.^P.U.
Montreal, Canada Ottawa, Canada Toronto, Out, TaneouT»r, B, C, Winnipeg, Man«
5 4
9 3 2
89 23
116^ 167 146
-
78 14
190 27
5
1 1
4
.155 3 1
23
" ~ -
10
34
60 -
1
3
3 171 63
191 27
6
l 4 039
714 2048
277 68
4562 821
2678 498 311

OTIHD STATES DEPARTMEKT OF ACRICÜLTOBB AgrloultMT«! Mwk»tlB« Service
m«hln£ton 2», D.C.
AprU 16B4
City \ AU. Aril. CaMf. Oole. n«. Idaho lUia» Mich. Mlu. Mont. leVr I.I, I.O. I.Mc. Ore. s.e» Tex. V*. «uh. n«. Other To »el
Akron, Ohio 1 1 3 128 4 3 11 0 155 _ 5 _ 2 « . 3 4' 12 7 1 2 35 - 1 52 2 Albany, H. Y. 3 130 _ 9 5 39 361 - - - - 3 — 4 16 - 7 20 3 "• 6 81 Altooaa, Fa. 3 - 85 - 1 3 1 0 67 - - - - - *" — 5 1 - - 2 "• "" 18 6 AHarillo, Texas - 12 170 22 . 30 6 - - 3 - — — * - 21 - - - — - 4 5 38 Atlanta. QQ. 5 2 • 227 63 30 51 5 134 2 39 4 9 - 3 32 49 5 1 3 112 12 8 1255 Baltinore, Kd. 16 7 197 219 335 1570 - 8 - 4 2 - 6 51 10 1 - 43 * 16 2 48 5 Beavaont, Texas _ 93 2 . 96 1 - 6 - - - " 1 8 - - - 5 " ~ 212 Blmln^boia, Ala. 3 1 228 5 5 8 577 22 - 4 3 2 5 2 - 43 50 - - - 105 38 10 1192 Boston, Mass. 2 1 677 279 26 2 3102 - - - - - 37 1 35 Ill 1 94 53 5 234 489 4
80 81
421
Bridgeport. Conn. 3 26 _ 21 1 1 152 - - - - - - — 4 53 Î
a 41
1 ■-34 Î —h Buffalo, N. Y. 9 4 6 4 41 _ 44 2 117 101 _ _ _ 24 — 9 2 20
Butte, Uont. 28 _ 3 6 - 4 6 - — - 11 1 - — ~ " 2 1 3 6
• a Chcrleaton, 6. 0. Charleston, 9. Ta.
~ 3 n - 2 ill lÚ - 1 - 1 z. 1 i - 4 14 7 I . 2 1
Charlotte, N. C. - » 56 3 4 4 163 102 - - - 8 — - 2 19 — - - 17 " 1 415 ChattanoofiB, Tenn. Chicago, 111.
4 6 14 209
62 2765
5 696 631
22 2 3048
15 30 49
5 706 45 34
"" 22
1 2938
12 335 _ 125 22
32 876
12 1508
1 104
37 1 14757
Cincinnati, Ohio 578 5 3 365 71 303 73 3 184 2 318 6 103 10 20 598 73 — 40 38 129 201 56 38 81
Clereland, Ohio 59 5 1 8 04 20 474 759 1026 30 1 87 5 8 81 66 18 38 44 163 47 16 3797
Columbia. R. C. . 110 1 6 282 38 - 5 - 7 ~ - 11 3 5 ~ - « 16 Í .. 1 5lfl Colinbus, Ohio iô3 iö - -2T7 ■ , -- f " 1Ö2 3^6 5Ö6 1 65 1 2 14 li> 24 36 6 5 42 48 48 10 1614
Dalles, Texas 5 34 87 0 2 0?. 4 1245 3 - 3 1 - • 8 w - 10 27 _ 4 - 47 3 13 25 06 DaTenport, lotra 13 14 172 98 20 14 3 5 7 98 1 2 - 5 9 5 31 m. 3 - 18 71 10 8 06 Itttyton, Oliio 47 6 177 1 4 9 26 1 166 - 33 - - 1 6 46 42 1 4 10 37 13 9 9 09
Daeatur, 111. 1 13 88 3 5 6 77 •> 1 93 - 6 — • ?18 15 — 1 9 8 40 19 6 3 0
Denrer, Colo. 62 541 9 57 15 127 . 3 ~ — - - 24 .- 13 - 10 - 1 17 5 3
Des lEoines, lOva 10 54 319 63 16 318 4 1 196 ^ 15 . - 122 37 — 9 - 27 7 5 12 03
Detroit, Uich. 167 7 4 17 11 13 730 1552 1089 13 46 5 40 29 83 117 173 24 13 102 276 117 29 64 0 3 281 619 647
Duluth, Minn. 1 144 3 8 - 40 9 19 » -< - 6 1 — -- — 46 3 1 HL Paso, Texas - 8 224 147 . 21 5 • ~ 8 6 6 •• • 1 ' 1 — - - 2 - 1 Sransvllle. lad. 43 5 92 3 12 128 29 5 110 - • S m, i 67 22 — 3 3 7 IQg 1-
"ftlnt,"TilcÄ." '¿4 4 236 2 5Ô 153 5^ —''x- 1 S m. 1 1 t ■- - 13 26 3 2 571
yort Wayme, Ind. 15 6 181 15 136 118 2 17 • 20 1 9 1 4 — ' 2 2 28 14 3 5 83 917 890 581
Fort Worth, Texas 13 328 42 5 461 2 - 33 ~ 1 — *• 11 11 — 2 - 15 1 2
Orend Bapida, Kich. 14 9 . 435 28 50 24 2 39 1 4 4 - • • — - ~ 21 — - 5 24 2 3
Hartford, Coon. ~ ^ 131 _ 18 1 4 412 - - ■- — « - — - — ■ - - 6 - " Houston, Texas 2 10 14 84 47 1 720 22 - 20 • 8^5 •• - 13 198 - 1 - 57 1 50 2 711
634 Huntington, W. 7a. 16 93 _ 19 19 0 2 36 - 10 -> — 2 13 1 8 - - 12 32 1 1 Ittdienapolis, Ind. Jaolrsott, iSiss.
53 20 13
402 40
1 14
96 652 49
514 1
12 1
68 75 _ 1
5 6 10 83
75 124
7 ** 6 39 21
27 18 26
7 6
2 12 3 339 529 7ocksooTille. Fla. 1 8 108 6 _ 24 1 59 - 23 - 3 ~ • 7 14 1 - 2. 55., i- ■■
Kansas City, Ho. 12 101 1139 lö3ü TT- Ô?é 1 - 215 3 77 ■ •» - 27a 134 79 7 125 9 60 4 i 7 7
Xhoxrllle, Tonn. 9 1 69 8 30 3 60 - 17 - - — 6 27 19 4 - 1 18 2 "* 5 4 4 298 326 696
5772 1395
698 1659
742
Lexington, Ky. Lincoln. Nabr. Littl« Rock, Ark. Los Angeles, Calif. LottisTille, Ky. Uadison. Vis. Umphis, Tenn.
Milmtuk*s>» Ris.
21 2
138 175
2
2 20 38
11 7
129 5
35 54 54
2149 22 2 198 177 12 8
5 5 29 5
2 26
1 105
3
4 3 2
4 8 75 54 16
1
65 80
10 0 234 1
359 106 20 4 367
84
6 128
4 1 7
1
11 8 1
18 24 48 15 60 33
300 1
11
1
8
11 54
4 2
90 1
8
35
5
1
2
9 49 68
1 34 15
401 a
3 9
14 93 9
40 8
36 36
I 2 5 1 4
34
19 B
34 25
6
4 5 4
58 24 14 51
198
1 5
2 1
182 36 80 ••
5 4
12 196
9 13 24 75
è3 —s-9- ¿36 iöi ' i¿o 493 120 14 6 1 .; ■ 1 29 37 - '37 15 91 30 7 8
8 6
3 2
1896 2384
435 149
1365
MinnompoU»-6t JPeul, Itobile, Ala.
Uinn, 8 3 76 955 117 4
31 120 21 4
1 16
- 101 3
264 2
- 7 . 2 11
14 14 12 - 4 7
1 5 04
37 16 36 kontgoaery» Ala.
111 1 3
23 176
4 1 4 3
65 595
15 74^ 2
11 102 " "
3 18 1 Ú
7. 52 - 1 1 122
Agriculture ^ Weshidgton. (OTER)

PÀGB 16 ^ .. . • ■*•-
TABLE NO* 22 POTATOES (IRISE) r*ÎERCHÀNTABLE STOCKS HELD BY &P.OWERS AND LOCAL ' DEALERS, ON JANUARY 1 IN,THE 56 XATE AKD INTERMEDIATE^ STATES !_/
7 lo'i --■year average i January 1. 1953 | Jonuary 1, 1954 s/ GHOUP AND STATES iJoa.
Crops oF i _ -^ _-_ 1
Crops ol
5 Crops of 1 _^ _■■ . ^ '± _ 1942r.51 ■ Ä 1952 t
lousRiid bushels ^1953 _
LATE STATES1 • .1Í Main^: .3B»227 35,628 39,840 New Hampshire 464 445 477 Vermont 427 250 287 Massachusetts 691 460 588 . Hhode Island 381 . 290 300 Connecticut 1,692 1,220 1,200 New York « L#I# ^ '2,455 1,500 1^500 New York - Upstate 6*399 5,630 5,900 Pennsylvania "Wast Virginia • ,_
7çIB4 5 „600 4,600 1Ô2 65 115
p' EASTERN _Z ' '. J58,082 _ "^ - _51»08i _ 54.807 _ Ohio ■:. r,319 700 660
T-, , -
Jndiana 352 570 800 Illinois y 56 .15 10
5,873 3,7 60 3,792 Wisconsin 2(846 2,700 3,960 Minnesota 7,430 . 5,800 5,600 ïowa 232 120 100 North Dakota ^ 0^902 5,900 6,439 South Dakota 787 _ _ _**0 600 1 CENTRAL _ _ _ 3 ' _] 28^296 20i,005~ 21,961 îTebraska • ,4,419'"' ~3olÔO 2,948 ~ Mo nt ane^ 1,112 15-250 1,170 Uaho 17,774 19,010 20,000 Wyoming lp031 485 580 Coloreado 6,269 "7,700 6,600 New Mexico '32 5 4 Utah l^lEO 1,600 1,700 - ;. Nevada 274 300 313 Washington 1,781 1 ...250 1,350 Oregon 3,779 3,900 ■ 4,100
^2j^57 4_ ._ „3jt.5ûO_ _ _ ^jj.§ß_ ■ -
TI'^WESTERN"" -, "" " 40<lj4 «^100 ' _._ ~. _ 42,927
29jj^T!^ ST ATES_ '2 _Z • \ I ^ i^i^I'^.i \^ _113Tl93 ~ " ' ; _119i695_
INTERMEDIATE STATES I New Jersey 288 150 300 Delaware 28 20 28 M^rylÄnd 122 30 34 ■.! - .•
Virginia 157 40 100 Kentucky 101 25 50 Missouri 49- 15 2 Kansas "' 36 5 1
7 I^NTîTRMEDUTE^STATES: 781_ _^Í^1. _ . _ ' , ^^i^^ . 36 LATE AND ^ /*" "^ "* ■ "^ '- - - . - - £NTERMEDUTE_STATES ^ ^ _ 127^353 _ _'_ _ ^i^»^!^^ _ _ _ J^l^jßlP '_ ly Merchantable stocks consi st.. of potatoes held by growers^ local dealers and buyers
on ¿arms or ne^r areas of production for sale or delivery gfter December 31 for foodt seed, feed pná processings Released by Crop Reporting Boards
2/ Note that the lO^ye^^r average figures (''Group" and "All States") are the averages of the yearly totals, not the sum of group or State averagesp
Zj Preliminary* r . v
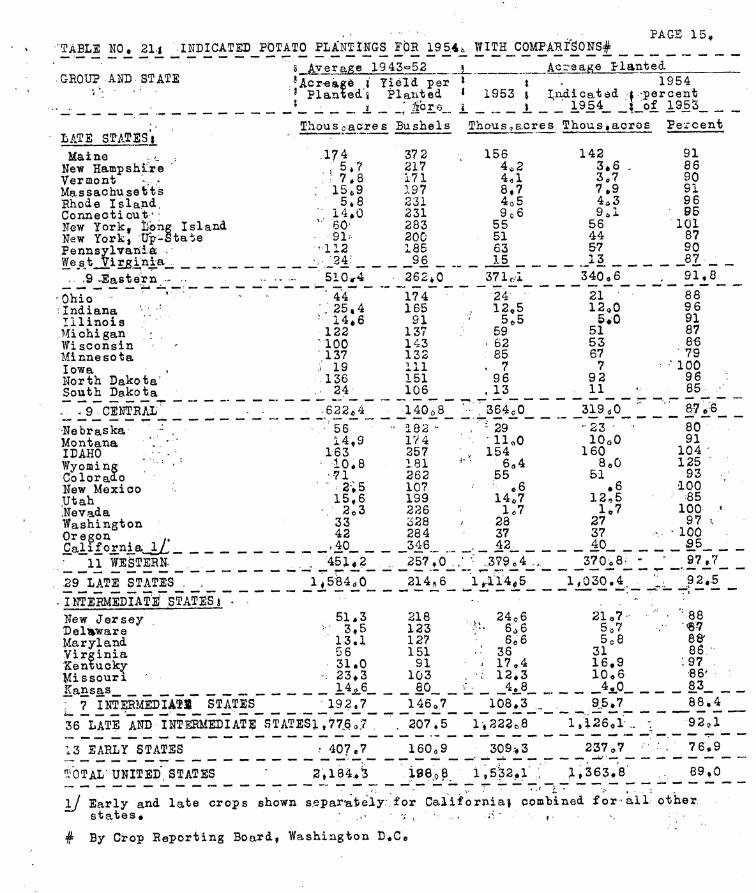
PAG3 15, "TABLE NO, 21j_ __IND£CATED_PQTATO £L£NTI£GS FiDR 19^*^. WITH__COMPAHßONS£
8, ^vera.fíe 1945°52 5 Ac-sage Planted . GROUP ANB STATE .'Acr-eagè j Yield per > t . 1954
■•':■■ ' Planteds Planted < 1953 ( I,.ivdicatôd t -percent ,_^. . '_ j. _ _; goi_(i_ i_ jr ; 1954_ _i_of 1953
Thousjaores Bushels Thaus„sores Thous«aoros Percent LATE STATES» ' ~* " "" ^
Maine ... . 174 37 2 . 156 142 91 New Hampshire ■ ¡ 5»? 217 4»2 3«6 , 86 Vermont V, .;7»8 171 4,1 3.7 90 Massachusetts . 15,.9 197 8*7 7,9 91 Rhode Island, 5.8 231 4o5 443 96 Connecticut" ■.14,0 231 9«6 9.j. 95 New York, ïibng Island 60' 283 55 56 101 New YorkI íTp-State 91' 200 51 44 87 PennsylvaniÄ . '112 185 63 57 90 West_Virjgi;nÍ.a_ _,„_2A:^ 96 15 ._13 ^87 _ .
..'^"9 -Eastern ■- •. ■■_■_- _ ,' %0,4_ _262_»_0 371o-l ^10_,6_ . _ 9_lj_Q_ -Ohio" ~ ~ ^ """" ~ - "■ 4'4~ " 174 24 ' 21 88 ;Indiana ' ^ ::25.4 165 ,, 12,5 12,0 96 Illinois ■ 14,6 91 • 5,5 5*0 91 Michigan ■ 122 137 59 51 87 Wisconsin ■• '100 143 > 62 53 86 Minnesota •,137 132 85 67 79 Iowa . '19 111 > 7 7 - 100 North Dakota' 136 151 96 92 96 : South Dakota _ 24_ 106 _. 13 1} "_ _ _ £^_ _
-„ Z9~'^î^^il^l _ I _ 1 _■_ . -Pl^L^ . J-^2?- ^.J^l^^- _ - _^i^±^_ _ _ _ ^7¿6_ ■Nebrlska -. "-56 ■ 182 - ".■-29 " 23 • ' 80 Montana '. " ' 14,9 1?4 ^11,0 10<,0 91 IDAHO ■■-■■ 163 257 , 154 160 104' Wyoming " '■' 10.8 181 "■ 6,4 8e0 125' Coloraie ' -71. 262 55 51 93 , New Mexico ' 2>5 10? ^ *6 ,6 100 Utah 15,6 199 14„7 12,5 85 iNevada .2,3 226 1.7 U7 100 • Washington 33 328 . 28 27 97 '- Oregon ,. 42 284 37 37 ■ - 100 California l/!: -40 346 „. _ 42 40 S5_ _ _ J"! H^i'I'i^N. _._ _. _451«_2_ _ _257,_0_.J-_.379_.4_.. 370¿8_ ;;_ _ _97_,7_ 29~LATÍ STATES . _._ '^±^^^^ ^i^JL^_ S'r^^Û '^l2?^'t-- -ri- J'l*-
- TNTERMiprAFlTsTATES »~ ~ .,'-.•' New Jersey . 51.3 218 , ^^ 24c6 21o7- ■ "■ m Delmware 3,5 123 ■.■> 6^6 5¡i7 . «7 Maryland 13,1 127 -, 6.6 5.8 8| Virginia í56 151 • 36 31 86. Kentucky 31*0 91 ' 17.4 16,9 .97 Missouri ■■■■ 23^3 103 . ■; 12*3 10<>6 86^ Kansas , 14^6 80_ _ -^ _ _4e_8_ 4^0 83_ ^
: 7 lOTERMEDUTS STATES 'J^2ßlJ ^t^l! •^£?t^^-^ ^iJ ^^i*i 36""LATÍ AND iNTîimi^TATE STATESl,776o.7 . \307»5 1\22Z^Q i;Í26<,l'.. : _ 1^1^
13 EABLY STATES -^ 407*7 160^^9 ^309.^3 ^T"""^^'^ 1^1^^
TbTAL' UNITED^ STATES 2,184.*Í5 198|o8 1 í532*1' :'. J'::}^^^ _ ^ - ^^1^-
l/ Early and late crops shown separ^ately:. f or Californiai combined forall other, states* ; ..• ';•;... r.-. ,.
# By Crop Reporting Board, Washington B^Ci.