
D ÁN THY IN TRUNG SN TRUNG SON HYDROPOWER PROJECT...
111
ISO 9001:2000 VIETNAM ELECTRICITY POWER ENGINEERING CONSULTING JOINT STOCK COMPANY 4 Project: T.02.04 D ÁN THY IN TRUNG SN TRUNG SON HYDROPOWER PROJECT THIT K K THUT TECHNICAL DESIGN MÔ HÌNH VN HÀNH H CHA OPERATION MODEL OF RESERVOIR Nha Trang City, July 2010
Transcript of D ÁN THY IN TRUNG SN TRUNG SON HYDROPOWER PROJECT...

ISO 9001:2000
VIETNAM ELECTRICITY
POWER ENGINEERING CONSULTING JOINT STOCK COMPANY 4
Project: T�.02.04
D� ÁN TH�Y �I�N TRUNG S�N
TRUNG SON HYDROPOWER PROJECT
THI�T K� K� THUT
TECHNICAL DESIGN
MÔ HÌNH VN HÀNH H CH�A
OPERATION MODEL OF RESERVOIR
Nha Trang City, July 2010

Trung Son hydropower project Technical design
Contributor i
CONTRIBUTORS
No. Full name Task Signature
1 Vuong Anh Dung Preparing chapter 3
2 Nguyen Van De Preparing chapter 1
3 Nguyen Tien Phong Preparing chapter 2
4 Truong Hoai The Tuyen Preparing chapter 4
5 Phung Ngoc Tam Preparing chapter 4
6 Tran Minh Kha Checking

Trung Son hydropower project Technical design
Contents ii
CONTENTS
The document is established in below volume “Operation model of reservoir”

Trung Son hydropower project Technical design
Table of contents iii
TABLE OF CONTENTS CHAPTER 1: ANNUAL FLOW SPECIFIC CALCULATION 1
1.1 FLOW CONDITION CALCULATION ON BASIN 1 1.2 CALCULATION OF ANNUAL AVERAGE FLOW IN LONG-TERM PERIOD AT TRUNG SON
HYDROLOGICAL 5 1.3 DESIGN ANNUAL FLOW DISTRIBUTION AND ANNUAL FREQUENCY 10 1.4 DAILY FLOW RANGE TO TRUNG SON HYDROPOWER DAMSITE 11
CHAPTER 2: RESERVOIR ANALYSIS AND SIMULATION 12 2.1 PLANNING HYDROPOWER PROJECTS CASCADES ON MA RIVER 12 2.2 ADDITIONAL PLANNING HYDROPOWER PROJECTS CASCADES ON MA RIVER 13 2.3 MAIN PARAMETERS OF TRUNG SON HYDROPOWER PROJECT – TECHNICAL DESIGN
STAGE 14 2.4 DATA FOR CALCULATION 16 2.5 CALCULATION, SIMULATION OF RESERVOIR 18 2.6 WITHOUT THANH SON RESERVOIR IN DOWNSTREAM OF TRUNG SON HYDROPOWER
PLANT (CASE 1) 18 2.7 DOWNSTREAM WITH THANH SON RESERVOIR (CASE 2) 37
CHAPTER 3: WATER SUPPLY DEMAND FOR DOWNSTREAM 40 3.1 WATER DEMAND AT DOWNSTREAM 40 3.2 ENVIRONMENT FLOW RELEASE MEASURES 42 3.3 DISCHARGE OF WATER DURING OPERATION PROCESS 42 3.4 DISCHARGE OF MUD AND SAND 43 3.5 RESERVOIR DEWATERING 43 3.6 CONCLUSION 43
CHAPTER 4: RESERVOIR AND DOWNSTREAM LANDSLIDE POSSIBILITY FORECAST 44
4.1 RESERVOIR BANK LANDSIDE POSSIBILITY 44 4.2 EROSION RIVER BED OF RESERVOIR DOWNSTREAM 47 4.3 SLIDING AT BANKS OF DOWNSTREAM 48
APPENDIX .............................................................................................................. 48 - Appendix calculation of hydrographical - Location chart of section calculation stability - Appendix calculation of reservoir bank stability - Appendix calculation reservoir downstream stability

Trung Son hydropower project Technical design
Flow data chaining advent barrage calculation 1
Chapter 1: ANNUAL FLOW SPECIFIC CALCULATION 1.1 FLOW CONDITION CALCULATION ON BASIN
Trung Son Hydrological station has been built and put into operation since Oct 2004, it is located about 400m downstream of Trung Son dam site. It measures all the factors: precipitation, water level, discharge, flood.. The difference between the basin areas of the damsites and Trung Son station is not remarkable, we can consider the flow to Trung Son hydrological station is equal to the flow to the damsite. Thus, the calculation result at the Trung Son hydrological station is equal to the calculation result at the damsites. There are hydrological stations at the upstream of Ma river: Muong Lat (water level, precipitation), Xa La (precipitation, water level, temperature, discharge..); at the downstream of the river, there are hydrological stations such as:Hoi Xuan (discharge, 1965 – 1970, water level, 1962 – 2008), Cam Thuy (water level, 1957 – 2008; discharge 1957 – 1976, 1995 – 2008)… besides, there are other hydrological stations at the tributaries such as Nam Ty, Nam Cong, Cua Dat, Lang Chanh...
Due to the non-sychronous data and lack of data continuity observed at those stations, the flow calculation of Trung Son hydrological station mainly depends on the analysis method of flow correlation, co-ordinating with precipitation distribution and flow module analysis. The method is carried out between Trung Son hydrological station and 3 other hydrological stations that measure the discharge namely Cam Thuy, Hoi Xuan, Xa La.
1.1.1. Recovering the flow data at Cam Thuy Hydrological Station
Cam Thuy hydrological station measured the water level and discharge from 1957 to 1976 with the standard of Level 1 hydrological station. From 1977 to 1994, it moved some kilometers downstream and downgraded, only measured water level. From 1995 up until now (2008), it moved to the old location and continued observing according to the station of level 1 station.
Now, the water level data at Cam Thuy from 1977 to 1994 has been correlatively calculated by Hydro-meteorological General Bureau and brought back to water elevation of the old Cam Thuy hydrological station (it is also the location now) to unify the elevation.
The relationship curve Q=F(H) is synthetized at Cam Thuy hydrological station in 1973, 1975, 1995. Then the discharge is interpolated from the relation Q=F(H) and daily water level data in 1977÷1994

Trung Son hydropower project Technical design
Flow data chaining advent barrage calculation 2
After the calculation, we have the daily flow at Cam Thuy hydrological station from 1957 to 2008, average long-term flow is Qtb=346 m3/s. Summarization of monthly observed flow and calculated flow from 1957 to 2008 at Cam Thuy hydrological station are shown in Table 1 of the Appendices.
1.1.2. Recovering data at Hoi Xuan hydrological Station
Hoi Xuan hydrological station has been measuring the water level from 1962 up until now (2008), it measured the discharge from 1965 to 1970. The recovering and addition to this flow data at Hoi Xuan hydrological station is carried out through 3 methods:
1) Calculation according to monthly average discharge in correlation with Cam Thuy hydrological station:
The monthly average discharge correlation between Cam Thuy and Hoi Xuan hydrological stations from 1965 to 1970
Flood season: Correlation coefficient �=0.989; Correlation equation:
QHoi Xuan = 0.861*QCam Thuy – 5.14 (m3/s)
Dry season: Correlation coefficient �=0.984; Correlation equation:
QHoi Xuan = 0.823*QCam Thuy+ 4.864 (m3/s)
From this equation and the monthly average discharge at Cam Thuy hydrological station, we can calculate the data chain at Hoi Xuan hydrological station from 1957 – 1964, 1971 – 2008. According to that, the average annual discharge in long-term period at Hoi Xuan is 295 m3/s.
2) Calculation according to daily average discharge in correlation with Cam Thuy hydrological station:
The daily average discharge correlation between Cam Thuy and Hoi Xuan hydrological stations from 1965 to 1970
January: the coefficient of �=0.890. Correlation equation:
QHoi Xuan = 0.694*QCam Thuy + 18.79 (m3/s)
February: the coefficient of �=0.900. Correlation equation:
QHoi Xuan= 0.625*QCam Thuy + 25.09 (m3/s)
March: the coefficient of �=0.933. Correlation equation:
QHoi Xuan= 0.770*QCam Thuy + 9.632 (m3/s)
April: the coefficient of �=0.927. Correlation equation:
Trung Son hydropower project Technical design
Flow data chaining advent barrage calculation 3
QHoi Xuan = 0.825*QCam Thuy + 7.81 (m3/s)
May: the coefficient of �=0,895. Correlation equation:
QHoi Xuan = 0.704*QCam Thuy + 19.31 (m3/s)
June: the coefficient of �=0.942. Correlation equation:
QHoi Xuan = 0.819*QCam Thuy + 9.512 (m3/s)
July: the coefficient of �=0.890. Correlation equation:
QHoi Xuan = 0.765*QCam Thuy + 54.43 (m3/s)
August: the coefficient of �=0,965. Correlation equation:
QHoi Xuan = 0.755*QCam Thuy + 84.42 (m3/s)
September: the coefficient of �=0.952. Correlation equation:
QHoi Xuan = 0.740*QCam Thuy + 55.17 (m3/s)
October: the coefficient of �=0.956. Correlation equation:
QHoi Xuan = 0.646*QCam Thuy + 61.63 (m3/s)
November: the coefficient of �=0.936. Correlation equation:
QHoi Xuan = 0.590*QCam Thuy + 59.62 (m3/s)
December: the coefficient of �=0.902. Correlation equation:
QHoi Xuan = 0.936*QCam Thuy – 8.29 (m3/s)
Based on these equations and the daily average discharge at Cam Thuy hydrological station can calculate data chain at Hoi Xuan hydrological station from 1957 – 1964, 1971 – 2008. Thence, the long-term average discharge at Hoi Xuan is 289 m3/s.
3) Calculation according to water level data and the relation Q=F(H)
Water level data at Hoi Xuan hydrological station from 1957-1961 was recovered from water level data at Cam Thuy hydrological station by correlation method.
Cam Thuy hydrological station measured discharge and level water from 1957 - 1976. After, it’s displaced to downstream and measured level water only. In 1995, it’s displaced again to return the initial location, and upgraded to measure both discharge and level water. The level water data at Cam Thuy hydrological station from 1977 - 1994 is calculated and converted. Hence, daily average level water in every month in correlation between Cam Thuy hydrological station and Hoi Xuan hydrological station is carried out from 1962 - 1976.

Trung Son hydropower project Technical design
Flow data chaining advent barrage calculation 4
January: the coefficient of �=0.868. Correlation equation:
HHoi Xuan = 1.56*HCam Thuy+ 3,386 (cm)
February: the coefficient of �=0.831. Correlation equation:
HHoi Xuan = 1.15*HCam Thuy + 3863 (cm)
March: the coefficient of �=0.889. Correlation equation:
HHoi Xuan = 1.55*HCam Thuy + 3407 (cm)
April: the coefficient of �=0.927. Correlation equation:
HHoi Xuan = 1.44*HCam Thuy + 3526 (cm)
May: the coefficient of �=0.840. Correlation equation:
HHoi Xuan = 1.06*HCam Thuy + 3972 (cm)
June: the coefficient of �=0.957. Correlation equation:
HHoi Xuan = 1.08*HCam Thuy + 3960 (cm)
July: the coefficient of �=0.962. Correlation equation:
HHoi Xuan = 0.922*HCam Thuy +4167 (cm)
August: the coefficient of �=0.936. Correlation equation:
HHoi Xuan = 0.912*HCam Thuy + 4188 (cm)
September: the coefficient of �=0.965. Correlation equation:
HHoi Xuan = 0.936*HCam Thuy + 4139 (cm)
October: the coefficient of �=0.954. Correlation equation:
HHoi Xuan = 0.887*HCam Thuy + 4202 (cm)
November: the coefficient of �=0.900. Correlation equation:
HHoi Xuan = 1.02*HCam Thuy + 4031 (cm)
December: the coefficient of �=0.808. Correlation equation:
HHoi Xuan = 1.61*HCam Thuy + 3332 (cm)
Based on these equations and daily average level water at Cam Thuy hydrological station can calculate data chain at Hoi Xuan hydrological station from 1957 - 1961
The relation curve Q=F(H) is synthesized from Hoi Xuan’s observed data in 1965-1970. Then, the daily flow data chain at Hoi Xuan hydrological station from 1957 – 1964 and 1971- 2008 is calculated based on the over relation curve Q=F(H) and water level data. Hence, the long-term average discharge at Hoi Xuan is 290 m3/s

Trung Son hydropower project Technical design
Flow data chaining advent barrage calculation 5
Over results (calculated by three methods) are not different much. The daily average discharge correlation method with Cam Thuy hydrological station (Method 2) reflects the reality of the river flow, having high coefficient, giving values close to values calculated by water level and the relation curve Q=F(H) method, and reducing the errors due to the changes of river bed through many years. Thus, it is chosen. Hence, the long-term average flow at Hoi Xuan hydrological station is 289 m3/s. The synthesized results of monthly flow data chain at Hoi Xuan hydrological station is in Table 2 in the appendices.
1.2 CALCULATION OF ANNUAL AVERAGE FLOW IN LONG-TERM
PERIOD AT TRUNG SON HYDROLOGICAL
1.2.1. Daily average water level data recovery method
Create the correlation relationship of daily average water level between Trung Son and Hoi Xuan hydrological stations from 01 January 2005 to 31 December 2008, the achieved correlation coefficient is �=0,949 and correlation equation is as follows:
HTrung Son = 0.707*HHoi Xuan + 5131 (cm)
February: the coefficient of �=0.914. Correlation equation:
HTrung Son = 0.328*HHoi Xuan + 7105 (cm)
June: the coefficient of �=0.914. Correlation equation:
HTrung Son = 0.637*HHoi Xuan + 5493 (cm)
July: the coefficient of �=0.958. Correlation equation:
HTrung Son = 0.820*HHoi Xuan + 4525 (cm)
August: the coefficient of �=0.947. Correlation equation:
HTrung Son = 0.934*HHoi Xuan + 3919 (cm)
September: the coefficient of �=0.899. Correlation equation:
HTrung Son = 0.883*HHoi Xuan + 4194 (cm)
October: the coefficient of �=0.935. Correlation equation:
HTrung Son = 0.634*HHoi Xuan + 5520 (cm)
November: the coefficient of �=0.918. Correlation equation:
HTrung Son = 0.565*HHoi Xuan + 5879 (cm)
December: the coefficient of �=0.928. Correlation equation:
HTrung Son = 0.534*HHoi Xuan + 6038 (cm)

Trung Son hydropower project Technical design
Flow data chaining advent barrage calculation 6
The coefficient of Jan, Mar, Apr, May months is smaller than 0.8. Thus, correlation equation of this are taken general correlation equation:
HTrung Son = 0.707*HHoi Xuan + 5131 (cm)
With these equations and the water level data at Hoi Xuan can recover the water level data at Trung Son in the period of 1957-2004.
The correlation curve Q=F(H) at Trung Son station is synthetized from observed data in the period 2005 ÷ 2008. Then, calculating the daily flow data chain at Trung Son station in the period of 1957÷ 2004 from the water level data and the synthetized relationship Q=F(H). Hence, the long-term average discharge is 216 m3/s.
1.2.2. Flow correlation method with Cam Thuy hydrological station
- Creating the monthly average discharge correlation between Cam Thuy and Trung Son stations from January 2005 to December 2008
Flood season: Correlation coefficient is �=0.954. Correlation equation:
QTrung Son = 0.636*QCam Thuy - 3,27 (m3/s)
Dry season: Correlation coefficient is �=0.941. Correlation equation:
QTrung Son = 0.506*QCam Thuy + 20,45 (m3/s)
With these equations and discharge at Cam Thuy hydrological station can calculate the flow data chain at Trung Son station from 1957- 2004. Hence, the average discharge in long-term period (1957-2008) is 218 m3/s.
- Creating the daily average discharge correlation between Cam Thuy and Trung Son stations from January 2005 to December 2008
Average calculation result from 01 January 2005 to 31 December 2008, correlation coefficient is �=0,922.
Correlation equation is as below:
QTrung Son = 0.545*QCam Thuy + 30.6 (m3/s)
January: the coefficient of �=0.947. Correlation equation:
QTrung Son = 0.654*QCam Thuy – 1.04 (m3/s)
February: the coefficient of �=0.876. Correlation equation:
QTrung Son = 0.745*QCam Thuy – 11.69 (m3/s)
March: the coefficient of �=0.852. Correlation equation:
QTrung Son = 0.651*QCam Thuy – 2.43 (m3/s)

Trung Son hydropower project Technical design
Flow data chaining advent barrage calculation 7
April: The coefficient of April is smaller than 0.8. Thus, the correlation equation of this is taken genera correlation equation:
QTrung Son = 0.545*QCam Thuy + 30.6 (m3/s)
May: The coefficient of May is smaller than 0.8. Thus, the correlation equation of this is taken genera correlation equation:
QTrung Son = 0.545*QCam Thuy + 30.6 (m3/s)
June: the coefficient of �=0.901. Correlation equation:
QTrung Son = 0.674*QCam Thuy – 23.08 (m3/s)
July: the coefficient of �=0.871. Correlation equation:
QTrung Son = 0.661*QCam Thuy – 7.65 (m3/s)
August: the coefficient of �=0.899. Correlation equation:
QTrung Son = 0.622*QCam Thuy + 44.74 (m3/s)
September: the coefficient of �=0.876. Correlation equation:
QTrung Son = 0.512*QCam Thuy + 103.23 (m3/s)
October: the coefficient of �=0.936. Correlation equation:
QTrung Son = 0.387*QCam Thuy + 112.22 (m3/s)
November: the coefficient of �=0.882. Correlation equation:
QTrung Son = 0.341*QCam Thuy + 95.14 (m3/s)
December: the coefficient of �=0.971. Correlation equation:
QTrung Son = 0.756*QCam Thuy – 11.47 (m3/s)
Calculate the daily discharge data chain at Trung Son station in the period of 1957÷ 2004 based on these correlation equations and daily average discharge at Cam Thuy hydrological station. Hence, average annual discharge in long-term period is 229 m3/s.
1.2.3. Flow correlation method with Xa La station
Creating the monthly average discharge correlation between Xa La and Trung Son station from January 2005 to December 2008
In flood season, the coefficient is �=0.758. It is too small to calculate and recover flow data at Trung Son station. So, data in flood months is recovered and calculated by correlation relation among months in the whole year. The synthesized coefficient of

Trung Son hydropower project Technical design
Flow data chaining advent barrage calculation 8
months from 2005 to 2008 between Xa La and Trung Son stations is �=0.875. The correlation equation is as below:
QTrung Son = 1.638*QXa La + 45.61 (m3/s)
In dry season, the coefficient �=0.893. The correlation equation:
QTrung Son = 1.75*QXa La + 26.17 (m3/s)
Based on these equations and discharge at Xa La station can calculate flow data chain at Trung Son station from 1961- 2004. Hence, average annual discharge in long-term period at Trung Son is 235 m3/s.
1.2.4. Flow correlation method with Hoi Xuan hydrological station
Creating the monthly average discharge in correlation between Hoi Xuan and Trung Son station from I/2005 to XII/2008.
In flood season, the coefficient �=0.968. The correlation equation:
QTrung Son = 0.836*QHoi Xuan – 34.78 (m3/s)
In dry season, the coefficient (�=0.692) is too small to correspond with calculating and recovering flow data at Trung Son station. So, data in dry months is recovered by correlative relation among months in the whole year. The synthesized coefficient of months from 2005 to 2008 between Hoi Xuan and Trung Son is �=0.964. The correlation equation:
QTrung Son = 0.801*QHoi Xuan – 20.01 (m3/s)
From these equations and discharge at Hoi Xuan hydrological station, we can flow data chain at Trung Son station from 1957 to 2004. According to that, average annual discharge in long-term period at Trung Son is 213 m3/s.
1.2.5. Flow module analysis method
The flow module distribution on Ma river is as follows:
Table 1.1: The flow module at some stations in Ma river basin
Station Area (km2) Period Qaver (m3/s) M (l/s/km2)
Cam Thuy 18,879 1957÷2008 346 18.3
Hoi Xuan 16,850 1957÷2008 289 17.2
Xa La 6,430 1961÷2008 120 18.7

Trung Son hydropower project Technical design
Flow data chaining advent barrage calculation 9
Trung Son station is located between Hoi Xuan and Xa La stations, the flow module of Trung Son station is M= 17.5 l/s/km2, calculated by interpolation method. Thus, can calculate the annual average discharge at Trung Son station Q= 257 m3/s.
The flow data at Hoi Xuan hydrological station is recovered mainly; data at Cam Thuy and Xa La stations is more adequate. Use interpolation method to calculate flow module to Trung Son station from relation between area and flow module of Cam Thuy and Xa La stations. According to this method, the flow module to Trung Son station will be M= 18.4 l/s/km2. Thus, the long-term average discharge at Trung Son station can calculated Q= 270 m3/s.
The analysis of precipitation changes in the mid-areas from Cam Thuy to Hoi Xuan and from Hoi Xuan to Trung Son shows that the average annual rainfall in long-term period from Cam Thuy to Hoi Xuan is about 1850 mm; from Hoi Xuan to Trung Son is about 1600 mm. The application of area rate method plus basin average rainfall rate method due to mid-basin from Cam Thuy to Hoi Xuan. The average annual discharge at Trung Son will be equal to the average annual discharge in long-term period at Hoi Xuan minus the mid-area. QTrung Son = 236 m3/s.
1.2.6. Analyse, choose the results of flow calculation to Trung Son dam site
Table 1.2: Synthesized results of annual average flow in long-term period at Trung Son station according to different methods
Method Q0 M0
1. Interpolating Water data and the relationship Q=F(H) 216 14.72. Monthly average discharge correlation with Cam Thuy hydrological station
218 14.9
2. Daily average discharge correlation with Cam Thuy hydrological station
229 15.6
3. Discharge correlation with Xa La station 235 16.04. Discharge correlation with Hoi Xuan hydrological station 213 14.55. Interpolating flow module Hoi Xuan – Xa La 257 17.56. Interpolating flow module Cam Thuy – Xa La 270 18.47. Mid-area discharge deduction from Hoi Xuan to Trung 236 16.1
Average 234 16.0Due to the complexity of the precipitation and flow distribution on Ma river – the
part on Laos territory has less rainfall than on Vietnam, so the calculation results by the different methods will be different as well. Each method has its own advantages and disadvantages. The water level data retrieval method at Trung Son station from

Trung Son hydropower project Technical design
Flow data chaining advent barrage calculation 10
Hoi Xuan hydrological station is easy to cause errors because the parallel measured water level data chain is short, the water level in serious flood years isn’t measured sufficiently and the cross sections are changed after years. The data chain from 1977 – 1994 at Cam Thuy hydrological station is achieved through calculation and recovery from the water level and relationship Q=F(H), the parallel measured data chain between Cam Thuy and Trung Son is still short, thus the monthly average flow correlation method between Trung Son and Cam Thuy is not fully trusted. It is similar to above mention, the correlation method between Trung Son and Xa La also have a short parallel observed data chain; their correlation coefficient is not much great; Ma river, after flowing cross Laos territory where rainfall is small, flow amplitude changes a little bit, thus results achieved by this method isn’t completely trusted. The method considering flow module progress based on the measured data at the hydrological stations on Ma river basin, considering the effect of rainfall distribution on the basin, can determine quite exactly the long-term average flow but determining exactly the average annual precipitation in the basin is difficult, so it is difficult to determine exactly the annual flow.
The average flow value achieved from these above methods are QTrung Son = 234 m3/s, MTrung Son = 16,0 l/s/km2, these values are equal to the discharge depreation method at mid-area with the mean rain fall (QTrung S�n = 236 m3/s), nearly the same with the result of discharge correlation with Xa La station method (QTrung S�n = 235 m3/s). As change a number of calculating years, the average annual runoff value at Trung Son station fluctuates around at 235 m3/s, recommend to choose this result
Q0Trung Son = 235 m3/s
1.3 DESIGN ANNUAL FLOW DISTRIBUTION AND ANNUAL
FREQUENCY
1.3.1. Monthy average flow range
To achieve a nearly correct flow distribution at Trung Son station, the flow distribution following the daily average flow correlation wih Cam Thuy hydrological station has been used, with the modification according to the chosen average flow in the long-term period. The results are as in table 3, Appendixes.
1.3.2. Seasonal flow rate
Based on the observed and calculated flow data at Trung Son station (1957 – 2007) carry out the seasonal flow classification according to the over-average standard, the results achieved are: flood season starts from June, ends in October; dry

Trung Son hydropower project Technical design
Flow data chaining advent barrage calculation 11
season starts from November, ends in next May. The results are in table 4 in the appendices.
1.4 DAILY FLOW RANGE TO TRUNG SON HYDROPOWER DAMSITE
By correlation relation analysis, the flow correlation in Ma river at Trung Son with Hoi Xuan and Cam Thuy is better than with Xa La. This difference shows that the natural condition in Ma river is: heavy rain in the upstream, small rain in Laos territory and gradually heavier from Trung Son to Cam Thuy, the area difference between Trung Son and Hoi Xuan, Cam Thuy is smaller than between Trung Son and Xa La.
Hoi Xuan hydrological station has an short observed daily discharge data chain (1965-1970), the data of the remaining years (1957÷ 1964, 1971÷ 2008) are achieved by recovering calculation, the old relation Q=F(H) (synthetized from 1965 - 1970) is not measured to check the changes in the following years, thus it is easily to cause errors.
Cam Thuy hydrological station has a longer observed data chain (1957÷ 1976, 1995÷ 2008), the calculated recovering flow data chain (1977÷ 1994) has a close base, the relation Q= F(H) is synthetized according to the years before 1977 and after 1994. Thus, flow distribution reflects the reality, can trust well, and choose to calculate flow distribution at Trung Son hydrological station.
The daily discharge chain (1957-2004) at Trung Son station is chosen according to daily average discharge correlation calculation results with Cam Thuy hydrological station, in which: using separate correlation equations for each month and calculating is in the adjustment to get average annual discharge at Trung Son, Qaver=235 m3/s.
The synthetized results of daily average discharge at Trung Son station are summarized in the report of “Reservoir operation process”.

Trung Son hydropower project Technical design
Analysis and simulation of reservoir 12
Chapter 2: RESERVOIR ANALYSIS AND SIMULATION 2.1 PLANNING HYDROPOWER PROJECTS CASCADES ON MA RIVER
On March 31, 2005, Ministry of Industry (presently called as Ministry of Industry and Trade) issued decision No.1195/Q�-NLDK, concerning “approval on planning of hydropower cascades on Ma river”, main contents as below:
- Exploiting scheme of hydropower cascades projects and main task of hydropower projects on Ma river:
+ On Ma river tributary, there are 05 multi-purposes hydropower reservoirs projects
� Pa Ma hydropower project, with normal water level at 455m, installed capacity of 80MW; main tasks are water supply and flood control; combined with electric power generation.
� Huoi Tao hydropower project: normal water level at 380m, installed capacity of 180MW; main task are water supply and flood control; combined with electric power generation.
� Trung Son hydropower project: normal water level at 160m, installed capacity of 280MW; main task are electric power generation and flood control.
� Hoi Xuan hydropower project: normal water level at 80m, installed capacity of 92MW; main task are electric power generation and water supply.
� Cam Ngoc hydropower project: normal water level at 50m, installed capacity of 145MW; main tasks are water supply, combined with electric power generation.
+ In Chu River tributary, there are 02 hydropower projects � Hua Na hydropower project, normal water level at 240m, installed
capacity of 180MW; main tasks are electric power generation and flood control.
� Cua Dat hydropower project, normal water level at 119m, installed capacity of 97MW. This project is under operation. Main tasks are water supply and flood control, combined with electric power generation.
- Flood control storage capacity at respective reservoirs
+ Total flood control storage capacity on Ma River is estimated approximately 700 million m3 respectively at Pa Ma reservoir (about 200 million m3), Huoi Tao (about 300 million m3), Trung Son reservoir (maximum 200 million m3). It is required to substantiate presisely in details the distribution flood control storage capacity between cascades in Ma River when establishing Feasibility Study, with consideration of all actual topographical, geological condition of the project as well as in the downstream area, proposed other

Trung Son hydropower project Technical design
Analysis and simulation of reservoir 13
reservoirs in Ma River construction time according to water resource development program, to ensure economical and technical requirements.
+ Total flood control storage capacity on Chu River is estimated approximately at 400 million m3, respectively at Cua Dat hydropower reservoir at 300 million m3 and Hua Na hydropower reservoir at 100 million m3
- Priority sequence construction of projects:
+ Hydropower projects to be constructed in the first stage: Cua Dat and Hua Na projects on Chu River, Trung Son project in Ma River
+ Hydropower projects to be studied as multipurpose: Hoi Xuan, Cam Ngoc, Pa Ma, Huoi Tao projects on Ma river
(detail at appendix: attachment legal documents)
2.2 ADDITIONAL PLANNING HYDROPOWER PROJECTS CASCADES
ON MA RIVER
On April 18, 2008, Ministry of Industry and Trade issued decision No.2383/Q�-BCT converning “approval on additional planning hydropower project cascades on Ma River”, with main contents, as below:
- Additional planning Thanh Son hydropower project on Ma river cascades was approved by Ministry of Industry (presently called as Ministry of Industry and Trade) at decision No. 1195/Q�-NLDK dated on March 31, 2005 with main contents, as below:
+ Construction site: On the main stream of Ma river at the Thanh Son and Trung Thanh communes, Quan Hoa district, Thanh Hoa Province, with coordinates (VN-2000 system): X= 2 277 459.6 and Y= 490 006.9
+ Task and exploiting scheme of project: Project has main task is power generation. The hyro energy exploiting scheme consisting of main dam and spillway with dam-toe hydropower plant type.
+ Main parameters of project: Catchment basin area calculated to damsite Flv = 13.275Km2, annual average discharge Q0= 246 m3/s, normal water level = 89m, tailrace water level MNHLmin= 78.5m, rated water head Htt= 8.8m and installed capacity Nlm= 37MW
- Investment of Thanh Son hydropower project must be complied with socio-economic development plans, land and water resource use plans, electric power development plan in the Thanh Hoa province; synchronously with power load development situation as well as investment of electric power transmission network in region as planned by Vietnam Electricity.
- In feasibility study stage of Thanh Son hydropower project, Thanh Hoa Provincial People’s Committee shall be responsible to give directives, inspection and consideration of below issues:
+ Additional investigation, survey on natural conditions (topographical, geological, hydrological conditions, etc,..) for project area, precisely

Trung Son hydropower project Technical design
Analysis and simulation of reservoir 14
calculate relation curve between water level and discharge at tailrace of powerhouse.
+ Precisely calculate normal water level of hydropower reservoir based on calculation of surge water level to the end of reservoir caused by flood, to ensure no influence on electric energy efficiency and safety operation of Trung Son hydropower plant at upstream.
+ The spillway of Thanh Son hydropower project shall be designed in such a manner to ensure release safely checked flood discharge from Trung Son hydropower project in accordance with regulation specified in design standards and codes..
+ Updating parameters such as upstream and downstream water level and power generation discharge of Trung Son and Hoi Xuan hydropower cascade projects (downstream side). Analysis, comparison to make accuracy of main parameters of project, especially installed capacity to ensure effective exploitation of project as well as electric power transmission network
+ Investigate, survey and establish compensation and resettlement plan for project, to ensure compliance with current relevant State regulation.
2.3 MAIN PARAMETERS OF TRUNG SON HYDROPOWER PROJECT –
TECHNICAL DESIGN STAGE
In the technical design stage, the main tasks of project are defined as below: - With regards of electric power generation, installed capacity is Nlm = 260MW,
annual electric energy Eo=1018.61 million kWh. - In terms of flood control, the reservoir flood control storage capacity is 150
million m3 in which regular flood control storage capacity of 112 million m3 . Flood control period is 02 consecutive months of main flood season from 15th July to 15th September annually.
Table 2-1: Main parameters of Trung Son hydropower project
No. Description Unit Value
I Basin characteristics 1 Catchment area Km2 146602 Average long-term rainfalls X0 mm 1 4203 Average long-term flow (Qo) m3/s 235 4 Total annual flow Wo 106m3 7411 II Reservoir 1 Normal water level (NWL) m 160 2 Dead water level m 150 3 Water level before flood m 1504 Flood storage volume Wpl 106m3 1125 Reservoir storage volume corresponding to normal 106m3 348.53

Trung Son hydropower project Technical design
Analysis and simulation of reservoir 15
No. Description Unit Value
water level Wbt
6 Effective storage volume, flood storage volume Wpl 106m3 112.13
7 Dead storage volume Wc 106m3 236.40
8 Reservoir surface area corresponding to normal water level km2 13.13
9 Flood peak discharge corresponding to frequencies - P= 0.1 % m3/s 13 400 - P= 0.5 % m3/s 10 400 - P= 1 % m3/s 9 100 - P= 5 % m3/s 6 200
III RCC dam 1 Dam crest elevation m 162.82 Dam crest length (L�) m 513.03 Max. dam height m 84.54 Dam crest width (b) m 85 Upstream slope (m) 0.356 Downstream slope (m) 0.65
IV Spillway 1 Spillway sill elevation m 1452 Number of spillway cells 63 Spillway span BxH m 14x154 Orifice dimension of radial gate BxH m 14x15.55 Design flood released discharge P=0.5% m3/s 9 9006 Checked flood released discharge P=0.1% m3/s 12 5347 Dissipation structure Flip bucketV Waterway A Power intake gate 1 Power intake gate sill elevation m 1352 Orifice dimension of trash rack nxBxH m 8x5.5x113 Orifice dimension of maintenance stop logs nxBxH m 1x5.5x5.54 Orifice dimension of operation gate nxBxH m 4x5.5x5.5B Penstock 1 Penstock diameter m 5.5 2 Total length of one penstock m 229.57 3 Gradient slope of penstock % 13.95; 46.63 4 Penstock shell thickness mm 16-18 C Powerhouse characteristics 1 Turbine type Francis 2 Number of units 43 Installed capacity Nlm MW 2604 Firmed capacity Nb� MW 41.805 Max. head Hmax m 72.02

Trung Son hydropower project Technical design
Analysis and simulation of reservoir 16
No. Description Unit Value
6 Min. head Hmin m 51.327 Average head Htb m 66.308 Rated head Htt m 56.509 Max. discharge Qmax through turbine m3/s 52210 Average annual generated electricity E0 106 KWh 1018.61
11 Number of power generated hours at installed capacity hour 3918
D Tailrace channel 1 Bottom width (b) m 79.7 2 Slope factor (m) 0.5 ÷ 1.53 Gradient slope of channel bottom (i) 0.00014 Tailrace channel length (L) m 80
2.4 DATA FOR CALCULATION
- Reservoir regulation curve: Coordinate on regulation curves of Trung Son hydropower project are shown in below table:
Table 2-2: Water level on regulation curves of Trung Son hydropower project
No. Month NWL(m) CXT PPH HCCN MWL(m) 1 June 160.0 160.00 160.00 150.00 150.0 2 July 160.0 150.00 150.00 150.00 150.0 3 Aug 160.0 150.00 150.00 150.00 150.0 4 Sept 160.0 160.00 160.00 150.00 150.0 5 Oct 160.0 160.00 160.00 157.00 150.0 6 Nov 160.0 160.00 160.00 156.60 150.0 7 Dec 160.0 160.00 160.00 155.50 150.0 8 Jan 160.0 160.00 160.00 154.30 150.0 9 Feb 160.0 160.00 160.00 153.10 150.0 10 Mar 160.0 160.00 160.00 152.50 150.0 11 Apr 160.0 159.00 158.20 151.70 150.0 12 May 160.0 158.00 155.40 150.50 150.0
Remark: + NWL: Normal water level. + CXT: Redundant discharge control regulation curve + PPH: Critical reservoir water level regulation curve + HCCN: Limit water supply regulation curve + MNC: Minimum water level.
- 24 hours average flow to damsite of Trung Son hydropower project: see in chapter 1

Trung Son hydropower project Technical design
Analysis and simulation of reservoir 17
- Reservoir characteristic curve: reservoir characteristic curve is set up on the map of 1/10,000 scale, established in 2003 by Power Engineering Consulting Joint Stock Company 4 with aerial photograph method. The results are as below:
Table 2-3: Reservoir characteristic curve of Trung Son hydropower project
No. Elevation
Z (m) Area
F (km2) Storage volume
V (106m3) Remarks 1 85.0 0.0 0.0 2 90.0 0.3 0.6 3 95.0 0.5 2.6 4 100.0 1.1 6.4 5 105.0 1.7 13.2 6 110.0 2.2 22.7 7 115.0 2.8 35.1 8 120.0 3.5 50.9 9 125.0 4.4 70.6 10 130.0 5.1 94.1 11 135.0 5.9 121.6 12 140.0 7.0 153.9 13 145.0 8.2 191.9 14 150.0 9.6 236.4 MWL 15 155.0 11.1 288.1 16 160.0 13.1 348.5 NWL 17 165.0 15.2 419.3 18 170.0 17.6 501.2
- Relation curve between discharge and tailrace water level of Trung Son hydropower plant was set up based on hydraulic calculation formulas and river cross section, river bed longitudinal profile, investigation historical flood,…The results are as below:
Table 2-4:Relation curve between discharge and tailrace water level of Trung Son hydropower plant
No. Discharge Q (m3/s)
Water level Z (m) No. Discharge
Q (m3/s) Water level
Z (m) 1 0 85.90 17 300 90.51 2 10 86.71 18 350 90.76 3 20 87.27 19 400 90.98 4 30 87.82 20 500 91.39 5 40 88.37 21 600 91.78 6 50 88.67 22 700 92.14 7 60 88.81 23 800 92.48

Trung Son hydropower project Technical design
Analysis and simulation of reservoir 18
No. Discharge Q (m3/s)
Water level Z (m) No. Discharge
Q (m3/s) Water level
Z (m) 8 80 89.05 24 1000 93.12 9 100 89.25 25 1500 94.48 10 120 89.42 26 2000 95.66 11 150 89.66 27 3000 97.63 12 180 89.86 28 4000 99.41 13 200 89.98 29 5000 100.90 14 220 90.10 30 7000 103.82 15 250 90.26 31 8000 105.06 16 280 90.42 32 10000 107.38
- Efficiency of hydropower plant: Efficiency of unit at the calculation time depends on rated water head and discharge through turbine. In the calculation of daily hydro-energy operation of reservoir simulation, average efficiency of powerhouse is selected at 0.88.
2.5 CALCULATION, SIMULATION OF RESERVOIR
The process of reservoir simulation calculation is executed according hydrological years, with hydrological calculation data obtaned in 50 years starting from June 1, 1975 to May 31, 2007.
On the basic of the data calculation as mentioned above, calculating hydro-energy simulation in two cases: - Without Thanh Son reservoir in downstream of Trung Son hydropower plant - With Thanh Son reservoir in downstream of Trung Son hydropower plant
2.6 WITHOUT THANH SON RESERVOIR IN DOWNSTREAM OF TRUNG
SON HYDROPOWER PLANT (CASE 1)
2.6.1. Electric energy (Case 1)
- The results of hydro energy calculation shown that the Energy difference between daily flow and monthy flow for calculation is about -4.6%. The results of calculation reflected variation in simulation operation of reservoir according to average daily flow and average monthy flow. Trung Son reservoir has small regulation coefficient �= 0.015. Furthermore, the reservoir uses 2 months period as flood control for lowlands (from 15th July to 15th September annualy, reservoir water level at 150.0m elevation) hence regulation capacity of the reservoir in such period is not well enough. During flood control period, when natural inflow to reservoir is greater than maximum discharge for power generation, the redundant discharge will be released through the spillway (such

Trung Son hydropower project Technical design
Analysis and simulation of reservoir 19
redundant discharge shall not be considered as reservoir storage volume). The monthy average flow covers the average flow of incoming floods to reservoir, so, the redundant discharge through spillway of about 9% was calculated in reservoir discharge simulation. The daily average flow shown the incoming floods to the reservoir, so, the redundant discharge through spillway of 14% was calculated in reservoir discharge simulation. (greater than simulation of monthy average flow). According evaluation made by Design Consultant, the hydro energy simulation calculation results by daily average flow are more reliable than the hydro energy simulation calculation results by monthy average flow.
Table 2-5: Results of hydro-energy calculation of Trung Son HPP using daily flow data, without Thanh Son reservoir in downstream of powerhouse----------------------------------------------------------------- | No | Qs | Qtbin | Qx | Htt | N | E | ----------------------------------------------------------------- 1. 112.70 112.17 .00 65.31 63.78 558.68 2. 184.43 165.79 14.50 67.44 93.59 819.86 3. 193.34 172.10 23.60 66.49 96.13 842.10 4. 290.12 225.92 60.81 66.89 125.47 1099.11 5. 234.88 200.85 33.33 67.35 114.49 1002.94 6. 225.50 198.62 26.29 67.42 112.92 989.14 7. 285.93 232.26 53.08 67.02 130.67 1144.65 8. 265.17 222.07 42.51 67.15 125.65 1100.68 9. 196.35 188.96 7.71 67.35 107.41 940.95 10. 259.87 211.02 47.38 67.16 117.19 1026.60 11. 205.69 183.57 21.52 67.59 103.84 909.67 12. 154.83 143.59 14.07 66.23 81.86 717.09 13. 186.31 168.94 13.41 66.88 94.47 827.54 14. 232.57 212.00 19.99 67.17 118.57 1038.68 15. 253.44 200.21 52.65 67.28 111.19 974.03 16. 249.88 206.54 42.76 67.27 116.24 1018.25 17. 341.71 233.54 107.58 66.94 130.34 1141.74 18. 228.45 212.48 15.39 67.32 121.21 1061.83 19. 274.81 214.58 59.65 67.19 121.91 1067.91 20. 233.28 199.87 32.82 67.40 113.95 998.16 21. 221.72 209.59 11.55 67.37 119.18 1043.98 22. 314.56 272.84 41.13 66.71 154.54 1353.73 23. 238.89 220.43 17.92 67.31 124.91 1094.21 24. 255.04 208.25 46.16 67.35 118.06 1034.22 25. 255.54 237.42 17.54 67.05 134.30 1176.43 26. 292.48 246.29 45.60 66.94 139.44 1221.46 27. 203.34 186.93 15.83 67.61 107.85 944.77 28. 228.78 214.81 13.38 67.31 122.77 1075.48 29. 249.90 218.34 30.97 67.31 125.13 1096.15 30. 207.13 200.24 6.31 67.48 114.14 999.85 31. 175.81 161.98 13.23 67.84 93.08 815.42 32. 175.43 158.94 15.91 67.84 91.86 804.68 33. 229.75 205.65 23.51 67.37 118.08 1034.39 34. 275.91 234.00 41.32 66.99 131.43 1151.34 35. 206.27 181.01 24.68 67.58 101.18 886.35 36. 155.24 149.25 5.40 67.94 85.82 751.76 37. 172.08 164.69 6.80 67.83 94.78 830.31 38. 340.05 250.28 90.25 66.27 138.95 1217.23 39. 263.38 208.67 53.06 67.16 116.12 1017.22 40. 354.29 243.20 110.50 66.72 136.92 1199.39 41. 277.88 206.47 70.81 67.32 116.53 1020.81 42. 136.77 135.86 3.59 65.87 77.28 676.99

Trung Son hydropower project Technical design
Analysis and simulation of reservoir 20
43. 226.20 203.78 18.60 67.30 115.69 1013.43 44. 249.11 221.13 27.39 67.29 124.98 1094.86 45. 292.05 248.47 42.99 66.86 139.14 1218.85 46. 333.96 269.39 63.98 66.56 151.24 1324.91 47. 242.04 223.27 18.18 67.27 128.20 1123.05 48. 248.41 218.69 29.38 67.29 123.05 1077.94 49. 264.07 206.05 57.20 67.24 116.84 1023.55 50. 161.65 146.66 17.94 67.84 82.89 726.09 -----------------------------------------------------------------
--------------------------------------------------------------------------------------------------- |TT| NWL | MWL | Vtb | Vc | Vhi | Vplu | Q0 | Qtbin | Qxa | Qdb | Qmax | Hmax | --------------------------------------------------------------------------------------------------- 1. 160.00 150.00 348.53 236.40 112.13 112.13 237.14 203.15 33.40 66.53 504.0 71.07 --------------------------------------------------------------------------------------------------- |TT| Hmin | Htb | Nlm | Ndb | Ntb | E0 | Elu | Eki | Emua | Ekho | Hsd | Beta | --------------------------------------------------------------------------------------------------- 1. 48.05 64.85 260.00 41.75 114.91 1006.57 649.00 357.57 549.13 457.44 3871. .0150 ---------------------------------------------------------------------------------------------------
In which: - Qs: Incoming discharge to Trung Son dam site (m3/s) - Qtbin: Discharge through turbine (m3/s) - Qx: Redundant discharge through spillway (m3/s) - Htt: Water head (m) - N: Capacity (MW) - E: Electric energy (million kWh) - NWL: Normal water level (m) - MWL: Minimum water level (m) - Vtb: Total storage volume (million m3) - Vc: Dead storage (million m3) - Q0: Annual average discharge to dam site (m3/s) - Qdb: Firm discharge (m3/s) - Qmax: Design discharge through turbine (m3/s) - Hmax: Maximum water head (m) - Hmin: Minimum water head(m) - Htb: Average water head (m) - Nlm: Installed capacity (MW) - N�b: Firm capacity (MW) - E0: Long-term average electric energy (million kWh) - Eflood season: Long-term average electric energy in flood season (million kWh) - Edry flow season: Long-term average electric energy in dry flow season (million kWh) - Ewet season: Long-term average electric energy in raining season (million kWh) - Edry season: Long-term average electric energy in dry season (million kWh)
2.6.2. Trung Son hydropower plant tailrace water level (case 1)
- During the dry season days, the powerhouse is always operated with one turbine to ensure the release discharge to downstream to avoid great fluctuation in water level at downstream. The process of fluctuation in water level at downstream is considered as the most dangerous case when the power plant increases from 40% ÷ 50% capacity of one unit to installed capacity (Nlm= 260MW), equivalent to discharge increasing from minimum discharge of one unit (about 63m3/s) to powerhouse design discharge of 522m3/s. During the operating process, it is not permitted to increase discharge to level which is greater than natural increase discharge before existence of reservoir. The maximum natural increased discharge taken place in range of < 700m3/s in period from 1957 to 2007 as shown in below statistical table:

Trung Son hydropower project Technical design
Analysis and simulation of reservoir 21
Table 2-6: Process of maximum natural increased discharge (<700 m3/s) in period from 1957 to 2007
Time Qday & night (m3/s) � Q (m3/s) Discharge increased
time (hour) Note
Nov 13, 1966 124.37 Nov 14, 1966 675.3 551.0 12 Nov 15, 1966 653.3
Oct 16, 1985 220.2 Oct 17, 1985 690.2 470.0 12 Oct 18, 1985 632.9
Sept 14, 1998 208.0 Sept 15, 1998 664.8 456.7 24 Sept 16, 1998 757.8
July 23, 1989 201.3 July 24, 1989 653.1 451.8 24 July 25, 1989 1343.6
Oct 3, 1989 201.9 Oct 4, 1989 641.1 439.2 24 Oct 5, 1989 769.4
Sept 20, 1992 252.1 Sept 21, 1992 688.1 436.0 24 Sept 22, 1992 837.5
Oct 24, 1971 186.7 Oct 25, 1971 619.5 432.7 12 Oct 26, 1971 591.9
Nov 8, 1984 182.3 Nov 9, 1984 597.1 414.8 24
Nov 10, 1984 1300.2
Oct 12, 1988 174.6 Oct 13, 1988 574.6 400.0 24 Oct 14, 1988 1396.2
July 20, 1974 236.3 July 21, 1974 634.3 398.0 24 July 22, 1974 691.0
Average 445.0
- The table above shown that the hourly average natural increased discharge was about 40 m3. So, in order to increase operating discharge from 63m3/s (50% maximum discharge of one unit) to 522 m3/s (design discharge of powerhouse), it is required at least 11 hours

Trung Son hydropower project Technical design
Analysis and simulation of reservoir 22
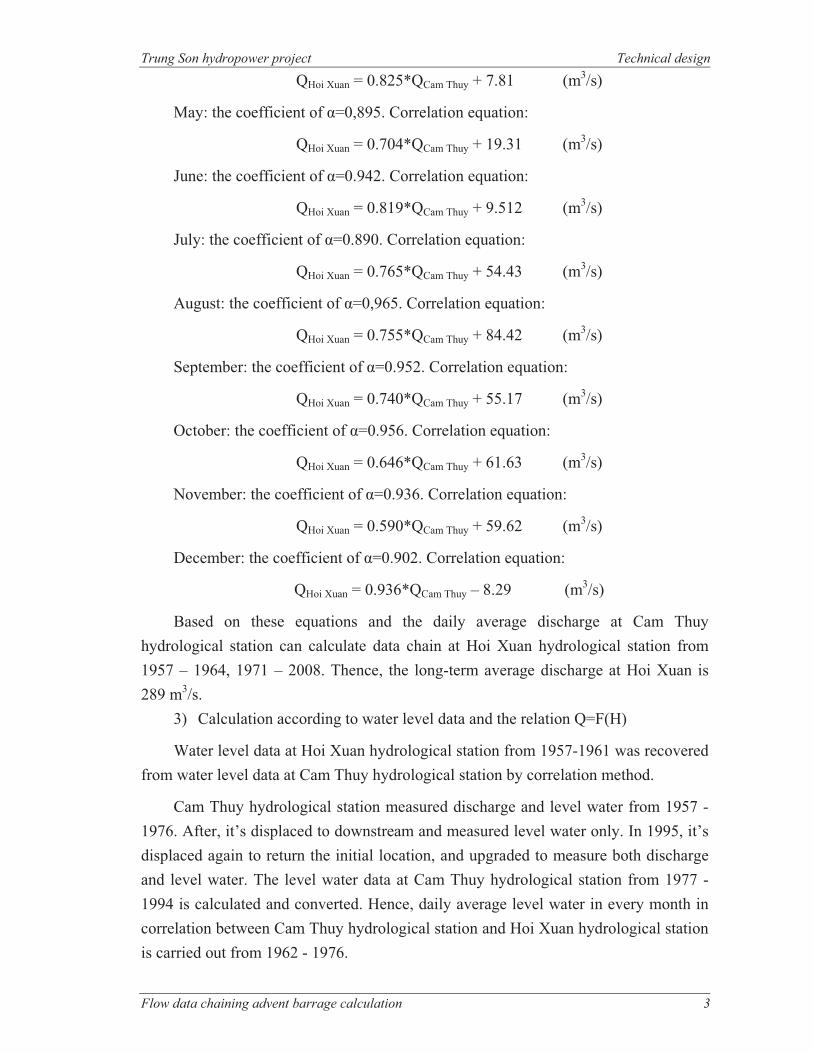
2.6.3. Specific characteristics of flow at power plant tailrace in daily period
The plant tailrace daily average water level, natural daily average water level at river across section in powerhouse area, daily average discharge at tailrace of power plant, natural daily average discharge at river cross-section in powerhouse area are shown in below figures:
Trun
g So
n hy
drop
ower
pro
ject
Fea
sibi
lity
Stud
y
Anal
ysis
and
sim
ulat
ion
of re
serv
oir
2
3
Ave
rage
wat
er le
vel a
nd n
atur
al w
ater
leve
l at T
rung
Son
hyd
ropo
wer
pla
nt (P
lant
tailr
ace
with
out T
hanh
Son
rese
rvoi
r)
88.5
0
89.0
0
89.5
0
90.0
0
90.5
0
91.0
0
91.5
0
92.0
0
92.5
0
025
5075
100
125
150
175
200
225
250
275
300
325
350
375
400
Tim
e (d
ay)
Water level (m)
Pla
nt ta
ilrac
e w
ater
leve
lN
atur
al ta
ilrac
e w
ater
leve
l

Trun
g So
n hy
drop
ower
pro
ject
Fea
sibi
lity
Stud
y
Anal
ysis
and
sim
ulat
ion
of re
serv
oir
2
4
Wat
er le
vel i
n lit
tle w
ater
yea
r with
freq
uenc
y P
=90%
and
nat
ural
wat
er le
vel a
t Tru
ng S
on h
ydro
pow
er p
lant
(pla
nt
tailr
ace
with
out T
hanh
Son
rese
rvoi
r)
88.5
0
89.0
0
89.5
0
90.0
0
90.5
0
91.0
0
91.5
0
92.0
0
92.5
0
93.0
0
93.5
0
94.0
0
025
5075
100
125
150
175
200
225
250
275
300
325
350
375
400
Tim
e (d
ay)
Water level(m)
Pla
nt ta
ilrac
e w
ater
leve
lN
atur
al w
ater
leve
l

Trun
g So
n hy
drop
ower
pro
ject
Fea
sibi
lity
Stud
y
Anal
ysis
and
sim
ulat
ion
of re
serv
oir
2
5
Wat
er le
vel i
n m
uch
wat
er y
ear w
ith fr
eque
ncy
P=1
0% a
nd n
atur
al w
ater
leve
l at T
rung
Son
hyd
ropo
wer
pla
nt (I
n ca
se
plan
t tai
lrace
with
out T
hanh
Son
rese
rvoi
r)
88.0
0
89.0
0
90.0
0
91.0
0
92.0
0
93.0
0
94.0
0
95.0
0
025
5075
100
125
150
175
200
225
250
275
300
325
350
375
400
Tim
e (d
ay)
Water level (m)
Pla
nt ta
ilrac
e w
ater
leve
lN
atur
al w
ater
leve
l

Trun
g So
n hy
drop
ower
pro
ject
Fea
sibi
lity
Stud
y
Anal
ysis
and
sim
ulat
ion
of re
serv
oir
2
6
Ave
rage
dis
char
ge a
nd n
atur
al d
isch
arge
at T
rung
Son
pla
nt ta
ilrac
e (In
cas
e P
lant
tailr
ace
with
out T
hanh
Son
rese
rvoi
r)
0.0
100.
0
200.
0
300.
0
400.
0
500.
0
600.
0
700.
0
800.
0
025
5075
100
125
150
175
200
225
250
275
300
325
350
375
400
Tim
e (d
ay)
Discharge (m3/s)
Dis
char
ge a
t pla
nt ta
ilrac
eN
atur
al d
isch
arge
at p
lant
tailr
ace

Trun
g So
n hy
drop
ower
pro
ject
Fea
sibi
lity
Stud
y
Anal
ysis
and
sim
ulat
ion
of re
serv
oir
2
7
Dis
char
ge in
littl
e w
ater
yea
r with
freq
uenc
y P
=90%
and
nat
ural
dis
char
ge a
t Tru
ng S
on p
lant
tailr
ace
(In c
ase
plan
t ta
ilrac
e w
ithou
t Tha
nh S
on re
serv
oir)
0
200
400
600
800
1000
1200
025
5075
100
125
150
175
200
225
250
275
300
325
350
375
400
Tim
e (d
ay)
Discharge (m3/s)
Dis
char
ge a
t pla
nt ta
ilrac
eN
atur
al d
isch
arge
at p
lant
tailr
ace

Trun
g So
n hy
drop
ower
pro
ject
Fea
sibi
lity
Stud
y
Anal
ysis
and
sim
ulat
ion
of re
serv
oir
2
8
Dis
char
ge in
muc
h w
ater
yea
r with
P=1
0% a
nd n
atur
al d
isch
arge
at T
rung
Son
hyd
ropo
wer
pla
nt ta
ilrac
e (In
cas
e pl
ant
tailr
ace
with
out T
hanh
Son
rese
rvoi
r)
0
200
400
600
800
1000
1200
1400
1600
025
5075
100
125
150
175
200
225
250
275
300
325
350
375
400
Tim
e(da
y)
Discharge (m3/s)
Dis
char
ge a
t pla
nt ta
ilrac
eN
atur
al d
isch
arge
at p
lant
tailr
ace

Trung Son hydropower project Feasibility Study
Analysis and simulation of reservoir 29
2.6.4. Specific characteristics of flow at power plant tailrace in hourly period
For estimation of flow specific characteristics fluctuation level (water level, discharge) in hourly period at river cross-section at powerhouse area, the Design Consultant calculated some operation cases, particularly as below:
Table 2-7:Operation of Trung Son hydropower plant in case daily average discharge of 234 m3/sreleased to downstream
Hour Discharge(m3/s)
Unit 1 Unit 2 Unit 3 Unit 4 Total Increasing 1 63 63 2 63 63 3 63 63 4 63 63 5 63 63 6 63 63 7 63 63 8 126 126 63 9 126 126
10 126 126 11 126 63 189 63 12 126 63 63 252 63 13 126 126 63 315 63 14 126 126 126 378 63 15 126 126 126 378 16 126 126 126 378 17 126 126 126 63 441 63 18 126 126 126 126 504 63 19 126 126 126 126 504 20 126 126 126 126 504 21 126 126 126 126 504 22 126 63 63 63 315 -189 23 63 63 -252 24 63 63
Average 102 55 50 26 234

Trung Son hydropower project Feasibility Study
Analysis and simulation of reservoir 30
Table 2-8: Operation of Trung Son hydropower plant in case daily average discharge of 200 m3/s
released to downstream
Hour
Discharge(m3/s)
Unit 1 Unit 2 Unit 3 Unit 4 Total Increasing 1 63 63 2 63 63 3 63 63 4 63 63 5 63 63 6 63 63 7 63 63 8 63 63 9 126 126 63
10 126 126 11 126 126 12 126 126 13 126 126 14 126 63 189 63 15 126 63 63 252 63 16 126 126 63 315 63 17 126 126 63 63 378 63 18 126 126 126 63 441 63 19 126 126 126 126 504 63 20 126 126 126 126 504 21 126 126 126 126 504 22 126 63 63 63 315 -189 23 63 63 63 189 -126 24 63 63 -126
Average 100 42 34 24 200

Trung Son hydropower project Feasibility Study
Analysis and simulation of reservoir 31
Table 2-9: Operation of Trung Son hydropower plant in case daily average discharge of 155 m3/s released to downstream
Hour
Discharge(m3/s)
Unit 1 Unit 2 Unit 3 Unit 4 Total Increasing 1 63 63 2 63 63 3 63 63 4 63 63 5 63 63 6 63 63 7 63 63 8 63 63 9 63 63
10 63 63 11 63 63 12 126 126 63 13 126 126 14 126 126 15 126 63 189 63 16 126 126 252 63 17 126 126 63 315 63 18 126 126 126 378 63 19 126 126 126 378 20 126 126 126 378 21 126 126 126 378 22 126 63 63 252 -126 23 63 63 -189 24 63 63
Average 92 37 26 155

Trung Son hydropower project Feasibility Study
Analysis and simulation of reservoir 32
Table 2-10: Operation of Trung Son hydropower plant in case daily average discharge of 102 m3/sreleased to downstream
Hour
Discharge(m3/s)
Unit 1 Unit 2 Unit 3 Unit 4 Total Increasing 1 63 63 2 63 63 3 63 63 4 63 63 5 63 63 6 63 63 7 63 63 8 63 63 9 63 63
10 63 63 11 63 63 12 63 63 13 63 63 14 126 126 63 15 126 126 16 126 126 17 126 63 189 63 18 126 126 252 63 19 126 126 252 20 126 126 252 21 63 63 126 -126 22 63 63 -63 23 63 63 24 63 63
Average 81 21 102

Trung Son hydropower project Feasibility Study
Analysis and simulation of reservoir 33
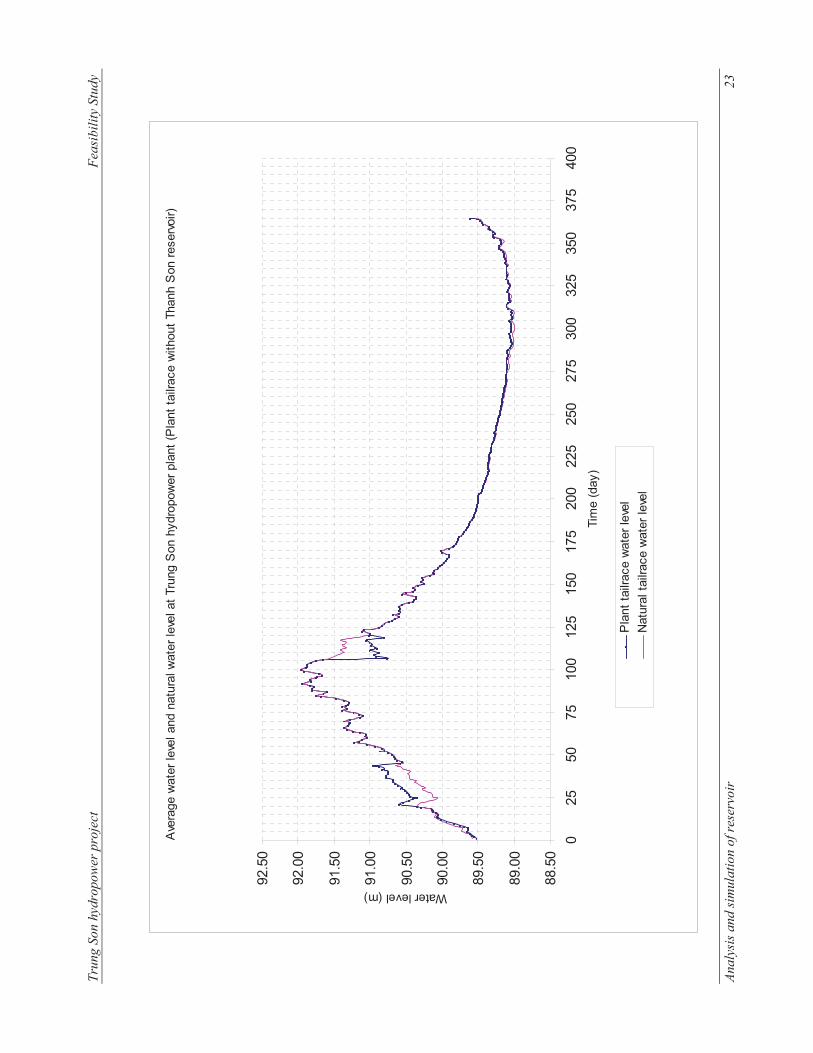
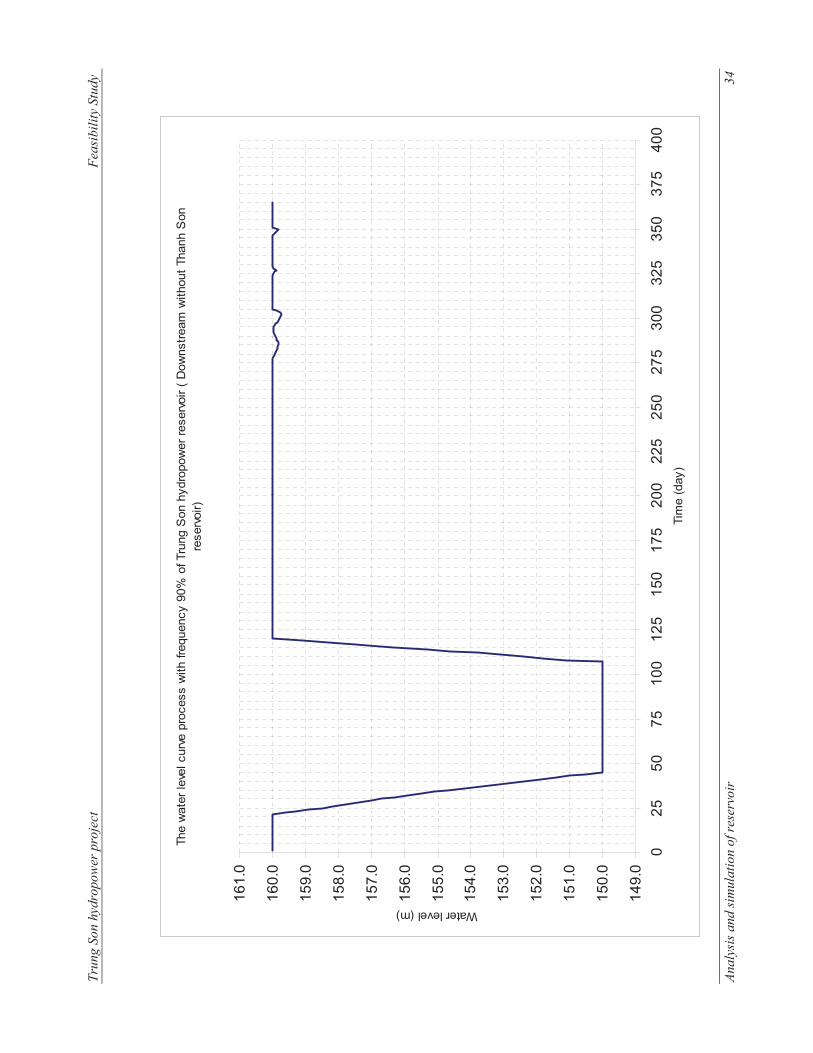
2.6.5. Trung Son hydropower reservoir water level fluctuation (case1)
- Regulation on maximum water level of reservoir: from 15th July to 15th September annually, maximum water level of reservoir is regulated at minimum water level of 150.0m to control flood for lowlands (according regulation on water level of reservoir specified in Trung Son hydropower reservoir operation rules which was approved by Ministry of Industry and Trade). According stability calculation of the reservoir banks (in some areas with possibility of reservoir banks collapse and sliding), it is shown that the requirement on process of draining water level in reservoir should not be greater than 0.7m/day and night, therefore in the hydro energy calculation, the time requested for draining water level in reservoir from NWL=160.0m down MWL=150.0m should be over 15 days. In the actual reservoir operation process, depending on incoming flow discharge in initial flood season, reservoir draining to lower water level should be made suitably, to ensure minimum redundant discharge and increase electricity generation output. The actual process of draining reservoir water level can be twenty days to drain water level from 160.0m down to water level at 150.0m.
- The generation discharge include natural incoming discharge to reservoir and discharge supplied from reservoir. The reservoir discharge supply potential is shown in below table:
Table 2-11: Discharge supply potential from Trung Son hydropower reservoir
No. Elevation Z (m)
Surface area of reservoir F
(km2)
Storage capacity of reservoir V
(106m3)
Discharge supply from the reservoir
Qcâp (m3/s) Remarks
1 160.0 13.13 348.5 2 159.0 12.72 336.4 140.0 3 158.0 12.31 324.3 140.0 4 157.0 11.90 312.2 140.0 5 156.0 11.49 300.2 140.0 6 155.0 11.08 288.1 140.0 7 154.0 10.78 277.7 119.6 8 153.0 10.49 267.4 119.6 9 152.0 10.19 257.1 119.6 10 151.0 9.90 246.7 119.6 11 150.0 9.60 236.4 119.6
- The process of reservoir impounding shall begin from 15th September annually. The reservoir impounding is allowable to full water level from time to time as possible because the erosion to reservoir banks shall not be taken place during process of impounding water
Trun
g So
n hy
drop
ower
pro
ject
Fea
sibi
lity
Stud
y
Anal
ysis
and
sim
ulat
ion
of re
serv
oir
34
The
wat
er le
vel c
urve
pro
cess
with
freq
uenc
y 90
% o
f Tru
ng S
on h
ydro
pow
er re
serv
oir (
Dow
nstre
am w
ithou
t Tha
nh S
on
rese
rvoi
r)
149.
0
150.
0
151.
0
152.
0
153.
0
154.
0
155.
0
156.
0
157.
0
158.
0
159.
0
160.
0
161.
0
025
5075
100
125
150
175
200
225
250
275
300
325
350
375
400
Tim
e (d
ay)
Water level (m)
Trun
g So
n hy
drop
ower
pro
ject
Fea
sibi
lity
Stud
y
Anal
ysis
and
sim
ulat
ion
of re
serv
oir
35
The
wat
er le
vel c
urve
pro
cess
with
freq
uenc
y 10
% o
f Tru
ng S
on h
ydro
pow
er re
serv
oir (
Dow
nstre
am w
ithou
t Tha
nh S
on
rese
rvoi
r)
149.
0
150.
0
151.
0
152.
0
153.
0
154.
0
155.
0
156.
0
157.
0
158.
0
159.
0
160.
0
161.
0
025
5075
100
125
150
175
200
225
250
275
300
325
350
375
400
Tim
e (d
ay)
Water level (m)

Trun
g So
n hy
drop
ower
pro
ject
Fea
sibi
lity
Stud
y
Anal
ysis
and
sim
ulat
ion
of re
serv
oir
36
The
avea
rge
wat
er le
vel c
urve
pro
cess
of T
rung
Son
hyd
ropo
wer
rese
rvoi
r ( D
owns
tream
with
out T
hanh
Son
rese
rvoi
r)
149.
0
150.
0
151.
0
152.
0
153.
0
154.
0
155.
0
156.
0
157.
0
158.
0
159.
0
160.
0
161.
0
025
5075
100
125
150
175
200
225
250
275
300
325
350
375
400
Tim
e (d
ay)
Water level (m)

Trung Son hydropower project Technical design
Analysis and simulation of reservoir 37
2.7 DOWNSTREAM WITH THANH SON RESERVOIR (CASE 2)
2.7.1. Electric energy (case 2)
- In case with Thanh Son Hydropower reservoir (Normal Water Level = 89.0m) located downstream of Trung Son hydro powerhouse, the toe of Trung Son hydro powerhouse is submerged. The hydro energy calculation results show that the energy decreases inconsiderable in compared with the case of insubmerged powerhouse toe (0.08 million KWh). See details as below:
Table 2-12: Hydro energy calculation results of Trung Son – using daily flow data, with Thanh Son reservoir dowstream of Trung Son HPP
----------------------------------------------------------------- | No | Qs | Qtbin | Qx | Htt | N | E | ----------------------------------------------------------------- 1. 112.70 112.17 .00 65.13 63.71 558.07 2. 184.43 165.79 14.50 67.39 93.57 819.64 3. 193.34 172.10 23.59 66.44 96.11 841.90 4. 290.12 225.93 60.81 66.87 125.46 1099.06 5. 234.88 200.84 33.32 67.34 114.48 1002.84 6. 225.50 198.62 26.29 67.40 112.91 989.06 7. 285.93 232.26 53.07 67.01 130.67 1144.65 8. 265.17 222.08 42.50 67.14 125.64 1100.61 9. 196.35 188.98 7.71 67.32 107.41 940.89 10. 259.87 211.01 47.38 67.14 117.17 1026.42 11. 205.69 183.58 21.52 67.58 103.84 909.60 12. 154.83 143.59 14.06 66.19 81.84 716.88 13. 186.31 168.94 13.40 66.84 94.45 827.34 14. 232.57 212.00 19.99 67.14 118.56 1038.55 15. 253.44 200.22 52.64 67.26 111.18 973.95 16. 249.88 206.55 42.75 67.26 116.24 1018.22 17. 341.71 233.54 107.57 66.93 130.34 1141.75 18. 228.45 212.48 15.38 67.31 121.21 1061.81 19. 274.81 214.58 59.64 67.18 121.90 1067.88 20. 233.28 199.87 32.82 67.40 113.95 998.18 21. 221.72 209.59 11.55 67.36 119.18 1043.98 22. 314.56 272.85 41.13 66.71 154.54 1353.75 23. 238.89 220.43 17.92 67.29 124.90 1094.15 24. 255.04 208.25 46.15 67.33 118.05 1034.14 25. 255.54 237.42 17.54 67.04 134.29 1176.39 26. 292.48 246.30 45.59 66.94 139.44 1221.47 27. 203.34 186.93 15.82 67.60 107.85 944.73 28. 228.78 214.82 13.38 67.31 122.77 1075.49 29. 249.90 218.34 30.96 67.31 125.13 1096.15 30. 207.13 200.24 6.31 67.48 114.13 999.81 31. 175.81 161.99 13.22 67.83 93.08 815.37 32. 175.43 158.94 15.91 67.82 91.85 804.58 33. 229.75 205.66 23.51 67.36 118.08 1034.38 34. 275.91 234.01 41.31 66.99 131.43 1151.34 35. 206.27 181.01 24.68 67.56 101.17 886.29 36. 155.24 149.25 5.40 67.91 85.80 751.62 37. 172.08 164.70 6.80 67.81 94.77 830.22 38. 340.05 250.32 90.25 66.24 138.95 1217.24 39. 263.38 208.65 53.05 67.13 116.09 1016.92 40. 354.29 243.20 110.50 66.72 136.92 1199.41 41. 277.88 206.48 70.81 67.30 116.52 1020.74 42. 136.77 135.86 3.59 65.79 77.24 676.64 43. 226.20 203.79 18.60 67.29 115.68 1013.37 44. 249.11 221.14 27.39 67.29 124.98 1094.83 45. 292.05 248.48 42.98 66.85 139.14 1218.83 46. 333.96 269.40 63.97 66.56 151.25 1324.94 47. 242.04 223.27 18.18 67.27 128.20 1123.06 48. 248.41 218.70 29.38 67.27 123.04 1077.86 49. 264.07 206.06 57.19 67.22 116.83 1023.43 50. 161.65 146.67 17.93 67.80 82.87 725.91 -----------------------------------------------------------------
--------------------------------------------------------------------------------------------------- |TT| NWL | MNL | Vtb | Vc | Vhi | Vplu | Q0 | Qtbin | Qxa | Qdb | Qmax | Hmax | --------------------------------------------------------------------------------------------------- 1. 160.00 150.00 348.53 236.40 112.13 112.13 237.14 203.16 33.40 65.84 504.0 70.95 --------------------------------------------------------------------------------------------------- |TT| Hmin | Htb | Nlm | Ndb | Ntb | E0 | Elu | Eki | Emua | Ekho | Hsd | Beta | --------------------------------------------------------------------------------------------------- 1. 48.05 64.85 260.00 41.25 114.90 1006.49 649.01 357.48 549.15 457.34 3871. .0150 ---------------------------------------------------------------------------------------------------

Trung Son hydropower project Technical design
Analysis and simulation of reservoir 38
In which: - Qs: Discharge coming to dam site of Trung Son (m3/s) - Qtbin: Discharge through turbine (m3/s) - Qx: Redundant discharge release to spillway(m3/s) - Htt: Water head calculation (m) - N: Capacity (MW) - E: Electric energy (million kWh) - NWL: Normal water level (m) - MWL: Minimum water level (m) - Vtb: Total storage capacity (million m3) - Vc: Dead storage (million m3) - Q0: Annual average discharge to dam site(m3/s) - Qdb: Firm discharge (m3/s) - Qmax: Design discharge through powerhouse(m3/s) - Hmax: Maximum water head (m) - Hmin: Minimum water head (m) - Htb: Average water head (m) - Nlm: Installed capacity (MW) - N�b: Firm capacity(MW) - E0: Long-term average electric energy (million kWh) - Eflood season: Long-term average electric energy in flood season (million kWh) - Edry flow season: Long-term average electric energy in dry flow season (million kWh) - Ewet season: Long-term average electric energy in raining season (million kWh) - Edry season: Long-term average electric energy in dry season (million kWh)
2.7.2. Trung Son hydropower Plant tailrace water level (Case 2)
- The catchment basin area calculate to damsite of Trung Son HPP is 14660 km2, to damsite of Thanh Son HPP is 14760 km2, middle catchment basin area is 100 km2
- Downstream of Trung Son hydropower plant is Thanh Son hydropower plant, so Trung Son Hydropower Plant tailrace water level is always higher than minimum water level of Thanh Son hydropower plant. The Thanh Son HPP is design with dam combined with spillway in Ma river and dam toe type powerhouse, so the water level fluctuation in reservoir is at small range. The Thanh Son HPP shall be operated synchronously with Trung Son HPP. As of present time, Thanh Son hydropower project is in feasibility study stage, the reservoir parameters such as NWL; MWL; Nlm…have not yet been defined presisely. In case the reservoir of Thanh Son HPP has 24 hours regulation storage volume, it is allowable to release discharge from 63m3/s up to 522m3/s in short time from Trung Son HPP (as allowable condition of equipment of powerhouse)
Trung Son hydropower project Technical design
Analysis and simulation of reservoir 39
2.7.3. Trung Son HPP reservoir water level fluctuation (case 2)
- In case with Thanh Son reservoir downstream of Trung Son HPP reservoir water levels fluctuation shall be same as in case without Thanh Son reservoir. The possibility of reservoir impounding to maximum water level is allowable. The reservoir water level drawn-down allowable condition should not be more than 0.7m/24 hours. In the process of operation, depending on hydrological condition (incoming flow to damsite) water draining capacity shall be calculated in such a manner to ensure minimum discharge released through spillway and maximum electric energy generation output.

Trung Son hydropower project Technical design
Appendix 40
Chapter 3: WATER SUPPLY DEMAND FOR DOWNSTREAM 3.1 WATER DEMAND AT DOWNSTREAM
3.1.1. Scope of water demand
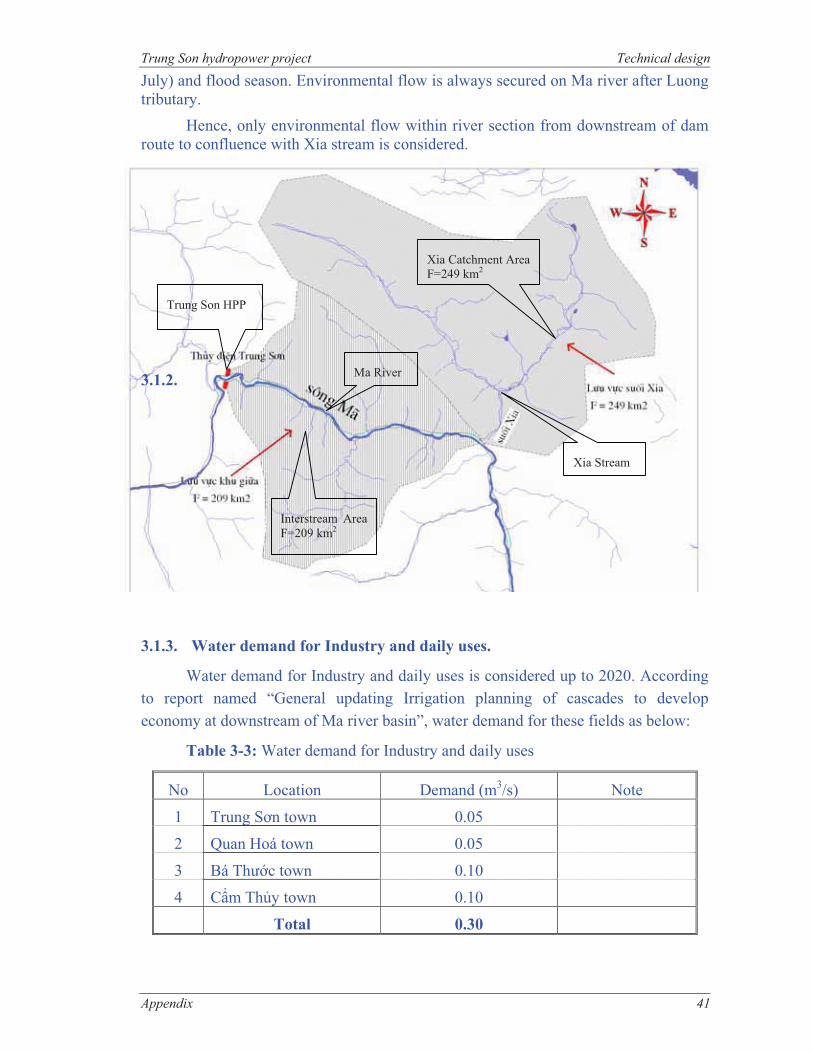
Water demand at Ma River downstream was accessed in many previous plans by Ministry of Agriculture and Rural Development (MARD). According to report named “General updating Irrigation planning of cascades to develop economy at downstream of Ma river basin” which was conducted by Water Resource Planning Institute, under MARD, main purposes of projects on Ma River are electric generation and flood control. Main purposes of projects on Chu River are water supply and flood control. This does not mean downstream of Trung Son project has no water during dry season. Impounding period of Trung Son reservoir will only take place a short time (4 days in flood season). Water demand at downstream, however, of Trung Son project, from P/H to confluence of Ma River and Xia stream (20km) and from Xia stream to confluence of Ma River and Luong tributary (25km), needs to be evaluated.
- River reach from P/H to confluence of Ma River and Xia stream (20km: There are villages and local people living along both two banks. Water source for living and irrigation is mainly groundwater and streams. They were not use water from Ma River. For navigation on river: Along river bank, access road was built from Co Luong to dam site. Therefore, environmental flow on this river reach mainly secures flora and fauna such as land cover along banks, buffalo, cow, etc, and aquatic life. Result of monthly flow calculation is shown in Table below: Table 3-1: Average monthly flow within area from dam route to Xia stream. Month Jan Feb Mar Apr May June July Aug Sept Oct Nov Dec
Qo (m3/s) 1.74 1.52 1.45 1.60 2.63 4.04 5.14 7.28 9.9 7.84 4.16 2.23
- River reach from Xia stream to confluence of Ma River and Luong tributary (25km): There are many tributaries and large stream which has high flow supply for Ma River’s flow such as Xia stream, Luong and Lung tributaries, Chu River. Xia catchment area is 249km2 with 5.21 m3/s of annual flow, 8.07 m3/s of average flood flow, and 6.5 m3/s when diversion culvert is blocked (July). Table 3-2: Average monthly flow of Xia stream. Month Jan Feb Mar Apr May June July Aug Sept Oct Nov Dec
Qo (m3/s) 2.20 1.92 1.83 2.02 3.33 5.10 6.50 9.20 12.5 9.91 5.25 2.82
Luong tributary has 970 km2 of catchment area with 23 m3/s of annual flow and 40 m3/s of average flood flow. Therefore, abundant water resource can be supplied to this river section. Moreover, National Highway No. 15 (QL15) along river bank was built so transportation does not be affected during reservoir impounding (3-5days on
Trung Son hydropower project Technical design
Appendix 41
July) and flood season. Environmental flow is always secured on Ma river after Luong tributary. Hence, only environmental flow within river section from downstream of dam route to confluence with Xia stream is considered.
3.1.2.
3.1.3. Water demand for Industry and daily uses.
Water demand for Industry and daily uses is considered up to 2020. According to report named “General updating Irrigation planning of cascades to develop economy at downstream of Ma river basin”, water demand for these fields as below:
Table 3-3: Water demand for Industry and daily uses
No Location Demand (m3/s) Note
1 Trung S�n town 0.05
2 Quan Hoá town 0.05
3 Bá Th��c town 0.104 C�m Thy town 0.10
Total 0.30
Ma River
Xia Catchment Area F=249 km2
Trung Son HPP
Xia Stream
Interstream Area F=209 km2

Trung Son hydropower project Technical design
Appendix 42
3.1.4. Water demand to secure environmental and ecological system.
In order to mitigate effects on environment of Ma river reach, time to set blocking of diversion culvert is flood season. Tentative blocking time is on July when it often rains and flow is approximate to annual value (418m3/s) on catchment from Trung Son dam route to Xia stream. Impounding time is 4 days to raise reservoir water level reach to spillway crest elevation.
During impounding period, flow within river reach from dam route to confluence with Xia stream is runoff and groundwater. This 290 km2 catchment has average monthly flow in July with Qo= 5.14 m3/s, equivalent to 14.12% of natural flow of Ma River at the dam site. Minimum observed monthly flow at the dam site from 1957 to 2002 is 36.4m3/s occurred in May 1957.
According to Tenant method, environmental flow to secure ecological system in flood season is about 10-30% of annual flow. Therefore, flow on Ma river reach from dam site to Xia stream which is 5.14m3/s (14.12% of minimum monthly flow) is enough to supply all demands and environment along the river reach in 04 days of diversion culvert blocking. Then, environmental flow will be supplied by discharge through spillway after these 4 days.
3.1.5. Conclusion
With selected method for diversion culvert blocking and time to raise reservoir water level to spillway crest in 4 days in July, flow on 20km-Ma river reach at downstream of Trung Son dam will supply from runoff and groundwater. Hence, there is no any structure that need be built in order to release discharge to downstream during 4 days of culvert blocking. Cost of project, then, will be saved.
3.2 ENVIRONMENT FLOW RELEASE MEASURES
In order to release flow discharge at 15 m3/s during reservoir impounding period, it is required to install released culvert with dimension BxH=1.2x1.2m for Trung Son HPP. The position of this released culvert is next to diversion culvert.
The hydraulic cylinders operated maintenance gate and operation gate with dimensions 1.2x1.2m are arranged at upstream of this culvert.
Design of environment flow released culvert are shown in drawings of appendices. 3.3 DISCHARGE OF WATER DURING OPERATION PROCESS
During operation process, water will be discharged to downstream through the turbines of powerhouse. During operation of powerhouse, if there is any failure encountered or ceases operation due to different causes, water will be discharged through spillway to maintain environment flow and water supply demand for downstream without needing any other discharge structures, because the spillway weir

Trung Son hydropower project Technical design
Appendix 43
elevation is set at 145m and minimum water level is set at 150m (5m higher than spillway crest elevation).
3.4 DISCHARGE OF MUD AND SAND
According to the calculation about sedimentation in reservoir of Trung Son HPP, after 100 years, the quantity of mud and sand still do not reach to the intake gate elevation. Mud and sand will be mainly accumulated in the end part and middle part of reservoir, so it is not necessary to install discharge outlet for mud and sand. The results of calculation in 2.2 “Subject calculation sediment backwater” Trung Son HPP, after 100 years operation, sediment elevation at section near the dam at 97.0m 3.5 RESERVOIR DEWATERING
According to the ruling standards of Vietnam as well as many other countries in the world, there is no obligation for installation of drainage system for reservoir dewatering.
3.6 CONCLUSION
Installation of a culvert to release water to downstream at 15m3/s discharge to maintain ecological environment during reservoir impounding period is necessary.
When the reservoir impounding is up to the full supply water level, the discharge culvert ceases its role, and according to the relevant regulations, there is no need to install culvert for reservoir dewatering. Specific calculations on sedimentation confirmed that it is not required to arrange culvert for discharging mud and sand.

Trung Son hydropower project Technical design
Appendix 44
Chapter 4: RESERVOIR AND DOWNSTREAM LANDSLIDE POSSIBILITY FORECAST
4.1 RESERVOIR BANK LANDSIDE POSSIBILITY
4.1.1. CALCULATION DATA
4.1.1.1 Table of physical – mechanical properties indices stability calculation bank of reservoir
Table 4-1: Physical-mechical properties indices stability calculation bank of reservoir
Material layer � (T/m3) (natural/saturated)
� (natural/saturated)
C (KG/cm2) (natural/saturated)
edQ 1.72/1.79 ����� 0.18/0.16
IA1 1.65/1.77 25/18 0.24/0.18
IA2 1.68/1.79 25 0.22
IB 2.66/2.68 29 2.00
IIA 2.77/2.79 37 2.504.1.1.2 Project grade: grade II
Stability safe factor allowable of project: According Vietnamese construction standard TCXD V� 285: 2002 with project grade II, natural slope, safety factor is calculated according to the formula as follow:
k nc.kn/m In which:
nc: Load combination factor. For basic load combination: nc=1, for special load combination: nc=0.9.
kn: Guarantee factor calculated according to project scale and tasks. Project grade II. Guarantee factor is taken as kn=1.2.
m: Operating condition factor. For natural and artificial slope m=1. with parameters as above, safety factor is calculated as follow: - Basic load combination : k = 1.20 - Special load combination : k= 1.08
4.1.1.3 Location of section calculation According topographical, geological condition at reservoir foundation area
studied in technical design stage to choose reservoir bank section easy to sliding Specifically are 5 typical sections with features as below: sloping topographical,
thick weak geological zone and thin covering vegetation layer to calculate and check stability
See location of calculation sections in drawing “chart location of section stability calculation“ see in appendix
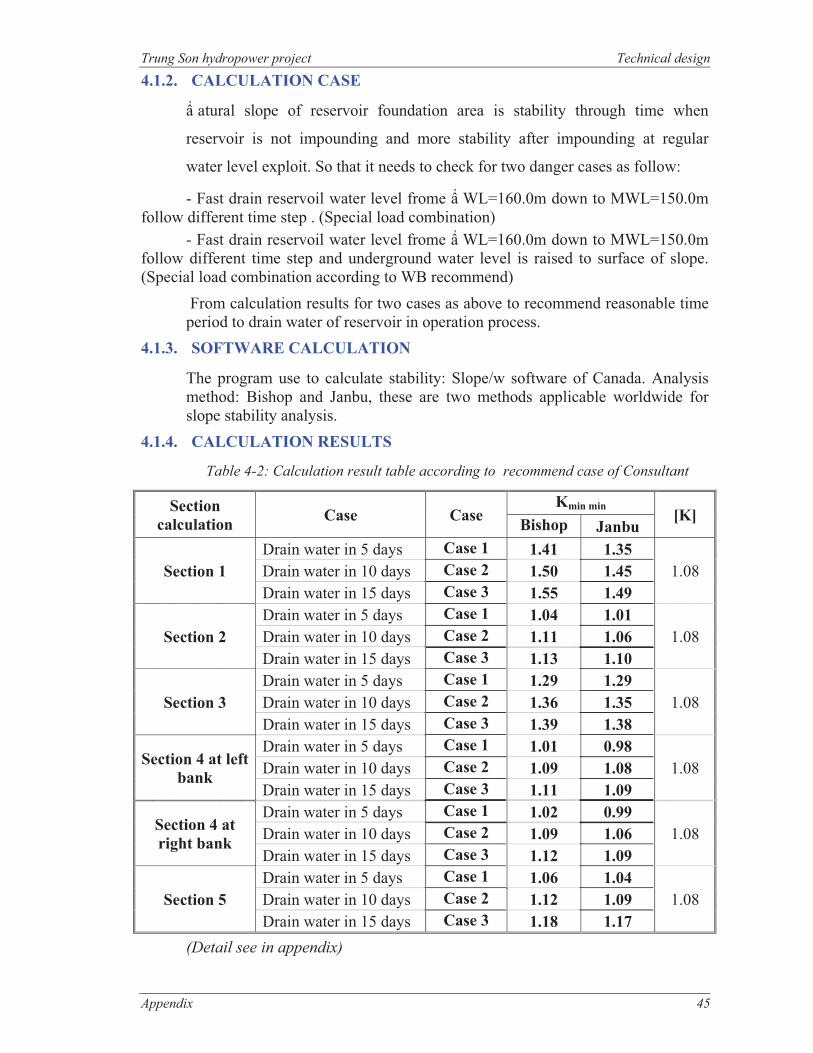
Trung Son hydropower project Technical design
Appendix 45
4.1.2. CALCULATION CASE
� atural slope of reservoir foundation area is stability through time when
reservoir is not impounding and more stability after impounding at regular
water level exploit. So that it needs to check for two danger cases as follow:
- Fast drain reservoil water level frome � WL=160.0m down to MWL=150.0m follow different time step . (Special load combination) - Fast drain reservoil water level frome � WL=160.0m down to MWL=150.0m follow different time step and underground water level is raised to surface of slope. (Special load combination according to WB recommend)
From calculation results for two cases as above to recommend reasonable time period to drain water of reservoir in operation process.
4.1.3. SOFTWARE CALCULATION
The program use to calculate stability: Slope/w software of Canada. Analysis method: Bishop and Janbu, these are two methods applicable worldwide for slope stability analysis.
4.1.4. CALCULATION RESULTS
Table 4-2: Calculation result table according to recommend case of Consultant
Section calculation Case Case
Kmin min [K] Bishop Janbu
Section 1 Drain water in 5 days Case 1 1.41 1.35
1.08 Drain water in 10 days Case 2 1.50 1.45 Drain water in 15 days Case 3 1.55 1.49
Section 2 Drain water in 5 days Case 1 1.04 1.01
1.08 Drain water in 10 days Case 2 1.11 1.06 Drain water in 15 days Case 3 1.13 1.10
Section 3 Drain water in 5 days Case 1 1.29 1.29
1.08 Drain water in 10 days Case 2 1.36 1.35 Drain water in 15 days Case 3 1.39 1.38
Section 4 at left bank
Drain water in 5 days Case 1 1.01 0.98 1.08 Drain water in 10 days Case 2 1.09 1.08
Drain water in 15 days Case 3 1.11 1.09
Section 4 at right bank
Drain water in 5 days Case 1 1.02 0.99 1.08 Drain water in 10 days Case 2 1.09 1.06
Drain water in 15 days Case 3 1.12 1.09
Section 5 Drain water in 5 days Case 1 1.06 1.04
1.08 Drain water in 10 days Case 2 1.12 1.09 Drain water in 15 days Case 3 1.18 1.17
(Detail see in appendix)

Trung Son hydropower project Technical design
Appendix 46
Table 4-3: Calculation result table according to recommend case of WB
Section calculation Case
Kmin min[K]
Bishop Janbu
Section1 Underground water level is raised to the surface of the slope 0.80 0.79 1.08
Section2 Underground water level is raised to the surface of the slope 0.40 0.37 1.08
Section3 Underground water level is raised to the surface of the slope 0.70 0.68 1.08
Section 4 at left bank
Underground water level is raised to the surface of the slope 0.44 0.42 1.08
Section 4 at right bank
Underground water level is raised to the surface of the slope 0.55 0.54 1.08
Section5 Underground water level is raised to the surface of the slope 0.40 0.37 1.08
(See details in appendix) 4.1.5. CONCLUSION AND RECOMMENDATION FROM CALCULATION
COMBINATION DONE BY CONSULTANT
According to calculation result mentioned in Table 4-2, recommendation can be made, as follow:
- The banks of reservoir shall be instable in case water level draining from � WL=160m down to MWL=150m in period time � 5 days for Bishop method and �10 days for Janbu method. However in practical operation reservoir, water level draining from � WL=160m down to MWL=150m shall be taken place in 20 days period.
- In the process of operation reservoir, the reservoir drawn-down water level in 24 hours period should not be over 0.7m to protect environment and stable reservoir banks.
4.1.6. ANALYSIS RECOMMEND CASE OF WB
For Consultancy, WB has recommended a case which is a extreme case, in fact it cannot occur because of the following reasons:
- The formation process of underground water level is happened in a long time and stabilized versus time. The fluctuation of underground water level is just occured at the location water level adjacent of river bank. Therefore, the case underground water level is raised to the surface of the slope which cannot occur. In fact it is checked in process exploratory drilling geologic for many.
- The natural rive bank slope of Trung Son HPP area is heavy gradient (from 300
to 450). Therefore the water shall be discharged follow subsurface flow down natural water-course when it has heavy rain, only a small part of the rain-water percolation

Trung Son hydropower project Technical design
Appendix 47
into underground. The part of leakage water just enough to do water-saturated soil sub-grade lap on surface of the slope and it cannot raise to the slope surface.
- Consultancy has checked realistic condition that: the slopes when HPP doesn’t build yet which is stabilized before age-old with reputed that underground water level is raised to the surface of the slope by heavy rain, results show all the slopes in shear with safe factors are very low, that fact indicate calculation case as above never occur. (Results have shown at table 4-3 and in appendix).
4.2 EROSION RIVER BED OF RESERVOIR DOWNSTREAM
The river bed erosion is a part of the process of moving sediment cause flow. This phenomena is happening continuous in the time. To estimate erode ability river bed for specific river. measurement data and study about sediment moving flow include suspended load and bed load in a necessary period time. In addition. factors effect to the sediment moving process as form of river bed. covering vegetation bed. geological structure of river bed and banks. ..etc.
� owadays. there are studies in the world about erosion and moving layers at river bed cause by flow for different grain component types. The method calculations usually application so much and was mention in Handbook of Hydrology. Chapter 12 of David R.Maidment author. McGraw-Hill publisher. Inc.. 1992 include: “Mayer-Peter and Muller (1948)”. “Einstein (1950)”. “Bagnold (1956.1966. 1973)”. and “Paker (1990)”. In which. Mayer-Peter method and Muller method was application for river bed has coarse grain component. grain size from 0.4mm to 30mm. The Bagnold method using for flow has much content sediment. The Einstein method is nearly complete and the most suitable. The other methods are necessary to estimation much more.
Out of Mayer-Peter and Muller method as mentioned above. other methods as Acker and White (1973). England-Hansen (1967). Laursen-Copeland (1968.1989). Toffeleti (1968). Yang (1973.1984). Wilcock (2001. 2003) was introduction in HEC-RAS 4.0 (HEC-6) software to calculate moving sediment ability by flow.
Downstream riverbed erosion assessment for Trung Son HPP is a complicated study which requires a lot of data, including accuracy measured and observed data, to apply for a specific erosion modeling. However, based on the current data, the consultant can give the overview about erodibility of riverbed as follows:
Riverbed geological formation at downstream of the dam: the riverbed was formed mainly by medium to slightly weathered rock with medium hardness. Its compressive strength and shearing resistance are about 10 MPa and 0.36MPa respectively. The erodible velocity (critical velocity) for such kind of riverbed is found at 8 m/s. Moreover, only some location along the river was found that having deposition with small scale. Further to downstream of project, there is no officially measured or investigated data of riverbed geological formation. However, based on observed of our geological engineers’ observation during the time period for site investigation, most of riverbed was found medium to slightly weathered rock (see the Figure below).
In order to assess, a narrow river cross section, of which section, geological condition, and water level data are available, was selected. The consultant checked for

Trung Son hydropower project Technical design
Appendix 48
different discharge rate from a half of unit discharge to check flood discharge through powerhouse and spillway. Result of hydraulic calculation is shown in table below:
Discharge (m3/s) Water level (m) Wet area (m2) Velocity (m/s)
63 (0.5 unit) 87.9 283.7 0.2 126 (1 unit) 88.4 322.0 0.4 252 (2 units) 89.1 378.3 0.7 378 (3 units) 89.6 429.0 0.9 504 (4 units) 90.1 463.9 1.1
10400 (design flood) 103.8 2009.4 5.2 13400 (check flood) 106.3 2328.1 5.8
The result stated that water speed is always less than the critical speed. In general, with such geology condition of the riverbed mentioned, additional study on riverbed erosion should not take account. 4.3 SLIDING AT BANKS OF DOWNSTREAM
4.3.1. CALCULATION DATA
4.3.1.1 Table of physical – mechanical properties indices stability calculation bank of downstream
Table 4-4: Physical-mechical properties indices stability calculation bank of downstream
Material layer � (T/m3) � atural/Saturated
� � atural/Saturated
C (KG/cm2) � atural/Saturated
edQ 1.72/1.79 ����� 0.18/0.16 IA1 1.65/1.77 25/18 0.24/0.18IA2 1.68/1.79 25 0.22IB 2.66/2.68 29 2.00IIA 2.77/2.79 37 2.50
4.3.1.2 Project grade: grade II
Stability safe factor allowable of project: According Vietnamese construction standard TCXD V� 285: 2002 with project grade II. natural slope. safe factor is calculated according to the formula as follow:
k nc.kn/m In which:
nc: Load combination factor. For basic load combination: nc=1. for special load combination: nc=0.9.
kn: Guarantee factor calculated according to project size and tasks. Project grade II. Guarantee factor is taken as kn=1.2.
m: Operating condition factor. For natural and artificial slope m=1. with parameters as above. safe factor is calculated as follow: - Basic load combination : k = 1.20

Trung Son hydropower project Technical design
Appendix 49
- Special load combination : k= 1.08 4.3.1.3 Location of section calculation
Acoording topographical. geological condition at reservoir foundation area studied in technical design stage to choose reservoir bank section prone to sliding possibility.
Specifically are 4 typical sections with features as below: sloping topographical, thick weak geological zone and thin covering vegetation bed layer to calculate and check stability
Location of section calculation see in drawing “ chart location of section stability calculation“ attached to this report.
4.3.2. CALCULATION CASE
� atural slope at downstream reservoir after exist project. Water level is only fluctuation mainly in range from 107m elevation to 90.2m elevation. In this range belong river bed area so geological is rather good. mainly IB rock layer and IIA rock layer so fast drain water process is not effect more to slope stability of banks at downstream. In this appendix it is only checking for the most dangerous case. in the operation reservoir process water level at downstream is draining fast from 104.5m (corresponding to release design flood P=0.5%) down to 90.2m (corresponding to Q=504m3/s through powerhouse) in 5 days period of time.
4.3.3. SOFTWARE CALCULATION
The program use to calculate stability: Slope/w software of Canada. Analysis method: Bishop and Janbu, these are two methods applicale worldwide for slope stability analysis.
4.3.4. RESULTS CALCULATION
Table 4-3: Results calculation
Section calculation Case Kmin min [K] Bishop Janbu
Downstream section 1 Drain water in 5 days 1.25 1.24 1.08
Downstream section 2 Drain water in 5 days 1.09 1.08 1.08
Downstream section 3 Drain water in 5 days 1.11 1.10 1.08
Downstream section 4 Drain water in 5 days 1.28 1.27 1.08
(See details in appendix) 4.3.5. CONCLUSION
According calculation results mentioned in table above, the bank of downstream will be stable in all cases of reservoir operation.

Trung Son hydropower project Technical design
Appendix 50
APPENDICES

Trung Son hydropower project Technical design
Appendix 51
APPENDIX HYDROGRAPHICAL CALCULATION

Trung Son hydropower project Technical design
Appendix 52
Table 1: Monthy average discharge at Cam Thuy hydrological station
Unit: m3/s No I II III IV V VI VII VIII IX X XI XII TB
1957 123 114 113 101 103 318 348 211 278 207 120 88.9 1771958 72.7 81.8 61.0 53.1 63.5 326 711 493 562 268 149 124 2471959 126 92.1 94.6 106 110 172 268 958 825 327 189 138 2841960 113 93.7 76.6 72.4 95.4 312 763 1460 902 522 274 193 4061961 141 135 112 103 93.4 437 232 724 951 564 290 185 3311962 168 162 100 107 144 576 651 529 698 452 205 163 3301963 136 108 168 92.0 114 275 793 932 1080 561 403 235 4081964 161 129 111 117 151 272 794 593 955 815 321 202 3851965 150 131 105 111 197 542 625 499 513 298 263 164 3001966 127 98.4 81.4 86.7 91.7 422 660 1070 817 294 283 149 3481967 139 127 90.1 126 147 371 417 755 744 305 190 142 2961968 118 106 104 121 135 247 231 721 543 291 178 119 2431969 91.4 75.9 67.4 92.0 96.4 285 514 802 425 209 222 135 2511970 111 82.5 71.6 118 232 374 641 769 856 430 213 169 3391971 129 112 85.2 97.9 157 244 908 1240 571 450 225 152 3641972 124 104 96.7 111 122 150 393 1160 975 475 262 185 3471973 149 117 120 120 219 326 897 1300 1760 524 274 184 4991974 145 118 110 131 169 368 383 678 658 565 340 182 3211975 188 131 112 150 213 537 428 692 1550 409 251 190 4041976 146 135 105 106 205 257 434 1230 461 319 252 155 3171977 224 178 146 176 230 206 662 667 621 374 268 217 3311978 196 154 120 122 286 567 743 1020 1014 609 370 269 4561979 230 196 162 160 266 605 441 781 917 381 255 197 3831980 156 133 103 111 123 220 553 896 1264 439 276 212 3741981 165 124 105 139 225 448 580 827 673 607 342 238 3731982 190 144 104 158 161 339 565 1390 878 587 361 259 4281983 204 172 163 137 171 171 276 536 650 717 303 212 3091984 185 147 114 113 212 436 657 602 411 458 364 203 3251985 183 152 129 185 200 328 371 725 1127 487 328 226 3701986 177 140 120 138 337 476 586 533 520 340 233 185 3151987 155 140 118 114 130 155 277 670 610 328 220 169 2571988 152 122 107 109 175 130 283 511 399 731 240 164 2601989 141 118 112 98.5 173 604 493 524 459 707 261 194 3241990 151 144 189 133 227 713 1138 752 613 464 269 198 4161991 154 133 116 133 157 618 844 702 350 230 173 143 3131992 146 120 115 107 132 262 609 337 384 220 170 143 2291993 112 98.7 96.4 90.5 205 169 348 586 572 291 179 141 2411994 122 102 116 145 223 488 1443 1307 1148 617 328 269 5261995 133 105 88.3 76.3 98.4 449 692 1260 936 317 205 140 3751996 128 106 113 97.2 153 262 863 1660 1230 541 523 232 4921997 175 142 151 192 148 228 911 911 1180 540 254 184 4181998 140 120 101 116 145 274 431 312 456 202 129 102 2111999 86.3 67.6 59.4 78.2 152 564 441 742 749 308 234 170 3042000 130 121 115 104 235 391 760 679 961 426 220 165 3592001 144 120 153 111 235 640 987 983 719 451 279 184 4172002 157 132 108 110 233 677 1280 1170 597 394 260 221 4452003 291 249 211 203 275 278 512 660 868 359 249 212 3642004 169 158 144 274 410 501 705 843 904 356 267 218 4122005 145 121 116 107 107 210 380 1290 1290 548 297 202 4012006 140 127 119 115 158 207 405 1100 424 243 157 130 2772007 116 104 105 120 194 260 432 377 560 1040 252 179 3122008 143 149 132 140 172 462 856 924 835 790 737 275 468
TB 146 124 113 120 174 365 603 828 783 448 263 179 346

Trung Son hydropower project Technical design
Appendix 53
Table 2: Monthy average discharge at Hoi Xuan hydrological station
Unit: m3/s No I II III IV V VI VII VIII IX X XI XII TB
1957 104 96.4 96.8 89.4 91.5 270 320 244 261 196 130 74.9 1641958 69.2 76.2 56.6 46.3 64.0 277 598 457 471 235 148 107 2171959 106 82.6 82.5 95.0 96.9 150 260 808 666 273 171 121 2431960 96.9 83.6 68.6 58.3 86.4 265 638 1186 723 399 221 172 3331961 116 109 96.3 86.6 85.0 367 232 631 759 426 231 165 2751962 135 126 87.0 90.1 121 481 552 484 572 353 181 144 2771963 113 92.6 139 75.1 99.8 235 661 788 858 424 297 211 3331964 131 105 95.3 96.9 126 232 662 533 762 589 249 180 3131965 125 105 88.4 95.3 138 421 499 424 458 259 231 140 2491966 115 94.9 79.9 77.8 80.4 397 606 929 721 276 232 144 3131967 109 97.4 79.7 116 119 322 377 678 602 260 161 119 2531968 99.6 94.9 88.2 104 119 198 194 573 425 232 157 106 1991969 83.2 67.3 56.9 76.0 84.1 260 418 724 327 180 184 107 2141970 91.8 77.5 65.0 100 208 293 595 666 682 343 189 155 2891971 108 95.0 75.3 81.2 130 209 749 1020 478 352 192 134 3021972 105 90.3 84.1 99.4 105 133 355 959 777 369 214 165 2881973 122 98.0 102 107 173 276 740 1065 1354 400 221 164 4021974 119 98.7 94.4 116 138 311 347 597 542 427 260 162 2681975 149 107 96.0 131 169 449 382 607 1199 326 208 170 3331976 120 109 90.7 95.5 164 220 386 1015 397 268 208 136 2671977 126 104 89.7 113 148 138 497 527 481 250 181 148 2341978 122 102 86.2 89.8 183 434 563 861 834 458 246 195 3481979 148 125 112 124 189 474 354 698 707 273 186 153 2951980 116 100 90.0 96.7 104 177 517 779 1158 366 206 172 3231981 130 104 99.2 129 182 374 488 672 541 456 242 193 3011982 147 120 111 135 124 257 429 1135 799 455 249 209 3481983 160 133 135 121 140 149 266 489 536 525 238 190 2571984 147 117 97.8 101 169 366 557 539 360 357 274 182 2721985 146 120 109 160 160 278 338 632 889 376 253 203 3051986 141 112 102 122 256 399 503 487 440 282 197 165 2671987 126 113 101 102 111 136 266 590 507 274 190 150 2221988 124 101 91.7 97.8 142 116 271 470 350 534 201 146 2201989 117 98.7 96.2 89.1 141 504 431 480 395 518 214 173 2711990 124 115 155 117 179 593 925 652 509 361 218 177 3441991 126 108 98.9 117 130 515 700 615 314 210 162 125 2681992 120 100 98.2 95.9 112 224 520 339 339 204 160 125 2031993 96.3 86.8 83.9 82.4 164 148 321 527 478 250 165 123 2101994 103 88.8 98.7 127 176 409 1158 1071 904 461 253 243 4241995 111 90.8 77.7 70.7 88.5 377 584 1035 748 266 181 123 3131996 108 91.1 96.8 88.0 127 224 714 1338 969 411 368 209 3951997 140 114 126 166 124 197 751 773 927 411 210 164 3421998 116 100 87.0 103 122 234 384 320 393 192 136 87.3 1901999 78.6 67.3 55.3 72.3 127 471 392 645 610 261 197 151 2612000 109 101 98.2 93.8 184 330 636 597 767 337 190 146 2992001 119 99.8 127 99.6 185 534 809 827 588 353 224 164 3442002 128 108 92.9 98.9 183 563 1031 966 497 316 213 199 3662003 220 181 172 175 213 237 446 583 697 294 206 190 3012004 136 124 121 234 308 419 594 721 724 292 217 196 3402005 120 101 121 310 373 181 345 1062 1013 416 235 181 3712006 116 105 101 151 130 179 364 918 369 219 152 113 2432007 99.1 90.1 90.5 107 156 222 385 369 470 734 208 159 2582008 118 118 111 123 140 388 709 782 673 572 494 249 373TB 120 103 97.2 111 147 308 516 709 635 351 214 159 289

Trung Son hydropower project Technical design
Appendix 54
Table 3: Monthy average discharge at Trung Son station
Unit: m3/s No I II III IV V VI VII VIII IX X XI XII TB
1957 81.2 75.3 73.1 86.7 88.7 197 228 181 252 198 140 57.2 1381958 47.7 50.5 38.2 57.5 66.9 202 474 361 401 222 150 84.1 1801959 83.6 58.4 60.6 90.5 93.0 95.5 174 657 540 245 164 95.0 1961960 74.5 59.7 48.6 65.6 84.7 193 509 977 580 323 194 138 2711961 93.3 91.1 72.6 84.8 83.6 279 150 508 606 339 199 132 2201962 112 112 64.6 87.2 112 375 434 384 473 294 169 114 2281963 90.1 70.6 59.9 77.0 95.3 167 530 641 676 338 239 170 2631964 107 86.3 71.7 91.7 116 164 531 425 608 439 210 145 2501965 99.6 88.1 67.7 93.6 141 352 416 365 376 233 190 115 2111966 84.4 63.2 51.8 74.9 82.6 268 440 731 535 232 197 104 2391967 92.3 84.9 57.7 102 114 233 275 528 497 236 164 98.6 2071968 78.3 68.8 67.0 99.3 107 147 149 506 391 231 160 80.2 1741969 60.3 46.0 42.5 79.9 85.3 173 340 558 329 198 175 93.1 1821970 73.8 51.1 45.3 93.4 161 235 427 537 556 286 172 119 2301971 85.6 73.6 54.4 81.1 119 145 608 837 406 294 176 106 2491972 82.2 67.9 62.0 93.5 99.6 80.4 259 786 619 304 190 132 2311973 98.6 77.2 77.8 98.4 154 202 600 875 1028 323 194 131 3221974 96.3 78.1 71.0 104 126 231 251 479 452 339 217 130 2151975 125 88.4 72.4 115 150 348 283 488 918 278 186 136 2661976 97.2 91.0 67.8 90.8 146 154 286 833 348 242 186 108 2211977 149 124 95.1 130 160 119 441 472 432 263 191 156 2281978 130 106 77.4 99.3 191 369 496 697 639 357 227 197 2991979 154 138 106 121 180 395 291 544 588 266 187 141 2591980 104 89.7 66.1 93.7 99.9 128 367 618 771 290 194 152 2481981 110 82.7 67.7 109 157 286 385 574 460 356 217 173 2481982 127 97.8 67.2 120 121 211 375 934 568 348 224 189 2821983 136 120 106 108 127 94.4 180 388 447 400 204 152 2051984 123 101 73.9 94.6 150 278 437 430 322 297 225 146 2231985 122 104 83.8 135 143 204 244 509 698 308 213 163 2441986 118 94.8 77.3 109 220 306 389 386 379 250 179 132 2201987 103 95.2 76.5 95.0 104 83.3 180 473 427 245 175 119 1811988 101 80.9 68.7 92.4 129 66.1 184 372 316 405 182 116 1761989 93.7 78.1 72.5 86.5 128 395 326 380 347 396 189 138 2191990 101 97.8 124 106 158 470 763 526 428 299 192 142 2841991 103 89.5 74.9 106 119 404 564 494 290 206 158 98.9 2261992 97.3 79.9 74.3 91.1 105 157 405 261 308 203 157 99.0 1701993 74.0 63.5 61.9 82.0 146 93.6 228 420 406 231 160 97.2 1721994 80.9 65.9 74.7 112 156 314 970 881 709 360 213 197 3441995 88.1 68.4 56.5 74.0 86.4 287 461 849 598 241 169 96.8 2561996 84.9 68.8 73.0 85.7 117 158 577 1106 755 330 281 168 3171997 117 96.8 98.1 138 114 134 609 739 726 330 187 131 2851998 92.8 80.1 64.6 96.1 113 166 284 245 346 195 143 67.5 1581999 56.9 39.7 37.1 75.1 117 367 291 520 500 237 180 120 2122000 86.5 80.9 74.3 89.6 163 247 508 480 611 284 175 116 2432001 95.8 79.4 99.6 93.6 163 419 661 674 484 294 195 131 2822002 105 88.9 69.7 93.1 161 445 857 791 420 272 189 160 3042003 194 179 138 145 185 169 339 467 562 258 185 153 2482004 112 105 93.7 184 261 323 470 584 581 256 191 157 2772005 91.5 75.9 73.0 76.2 62.2 122 209 874 790 365 250 156 2622006 90.9 81.2 71.7 73.1 85.9 94.9 262 610 262 148 106 84.8 1642007 74.5 67.5 64.4 77.6 66.2 146 253 256 342 448 154 113 1722008 95.3 102 88.3 96.0 97.9 313 614 739 615 503 363 194 318TB 99.5 84.7 72.6 97.2 127 231 404 576 514 293 191 130 235

Trung Son hydropower project Technical design
Appendix 55
Table 4: Monthy average discharge as hydrologic year
Unit: m3/s No I II III IV V VI VII VIII IX X XI XII TB
1957 197 228 181 252 198 140 57.2 47.7 50.5 38.2 57.5 66.9 1261958 202 474 361 401 222 150 84.1 83.6 58.4 60.6 90.5 93.0 1901959 95.5 174 657 540 245 164 95.0 74.5 59.7 48.6 65.6 84.7 1921960 193 509 977 580 323 194 138 93.3 91.1 72.6 84.8 83.6 2781961 279 150 508 606 339 199 132 112 112 64.6 87.2 112 2251962 375 434 384 473 294 169 114 90.1 70.6 59.9 77.0 95.3 2201963 167 530 641 676 338 239 170 107 86.3 71.7 91.7 116 2691964 164 531 425 608 439 210 145 99.6 88.1 67.7 93.6 141 2511965 352 416 365 376 233 190 115 84.4 63.2 51.8 74.9 82.6 2001966 268 440 731 535 232 197 104 92.3 84.9 57.7 102 114 2461967 233 275 528 497 236 164 98.6 78.3 68.8 67.0 99.3 107 2041968 147 149 506 391 231 160 80.2 60.3 46.0 42.5 79.9 85.3 1651969 173 340 558 329 198 175 93.1 73.8 51.1 45.3 93.4 161 1911970 235 427 537 556 286 172 119 85.6 73.6 54.4 81.1 119 2291971 145 608 837 406 294 176 106 82.2 67.9 62.0 93.5 99.6 2481972 80.4 259 786 619 304 190 132 98.6 77.2 77.8 98.4 154 2391973 202 600 875 1028 323 194 131 96.3 78.1 71.0 104 126 3191974 231 251 479 452 339 217 130 125 88.4 72.4 115 150 2211975 348 283 488 918 278 186 136 97.2 91.0 67.8 90.8 146 2611976 154 286 833 348 242 186 108 149 124 95.1 130 160 2351977 119 441 472 432 263 191 156 130 106 77.4 99.3 191 2231978 369 496 697 639 357 227 197 154 138 106 121 180 3071979 395 291 544 588 266 187 141 104 89.7 66.1 93.7 99.9 2391980 128 367 618 771 290 194 152 110 82.7 67.7 109 157 2541981 286 385 574 460 356 217 173 127 97.8 67.2 120 121 2491982 211 375 934 568 348 224 189 136 120 106 108 127 2871983 94.4 180 388 447 400 204 152 123 101 73.9 94.6 150 2011984 278 437 430 322 297 225 146 122 104 83.8 135 143 2271985 204 244 509 698 308 213 163 118 94.8 77.3 109 220 2461986 306 389 386 379 250 179 132 103 95.2 76.5 95.0 104 2081987 83.3 180 473 427 245 175 119 101 80.9 68.7 92.4 129 1811988 66.1 184 372 316 405 182 116 93.7 78.1 72.5 86.5 128 1751989 395 326 380 347 396 189 138 101 97.8 124 106 158 2301990 470 763 526 428 299 192 142 103 89.5 74.9 106 119 2761991 404 564 494 290 206 158 98.9 97.3 79.9 74.3 91.1 105 2221992 157 405 261 308 203 157 99.0 74.0 63.5 61.9 82.0 146 1681993 93.6 228 420 406 231 160 97.2 80.9 65.9 74.7 112 156 1771994 314 970 881 709 360 213 197 88.1 68.4 56.5 74.0 86.4 3351995 287 461 849 598 241 169 96.8 84.9 68.8 73.0 85.7 117 2611996 158 577 1106 755 330 281 168 117 96.8 98.1 138 114 3281997 134 609 739 726 330 187 131 92.8 80.1 64.6 96.1 113 2751998 166 284 245 346 195 143 67.5 56.9 39.7 37.1 75.1 117 1481999 367 291 520 500 237 180 120 86.5 80.9 74.3 89.6 163 2262000 247 508 480 611 284 175 116 95.8 79.4 99.6 93.6 163 2462001 419 661 674 484 294 195 131 105 88.9 69.7 93.1 161 2812002 445 857 791 420 272 189 160 194 179 138 145 185 3312003 169 339 467 562 258 185 153 112 105 93.7 184 261 2412004 323 470 584 581 256 191 157 91.5 75.9 73.0 76.2 62.2 2452005 122 209 874 790 365 250 156 90.9 81.2 71.7 73.1 85.9 2642006 94.9 262 610 262 148 106 84.8 74.5 67.5 64.4 77.6 66.2 1602007 146 253 256 342 448 154 113 95.3 102 88.3 96.0 97.9 183TB 229 399 573 512 289 188 128 99.8 84.9 72.6 97.4 128 233

Trung Son hydropower project Technical design
Appendix 56
APPENDIX CALCULATION OF RESERVOIR BANK SLOPE STABILITY

Trung Son hydropower project Technical design
Appendix 57
I. CASE ACCORDING TO RECOMMEND OF CONSULTANCY
a) Section 1
Case 1: Water drain from NWL=160m down to MWL=150m in 5 days. (K=1.41) Bishop method
1.41IA1
IA2
IB
IIA
Distance(m)60 80 100 120 140 160 180 200 220 240 260 280 300
Ele
vatio
n(m
)
70
90
110
130
150
170
190
210
230
2.05
IA1
IA2
IB
IIA
Distance(m)60 80 100 120 140 160 180 200 220 240 260 280 300
Ele
vatio
n(m
)
70
90
110
130
150
170
190
210
230

Trung Son hydropower project Technical design
Appendix 58
Janbu method (K=1.35)
1.35
IA1
IA2
IB
IIA
Distance(m)60 80 100 120 140 160 180 200 220 240 260 280 300
Ele
vatio
n(m
)
70
90
110
130
150
170
190
210
230
2.01
IA1
IA2
IB
IIA
Distance(m)60 80 100 120 140 160 180 200 220 240 260 280 300
Ele
vatio
n(m
)
70
90
110
130
150
170
190
210
230

Trung Son hydropower project Technical design
Appendix 59
Case 2: Water drain from NWL=160m down to MWL=150m in 10 days. (K=1.50)
Bishop method
1.50IA1
IA2
IB
IIA
Distance(m)60 80 100 120 140 160 180 200 220 240 260 280 300
Ele
vatio
n(m
)
70
90
110
130
150
170
190
210
230
2.13IA1
IA2
IB
IIA
Distance(m)60 80 100 120 140 160 180 200 220 240 260 280 300
Ele
vatio
n(m
)
70
90
110
130
150
170
190
210
230

Trung Son hydropower project Technical design
Appendix 60
Janbu method (K=1.45)
1.45
IA1
IA2
IB
IIA
Distance(m)60 80 100 120 140 160 180 200 220 240 260 280 300
Ele
vatio
n(m
)
70
90
110
130
150
170
190
210
230
2.08IA1
IA2
IB
IIA
Distance(m)60 80 100 120 140 160 180 200 220 240 260 280 300
Ele
vatio
n(m
)
70
90
110
130
150
170
190
210
230

Trung Son hydropower project Technical design
Appendix 61
Case 3: Water drain from NWL=160m down to MWL=150m in 15 days. (K=1.55) Bishop method
1.55
IA1
IA2
IBIIA
Distance(m)60 80 100 120 140 160 180 200 220 240 260 280 300
Ele
vatio
n(m
)
70
90
110
130
150
170
190
210
230
2.11IA1
IA2
IBIIA
Distance(m)60 80 100 120 140 160 180 200 220 240 260 280 300
Ele
vatio
n(m
)
70
90
110
130
150
170
190
210
230

Trung Son hydropower project Technical design
Appendix 62
Janbu method (K=1.49)
1.49
IA1
IA2
IBIIA
Distance(m)60 80 100 120 140 160 180 200 220 240 260 280 300
Ele
vatio
n(m
)
70
90
110
130
150
170
190
210
230
2.04IA1
IA2
IBIIA
Distance(m)60 80 100 120 140 160 180 200 220 240 260 280 300
Ele
vatio
n(m
)
70
90
110
130
150
170
190
210
230

Trung Son hydropower project Technical design
Appendix 63
b) Section 2
Case 1: Water drain from NWL=160m down to MWL=150m in 5 days. (K=1.04) Bishop method
1.04IA1
IA2
IB
Distance(m)40 60 80 100 120 140 160 180 200 220 240 260 280 300 320 340 360
Elev
atio
n(m
)
40
60
80
100
120
140
160
180
200
220
240
260
1.39IA1
IA2
IB
Distance(m)40 60 80 100 120 140 160 180 200 220 240 260 280 300 320 340 360
Elev
atio
n(m
)
40
60
80
100
120
140
160
180
200
220
240
260

Trung Son hydropower project Technical design
Appendix 64
Janbu method (K=1.01)
1.01IA1
IA2
IB
Distance(m)40 60 80 100 120 140 160 180 200 220 240 260 280 300 320 340 360
Elev
atio
n(m
)
40
60
80
100
120
140
160
180
200
220
240
260
1.37IA1
IA2
IB
Distance(m)40 60 80 100 120 140 160 180 200 220 240 260 280 300 320 340 360
Elev
atio
n(m
)
40
60
80
100
120
140
160
180
200
220
240
260

Trung Son hydropower project Technical design
Appendix 65
Case 2: Water drain from NWL=160m down to MWL=150m in 10 days. (K=1.10) Bishop method
1.10IA1
IA2
IB
Distance(m)40 60 80 100 120 140 160 180 200 220 240 260 280 300 320 340 360
Ele
vatio
n(m
)
40
60
80
100
120
140
160
180
200
220
240
260
1.44IA1
IA2
IB
Distance(m)40 60 80 100 120 140 160 180 200 220 240 260 280 300 320 340 360
Elev
atio
n(m
)
40
60
80
100
120
140
160
180
200
220
240
260

Trung Son hydropower project Technical design
Appendix 66
Janbu method (K=1.06)
1.06
IA1
IA2
IB
Distance(m)40 60 80 100 120 140 160 180 200 220 240 260 280 300 320 340 360
Elev
atio
n(m
)
40
60
80
100
120
140
160
180
200
220
240
260
1.41IA1
IA2
IB
Distance(m)40 60 80 100 120 140 160 180 200 220 240 260 280 300 320 340 360
Elev
atio
n(m
)
40
60
80
100
120
140
160
180
200
220
240
260

Trung Son hydropower project Technical design
Appendix 67
Case 3: Water drain from NWL=160m down to MWL=150m in 15 days. (K=1.13) Bishop method
1.13
IA1
IA2
IB
Distance(m)40 60 80 100 120 140 160 180 200 220 240 260 280 300 320 340 360
Ele
vatio
n(m
)
40
60
80
100
120
140
160
180
200
220
240
260
1.48
IA1
IA2
IB
Distance(m)40 60 80 100 120 140 160 180 200 220 240 260 280 300 320 340 360
Ele
vatio
n(m
)
40
60
80
100
120
140
160
180
200
220
240
260

Trung Son hydropower project Technical design
Appendix 68
Janbu method (K=1.10)
1.10
IA1
IA2
IB
Distance(m)40 60 80 100 120 140 160 180 200 220 240 260 280 300 320 340 360
Ele
vatio
n(m
)
40
60
80
100
120
140
160
180
200
220
240
260
1.45
IA1
IA2
IB
Distance(m)40 60 80 100 120 140 160 180 200 220 240 260 280 300 320 340 360
Ele
vatio
n(m
)
40
60
80
100
120
140
160
180
200
220
240
260

Trung Son hydropower project Technical design
Appendix 69
c) Section 3
Case 1: Water drain from NWL=160m down to MWL=150m in 5 days. (K=1.29) Bishop method
1.29
IA1IA2
IB
IIA
Distance(m)60 80 100 120 140 160 180 200 220 240 260
Ele
vatio
n(m
)
80
100
120
140
160
180
200
220
1.60
IA1IA2
IB
IIA
Distance(m)60 80 100 120 140 160 180 200 220 240 260
Ele
vatio
n(m
)
80
100
120
140
160
180
200
220
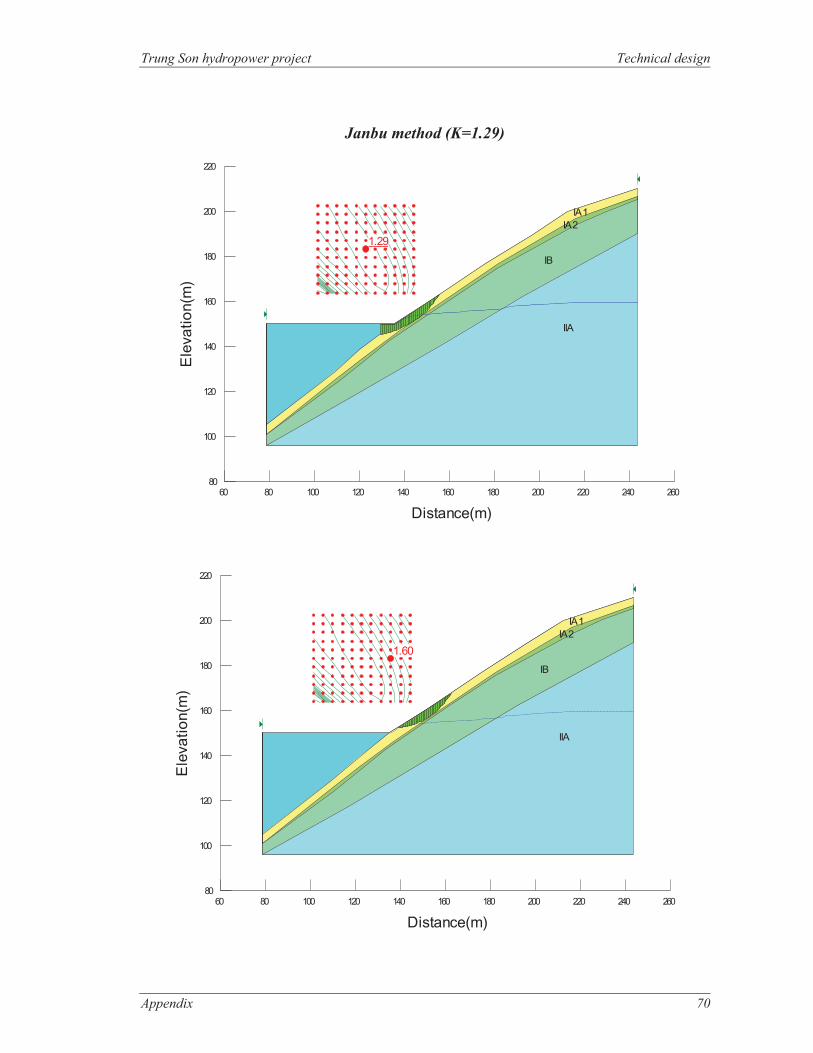
Trung Son hydropower project Technical design
Appendix 70
Janbu method (K=1.29)
1.29
IA1IA2
IB
IIA
Distance(m)60 80 100 120 140 160 180 200 220 240 260
Ele
vatio
n(m
)
80
100
120
140
160
180
200
220
1.60
IA1IA2
IB
IIA
Distance(m)60 80 100 120 140 160 180 200 220 240 260
Ele
vatio
n(m
)
80
100
120
140
160
180
200
220

Trung Son hydropower project Technical design
Appendix 71
Case 2: Water drain from NWL=160m down to MWL=150m in 10 days. (K=1.36) Bishop method
1.36
IA1IA2
IB
IIA
Distance(m)70 90 110 130 150 170 190 210 230 250
Ele
vatio
n(m
)
90
110
130
150
170
190
210
1.64
IA1IA2
IB
IIA
Distance(m)70 90 110 130 150 170 190 210 230 250
Ele
vatio
n(m
)
90
110
130
150
170
190
210

Trung Son hydropower project Technical design
Appendix 72
Janbu method (K=1.35)
1.35
IA1IA2
IB
IIA
Distance(m)70 90 110 130 150 170 190 210 230 250
Ele
vatio
n(m
)
90
110
130
150
170
190
210
1.63
IA1IA2
IB
IIA
Distance(m)70 90 110 130 150 170 190 210 230 250
Ele
vatio
n(m
)
90
110
130
150
170
190
210

Trung Son hydropower project Technical design
Appendix 73
Case 3: Water drain from NWL=160m down to MWL=150m in 15 days. (K=1.39)
Bishop method
1.39
IA1
IA2
IBIIA
Distance(m)70 90 110 130 150 170 190 210 230 250
Ele
vatio
n(m
)
80
100
120
140
160
180
200
220
1.66
IA1
IA2
IBIIA
Distance(m)70 90 110 130 150 170 190 210 230 250
Ele
vatio
n(m
)
80
100
120
140
160
180
200
220

Trung Son hydropower project Technical design
Appendix 74
Janbu method (K=1.38)
1.38
IA1
IA2
IBIIA
Distance(m)70 90 110 130 150 170 190 210 230 250
Ele
vatio
n(m
)
80
100
120
140
160
180
200
220
1.65
IA1
IA2
IBIIA
Distance(m)70 90 110 130 150 170 190 210 230 250
Ele
vatio
n(m
)
80
100
120
140
160
180
200
220
d) Section 4 at left abutment dam
Case 1: Water drain from NWL=160m down to MWL=150m in 5 days. (K=1.01)

Trung Son hydropower project Technical design
Appendix 75
Bishop method
1.01IA1
IA2IB
IIA
Distance(m)50 70 90 110 130 150 170 190
Ele
vatio
n(m
)
80
100
120
140
160
180
200
220
1.30IA1
IA2IB
IIA
IA1
IA2IB
IIA
Distance(m)50 70 90 110 130 150 170 190
Ele
vatio
n(m
)
80
100
120
140
160
180
200
220
Janbu method (K=0.98)

Trung Son hydropower project Technical design
Appendix 76
0.98IA1
IA2IB
IIA
Distance(m)50 70 90 110 130 150 170 190
Ele
vatio
n(m
)
80
100
120
140
160
180
200
220
1.25
IA1
IA2IB
IIA
IA1
IA2IB
IIA
Distance(m)50 70 90 110 130 150 170 190
Ele
vatio
n(m
)
80
100
120
140
160
180
200
220
Case 2: Water drain from NWL=160m down to MWL=150m in 10 days. (K=1.09)

Trung Son hydropower project Technical design
Appendix 77
Bishop method
1.09IA1
IA2IB
IIA
Distance(m)50 70 90 110 130 150 170 190
Ele
vatio
n(m
)
80
100
120
140
160
180
200
220
1.38
IA1
IA2IB
IIA
Distance(m)50 70 90 110 130 150 170 190
Ele
vatio
n(m
)
80
100
120
140
160
180
200
220
Janbu method (K=1.07)

Trung Son hydropower project Technical design
Appendix 78
1.07IA1
IA2IB
IIA
Distance(m)50 70 90 110 130 150 170 190
Ele
vatio
n(m
)
80
100
120
140
160
180
200
220
1.30IA1
IA2IB
IIA
Distance(m)50 70 90 110 130 150 170 190
Ele
vatio
n(m
)
80
100
120
140
160
180
200
220
Case 3: Water drain from NWL=160m down to MWL=150m in 15 days. (K=1.11) Bishop method

Trung Son hydropower project Technical design
Appendix 79
1.11IA1
IA2
IB
IIA
Distance(m)50 70 90 110 130 150 170 190
Ele
vatio
n(m
)
80
100
120
140
160
180
200
220
1.27IA1
IA2
IB
IIA
Distance(m)50 70 90 110 130 150 170 190
Ele
vatio
n(m
)
80
100
120
140
160
180
200
220
Janbu method (K=1.09)

Trung Son hydropower project Technical design
Appendix 80
1.09IA1
IA2
IB
IIA
Distance(m)50 70 90 110 130 150 170 190
Ele
vatio
n(m
)
80
100
120
140
160
180
200
220
1.29IA1
IA2
IB
IIA
Distance(m)50 70 90 110 130 150 170 190
Ele
vatio
n(m
)
80
100
120
140
160
180
200
220
e) Section 4 at right abutment
Case 1: Water drain from NWL=160m down to MWL=150m in 5 days. (K=1.02)
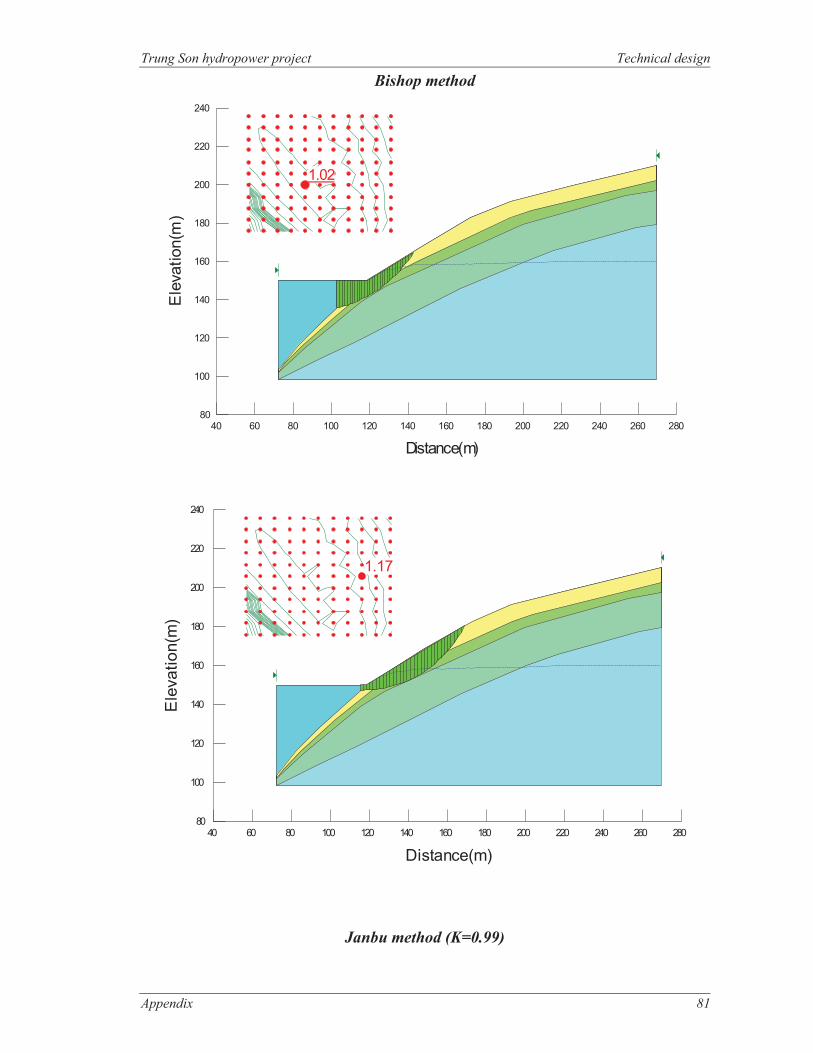
Trung Son hydropower project Technical design
Appendix 81
Bishop method
1.02
Distance(m)40 60 80 100 120 140 160 180 200 220 240 260 280
Ele
vatio
n(m
)
80
100
120
140
160
180
200
220
240
1.17
Distance(m)40 60 80 100 120 140 160 180 200 220 240 260 280
Ele
vatio
n(m
)
80
100
120
140
160
180
200
220
240
Janbu method (K=0.99)

Trung Son hydropower project Technical design
Appendix 82
0.99
Distance(m)40 60 80 100 120 140 160 180 200 220 240 260 280
Ele
vatio
n(m
)
80
100
120
140
160
180
200
220
240
1.17
Distance(m)40 60 80 100 120 140 160 180 200 220 240 260 280
Ele
vatio
n(m
)
80
100
120
140
160
180
200
220
240
Case 2: Water drain from NWL=160m down to MWL=150m in 10 days. (K=1.09)

Trung Son hydropower project Technical design
Appendix 83
Bishop method
1.09
IA1
IA2 IB
IIA
Distance(m)40 60 80 100 120 140 160 180 200 220 240 260 280
Ele
vatio
n(m
)
80
100
120
140
160
180
200
220
240
1.22
IA1
IA2 IB
IIA
Distance(m)40 60 80 100 120 140 160 180 200 220 240 260 280
Ele
vatio
n(m
)
80
100
120
140
160
180
200
220
240

Trung Son hydropower project Technical design
Appendix 84
Janbu method (K=1.06)
1.06 IA1
IA2 IB
IIA
Distance(m)40 60 80 100 120 140 160 180 200 220 240 260 280
Ele
vatio
n(m
)
80
100
120
140
160
180
200
220
240
1.20
IA1
IA2 IB
IIA
Distance(m)40 60 80 100 120 140 160 180 200 220 240 260 280
Ele
vatio
n(m
)
80
100
120
140
160
180
200
220
240

Trung Son hydropower project Technical design
Appendix 85
Case 3: Water drain from NWL=160m down to MWL=150m in 15 days. (K=1.12)
Bishop method
1.12
IA1IA2
IB
IIA
Distance(m)40 60 80 100 120 140 160 180 200 220 240 260 280
Ele
vatio
n(m
)
80
100
120
140
160
180
200
220
240
1.24
IA1IA2
IB
IIA
Distance(m)40 60 80 100 120 140 160 180 200 220 240 260 280
Ele
vatio
n(m
)
80
100
120
140
160
180
200
220
240

Trung Son hydropower project Technical design
Appendix 86
Janbu method (K=1.09)
1.09 IA1IA2
IB
IIA
Distance(m)40 60 80 100 120 140 160 180 200 220 240 260 280
Ele
vatio
n(m
)
80
100
120
140
160
180
200
220
240
1.23
IA1IA2
IB
IIA
Distance(m)40 60 80 100 120 140 160 180 200 220 240 260 280
Ele
vatio
n(m
)
80
100
120
140
160
180
200
220
240
f) Section 5
Case 1: Water drain from NWL=160m down to MWL=150m in 5 days. (K=1.06)

Trung Son hydropower project Technical design
Appendix 87
Bishop method
1.06IA1
IA2
IB
Distance(m)160 180 200 220 240 260 280 300 320 340 360 380 400
Ele
vatio
n(m
)
70
90
110
130
150
170
190
210
230
250
1.33IA1
IA2
IB
Distance(m)160 180 200 220 240 260 280 300 320 340 360 380 400
Elev
atio
n(m
)
70
90
110
130
150
170
190
210
230
250
Janbu method (K=1.04)

Trung Son hydropower project Technical design
Appendix 88
1.04
IA1
IA2
IB
Distance(m)160 180 200 220 240 260 280 300 320 340 360 380 400
Elev
atio
n(m
)
70
90
110
130
150
170
190
210
230
250
1.30IA1
IA2
IB
Distance(m)160 180 200 220 240 260 280 300 320 340 360 380 400
Elev
atio
n(m
)
70
90
110
130
150
170
190
210
230
250
Case 2: Water drain from NWL=160m down to MWL=150m in 10 days. (K=1.12)
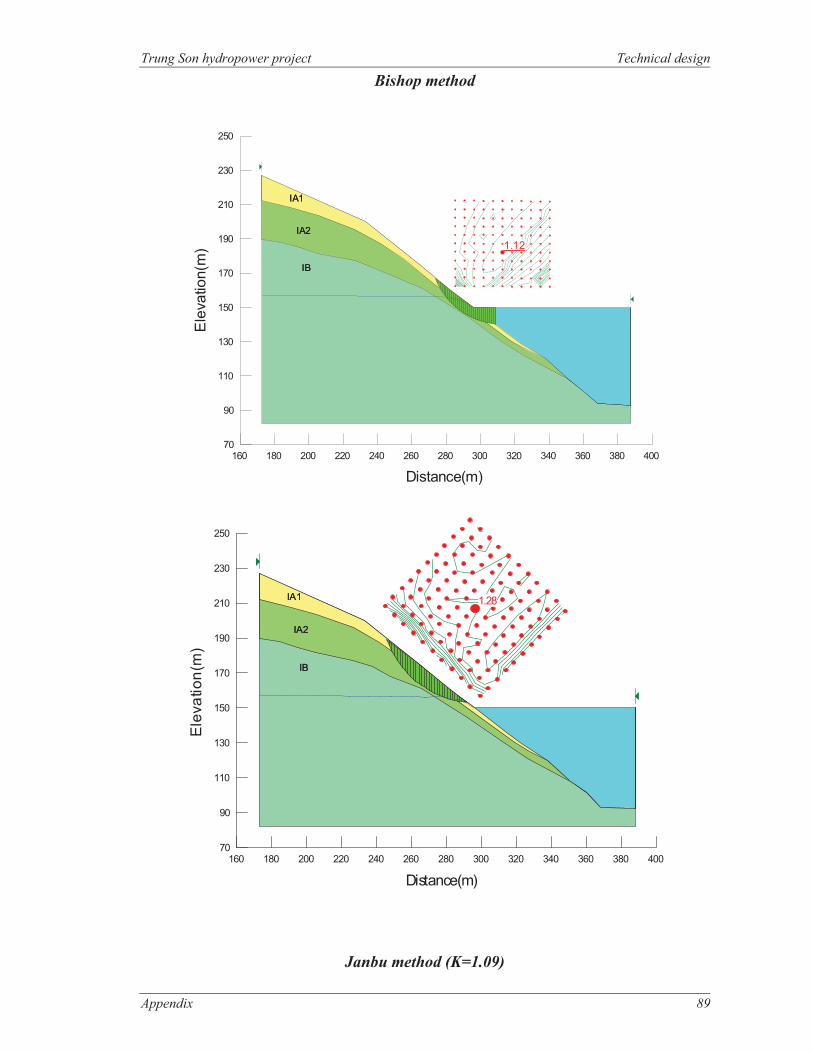
Trung Son hydropower project Technical design
Appendix 89
Bishop method
1.12
IA1
IA2
IB
IA1
IA2
IB
Distance(m)160 180 200 220 240 260 280 300 320 340 360 380 400
Ele
vatio
n(m
)
70
90
110
130
150
170
190
210
230
250
1.28IA1
IA2
IB
IA1
IA2
IB
Distance(m)160 180 200 220 240 260 280 300 320 340 360 380 400
Ele
vatio
n(m
)
70
90
110
130
150
170
190
210
230
250
Janbu method (K=1.09)
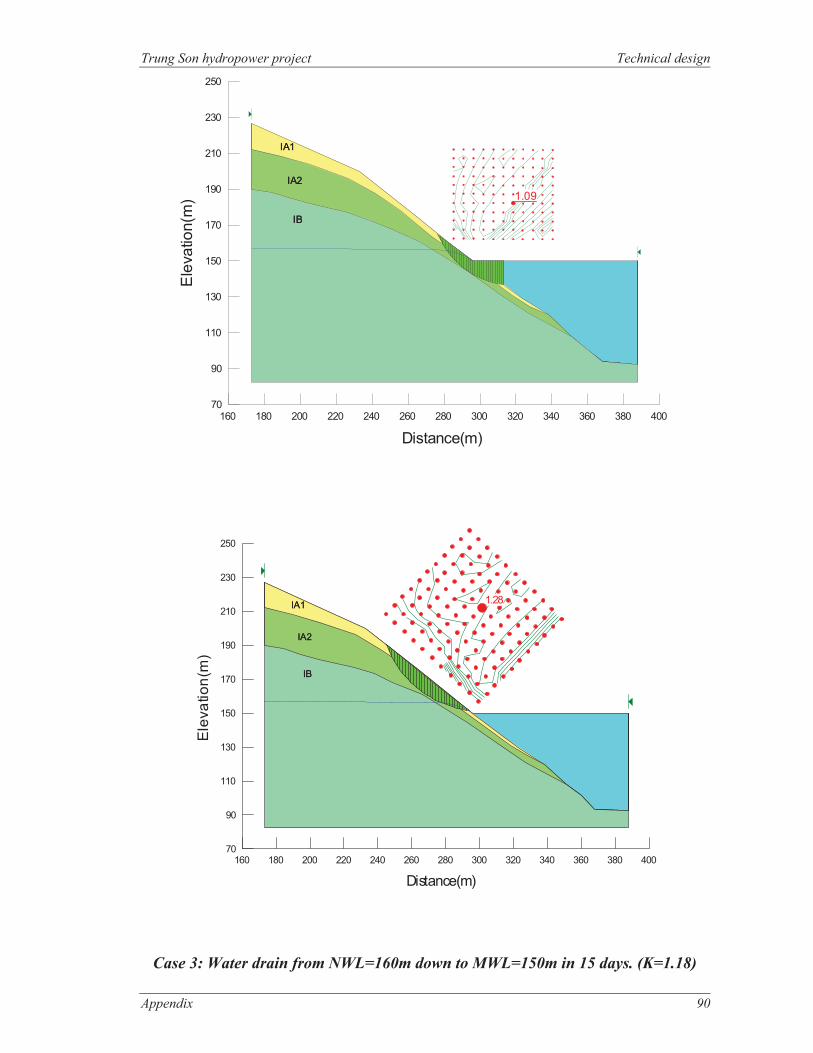
Trung Son hydropower project Technical design
Appendix 90
1.09
IA1
IA2
IB
IA1
IA2
IB
Distance(m)160 180 200 220 240 260 280 300 320 340 360 380 400
Ele
vatio
n(m
)
70
90
110
130
150
170
190
210
230
250
1.28IA1
IA2
IB
IA1
IA2
IB
Distance(m)160 180 200 220 240 260 280 300 320 340 360 380 400
Ele
vatio
n(m
)
70
90
110
130
150
170
190
210
230
250
Case 3: Water drain from NWL=160m down to MWL=150m in 15 days. (K=1.18)

Trung Son hydropower project Technical design
Appendix 91
Bishop method
1.18IA1
IA2
IB
IA1
IA2
IB
Distance(m)160 180 200 220 240 260 280 300 320 340 360 380 400
Elev
atio
n(m
)
70
90
110
130
150
170
190
210
230
1.23
IA1
IA2
IB
IA1
IA2
IB
Distance(m)160 180 200 220 240 260 280 300 320 340 360 380 400
Ele
vatio
n(m
)
70
90
110
130
150
170
190
210
230
Janbu method (K=1.16)

Trung Son hydropower project Technical design
Appendix 92
1.17
IA1
IA2
IB
IA1
IA2
IB
Distance(m)160 180 200 220 240 260 280 300 320 340 360 380 400
Elev
atio
n(m
)
70
90
110
130
150
170
190
210
230
1.26
IA1
IA2
IB
IA1
IA2
IB
Distance(m)160 180 200 220 240 260 280 300 320 340 360 380 400
Ele
vatio
n(m
)
70
90
110
130
150
170
190
210
230

Trung Son hydropower project Technical design
Appendix 93
II. CALCULATION COMBINATION CASES FOR VERIFYING RECOMMENDATION GIVEN BY WB
Slope without reservoir. ground water level raised to slope surface due to rain. a) Section1
Bishop method (K=0.80)
0.80
IA1
IA2
IB
IIA
IA1
IA2
IB
IIA
Distance(m)60 80 100 120 140 160 180 200 220 240 260 280 300
Ele
vatio
n(m
)
70
90
110
130
150
170
190
210
230

Trung Son hydropower project Technical design
Appendix 94
Janbu method (K=0.79)
0.79
IA1
IA2
IB
IIA
IA1
IA2
IB
IIA
Distance(m)60 80 100 120 140 160 180 200 220 240 260 280 300
Ele
vatio
n(m
)
70
90
110
130
150
170
190
210
230

Trung Son hydropower project Technical design
Appendix 95
b) Section2
Bishop method (K=0.40)
0.40
IA1IA2
IB
IA1IA2
IB
Distance(m)40 60 80 100 120 140 160 180 200 220 240 260 280 300 320 340 360
Elev
atio
n(m
)
40
60
80
100
120
140
160
180
200
220
240
260

Trung Son hydropower project Technical design
Appendix 96
Janbu method (K=0.37)
0.37
IA1IA2
IB
IA1IA2
IB
Distance(m)40 60 80 100 120 140 160 180 200 220 240 260 280 300 320 340 360
Elev
atio
n(m
)
40
60
80
100
120
140
160
180
200
220
240
260

Trung Son hydropower project Technical design
Appendix 97
c) Section3 Bishop method (K=0.70)
0.70
IA1IA2
IB
IIA
IA1IA2
IB
IIA
Distance(m)20 40 60 80 100 120 140 160 180 200 220 240 260
Ele
vatio
n(m
)
80
100
120
140
160
180
200
220
240
Janbu method (K=0.68)
0.68IA1
IA2
IB
IIA
IA1IA2
IB
IIA
Distance(m)20 40 60 80 100 120 140 160 180 200 220 240 260
Ele
vatio
n(m
)
80
100
120
140
160
180
200
220
240

Trung Son hydropower project Technical design
Appendix 98
d) Section 4 at left abutment dam Bishop method (K=0.44)
0.44
IA1
IA2IB
IIA
Distance(m)50 70 90 110 130 150 170 190
Ele
vatio
n(m
)
80
100
120
140
160
180
200
220
Janbu method (K=0.42)
0.42
IA1
IA2IB
IIA
Distance(m)50 70 90 110 130 150 170 190
Ele
vatio
n(m
)
80
100
120
140
160
180
200
220

Trung Son hydropower project Technical design
Appendix 99
e) Section 4 at right abutment dam
Bishop method (K=0.55)
0.55
Distance(m)20 40 60 80 100 120 140 160 180 200 220 240 260 280
Ele
vatio
n(m
)
80
100
120
140
160
180
200
220
240
Janbu method (K=0.54)
0.54
Distance(m)20 40 60 80 100 120 140 160 180 200 220 240 260 280
Ele
vatio
n(m
)
80
100
120
140
160
180
200
220
240

Trung Son hydropower project Technical design
Appendix 100
f) Section 5 Bishop method (K=0.40)
0.40
IA1
IA2
IB
Distance(m)160 180 200 220 240 260 280 300 320 340 360 380 400
Ele
vatio
n(m
)
70
90
110
130
150
170
190
210
230
250
Janbu method (K=0.37)
0.37
IA1
IA2
IB
Distance(m)160 180 200 220 240 260 280 300 320 340 360 380 400
Ele
vatio
n(m
)
70
90
110
130
150
170
190
210
230
250

Trung Son hydropower project Technical design
Appendix 101
APPENDIX CALCULATION OF RESERVOIR DOWNSTREAM STABILITY

Trung Son hydropower project Technical design
Appendix 102
a) Downstream section 1 Water drain from downstream water level=104.5m down downstream water
level=90.2m in 5 days. Bishop method (K=1.25)
1.25
IA1IA2
IB
IIA
Distance(m)40 60 80 100 120 140 160 180 200 220 240 260 280 300 320 340
Elev
atio
n(m
)
40
60
80
100
120
140
160
180
200
220
240
Janbu method (K=1.24)
1.240
IA1IA2
IB
IIA
Distance(m)40 60 80 100 120 140 160 180 200 220 240 260 280 300 320 340
Elev
atio
n(m
)
40
60
80
100
120
140
160
180
200
220
240

Trung Son hydropower project Technical design
Appendix 103
b) Downstream section 2 Water drain from downstream water level=104.5m down to downstream water
level=90.2m in 5 days. Bishop method (K=1.09)
1.09
edQ
IA1
IA2
IB
IIA
Distance(m)40 60 80 100 120 140 160 180 200 220 240 260
Elev
atio
n(m
)
60
80
100
120
140
160
180
200
220
240
260
280
Janbu method (K=1.08)
1.08
edQ
IA1
IA2
IB
IIA
Distance(m)40 60 80 100 120 140 160 180 200 220 240 260
Elev
atio
n(m
)
60
80
100
120
140
160
180
200
220
240
260
280

Trung Son hydropower project Technical design
Appendix 104
c) Downstream section 3 Water drain from downstream water level=104.5m down to downstream water
level=90.2m in 5 days. Bishop method (K=1.11)
1.11
edQ
IA1
IA2
IB
IIA
Distance(m)40 60 80 100 120 140 160 180 200 220 240 260 280 300
Ele
vatio
n(m
)
40
60
80
100
120
140
160
180
200
220
240
260
Janbu method (K=1.10)
1.10
edQ
IA1
IA2
IB
IIA
Distance(m)40 60 80 100 120 140 160 180 200 220 240 260 280 300
Elev
atio
n(m
)
40
60
80
100
120
140
160
180
200
220
240
260

Trung Son hydropower project Technical design
Appendix 105
d) Downstream section 4 Water drain from downstream water level=104.5m down to downstream water
level=90.2m in 5 days. Bishop method (K=1.28)
1.28
edQ
IA1
IA2
IB
IIA
Distance(m)100 120 140 160 180 200 220 240 260 280 300 320
Elev
atio
n(m
)
50
70
90
110
130
150
170
190
Janbu method (K=1.27)
1.27
edQ
IA1
IA2
IB
IIA
Distance(m)100 120 140 160 180 200 220 240 260 280 300 320
Elev
atio
n(m
)
50
70
90
110
130
150
170
190

ISO 9001:2000
VIETNAM ELECTRICITY
POWER ENGINEERING CONSULTING JOINT STOCK COMPANY 4
Project: T�.02.04
TRUNG SON HYDROPOWER PROJECT
TECHNICAL DESIGN
OPERATION MODEL OF RESERVOIR
Deputy Director of Hydropower Engineering Consulting Center Tr��ng Hoài Th� Tuyên
Project Manager V��ng Anh D ng
Nha trang City, July , 2010 ON BEHALF OF
GENERAL DIRECTOR
Tran Van Tho DEPUTY GENERAL DIRECTOR