Individual Attitudes Toward Corruption: Do Social Effects ...

257
Int. Journal of Economics and Management 15 (2): 257-268 (2021)
IJEM International Journal of Economics and Management
Journal homepage: http://www.ijem.upm.edu.my
Effects of Air Pollution and Corruption Control on Life Expectancy in
Middle-Income Countries
NOR ASMA AHMADa, NORMAZ WANA ISMAILb*, AUWAL YAHAYAc AND ALHAJI JIBRILLA ALIYUd
aFaculty of Enterpreneurship and Business, Universiti Malaysia Kelantan, Malaysia bSchool of Business and Economics,Universiti Putra Malaysia, Malaysia
cDepartment of Economics, Bauchi State University, Gadau, Nigeria dFaculty of Arts, Social and Management Sciences, Adamawa State University, Mubi, Nigeria
ABSTRACT
Air pollution is recognised as one of the main factors affecting the health status of the
population. Since environmental degradation mitigation works through public institutions,
the governance quality plays a vital role in the pollution health effect. Noting that
governance role may be relevant to ensure effective health care delivery, this study
addresses this issue by considering corruption control, which is considered important, but
especially in the setting of middle-income countries, the literature is largely vague. In
consequence, it seems that there is a need to assess the air pollution-health relationship in
order to develop suitable strategies toward a healthier climate. This study empirically
evaluates the life expectancy and corruption effect of PM2.5 in 72 middle-income countries
from the period of 2010 until 2017 by employing the dynamic panel estimation using
Generalized Method of Moment (GMM). The result suggests that the elevated level of PM2.5 has a significant effect on reducing life span. Furthermore, the findings suggest that
corruption regulation appears to mitigate the PM2.5 harmful effects towards life expectancy.
The study recommends the need to develop stricter environmental policies to protect the
health of the population, as good health is important for a better living.
JEL Classification: Q52, O11, I15
Keywords: PM2.5; corruption control; life expectancy; GMM
Article history:
Received: 15 February 2021
Accepted: 7 August 2021
* Corresponding author: Email: [email protected]
D

258
International Journal of Economics and Management
INTRODUCTION
The United Nations Development Programme has introduced life expectancy as among the key metrics in
calculating the Human Development Index (HDI) in determining a country's human development. Multiple
factors affecting life expectancy, and the environmental quality are taken into consideration amongst the most
crucial factors (Evans and Smith, 2005; Mariani et al., 2010). Environmental degradation of ambient air
pollutant such as sulphur dioxide (SO2), nitrogen dioxide (NO2), particulate matter (PM) and carbon dioxide
(CO2) are among proven toxic indication to various diseases and lessened life expectancy (Etchie et al., 2018;
Balakrishnan et al., 2019; Cheng et al., 2019). Given regular media attention and growing epidemiological
studies on risks to air quality, empirical air pollution and health relation analysis is not adequate, particularly in
middle-income countries. A thorough evaluation of the air pollutant effects on these nations is critically needed,
as they are in the phases of economic growth and consequently facing with environmental problems gradually
(Alvarado and Toledo, 2017; Pata, 2018). Apparently, with greater economic growth, but ultimately more
environmental pollution, will cause social adverse effects associated with health problems that are susceptible
in rising population mortality and thereby shortening life expectancy. Research on the relationship of health
outcomes with air contaminants is urgently required to build sustainable regional air pollutant coping strategies.
Evidence is rising that higher levels of corruption are impoverishing populations, increasing inequality
and declining health status (Witvliet et al., 2013; Naher et al., 2020). Corruption represents a violation of trust
and a deliberate willful misconduct (Mostert et al., 2012; Dwiputri et al., 2019), with negative implications for
population health, especially among the most vulnerable. Corruption disrupts environmental policies and the
quality of the environment. The corruption at the central government level can contribute to the postponement
or weakening of environmental regulations. On the other hand, local government corruption can curtail the
implementation of environmental policies in businesses, contributing to a decrease in policy standards (Wang
et al., 2019a). While corruption can be observed in all countries, its implications in low and middle-income
countries are especially devastating (Sathyamoorthy and Cheong, 2019; Bouchard et al., 2012; Leitao, 2016).
In particular, corruption can be observed as a notable contributor to environmental pollution among many
developing countries with relatively rich natural resources. For instance, corruption in Ukraine has been
identified as a source of obstacles to accessing health care and medical products (Mendel, 2017). While the
corruption effects on a population's health are not always apparent and immediate, their existence might worsen
the health system in various ways, negatively impacting the health of a group or nation. The corruption, for
example, has hampered child immunisation, increased patient wait times, lowered patient contentment and
reduced the functionality of clinics for care in the Philippines (Azfar and Gurgur, 2008). Kim and Wang (2019)
linked quality of government upon health outcomes whereby reducing corruption can significantly improve life
expectancy. Thus, anti-corruption may, on the contrary, improve health status.
Previous studies have shown that countries with lower levels of corruption have stronger health policies
that improve the population's health. Air pollution controls, on the other hand, necessitate certain capacities of
governing institutions. Leitao (2016) claims that policies and institutions can greatly minimize environmental
deterioration at low-income levels. Therefore, this study argues whether corruption control could substantially
mitigate the health impacts of air pollution. Observing the vast amount of current work on these concerns in
high-income settings, this study contributes to empirical studies by addressing this issue in largely ambiguous
literature within the context of middle-income countries. We considered life expectancy to measure the public
health outcomes while PM2.5 air pollutants are considered to be the primary environmental air pollutants that
pose a threat to public health in middle-income countries. We postulated that higher PM2.5 levels were linked to
a shorter life expectancy. Further, the study looks into the interaction effect of control of corruption in
moderating PM2.5 risk on life expectancy. The findings may be used to help the decision-makers develop policy
recommendations to assist the public contend with deteriorating air quality in the implementation of health
strategies. In addition, the aim of this study is to add to the empirical evidence from a public health perspective
on the role of government in environmental protection, as life expectancy is a well-documented and significant
indicator of general public health policy.
The remainder of the study is organized as following. The second part relates with previous empirical
research on the effects of air pollution and corruption on health outcomes. The third one describes the data and
model specification as well as the methodology. The fourth section presents the empirical findings. The final
part reviews the study's key findings and recommends several considerations for the future.

259
Effects of Air Pollution and Corruption Control on Life Expectancy in Middle-Income Countries
LITERATURE REVIEW
Air Pollution and Life Expectancy
Emission of air pollutants have been consistently linked to the negative consequences on human health (Nasari
et al., 2016; Tsai et al., 2018; Cheng et al., 2019). Air pollution is characterised by the accumulation of harmful
chemicals or substances in the air, at levels that carry a health threat (Seinfeld and Pandis, 2016). According to
the United Nations Economic Commission for Europe (UNECE), it is the most prominent ecological risk to
human health. Evidence also shows that air pollution is a significant trigger for morbidity (Babatola, 2018;
Tong, 2019; Estol, 2020). Outdoor air pollution is a primary risk to loss of life expectancy, particularly due to
cardiovascular diseases, which was proven by Lelieveld et al. (2020) study of various global risk factors.
Environmental medicine is especially concerned with particulate matter that has an aerodynamic diameter
smaller than 2.5 um (PM2.5). Epidemiological findings have also showed that frequent exposure to PM2.5 is
associated with an increased risk of mortality, resulting in a loss of lifespan (Kim et al., 2017; Li et al., 2018;
Wang et al., 2019b). Results of these analyses can help inform and describe the events linking air quality to
human health outcomes.
According to Chen et al. (2019), people in Taiwan who lived in areas depicted as having greater
concentrations of PM2.5 had a slightly shorter life expectancy, with a rise in PM2.5 correlated with a 0.3-year
decrease in life expectancy among adults. In 2017, India recorded an excessively high mortality and disease
burden associated with air pollution, according to the Global Unified Burden of Diseases, Injuries, and Risk
Factors Study, it comprises 359 illnesses or injuries with 84 risk factors (Balakrishnan et al., 2019). Using the
Global Burden of Disease project, PM2.5 exposure was estimated to lower global birth life expectancy of about
one year in 2016, with losses of 1.2 to 1.9 years in contaminated Asian and African countries (Apte et al., 2018).
In another study, Feng et al. (2016) emphasised the health repercussion due to a widespread rise of PM2.5. The
study further found that the pollutant's concentration in target cells would influence the physiology and
biochemistry of the cell, and could lead to poor birth effects and the progression of diabetes mellitus and
cardiopulmonary diseases, which can shorten life expectancy. According to Bennett et al. (2019), approximately
15,612 female deaths and 14,757 male deaths was caused by PM2.5 exposure, thus lowering national life
expectancy by 0.15 years for women while 0.13 years for men. Other studies built on the association concerning
fine particulate air pollution disclosure to life expectancy can be found in Schwartz et al. (2018), Hill et al.
(2019) and Wu et al. (2020).
However, the available evidence is largely based on the research of people subjected to moderate
exposure to air pollution, as seen in the developed countries (Aliyu and Ismail, 2016; Ebenstein et al., 2017).
Despite this, air pollution causes death and shortens life expectancy, with lower-income community suffering
the most. The global health burden of air pollution resulted in nearly 9 million deaths annually, with roughly
90% of deaths due to ambient air pollution occurring in low and middle-income countries (Carlsten et al., 2020).
The problem is more severe due to overpopulation and unregulated urbanisation and the growth of
industrialisation in the developing countries (Manisalidis et al., 2020). This leads to poor air quality, especially
in countries where there are social disparities and a lack of awareness about long-term environmental
management.
Corruption and Health Outcomes
Reducing the air pollution risk could depend on rapid implementation of effective environmental policies
throughout a country, which correspond with the enormity of air pollution as suggested by previous studies
including that of Zhang et al. (2016), Lisciandra and Migliardo (2017), and Wang et al. (2018). However, higher
corruption aggravates the pollutant release when the level of trust is little and has a huge effect on access to and
health services quality and weakens environmental regulation. In turn, these further impact health outcomes. A
previous study that looked into the relationship between corruption and health in various countries revealed that
the more corruption there is, the worse the health results are (Pinzón-Flórez et al., 2015; Gaitonde et al., 2016;
Ferrari and Salustri, 2020). For example, Gaitonde et al. (2016) discovered that corruption reduces the quality
of health services, efficiency and parity, which has a huge impact on health. Likewise, in 20 African countries,
greater corruption levels have been linked to poor general health in all socioeconomic groups over the lifecycle
(Witvliet et al., 2013). Achim et al. (2019) also found that the degree of corruption has a substantial effect on
both physical and mental health in a study consisting of high-income as well as low-income countries. In

260
International Journal of Economics and Management
addition, according to Nadpara and Samanta (2015), corruption has a bigger impact on health outcomes in
impoverished, developing nations than it does in richer, developed nations (along with a shorter life span and a
higher child mortality).
The essentiality of enhancing governance efficiency by decrease in corruption and maladministration is
likely to contribute to the effective use of health sector resources (Yaqub et al., 2012). The corroborated positive
relationships in Holmberg and Rothstein (2011) revealed that improvement in the government variables such as
Rule of Law and Government Effectiveness together with Corruption Perception Index are significantly related
to relatively high life expectancy and lower child mortality rates. Similarly, analysis of studies in 148 to 194
countries shows that an enhancement in governance points to a greater level of health outcomes (Kim and Wang,
2019). The results showed that a government's quality (corruption control and other governance indicators) and
quantity (share of government budget in GDP) have an optimistic influence on life expectancy with government
quality having a stronger bearing over people's health. In accordance with Lio and Lee (2016), a lower level of
corruption or better corruption regulation in such a nation can contribute to a long life span and lesser mortality
rate among children. On another study, Makuta and O'Hare (2015) employed the World Bank's World
Governance Indicators (WGI), which included corruption control, to measure the association of governance
quality and general health throughout Sub-Saharan Africa. The results showed that better governance improves
population health, as measured using under-five mortality and life expectancy.
Despite the fact that corruption is more common across low and middle-income countries, empirical
research on the effect of corruption on physical health (such as life expectancy) are still lacking, which further
detriments the poor. This study therefore, can provide valuable insights for that important field of study.
METHODOLOGY
Data Sources
This study employed a panel data framework in 72 middle-income countries from 2010 to 2017. The total
number of countries covered represents 68% of total lower and upper middle-income countries based on World
Bank country classifications by income. The selection of samples for this analysis is primarily subjected to data
availability. Table 1 illustrates the variables used in the study, as well as their sources. The dependent variable
is determined by life expectancy at birth, while the other variables are altogether explanatory variables. The
corruption control variable was taken from the World Bank's World Governance Indicators (WGI) database,
while the rest of the remaining variables were derived from the World Bank's World Development Indicators
(WDI) database. The level of air pollution that prevails in the economy is measured by the levels of particulate
matter (PM2.5) in micrograms per cubic meter. The remaining of the variables are the real GDP per capita, public
health spending as a percentage of total GDP, and education level of population. In addition, the indicator of
corruption control lies between –2.5 to 2.5, with a higher score signifying a better quality of governance and
lower score indicating otherwise. This corruption regulation represents the reversal of the degree of corruption
as viewed by the government officials and private sectors within national institutions.
Table 1 Summary of data Variables Definition Unit measurement Source
LE Life expectancy Life expectancy at birth, total (years) World Bank (WDI, 2018)
PM2.5 Emissions of PM2.5
Country level, PM2.5 (micrograms per cubic meter) World Bank (WDI, 2018)
Y Real GDP per capita Constant 2010 US dollars World Bank (WDI, 2018) ED Years schooling Percentage of school enrollment of the total population age
15 and over
World Bank (WDI, 2018)
HS Public health expenditure Public health expenditure (percentage of GDP) World Bank (WDI, 2018) CC Control of corruption Scaled from –2.5 to 2.5 (in standard deviations) World Governance
Indicators (WGI, 2018)
Models Specification
To investigate the potential impact of air pollution on health outcomes in middle-income countries, the empirical
models proposed by Makuta and O'Hare (2015), Aliyu and Ismail (2016), and Ahmad et al. (2021) are employed:
𝐿𝐸𝑖,𝑡 = 𝛼1𝑙𝑃𝑀2.5𝑖,𝑡 + 𝛼2𝑙𝑌𝑖,𝑡 + 𝛼3𝑙𝐻𝑆𝑖,𝑡 + 𝛼4𝑙𝐸𝐷𝑖,𝑡 + 𝜇𝑖 + 휀𝑖,𝑡 (1)

261
Effects of Air Pollution and Corruption Control on Life Expectancy in Middle-Income Countries
From the model specification, life expectancy (LE) is defined as the number of years a person may
possibly live at birth. This indicator is commonly seen to assess the health of a population due to its reliability
in reflecting health outcomes and availability in finding the measurements for many countries over the years
(Halicioglu, 2011; Makuta and O’Hare, 2015). PM2.5 is the indicator for air pollution measured by the PM2.5
levels. Because of its small size, particulate air pollution (PM2.5) can enter the narrower respiratory tract and
pulmonary system, causing serious health problems (Miah et al., 2011; Ghorani-Azam et al., 2016). It is
predicted, air pollutants would have a negative effect on LE.
Y, on the other hand, is a measure of a country's income in real gross domestic product (GDP) per capita.
GDP shows the average per-person income and represents the country's economic development and it is
anticipated that it would have a positive effect on LE. HS stands for health spending as a percentage of GDP,
where it is the measure of government interference within that health sector and also in residents' human capital.
ED is the educational level of the population. When education reduces the cost of knowledge, health quality
will then improve, and the people with better traits of education will develop a better comprehension of the
value of public health facilities and will be wiser to locate and use them. Thus, it is predicted that HS and ED
will have a positive effect on LE. μ denotes country-specific effects, and ε represents an error term. The
subscripts i and t represent cross-sectional countries and time (year), respectively.
Further, there are strong grounds to directly link the country’s level of corruption with the health status
of the population (Yaqub et al., 2012; Lio and Lee, 2016). Therefore, the regression equation is estimated as
follows:
𝐿𝐸𝑖,𝑡 = 𝛼1𝑙𝑃𝑀2.5𝑖,𝑡 + 𝛼2𝑙𝑌𝑖,𝑡 + 𝛼3𝑙𝐻𝑆𝑖,𝑡 + 𝛼4𝑙𝐸𝐷𝑖,𝑡 + 𝛼5𝐶𝐶𝑖,𝑡+ 𝜇𝑖 + 휀𝑖,𝑡 (2)
Paucity in transparency of governance can foster corruption and lower health-care quality. Regulating
corruption and creating environments least susceptible to misconduct, such as adequate funding the public health
care system, enhancing social transparency, and improving structures from outside healthcare system, are
deemed critical in making the health sector less prone to corruption (Naher et al., 2020; Kankeu et al., 2016).
Accordingly, it is predicted that corruption control (CC) would possess a positive relationship with health
outcomes.
Corruption could have an effect on the regulatory process for environmental legislation as well as the
implementation of current environmental regulations, affecting pollutant discharge (Wang et al., 2019a). To
take account on the moderation effect of the corruption regulation on the air pollution impact toward life
expectancy, an interaction term is implemented:
𝐿𝐸𝑖,𝑡 = 𝛼1𝑙𝑃𝑀2.5𝑖,𝑡 + 𝛼2𝑙𝑌𝑖,𝑡 + 𝛼3𝑙𝐻𝑆𝑖,𝑡 + 𝛼4𝑙ED𝑖,𝑡 + 𝛼5𝐶𝐶𝑖,𝑡 + 𝛼6(𝑙𝑃𝑀2.5𝑖,𝑡 ∗ 𝐶𝐶𝑖,𝑡 )+ 𝜇𝑖 + 휀𝑖,𝑡 (3)
Where (𝑙𝑃𝑀2.5𝑖,𝑡 ∗ 𝐶𝐶𝑖,𝑡 ) measures the interaction of PM2.5 and corruption control. The interaction term
was employed to examine whether corruption regulation played a moderator role, influencing how effective a
governance is in mitigating air pollution risk on health. If the quality of governance lessens the negative effect
of air pollution, the expected coefficient from this interaction would be positive.
In pursuance to further explore the corruption regulation marginal effects, the total PM2.5 impact on life
expectancy is examined both directly and indirectly through control of corruption following Ibrahim and Law
(2016). To do so, the relative corruption control elasticity as regards to life expectancy from regression Eq. (3)
would be comprehended as follows:
𝛿𝑙𝐿𝐸 𝛿𝑙𝑃𝑀2.5⁄ = 𝛼1 + (𝛼6 ∗ 𝐶𝐶) (4)
Thus, the comprehensive influence between air pollution and life expectancy refers to the amount of the
direct (𝛼1) and indirect effects (𝛼6 ∗ 𝐶𝐶) across corruption levels. As shown in Eq. (4), the effect of air pollution
on life expectancy is based on the degree of corruption. This effect is measured at two different levels of the
minimum score and maximum score. From the equation, 𝛼6 is expected to be positive. As a baseline, the health
effect of emission may be 𝛼1, which is negative. With negative 𝛼1, a positive 𝛼6 indicates the capability of
corruption control to improve health effect from air pollution. Therefore, governance role might be perceived
as important in order to achieve improved health.

262
International Journal of Economics and Management
Dynamic Panel Data Models
Because of the panel type of data, the estimating models were evaluated following the panel generalized method
of moments (GMM) estimator established by Arellano and Bond (1991), Arellano and Bover (1995), and
Blundell and Bond (1998). GMM estimator is used within this study as it is a dynamic model capable of
controlling endogeneity problems arising from the dynamic model specification, measurement error, Nickell
bias, heteroskedasticity, unobserved heterogeneity as well as reverse causation (Ibrahim and Law, 2016; Goh et
al., 2018). Furthermore, this technique is suited for conditions in which the number of cross-sectional units (N)
beyond the time period (T). Thus, the dynamic panel GMM estimator is perfectly suited for this study because
the cross-section (72) is greater than the period span (8).
As seen below, a framework of dynamic panel regression is employed to incorporate a lagged dependent
variable:
Model 1:
𝐿𝐸𝑖,𝑡 = 𝛼0𝐿𝐸𝑖,𝑡−1 + 𝛼1𝑙𝑃𝑀2.5𝑖,𝑡 + 𝛼2𝑙𝑌𝑖,𝑡 + 𝛼3𝑙𝐻𝑆𝑖,𝑡 + 𝛼4𝑙𝐸𝐷𝑖,𝑡 + 𝜇𝑖 + 휀𝑖,𝑡 (5)
Model 2:
𝐿𝐸𝑖,𝑡 = 𝛼0𝐿𝐸𝑖,𝑡−1 + 𝛼1𝑙𝑃𝑀2.5𝑖,𝑡 + 𝛼2𝑙𝑌𝑖,𝑡 + 𝛼3𝑙𝐻𝑆𝑖,𝑡 + 𝛼4𝑙ED𝑖,𝑡 + 𝛼5𝐶𝐶𝑖,𝑡+ 𝜇𝑖 + 휀𝑖,𝑡 + 휀𝑖,𝑡 (6)
Model 3:
𝐿𝐸𝑖,𝑡 = 𝛼0𝐿𝐸𝑖,𝑡−1 + 𝛼1𝑙𝑃𝑀2.5𝑖,𝑡 + 𝛼2𝑙𝑌𝑖,𝑡 + 𝛼3𝑙𝐻𝑆𝑖,𝑡 + 𝛼4𝑙ED𝑖,𝑡 + 𝛼5𝐶𝐶𝑖,𝑡 + 𝛼6(𝑙𝑃𝑀2.5𝑖,𝑡 ∗ 𝐶𝐶𝑖,𝑡) + 𝜇𝑖
+ 휀𝑖,𝑡 (7)
𝐿𝐸𝑖,𝑡−1 is a one-year lagged dependent variable that incorporates dynamism in the model (i.e. past health
status determines the current one). Based on the underlying models (equations 5, 6, and 7), the existence of
lagged dependent variables will cause the endogeneity issue. According to Arellano and Bond (1991),
endogeneity can be addressed by transforming the data using the differentiation method as proposed in the
difference GMM. However, a later study by Blundell and Bond (1998) argued that the difference GMM might
affect huge sample bias, thus, proposed the system GMM estimators to improve efficiency by using both lagged
levels and different information. It is a common practice in the commonly used GMM method to use a two-step
approach to increase the performance of the GMM estimation technique and the strength of the related tests
(Hwang and Sun, 2018). The two-step system GMM is more efficient than the one-step system GMM because
it generates much asymptotic efficient results, which is especially important in circumstances where
heteroskedasticity issues are well contained within the one-system GMM (Roodman, 2009; Oseni, 2016).
Therefore, for this reason, a two-step system GMM is employed throughout the analysis. Nonetheless, the
instrument validity required both Hansen test and Autocorrelation test to overrule the null hypothesis in
inhibiting the two-step GMM from producing a biased standard error leading to a weakened over-identification
test.
RESULTS AND DISCUSSION
Table 2 shows the descriptive statistics datasets in their original forms, including the mean, standard deviations,
and minimum and maximum values. On average, the findings demonstrate that the overall mean PM2.5 (29.4),
income (4547), public health expenditures (2.9), education attainment (104.5) and control of corruption (–0.41).
The discrepancy shows that for most countries, government quality indicators represented by corruption control
are low (as shown by the average), suggesting plausible economic and environmental complications.
Table 2 Summary statistics for health outcomes indicators and its determinants Variables Standard Deviation Mean Minimum Maximum
LE 6.296 70.236 50.423 80.03 PM2.5 15.446 29.381 10.538 97.599
Y 3135.624 4547.09 785.693 14936.4
HS 1.678 2.921 0.178 11.546 ED 8.637 104.489 69.752 134.52
CC 0.553 -0.41 -1.673 1.568
263
Effects of Air Pollution and Corruption Control on Life Expectancy in Middle-Income Countries
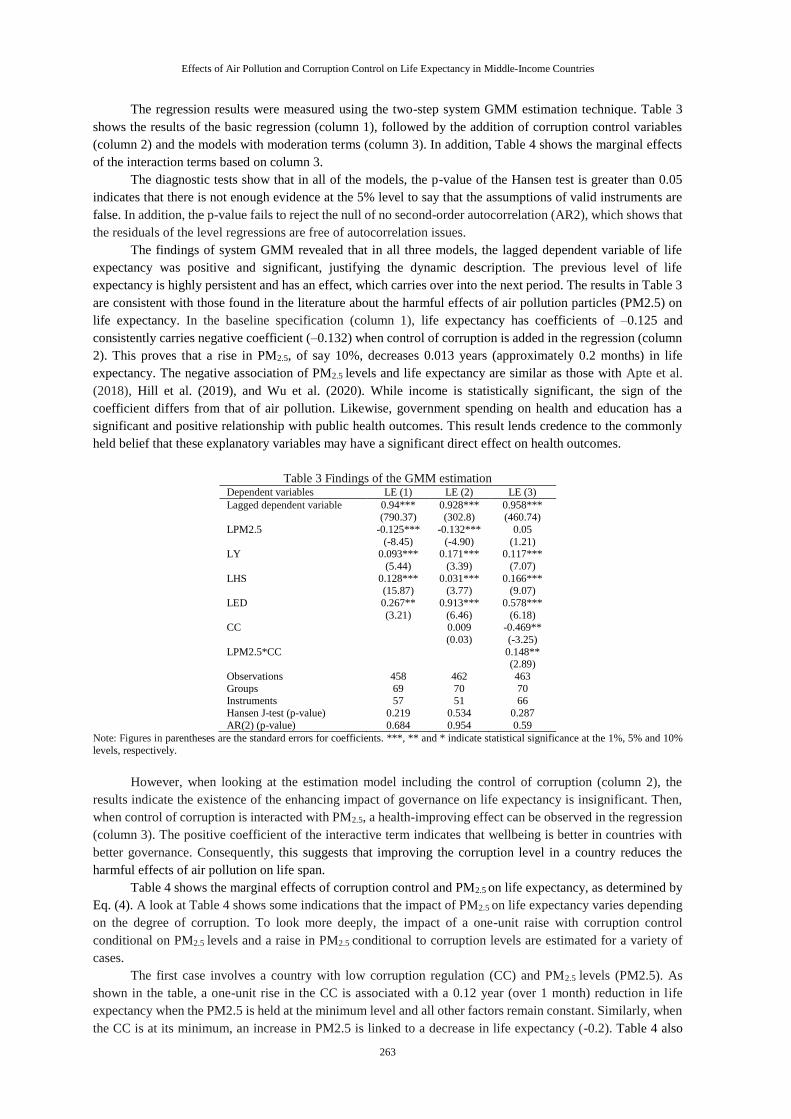
The regression results were measured using the two-step system GMM estimation technique. Table 3
shows the results of the basic regression (column 1), followed by the addition of corruption control variables
(column 2) and the models with moderation terms (column 3). In addition, Table 4 shows the marginal effects
of the interaction terms based on column 3.
The diagnostic tests show that in all of the models, the p-value of the Hansen test is greater than 0.05
indicates that there is not enough evidence at the 5% level to say that the assumptions of valid instruments are
false. In addition, the p-value fails to reject the null of no second-order autocorrelation (AR2), which shows that
the residuals of the level regressions are free of autocorrelation issues.
The findings of system GMM revealed that in all three models, the lagged dependent variable of life
expectancy was positive and significant, justifying the dynamic description. The previous level of life
expectancy is highly persistent and has an effect, which carries over into the next period. The results in Table 3
are consistent with those found in the literature about the harmful effects of air pollution particles (PM2.5) on
life expectancy. In the baseline specification (column 1), life expectancy has coefficients of –0.125 and
consistently carries negative coefficient (–0.132) when control of corruption is added in the regression (column
2). This proves that a rise in PM2.5, of say 10%, decreases 0.013 years (approximately 0.2 months) in life
expectancy. The negative association of PM2.5 levels and life expectancy are similar as those with Apte et al.
(2018), Hill et al. (2019), and Wu et al. (2020). While income is statistically significant, the sign of the
coefficient differs from that of air pollution. Likewise, government spending on health and education has a
significant and positive relationship with public health outcomes. This result lends credence to the commonly
held belief that these explanatory variables may have a significant direct effect on health outcomes.
Table 3 Findings of the GMM estimation Dependent variables LE (1) LE (2) LE (3)
Lagged dependent variable 0.94*** (790.37)
0.928*** (302.8)
0.958*** (460.74)
LPM2.5 -0.125***
(-8.45)
-0.132***
(-4.90)
0.05
(1.21) LY 0.093***
(5.44)
0.171***
(3.39)
0.117***
(7.07)
LHS 0.128*** (15.87)
0.031*** (3.77)
0.166*** (9.07)
LED 0.267**
(3.21)
0.913***
(6.46)
0.578***
(6.18) CC 0.009
(0.03)
-0.469**
(-3.25)
LPM2.5*CC 0.148** (2.89)
Observations 458 462 463
Groups 69 70 70 Instruments 57 51 66
Hansen J-test (p-value) 0.219 0.534 0.287
AR(2) (p-value) 0.684 0.954 0.59
Note: Figures in parentheses are the standard errors for coefficients. ***, ** and * indicate statistical significance at the 1%, 5% and 10%
levels, respectively.
However, when looking at the estimation model including the control of corruption (column 2), the
results indicate the existence of the enhancing impact of governance on life expectancy is insignificant. Then,
when control of corruption is interacted with PM2.5, a health-improving effect can be observed in the regression
(column 3). The positive coefficient of the interactive term indicates that wellbeing is better in countries with
better governance. Consequently, this suggests that improving the corruption level in a country reduces the
harmful effects of air pollution on life span.
Table 4 shows the marginal effects of corruption control and PM2.5 on life expectancy, as determined by
Eq. (4). A look at Table 4 shows some indications that the impact of PM2.5 on life expectancy varies depending
on the degree of corruption. To look more deeply, the impact of a one-unit raise with corruption control
conditional on PM2.5 levels and a raise in PM2.5 conditional to corruption levels are estimated for a variety of
cases.
The first case involves a country with low corruption regulation (CC) and PM2.5 levels (PM2.5). As
shown in the table, a one-unit rise in the CC is associated with a 0.12 year (over 1 month) reduction in life
expectancy when the PM2.5 is held at the minimum level and all other factors remain constant. Similarly, when
the CC is at its minimum, an increase in PM2.5 is linked to a decrease in life expectancy (-0.2). Table 4 also

264
International Journal of Economics and Management
shows the marginal effects for a country with the maximum CC and PM2.5 levels. In the next case, a one-unit
rise in the CC is associated with a 0.21-year (nearly 3-month) increase in life expectancy when the PM2.5 is at
its maximum level and everything else remains constant. In the same way, when the CC is at its maximum, an
increase in PM2.5 is linked to a shorter life expectancy (-0.18).
Table 4 Marginal effects of corruption control and PM2.5 on life expectancy Minimum Maximum
Corruption control (CC) -1.673 1.568
PM2.5 2.355 4.581
∆𝐿𝐸/∆𝐶𝐶 -0.12 0.209
∆𝐿𝐸/∆𝑃𝑀2.5 -0.198 -0.182
Note: PM2.5 is expressed in natural logarithm. The calculation is based on regressions Table 1 (column 3): ∆𝛿𝐿𝐸/𝛿𝐶𝐶 = −0.469 + 0.148𝐴𝑃; ∆𝛿𝐿𝐸/𝛿𝑃𝑀2.5 = 0.05 + 0.148𝐶𝐶.
The marginal effects of corruption control on health status imply that health status tends to be worse for
country with lesser control of corruption (poor governance). However, it can be noticed that the impact of PM2.5
on health is consistently harmful across the countries. From these, it can be concluded that higher rates of
corruption regulation in middle-income countries are able to reduce the air pollution hazard on health status
more effectively. Good governance, nevertheless, is vigorous in improving the air quality of a country optimally.
In fact, low corruption may prevent public resources from suffering from leakages and therefore be able to
translate into social investments such as higher quality of health. These findings largely support those of Kim
and Wang (2019), Biadgilign et al. (2019) and Sirag et al. (2017), who found that corruption has a major impact
on health outcomes.
CONCLUSION
The aim of this study is to look into the impact of PM2.5 and corruption control on life expectancy. The empirical
findings showed that air pollution was negatively linked to life expectancy in middle-income countries. Besides
that, socioeconomic factors including such income, public health spending, and educational attainment tended
to be influential in extending life expectancy. Most importantly, the governance quality through corruption
control was found to be significant in moderating the negative impact of PM2.5 on life expectancy. This endorses
the study’s claim that the governance role in reducing air pollution risk is more effective in promoting population
health when there is a higher level of corruption control than when there is a low level of corruption control.
We recommend middle-income nations to improve their corruption control mechanisms for improved
health outcomes, as enhancing corruption control reduces the negative health effects of PM2.5. Lower corruption
can be connected to higher environmental policy stringency, which will result in better environmental outcomes.
In middle-income countries, where corruption enforcement is stronger, environmental pressures may lessen,
resulting in decreased health risk and improved health outcomes. It is consequently critical to adopt stronger
environmental standards in order to protect the population's health, as good health is essential for a better quality
of life.
REFERENCES
Achim, M.V., Văidean, V.L. and Borlea, S.N. (2019) “Corruption and health outcomes within an economic and
cultural framework”, The European journal of health economics, 21(2), pp. 195-207.
Ahmad, N.A., Ismail, N.W., Sidique, S.F.A. and Mazlan, N.S. (2021) “Air pollution effects on adult mortality rate in
developing countries”, Environmental Science and Pollution Research, 28(7), pp. 8709-8721.
Aliyu, A.J. and Ismail, N.W. (2016) “The effects of air pollution on human mortality: does gender difference matter
in African countries?”, Environmental Science and Pollution Research, 23(21), pp. 21288-21298.
Alvarado, R. and Toledo, E. (2017) “Environmental degradation and economic growth: evidence for a developing
country”, Environment, Development and Sustainability, 19(4), pp. 1205-1218.
Apte, J.S., Brauer, M., Cohen, A.J., Ezzati, M. and Pope III, C.A. (2018) “Ambient PM2. 5 reduces global and regional
life expectancy”, Environmental Science & Technology Letters, 5(9), pp. 546-551.

265
Effects of Air Pollution and Corruption Control on Life Expectancy in Middle-Income Countries
Arellano, M. and Bond, S. (1991) “Some tests of specification for panel data: Monte Carlo evidence and an application
to employment equations”, The review of economic studies, 58(2), pp. 277-297.
Azfar, O. and Gurgur, T. (2008) “Does corruption affect health outcomes in the Philippines?”, Economics of
Governance, 9(3), pp. 197-244.
Babatola, S.S. (2018) “Global burden of diseases attributable to air pollution”, Journal of public health in Africa, 9(3).
Balakrishnan, K., Dey, S., Gupta, T., Dhaliwal, R.S., Brauer, M., Cohen, A.J., Stanaway, J.D., Beig, G., Joshi, T.K.,
Aggarwal, A.N. and Sabde, Y. (2019) “The impact of air pollution on deaths, disease burden, and life expectancy
across the states of India: the Global Burden of Disease Study 2017”, The Lancet Planetary Health, 3(1), pp.
e26-e39.
Bennett, J.E., Tamura-Wicks, H., Parks, R.M., Burnett, R.T., Pope III, C.A., Bechle, M.J., Marshall, J.D., Danaei, G.
and Ezzati, M. (2019) “Particulate matter air pollution and national and county life expectancy loss in the USA:
A spatiotemporal analysis”, PLoS medicine, 16(7), pp. e1002856.
Biadgilign, S., Ayenew, H. Y., Shumetie, A., Chitekwe, S., Tolla, A., Haile, D., Gebreyesus, S.H., Deribew, A. and
Gebre, B. (2019) “Good governance, public health expenditures, urbanization and child undernutrition nexus in
Ethiopia: an ecological analysis”, BMC health services research, 19(1), pp. 1-10.
Blundell, R. and Bond, S. (1998) “Initial conditions and moment restrictions in dynamic panel data models”, Journal
of econometrics, 87(1), pp. 115-143.
Bouchard, M., Kohler, J.C., Orbinski, J. and Howard, A. (2012) “Corruption in the health care sector: A barrier to
access of orthopaedic care and medical devices in Uganda”, BMC international health and human rights, 12(1),
pp. 1-9.
Carlsten, C., Salvi, S., Wong, G.W. and Chung, K.F. (2020) “Personal strategies to minimise effects of air pollution
on respiratory health: advice for providers, patients and the public”, European Respiratory Journal, 55(6).
Chen, C.C., Chen, P.S. and Yang, C.Y. (2019) “Relationship between fine particulate air pollution exposure and
human adult life expectancy in Taiwan”, Journal of Toxicology and Environmental Health, Part A, 82(14), pp.
826-832.
Cheng, Q., Li, M., Li, F. and Tang, H. (2019) “Response of Global Air Pollutant Emissions to Climate Change and
Its Potential Effects on Human Life Expectancy Loss”, Sustainability, 11(13), pp. 3670.
Dwiputri, I.N., Pradiptyo, R. and Arsyad, L. (2019), “Corruption and Capital Growth: Identification of Bribery by the
Firm”, International Journal of Economics & Management, 13(2).
Ebenstein, A., Fan, M., Greenstone, M., He, G. and Zhou, M. (2017) “New evidence on the impact of sustained
exposure to air pollution on life expectancy from China’s Huai River Policy”, Proceedings of the National
Academy of Sciences, 114(39), pp. 10384-10389.
Estol, C.J. (2020) “Air Pollution and Cardiovascular Disease: A Proven Causality”, In Health of People, Health of
Planet and Our Responsibility (pp. 193-204). Springer, Cham.
Etchie, T.O., Etchie, A.T., Adewuyi, G.O., Pillarisetti, A., Sivanesan, S., Krishnamurthi, K. and Arora, N.K. (2018)
“The gains in life expectancy by ambient PM2.5 pollution reductions in localities in Nigeria”, Environmental
Pollution, 236, pp. 146-157.
Evans, M.F. and Smith, V.K. (2005) “Do new health conditions support mortality–air pollution effects?”, Journal of
Environmental Economics and Management, 50(3), pp. 496-518.
Feng, S., Gao, D., Liao, F., Zhou, F. and Wang, X. (2016) “The health effects of ambient PM2.5 and potential
mechanisms”, Ecotoxicology and environmental safety, 128, pp. 67-74.
Ferrari, L. and Salustri, F. (2020) “The relationship between corruption and chronic diseases: evidence from
Europeans aged 50 years and older”, International journal of public health, pp. 1-11.
Gaitonde, R., Oxman, A.D., Okebukola, P.O. and Rada, G. (2016) “Interventions to reduce corruption in the health
sector”, Cochrane Database of Systematic Reviews, 8.
Ghorani-Azam, A., Riahi-Zanjani, B. and Balali-Mood, M. (2016) “Effects of air pollution on human health and
practical measures for prevention in Iran”, Journal of research in medical sciences: the official journal of
Isfahan University of Medical Sciences, 21.
Goh, L.T., Kaliappan, S.R. and Ishak, S. (2018) “Income Inequality and Crime: Evidence from a Dynamic Panel Data
Approach”, International Journal of Economics & Management, 12(2), pp. 479-490.
Halicioglu, F. (2011) “Modeling life expectancy in Turkey”, Economic Modelling, 28(5), pp. 2075-2082.

266
International Journal of Economics and Management
Hill, T.D., Jorgenson, A.K., Ore, P., Balistreri, K.S. and Clark, B. (2019) “Air quality and life expectancy in the
United States: An analysis of the moderating effect of income inequality”, SSM-population health, 7, pp.
100346.
Holmberg, S. and Rothstein, B. (2011) “Dying of corruption”, Health Econ. Pol'y & L., 6, pp. 529.
Hwang, J. and Sun, Y. (2018) “Should we go one step further? An accurate comparison of one-step and two-step
procedures in a generalized method of moments framework”, Journal of econometrics, 207(2), pp. 381-405.
Ibrahim, M.H. and Law, S.H. (2016) “Institutional Quality and CO2 Emission–Trade Relations: Evidence from S ub‐
Saharan A frica”, South African Journal of Economics, 84(2), pp. 323-340.
Kankeu, H.T., Boyer, S., Fodjo Toukam, R. and Abu‐Zaineh, M. (2016) “How do supply‐side factors influence
informal payments for healthcare? The case of HIV patients in Cameroon”, The International journal of health
planning and management, 31(1), pp. E41-E57.
Kim, S. and Wang, J. (2019) “Does quality of government matter in public health?: comparing the role of quality and
quantity of government at the National Level”, Sustainability, 11(11), pp. 3229.
Kim, S.Y., Olives, C., Sheppard, L., Sampson, P.D., Larson, T.V., Keller, J.P. and Kaufman, J.D. (2017) “Historical
prediction modeling approach for estimating long-term concentrations of PM2. 5 in cohort studies before the
1999 implementation of widespread monitoring”, Environmental health perspectives, 125(1), pp. 38-46.
Leitão, A. (2016) “Corruption and the Environment”, Journal of Socioeconomics, 5(3).
Lelieveld, J., Pozzer, A., Pöschl, U., Fnais, M., Haines, A. and Münzel, T. (2020) “Loss of life expectancy from air
pollution compared to other risk factors: a worldwide perspective”, Cardiovascular research, 116(11), pp.
1910-1917.
Li, X., Tang, K., Jin, X.R., Xiang, Y., Xu, J., Yang, L.L., Wang, N., Li, Y.F., Ji, A.L., Zhou, L.X. and Cai, T.J. (2018)
“Short-term air pollution exposure is associated with hospital length of stay and hospitalization costs among
inpatients with type 2 diabetes: a hospital-based study”, Journal of Toxicology and Environmental Health, Part
A, 81(17), pp. 819-829.
Lio, M.C. and Lee, M.H. (2016) “Corruption costs lives: a cross‐country study using an IV approach”, The
International journal of health planning and management, 31(2), pp. 175-190.
Lisciandra, M. and Migliardo, C. (2017) “An empirical study of the impact of corruption on environmental
performance: Evidence from panel data”, Environmental and Resource Economics, 68(2), pp. 297-318.
Makuta, I. and O’Hare, B. (2015) Quality of governance, public spending on health and health status in Sub Saharan
Africa: a panel data regression analysis”, BMC public health, 15(1), pp. 1-11.
Manisalidis, I., Stavropoulou, E., Stavropoulos, A. and Bezirtzoglou, E. (2020) “Environmental and health impacts
of air pollution: a review”, Frontiers in public health, 8.
Mariani, F., Pérez-Barahona, A. and Raffin, N. (2010) “Life expectancy and the environment”, Journal of Economic
Dynamics and Control, 34(4), pp. 798-815.
Mendel, I. (2017) “In Ukraine, Health Care Is Free (Except When It’s Not)”, POLITICO.
Miah, M.D., Masum, M.F.H., Koike, M., Akther, S. and Muhammed, N. (2011) “Environmental Kuznets Curve: the
case of Bangladesh for waste emission and suspended particulate matter”, The environmentalist, 31(1), pp. 59-
66.
Mostert, S., Sitaresmi, M.N., Njuguna, F., van Beers, E.J. and Kaspers, G.J. (2012) “Effect of corruption on medical
care in low‐income countries”, Pediatric Blood and Cancer, 58(3), pp.325.
Nadpara, N. and Samanta, S. (2015) “An empirical examination of the effect of corruption on health outcomes”, The
College of New Jersey, pp. 1-26.
Naher, N., Hoque, R., Hassan, M.S., Balabanova, D., Adams, A.M. and Ahmed, S.M. (2020) “The influence of
corruption and governance in the delivery of frontline health care services in the public sector: a scoping review
of current and future prospects in low and middle-income countries of south and south-east Asia”, BMC public
health, 20, pp. 1-16.
Nasari, M.M., Szyszkowicz, M., Chen, H., Crouse, D., Turner, M.C., Jerrett, M., Pope, C.A., Hubbell, B., Fann, N.,
Cohen, A. and Gapstur, S.M. (2016) “A class of non-linear exposure-response models suitable for health impact
assessment applicable to large cohort studies of ambient air pollution”, Air Quality, Atmosphere & Health, 9(8),
pp. 961-972.
Oseni, I.O. (2016) “Exchange rate volatility and private consumption in Sub-Saharan African countries: A system-
GMM dynamic panel analysis”, Future Business Journal, 2(2), pp. 103-115.

267
Effects of Air Pollution and Corruption Control on Life Expectancy in Middle-Income Countries
Pata, U.K. (2018) “Renewable energy consumption, urbanization, financial development, income and CO2 emissions
in Turkey: testing EKC hypothesis with structural breaks”, Journal of Cleaner Production, 187, pp. 770-779.
Pinzón-Flórez, C.E., Fernández-Niño, J.A., Ruiz-Rodríguez, M., Idrovo, Á.J. and López, A.A.A. (2015)
“Determinants of performance of health systems concerning maternal and child health: a global approach”, PloS
one, 10(3), pp. e0120747.
Roodman, D. (2009) “How to do xtabond2: An introduction to difference and system GMM in Stata”, The stata
journal, 9(1), pp. 86-136.
Sathyamoorthy, V. and Cheong, T.T. (2019) “Does institutional quality matter for the success of export-led
growth?”, International Journal of Economics & Management, 13(2).
Schwartz, J.D., Wang, Y., Kloog, I., Yitshak-Sade, M.A., Dominici, F. and Zanobetti, A. (2018) “Estimating the
effects of PM2.5 on life expectancy using causal modeling methods”, Environmental health
perspectives, 126(12), pp. 127002.
Seinfeld, J.H. and Pandis, S.N. (2016) “Atmospheric chemistry and physics: from air pollution to climate change”,
John Wiley & Sons.
Sirag, A., Nor, N.M., Abdullah, N.M.R. and Abd Ghani, J. (2017) “Public health financing and infant mortality: Does
governance quality matter?”, Public Finance and Management, 17(4), pp. 341-370.
Tong, S. (2019) “Air pollution and disease burden”, The Lancet Planetary Health, 3(2), pp. e49-e50.
Tsai, S.S., Tsai, C.Y. and Yang, C.Y. (2018) “Fine particulate air pollution associated with increased risk of hospital
admissions for hypertension in a tropical city, Kaohsiung, Taiwan”, Journal of Toxicology and Environmental
Health, Part A, 81(13), pp. 567-575.
Wang, Q., Wang, J., Zhou, J., Ban, J. and Li, T. (2019b) “Estimation of PM2· 5-associated disease burden in China
in 2020 and 2030 using population and air quality scenarios: a modelling study”, The Lancet Planetary
Health, 3(2), pp. e71-e80.
Wang, S., Yuan, Y. and Wang, H. (2019a) “Corruption, hidden economy and environmental pollution: a spatial
econometric analysis based on China’s provincial panel data”, International journal of environmental research
and public health, 16(16), pp. 2871.
Wang, Z., Zhang, B. and Wang, B. (2018) “The moderating role of corruption between economic growth and CO2
emissions: Evidence from BRICS economies”, Energy, 148, pp. 506-513.
Witvliet, M.I., Kunst, A.E., Arah, O.A. and Stronks, K. (2013) “Sick regimes and sick people: a multilevel
investigation of the population health consequences of perceived national corruption”, Tropical Medicine &
International Health, 18(10), pp. 1240-1247.
Wu, Y., Wang, W., Liu, C., Chen, R. and Kan, H. (2020) “The association between long-term fine particulate air
pollution and life expectancy in China, 2013 to 2017”, Science of The Total Environment, 712, pp. 136507.
Yaqub, J.O., Ojapinwa, T.V. and Yussuff, R.O. (2012) “Public health expenditure and health outcome in Nigeria: The
impact of governance”.
Zhang, Y.J., Jin, Y.L., Chevallier, J. and Shen, B. (2016) “The effect of corruption on carbon dioxide emissions in
APEC countries: a panel quantile regression analysis”, Technological Forecasting and Social Change, 112, pp.
220-227.

268
International Journal of Economics and Management
APPENDIX
Apendix 1 Country lists Bhutan Bolivia Cabo Verde
Cambodia Cameroon Cote d'Ivoire Egypt El Salvador Swaziland
Ghana Honduras India
Indonesia Kenya Kiribati Kyrgyz Republic Laos Lesotho
Mauritania Moldova Mongolia
Morocco Myanmar Nigeria Pakistan Philippines Sao Tome and Principe
Solomon Islands Sudan Tunisia
Ukraine Uzbekistan Vietnam Zambia Albania Algeria
Turkey Venezuela Armenia
Azerbaijan Brazil Belarus Belize China Colombia
Costa Rica Cuba Dominican Republic
Ecuador Fiji Georgia Grenada Guatemala Iran
Kazakhstan Lebanon North Macedonia
Malaysia Mauritius Mexico Namibia Peru Romania
Russian Federation Samoa Serbia
South Africa Sri Lanka St. Vincent and the Grenadines Suriname Thailand Tonga