D BASED PROBLEM SOLVING - May Institute PBIS 2014 - Kincaid... · • Average referrals/day/month...
58
D ATA BASED P ROBLEM SOLVING Don Kincaid University of South Florida
Transcript of D BASED PROBLEM SOLVING - May Institute PBIS 2014 - Kincaid... · • Average referrals/day/month...

DATA BASED PROBLEM SOLVING
Don Kincaid
University of South Florida

1. MTSS Defined
MTSS is a term used to describe an evidence-
based framework of educating students that
includes providing high quality, effective core
instruction, intervention supports matched to
student needs and uses data based problem
solving to integrate all academic and behavior
instruction and interventions.

2. Data Utilization – In General
• Educators should use key questions to guide
data use (Feldman & Tung, 2001; Lachat & Smith, 2005; Protheroe, 2001)
• Structured data use approaches: use data
rather than be used by data (Wayman & Stringfield, 2006)


2. Data Utilization – In General
• Recognize & plan for common barriers to data
use (Coburn & Talbert, 2006; Honig &
Venkateswaren, 2012; Kerr et al., 2006; Lachat
& Smith, 2005; Little, 2012; Young, 2006)
• Expand definition of a “data system” beyond
just technology – include data
practices/culture!! (e.g., Armstrong & Anthes, 2006; Honig &
Venkateswaren, 2012; Ingram et al., 2004).
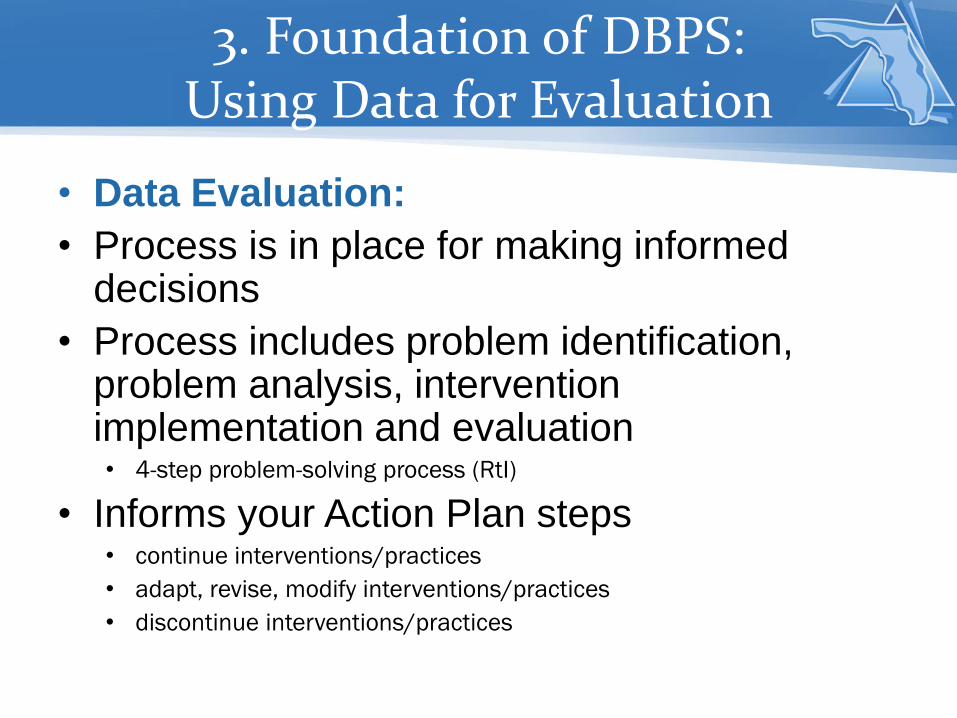
3. Foundation of DBPS: Using Data for Evaluation
• Data Evaluation:
• Process is in place for making informed decisions
• Process includes problem identification, problem analysis, intervention implementation and evaluation • 4-step problem-solving process (RtI)
• Informs your Action Plan steps • continue interventions/practices
• adapt, revise, modify interventions/practices
• discontinue interventions/practices

Evaluating Your Data • Data Evaluation:
• Process is in place for making informed decisions
• Process includes problem identification, problem analysis, intervention implementation and evaluation • 4-step problem-solving process (RtI)
• Informs your Action Plan steps • continue interventions/practices
• adapt, revise, modify interventions/practices
• discontinue interventions/practices

Evaluating Your Data
• Evaluation Process Includes: • System to efficiently and effectively collect, record and graph
data
• Resources and expertise to review and analyze data
• Monthly review and analysis of discipline and outcome data
• SWPBS Action Plan updates based on data review and
analysis
• Discussion: • Are these steps included in your school’s data evaluation process?
• If not, in what areas would you like additional support?

Discipline Data Sources
• Five major data sources: • Average referrals/day/month
• Referrals by: problem behavior, location, time of day, and individual student
• Additional data sources • Referrals by motivation or function (get/obtain, escape/avoid)
• Office-managed vs. classroom-managed referrals
• ISS/OSS data
• Discussion: • Does your PBS team review and analyze your school’s discipline data
at each meeting?
• Does your team use the data to evaluate the PBS development and implementation process and develop next steps?

Other Data Sources
• Staff, student and/or parent surveys
• Staff and student attendance
• Teacher requests for assistance or school-wide behavioral screening
• ESE referrals
• Grades and/or standardized test scores (FCAT)
• Fidelity measures • Benchmarks of Quality, PBS Implementation Checklist, Walkthrough Evaluations
• SWPBS Action Plan
• Direct observations
• Discussion: • What are other sources of outcome data?
• Does your PBS team review other data sources at each meeting and use the data to evaluate progress?

Data Evaluation
• Questions to address at each monthly PBS
meeting:
• Are problem behaviors improving?
• Are problem behaviors ‘holding steady’?
• Are problem behaviors ‘getting worse’?
• The following slides provide ‘next steps’ to
help address each of these questions.

Problem Behaviors Improving
• Discipline data shows a decrease in problem behavior • At least 80% of students receive 0-1 ODRs
• Significant decrease in ODRs from previous month/quarter
• Decrease in OSS/ISS days
• Review other data sources to confirm progress • At least 80% of students contact reward events
• PBS Implementation Checklist/Benchmarks of Quality
• Consistency exists across teachers, grade-levels/hallways, etc.
• School-climate/faculty surveys more positive or supportive
• ODRs are decreasing equally - disaggregate the data • ESE, ethnicity/race, free/reduced lunch, male/female
• Classroom, grade-level, individual teachers

Problem Behaviors ‘Holding Steady’ • Look for areas of improvement
• Benchmarks of Quality, PIC, Action Plan implementation • Increasing the level of support at Tier 1 may increase intervention effectiveness
• Are your interventions targeted appropriately? • Review referrals by location, time of day, teacher, grad-level, etc.
• Review expectations and rules • Are the expectations well-defined and have they been taught?
• Review discipline procedures and definitions • Are problem behaviors well-defined?
• Are office-managed vs. teacher-managed behaviors well-defined?
• Do your interventions target the appropriate function/motivation of the problem behaviors?

Problem Behaviors ‘Getting Worse’
• Use the 4-step problem solving process:
1. Identify the Problem Be specific, problem behavior(s) should be well-defined
2. Analyze the Problem – Hypothesis development Teaching – Are the expectations being taught as planned?
Fidelity – Are the interventions being implemented as designed?
Admin decisions & function of behavior: Is problem behavior being reinforced?
• 3. Design Interventions Do the interventions target the problem behavior(s)?
Have the strategies been taught to all staff?
• 4. Evaluation (RtI) – Is it working? Are the problem behaviors decreasing?

Problem Behaviors ‘Getting Worse’ Problem-Solving Process
Step 1: Problem Identification
Step 2: Problem Analysis
Step 3: Intervention Design
Step 4: Response
to Intervention Why is it occurring?
What’s the problem?
What are we going to do about it?
Is it working?
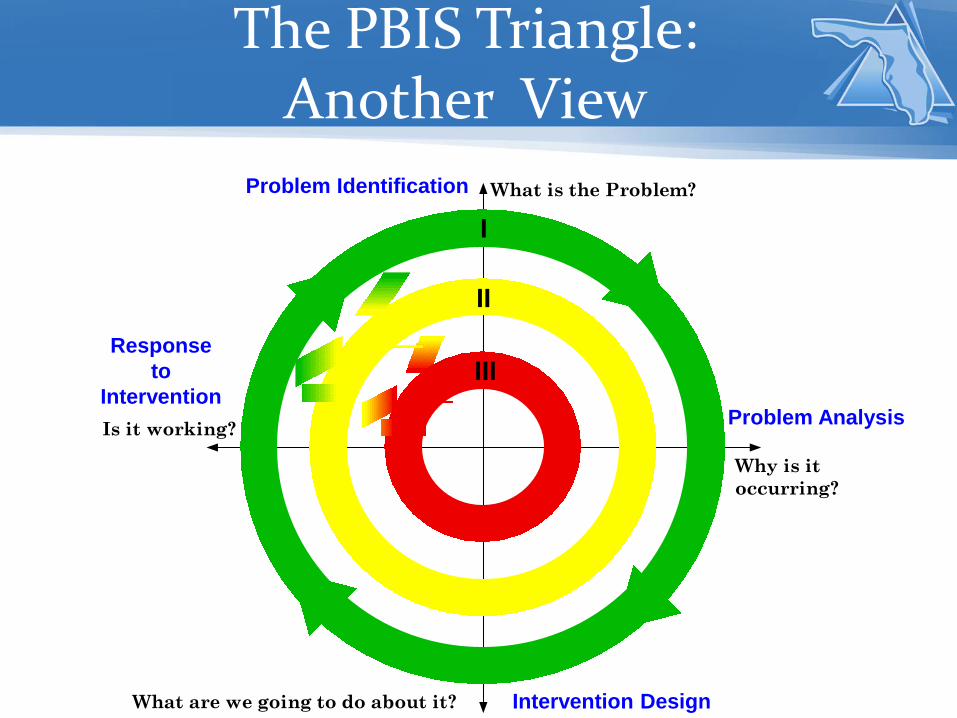
What is the Problem?
Why is it
occurring?
Is it working?
What are we going to do about it?
The PBIS Triangle: Another View
I
II
III
Problem Identification
Problem Analysis
Intervention Design
Response
to
Intervention

Florida’s Guiding Questions
Step 1 – Problem ID
• What do we expect out students to know, understand, and do as a result of instruction?
• Do our students meet or exceed these expected levels? (How sufficient is the core?)
• Are there groups for whom core is not sufficient?
Step 2 – Problem Analysis
• If the core is NOT sufficient for either a “domain” or group of students, what barriers have
or could preclude students from reaching expected levels?
Step 3 – Plan Development and Implementation
• What strategies or interventions will be used?
• What resources are needed to support implementation of the plan?
• How will sufficiency and effectiveness of core be monitored overtime?
• How will fidelity be monitored over time?
• How will “good”, “questionable,” and “poor” responses to intervention be defined?
Step 4 – Plan Evaluation of Effectiveness
• Have planned improvements to core been effective?

Step 1: Problem Identification – Tier 1
• What do we expect our students to know,
understand, and do as a result of
instruction?
• Do our students meet or exceed these
expected levels? (How sufficient is the core?)
• Are there groups for whom core is not
sufficient?

Expectations for Behavior
• 80% have 1 or fewer ODRs
• Are the # of ODRs, ISS and OSS per 100
students higher than the national or district
average?
• Are the # of ODRs, ISS and OSS per
100 students decreasing?
• Is attendance steady?

Step 1: Problem Identification – Tier 1
• What do we expect our students to know,
understand, and do as a result of
instruction?
• Do our students meet or exceed these
expected levels? (How sufficient is the core?)
• Are there groups for whom core is not
sufficient?

Do 80% of students exhibit appropriate behavior?

Do 80% of students exhibit appropriate behavior?

During the current year, does the school have students with 2 or more ODRs by October 1?

Are the # of ODRs, ISS and OSS per 100 students
higher than the national or district average?
• National Average for MS is .05 per 100
students

Are the # of ODRs, ISS and OSS per
100 students decreasing?

Are the # of ODRs, ISS and OSS per
100 students decreasing?

Is attendance steady?

Step 1: Problem Identification – Tier 1
• What do we expect our students to know,
understand, and do as a result of
instruction?
• Do our students meet or exceed these
expected levels? (How sufficient is the core?)
• Are there groups for whom core is not
sufficient?

Are there groups of students for whom the
Tier 1 Core is not sufficient?

Are there groups of students for whom
the Tier 1 Core is not sufficient?

Are there groups of students for whom the Tier 1 Core is not sufficient?

Problem Identification - Example

Step 2 – Problem Analysis Tier 1
• If the core is NOT sufficient for either a
“domain” or group of students, what barriers
have or could preclude students from
reaching expected levels?
– Why are some students not successful (Initial
Hypotheses)?

Step 2: Problem Analysis – Tier 1
1. Instruction
• Are best practices in instruction being delivered to those students?
• Is instruction being delivered in sufficient amounts or as often as necessary?
2. Curriculum
• Are lesson plans in alignment with the appropriate core standards/expectations?
• Are the curricular materials being used with fidelity or as designed?
• Does staff have the knowledge and skills to utilize the curricular materials in alignment
with grade-level/school-wide standards or expectations?
3. Environment
• Do all staff and students know the school-wide behavioral expectations?
• Are they being used consistently across all settings? (e.g., school climate)?
• Are the school-wide behavioral expectations in alignment with the school/district
missions?
• Are best practices in classroom management being utilized and in alignment with the
school-wide behavioral expectations?
4. Learner
• Are students accessing the available instruction? (e.g., attendance)
• Are students “actively engaged” in classroom instruction?
• Do students perceive having a positive relationship with their school/teachers?

Problem Analysis - Example

Step 3: Plan Devel. and Implementation–Tier 1
• What strategies or interventions will be
used?
• What resources are needed to support
implementation of the plan?
• How will sufficiency and effectiveness of
core be monitored overtime?
• How will fidelity be monitored over time?
• How will “good”, “questionable,” and “poor”
responses to intervention be defined?

3. Intervention Design - Example

Step 4: Plan Evaluation– Tier 1
• Have planned improvements to core been
effective?

Are the # of ODRs, ISS and OSS per 100 students
higher than the national or district average?
• National Average for MS is .05 per 100
students
Intervention in August produced immediate
and sustained change.

Are the # of ODRs, ISS and OSS per
100 students decreasing?
Over 50% reduction in two years.

Are the # of ODRs, ISS and OSS per
100 students decreasing?
Implementation produced immediate
and sustained change.

Are there groups of students for whom the Tier 1 Core is not sufficient?
Do these bar graphs level out indicating no disproportionality?

Fidelity?
Does the school see improvements next year in these area?

Response to Intervention - Example

Evaluation: Additional Guiding Questions
• Is PBS/RtI:B being implemented across campus?
• Is it being implemented with fidelity?
• Is there sustainability of implementation?
• Are there benefits to students over time with PBS/RtI:B implementation?
• Are there benefits for staff?
• Do students with greater needs benefit from implementation?

Guiding Questions: Tiers 2 and 3
• Do any students meet or exceed expected levels? (How sufficient is
the core?)
– Is there any disproportionality (race, ethnicity, sex, ESE, grade level, class
distribution, etc.) in academic/behavior outcomes?
– Are no more than approximately 20% identified as needing additional
supplemental supports (i.e., Tier 2)? If no, does the Tier 1 improvement plan
address this?
– Are no more than approximately 5% of students identified as needing intensive
supports (i.e., Tier 3)? If no, does the Tier 1 improvement plan address this?
• Are there groups for whom Tier 2 and Tier 3 services currently being provided are
not sufficient?
– Are there any students who are represented in multiple groups (e.g.,
demonstrate needs in behavior and academic domains)?
– Has the team considered the function and/or type of the problem?

Guiding Questions: Tiers 2 and 3
Since the core and/or supplemental
instruction is NOT sufficient for either a group
of students or an individual student, what
barriers have or could preclude students from
reaching expected levels?
– Are hypotheses focused on alterable factors?
– Is there a clear understanding of the situations
(i.e., antecedents) that result in the outcomes
being achieved for the group/student who is not
meeting expectations?

Guiding Questions: Tiers 2 and 3
Step 3 – Plan Development and Implementation
• What strategies or interventions will be used?
– Matching intervention to function
– Limited number of generic approaches
• What resources are needed to support implementation of the plan?
– T2=quick turn around, limited teacher training, progress monitoring, etc., T3= team facilitation, behavioral expertise, etc.)
• How will sufficiency and effectiveness of Tier 2 supports be monitored overtime?
– Introduction of progress monitor tool consistent across all interventions
– Impact of Tier 2 and 3 interventions on Core outcome measures (ISS, OSS, ODRs)
• How will fidelity be monitored over time?
– Usefulness of PIC and BAT for fidelity
• How will “good”, “questionable,” and “poor” responses to intervention be defined?
– Goal level and criteria for attainment of goal developed by the Tier 2/3 team

Guiding Questions: Tiers 2 and 3
• Have planned improvements/supports at Tier 2 been
effective?
– Does the team have a set of guidelines to structure a
common approach to analyzing the data (e.g., “decision
rules”)?
– If students’ progress in response to Tier 2 or Tier 3
services demonstrates a “good” response, and there is
no increase in Tier 1 performance, what decision(s) will
the team make?
– If students’ progress in response to Tier 2 or 3 services
demonstrates “questionable” or “poor” responses, is
there adequate fidelity of intervention services being
provided? If yes, or no, what decisions will the team
make?

Intervention Outcomes

Implementation Fidelity

Guiding Questions: Tiers 2 and 3
Step 4 – Plan Evaluation of Effectiveness
• Have planned improvements to Tier 2 been
effective?
– Decreases in “core” behavioral issues (OSS,ISS,
ODRs)
• Per student
• Per groups of students/interventions
• Per entire school/grade/classroom
– Improvement in progress monitoring tool’s goal

Data for T2 and 3


Use Your Data
• Identify areas that are problematic
• Improve Tier 1 supports
• Expand and implement PBIS strategies
• Tier 2/Supplemental
• Tier 3/Intensive
• Support the acquisition of additional resources for
further school improvement
• Promote PBIS within the community
• Identify and celebrate successes

Thank You!
• Questions/Comments?