Cyfrowy Polsat S.A. - Strona głó · PDF filePolish Equity Conference 2-3 April 2009,...
36
Cyfrowy Polsat S.A. Poland’s No 1 DTH platform Polish Equity Conference 2-3 April 2009, London
Transcript of Cyfrowy Polsat S.A. - Strona głó · PDF filePolish Equity Conference 2-3 April 2009,...

Cyfrowy Polsat S.A.Poland’s No 1 DTH platform
Polish Equity Conference
2-3 April 2009, Londonp

Disclaimer
This presentation includes 'forward-looking statements'. These statements contain the wordsti i t " "b li " "i t d" " ti t " " t" d d f i il i All t t t th th t t t f hi t i l f tanticipate", "believe", "intend", "estimate", "expect" and words of similar meaning. All statements other than statements of historical facts
included in this presentation, including, without limitation, those regarding the Company’s financial position, business strategy, plans and objectives of management for future operations (including development plans and objectives relating to the Company's products and services) are forward-looking statements. Such forward-looking statements involve known and unknown risks, uncertainties and other important factors that could cause the actual results, performance or achievements of the Company to be materially different from future results, performance or achievements expressed or implied by such forward-looking statements Such forward-looking statements are based on numerous assumptionsachievements expressed or implied by such forward looking statements. Such forward looking statements are based on numerous assumptions regarding the Company's present and future business strategies and the environment in which the Company will operate in the future. These forward-looking statements speak only as at the date of this presentation. Company expressly disclaims any obligation or undertaking to disseminate any updates or revisions to any forward-looking statements contained herein to reflect any change in the Company's expectations with regard thereto or any change in events, conditions or circumstances on which any such statement is based. The Company cautions you that forward-looking statements are not guarantees of future performance and that its actual financial position, business strategy, plans and objectives of management for future operations may differ materially from those made in or suggested by the forward-looking statements contained in this presentation. In addition, even if the Company's financial position, business strategy, plans and objectives of management for future operations are consistent with the forward-looking statements contained in this presentation, those results or developments may not be indicative of results or developments in future periods. The Company does not undertake any obligation to review or confirm or to release publicly any revisions to any forward-looking statements to reflect events that occur or circumstances that arise after the date of this
t tipresentation.
The information and opinions contained in this document are provided as at the date of this presentation and are subject to change without notice.
2

Cyfrowy Polsat on the WSE
3

Cyfrowy Polsat shares on WSE
We debut on the WSE on 6 May 2008. Since that day the WIG index decreased by over 40% and our share price increased by 4%decreased by over 40% and our share price increased by 4%
Our shares entered MSCI EME Index on 25 November 2008
Our shares entered WIG 20 Index as of 20 March 2009
CPS vs. WIG
11
4
Introduction to Cyfrowy Polsat
5

Cyfrowy Polsat highlights
AttractiveAttractive, unconsolidated
market with significant growth
potential
Largest DTH operator in Poland,
5th largest in Europe
Experienced senior
Extensive, high-quality
i ffExperienced senior management team programming offer
at competitive prices
Strong brand name and highStrong financial name and high
customer satisfaction
Strong financialprofile Upfront payment
subscription and STB sale business model with low
churn rates
6
churn rates
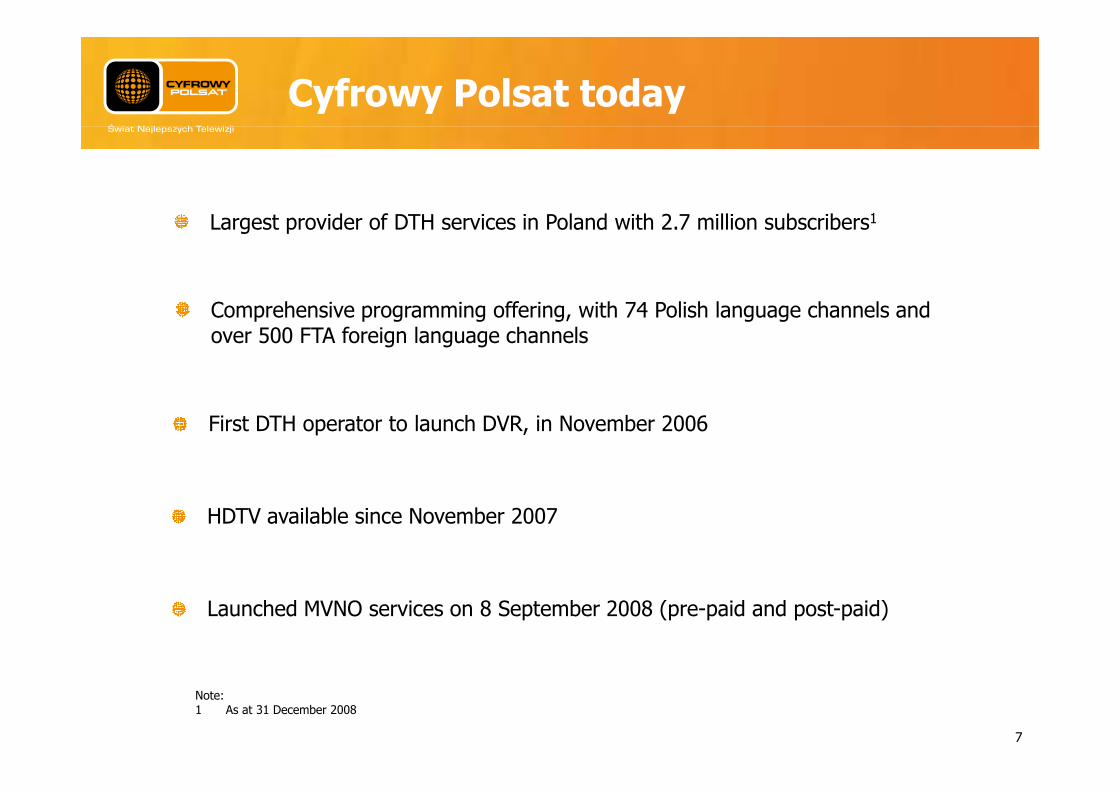
Cyfrowy Polsat today
L t id f DTH i i P l d ith 2 7 illi b ib 1Largest provider of DTH services in Poland with 2.7 million subscribers1
Comprehensive programming offering with 74 Polish language channels andComprehensive programming offering, with 74 Polish language channels and over 500 FTA foreign language channels
First DTH operator to launch DVR, in November 2006
HDTV available since November 2007
Launched MVNO services on 8 September 2008 (pre-paid and post-paid)
7
Note:1 As at 31 December 2008

Dynamic growth
Significant subscriber and revenue growth
1 136
50
1 200
Subscribers Revenues and EBITDA
2,068
2,727
2 000
2 500
0s) 797
1,136
30
40
800
1 000
1 200
)
1,274
,
1 000
1 500
(000
282
483
34817%
21%
31%
20
30
400
600 (%)
(PLN
m)
657
0
500
282
46 74
166
17% 15%
0
10
0
200
2005 2006 2007 2008 2005 2006 2007 2008
Revenues EBITDA EBITDA margin (rhs)
8
Source: Calculated based on Grupa Cyfrowy Polsat S.A. audited IFRS financial statements for 2004–2008,Notes:1 Year end subscriber numbers for 2004–20082 2006 financials are reclassified to conform with FY 2007 results; results from the subsidiary EMARKET, sold on 31 August 2007 are presented
under "net profit/(loss) from discontinued operations“

Polish Pay TV market
9

TV viewing time
Average daily TV viewing minutes per adult (2007)Average daily TV viewing minutes per adult (2007)
Poland has one of the highest average daily TV viewing minutes
289
253 253 252234250
300
350
Watching Pay TV is a common and generally cheap form of entertainment
234217 210
186 184
100
150
200
250
(min
utes
)
0
50
Serb
ia
olan
d
ngar
y
reec
e
man
ia
este
rn
es 1
Russ
ia
ovak
ia
publ
ic
ActivityIllustrativecost (PLN)S Po
Hun G
r
Rom
Aver
age
top
5 W
eEu
rope
an c
outr
ie R
Slo
Czec
h Rep Activity cost (PLN)
Mini Package monthly 10
Menu McDonald 12
Mini Max Package monthly 20
Source: WARC (World Advertising Research Center) 2007
Note
A Mini Max Package monthly 20
Movie ticket 22-27
Family Package monthly 38
10
Note: 1 Includes Italy, Germany, France, UK and Spain ½h of bowling 45

The Polish DTH market
Poland is one of the largest DTH markets in Europe, with significant room for growthg g
Polish pay TV market penetration forecast69 71 74 78 81Total (%)
Increase in CATV/DTH subscribers in Poland
2% 2% 3%4% 5%
75%
100%
4,380 4,500 4,600 4,700 4,6075 000
6 000
34% 36% 38% 41% 43%
2% 2%
50%
(000
s)
2,215
3,388
2 000
3 000
4 000
(000
s)
33% 33% 33% 33% 33%
0%
25%1,439
0
1 000
2 000
2005 2006 2007 2008 2005 2006 2007 2008
Source: Informa , Eastern European TV 12th Edition (cable
2009 2010 2011 2012 2013
CATV DTH IPTV
2005 2006 2007 2008 2005 2006 2007 2008
CATV Pay DTH
Source: GUS, KRRiTV, PIKE, Informa, own estimates
11
Source: Informa , Eastern European TV 12th Edition (cable penetration adjusted for the homes passed)
Source: GUS, KRRiTV, PIKE, Informa, own estimates

Poland’s fastest growing DTH player
DTH t i P l d D b 2008 C f P l t' h f DTH thDTH operators in Poland - December 2008 Cyfrowy Polsat's share of DTH growth
75% 80%
Our market share of net adds 72% 52%
300*
2 500
3 000
)
3.027
1.098
1.276
1 000
1 200
1 400
2.727
1.3801 500
2 000
subs
crib
ers
(‘0
00
776
617
795
659
600
800
1 000
000s
)
92**500
1 000
Num
ber
of s
592327
264
200
400
600(
500
0
1 2 30
2005 2006 2007 2008
T t l DTH t dditi C f P l t t dditi
12
Source: Press publicataions,TVN Grup Annual Report
Source: Press, Company information
*Users having the set-top box with the coding system and being able to get the pay television immediately after paying a subscription fee** Users of Telewizja na kartę
Total pay DTH net additions Cyfrowy Polsat net additions
Our product
13

Our packagesOver 500 TV channels and 9 Polish radio channels
Subscribers (000s)
Price(PLN)
No. ofChannels
Family (Basic)
2,286 47 37.90
CivilisationScience
Relax MixFamily
63 +19.90
2
Upgrade from Family PackagePolska
F ilRelax Mix as aboveRelax Mix +
HBO
Super Film
Upgrade from Family Package
Upgrade from
Family66 +
39.90
Family68
Relax Mix as above+
Relax Mix as above+
2Super Film package
Upgrade from Family Package
68 +49.90
+
HD
Family /HBO 5 +
6.00 per A la carte
Mini 441 19 9.90
pchannel
14Mini Max 23 19.90
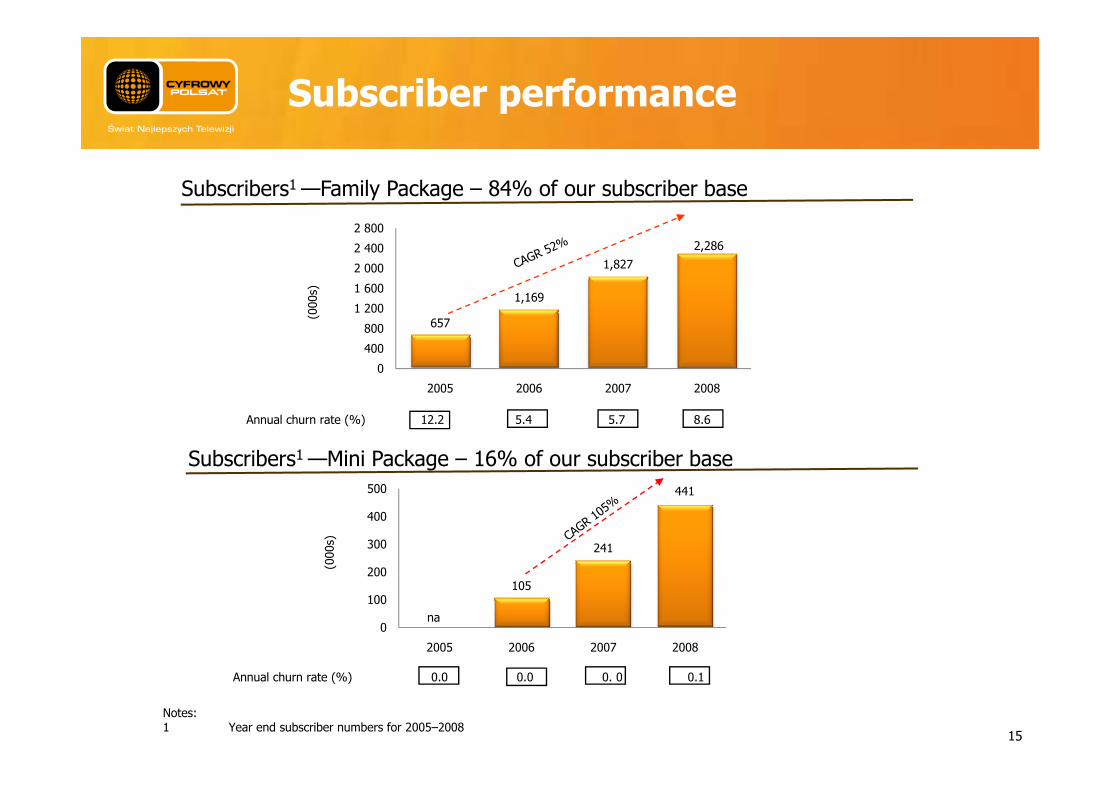
Subscriber performance
Subscribers1 —Family Package – 84% of our subscriber base
1,169
1,8272,286
1 200
1 600
2 000
2 400
2 800
00s)
657
0
400
800
1 200
2005 2006 2007 2008
(00
Subscribers1 —Mini Package – 16% of our subscriber base500
Annual churn rate (%) 12.2 5.4 5.7 8.6
241
441
200
300
400
500
(000
s)
105
0
100
200
2005 2006 2007 2008
na
15
Notes:1 Year end subscriber numbers for 2005–2008
Annual churn rate (%) 0.0 0.0 0. 0 0.1

ARPU performance
ARPU1 —Family Package
30.235.9 37.8 39.4
30
40
50
onth
)
0
10
20
30
(PLN
/mo
ARPU1 —Mini Package2005 2006 2007 2008
8.4 8.610
5
(PLN
/mon
th)
0
2005 2006 2007 2008
S C l l t d b d G C f P l t S A dit d IFRS fi i l t t t f 2004 2008 d C
na na
16
Source: Calculated based on Grupa Cyfrowy Polsat S.A. audited IFRS financial statements for 2004–2008 and CompanyNotes:1 ARPU is calculated as subscription revenues divided by average numer of subscribers (based on the monthly average)

Poland’s DTH players comparison
Cyfrowy Polsat maintains competitive prices while offering high quality services
Launch date December 1999 November 1998 October 2006
Subscribers 1 2,726,993 c. 1,380,000 c. 500,000
Channels 74 Polish TV Access to over 500 FTA
channels via HotBird
72 Polish TV Access to FTA channels
via HotBird
77 Polish TV Access to FTA channels
via HotBird
Content Key content: 2 exclusive sports channels; 15 movie channels incl. HBO
Polsat and all key TVN, TVP channels
Key content: 2 exclusive sports channels; 20 movie channels incl. CANAL + and HBO
Key TVN, TVP but no Polsat channels
Key content: 1 exclusive sports channel; 20 movie channels incl. HBO
Key TVN, TVP channels but no Polsat channels
Packages (monthly fees)
Entry: PLN 10/€2.4 Full: PLN 112/€26.8
Entry: PLN 19/€4.6 Full: PLN 147/€35.2
Entry: PLN 32/€7.7 Full: PLN 190/€45.5
New services (launch date)
HDTV (November 2007) DVR (November 2006)
HDTV (Q4 2006) IPTV in co-operation with
HDTV (Q4 2006) VoD (September 2007)
MVNO (September 2008) TPSA (2006) DVR (2008)
DVR (December 2006)
17
Source: Company information, PressNotes:1 As at 31 December 2008

Our strategy
18

Strategy: highlights
Increase penetration of pay DTH satellite broadcastingIncrease penetration of pay DTH satellite broadcasting services
Increase ARPU through creation of new packages, launch of new products and possible increases of subscription prices
Continue to build value of our DTH business with key new products and possible increases of subscription prices
Continue to manage existing operations cost-effectively and efficiently (e.g. improve profitability through in-house production of STBs)
business with key targets to:
production of STBs)
Leverage brandMVNO services launched on 8 September 2008
Consider offering broadband and fixed-line telephony in thefuture
Leverage brand name and existing subscriber base to
launch bundled services
19

The MVNO opportunity
Combination of DTH and MVNO can serve as the basis for a potential future multiple-play offering Large addressable market beyond DTH customer base
Strategically valuable option
Limited incremental investment Numerous operational synergies (sales, customer care, marketing, etc.)
Controllable costs , g, )
Access to mobile content from current business partners
Leverages brand equity and sales network of 1,296 PoSPh d i t tLi it d i k Phased investmentEarly entrant in a fast-growing market
Limited risk
New business generating incremental profitsMaintain DTH customer loyalty and reduce churnCross-promotion and cross-selling
High potential return
20
The MVNO provides attractive upside potential

Financial highlights
21

Impressing revenue growth Much slower growth in the operating costs uc s o e g o t t e ope at g costs
Revenues
1 000
1 200
797
1,136
400
600
800
(PLN
m)
0
200
2007 2008
Operating costsOperating costs
800
1 000
652812
200
400
600
( PLN
m)
0
200
2007 200822

Revenues up by 42% due to an increase in subscription feesp
Revenues 2008 revenues breakdown (%)
1500
10016
42
1000
9%
2% 4%
107
100
1215
1000
(PLN
m)
663
97850086%
0
2007 2008
Subscription fees
Sales of satellite television receiving equipment
(‘000 PLN) 2008 2007 ChangeRevenues, of which: 1,136,281 796,669 42%
Sales of signal transmission services
Other operating revenues
Subscription fees 977,678 662,521 48%
Sales of satellite television receiving equipment 100,180 107,205 (7%)
Sales of signal transmission services 16,440 11,602 42%
Other operating revenues 41,987 15,341 174%
23

Operating costs grew slower than revenues
Operating costs (m PLN)
109800
20242
65209
13254
400
(PLN
m)
152221
48
59126
42
(‘000 PLN) 2008 2007 ChangeOperating costs, of which:
Amortisation
811,987
23,547
651,522
20,777
25%
13%
21 240
2007 2008Amortisation
Programming costs
Signal transmission services costs
Amortisation 23,547 20,777 13%
Programming costs 221,443 152,031 46%
Signal transmission services costs 59,006 48,402 22%
Di t ib ti k ti d t tSignal transmission services costs
Distribution and marketing costs
Salaries and employee-related expenses
Costs of satellite television receiving equipment sold
Distribution, marketing and customer care costs202,465 125,919 61%
Salaries and employee-related expenses 64,589 41,701 55%
Costs of satellite television receiving equipment sold132,122 209,028 (37%)
Other operating costs
Other operating costs 108,815 53,664 103%
24
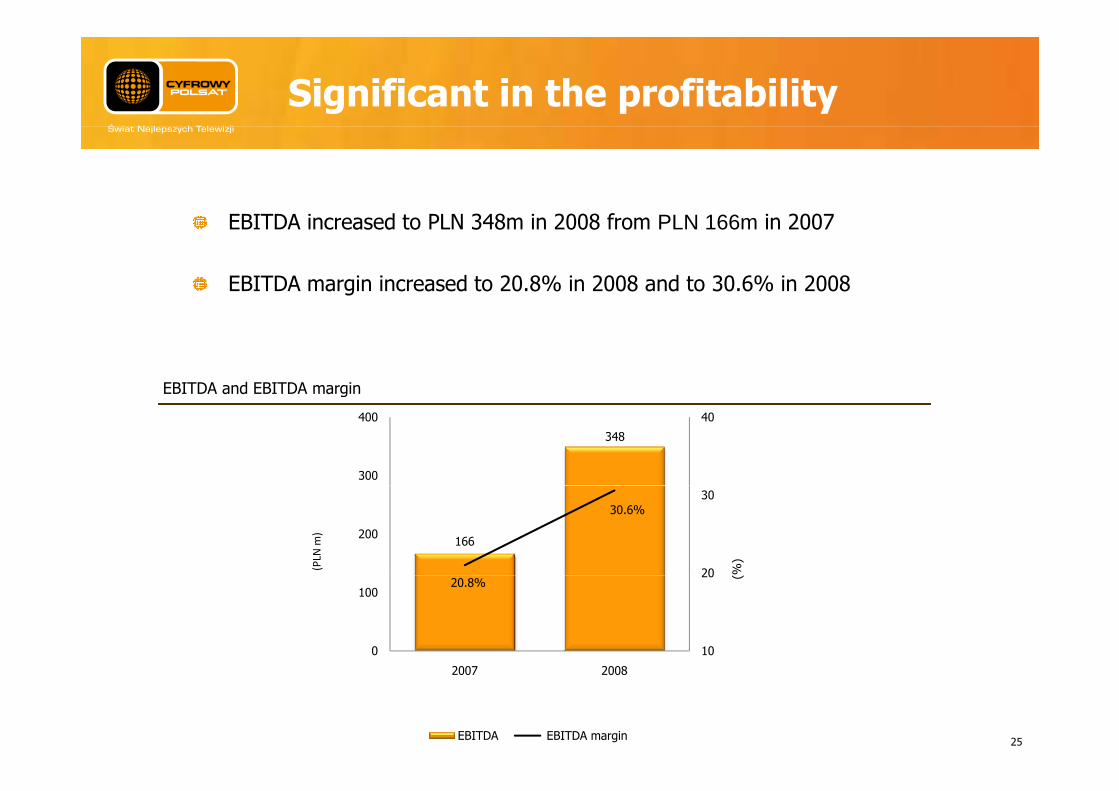
Significant in the profitability
EBITDA i d t PLN 348 i 2008 f PLN 166 i 2007EBITDA increased to PLN 348m in 2008 from PLN 166m in 2007
EBITDA margin increased to 20.8% in 2008 and to 30.6% in 2008
EBITDA and EBITDA marging
348
40
300
400
166
30.6%
20
30
200
%)
(PLN
m)
20.8%
10
20
0
100
(25
2007 2008
EBITDA EBITDA margin

Net income more than doubled
Net income
30300
270
23.7%
20200
113
14.2%
20200
(%)
( PLN
m)
10100
00
2007 2008
Net income Net income marging
26

Safe debt level
As of 31 December 2008 our cash balance was higher than our debt balance by PLN 136m
In 2008 we repaid PLN 108m under our loan agreements
Entire debt denominated in the foreign currencies was repaid; debt under
Debt balance vs. cash balance
Entire debt denominated in the foreign currencies was repaid; debt under current loan agreement is only in PLN
246
300
221
200
(PLN
m)
111
151
100
31 December 2007 31 December 2008
Debt balance Cash balance27

Our cash balance increased by PLN 96 m (64%)
N h fl 2008Net cash flow – 2008
600
3167 77
108
400
500
14 3814
246300
400
( PLN
m)
150
100
200
0
Cash at the begining of the period
Cash flow from
operations
Settlement of IPO
expenses
Capex Debt repayment
Interest Dividend payout
Other Cash at the end of the
period
28

Currency risk and hedging arrangements
Following categories of costs are dependent on fluctuations of exchange rates:Approx. 44% of our programming costs is denominated in Euro and approx. 55% in USD100% of our signal transmission services costs is denominated in Euro
Fluctuations of exchange rates also influence our costs of satellite television receiving equipment :Approx. 20% of our costs of satellite television receiving equipment and telephones sold is denominated in Euro and approx. 60% in USD
Our costs of satellite television receiving equipment are based on historical exchange rates – PLN weakening will not be visible in the results of Q4 2008
Hedging arrangements
Forward transactions for the purchase of the USD 2 m monthly at the rate of PLN 2.3180/USD until S t b 2009September 2009Forward transactions for the purchase of Euro 1.5 m monthly at the rate of PLN 3.4590/Euro until March 2009
We hedge approximate 66% of our foreign currency denominated costs in USD until September 2009We hedge approximate 66% of our foreign currency denominated costs in USD until September 2009 and approx. 55 % of our foreign currency denominated costs in Euro until March 2009
Our Q4 2008 operating costs increased by PLN 12 m as a result of PLN weakening in Q4 2008 (includingforward transactions)
29
forward transactions)
In 2008 we recognized the gain on realized forwards and gain on the revaluation of unrealized forwards of PLN 18 m.

Outlook for 2009
30

Outlook for 2009
Sale in January 2009 higher than in the corresponding period 2008
An increased in proportion of the leased receiving equipment will have positive impact on EBITDA
New promotional offers – starting from February 2009 – offering 1, 3 and 6 months without subscription payments
We consider introduction of new packages (DTH)
We limit our costs on the MVNO project – sale of MVNO services only to our newWe limit our costs on the MVNO project – sale of MVNO services only to our new and existing DTH subscribers
As a result of the change in the MVNO strategy the number of MVNO subscribersAs a result of the change in the MVNO strategy the number of MVNO subscribers will grow slower than initially anticipated
Change of the mobile termination rates – 21.6 gr/min until 30 June 2009,
31
Change of the mobile termination rates 21.6 gr/min until 30 June 2009, 16.8 gr/min starting from 1 July 2009

Additional informationAppendix
32

Milestones in our history
1996 1999 2003 2004 2005 2006 20082000 20071996
Joint stock company established under the business name of Market S.A.
1999 2003 2004 2005 20062000
1996
2007
Started to broadcast satellite signal in December 19991999
Full commercial launch; entered into co-operation agreement with Telewizja Polsat S.A. acting as commission-based distributor for its digital platform2000
Granted licence for wireless satellite network broadcasting services to become a fully independent operator of the digital platform; acquired DTH operations from Telewizja Polsat S.A. and other related businesses
2003
Changed name to Cyfrowy Polsat S A2004 Changed name to Cyfrowy Polsat S.A.2004
Merged with Polsat Sp. z o.o., lessor of distributed STBs2005
Acquired HQ building; became largest DTH satellite broadcasting operator in Poland by subscribers2006
Launched production of own STBs in November 20072007
33
Successfully completed IPO in May 20082008

Corporate governance
Supervisory Board
Zygmunt Solorz-ŻakChairman
Robert GwiazdowskiMember
Andrzej PapisMember
Leszek ReksaMember
Heronim RutaMember
Management Board
Dominik LibickiChief Executive Officer and the President of the Management Board
Maciej GruberChief Financial Officer
Andrzej MatuszyńskiChief Marketing Officer
Dariusz DziałkowskiChief Technology Officer
34

Shareholder structure
Sharehoder Number of shares
% of shares
Number of votes
% of votes
1 Polaris Finance B.V. 162.943.750 60,73% 317.968.750 69,76%
2 Zygmunt Solorz-Zak 30.603.750 11,41% 61.207.500 13,43%
3 Others 74.777.500 27,86% 76.648.750 16,81%
T t l 268 325 000 100 00% 455 825 000 100 00%Total 268.325.000 100,00% 455.825.000 100,00%
% of shares
17%
% of votes
61%11%
28%
70%
13%
Polaris Finance BV Zygmunt Solorz-Zak Others Polaris Finance BV Zygmunt Solorz-Zak Others
Notes:1 85% of shares belongs to Mr Zygmunt Solorz-Żak and 15% of shares belongs to Mr Heronim Ruta2 13.43% of shares belongs to Mr Zygmunt Solorz-Żak , 0.70 % of shares belongs to Mr Heronim Ruta and 0.24% shares belongs to the
members of the Management Board35

Our DTH satellite distribution network
6
5
1 3
4
7
KEY:
= Cyfrowy Polsat’s 1,296 PoS
= Cyfrowy Polsat’s 27 wholesale distributors
Warsaw
2
1 5 Gdańsk
8
Kraków
Poznan
Łódź
2
3
4
Gdańsk
Szczecin
Wroclaw
Katowice
6
7
8
36
Specialised DTH network


![CHAPTER 13 WET DIGESTION METHODS - Strona Głó · PDF fileCHAPTER 13 WET DIGESTION METHODS ... material pertinent to either organic [15-18] or ... Glassy carbon graphite](https://static.fdocuments.us/doc/165x107/5a9e111e7f8b9a29228d2334/chapter-13-wet-digestion-methods-strona-gl-chapter-13-wet-digestion-methods.jpg)