CVS vs. t2-x2 velocity analysis - IOSR Journals · Land 3D: t2-x2 Velocity Estimation. Figure 4....
6
IOSR Journal of Applied Geology and Geophysics (IOSR-JAGG) e-ISSN: 2321–0990, p-ISSN: 2321–0982.Volume 3, Issue 6 Ver. I (Nov. - Dec. 2015), PP 18-23 www.iosrjournals.org DOI: 10.9790/0990-03611823 www.iosrjournals.org 18 | Page CVS vs. t 2 -x 2 velocity analysis Anil Kumar Semwal 1 , Naresh Agarwal 2 1 (Processing/ Pan India Consultants, Pvt. Ltd., India) 2 (Processing/ Pan India Consultants, Pvt. Ltd., India) Abstract: Velocity analysis is one of the prime aspects of seismic data processing. Velocity analysis is an iterative process and one keeps on improving subsurface velocity field at different stages of processing. These analyses require an initial velocity field, but in a virgin area, it is required, to estimate this, from the seismic data itself by employing CVS (Constant Velocity Stack) or t 2 -x 2 methods. In the present context, we demonstrate using field data, that t 2 -x 2 method based velocities are more reliable than CVS based velocities for the subsequent velocity analysis purposes. Keywords:– Gather, mute, spectrum, stack, Velocity analysis. I. Introduction A good estimate of initial velocity model has always been a forte for the subsequent velocity analysis otherwise semblance peaks in a velocity spectrum establish themselves away from the true real earth scenario, which in turn forces user to pick velocities either out of the main spectrum or succumb to wrong ones. The t 2 -x 2 velocity analysis is a reliable way to estimate stacking velocities. The accuracy of the method depends on the signal-to-noise ratio, which affects the quality of picking (Yilmaz, 2001). Stacking velocities are picked directly from the constant velocity stack (CVS) panel by choosing the velocity that yields the best stack response at a selected event time (Yilmaz, 2001). In this analysis, we have employed both methods to derive the respective initial velocity models and furnish the subsequent velocity analysis and stack output with incisive remarks. II. Method In this study, we have used land 3D and land 2D seismic data sets of onshore Cambay basin, India. First of all, for both the data sets, geometry and navigation information is updated in trace headers, field statics is incorporated, a band pass filter (3-8-70-83 Hz) & time gain function is tested and applied and first break mute is designed and applied. 2.1 CVS velocity estimation Next, CVS have been computed using a range of velocity from 1800 m/s to 4500 m/s on seismic gathers. In this, gathers are dynamically corrected using the constant velocity chosen over the velocity range supplied and stacked then after. The most important reason to obtain a reliable velocity function is to get the best quality stack of signal. Therefore, stacking velocities often are estimated from data stacked with a range of constant velocities on the basis of stacked event amplitude and continuity (Yilmaz, 2001). The best stacking velocity at a particular time corresponds to the best stack at that instance. A group of 20 CDP gathers 700-719 for land 3D and 1000-1019 for land 2D are chosen for analysis. CVS panels for land 3D and land 2D datasets are shown in Fig. 1 and Fig. 2 respectively. CDP range and trial velocities used are depicted in the abscissa of these figures.
Transcript of CVS vs. t2-x2 velocity analysis - IOSR Journals · Land 3D: t2-x2 Velocity Estimation. Figure 4....

IOSR Journal of Applied Geology and Geophysics (IOSR-JAGG) e-ISSN: 2321–0990, p-ISSN: 2321–0982.Volume 3, Issue 6 Ver. I (Nov. - Dec. 2015), PP 18-23 www.iosrjournals.org
DOI: 10.9790/0990-03611823 www.iosrjournals.org 18 | Page
CVS vs. t2-x
2 velocity analysis
Anil Kumar Semwal1, Naresh Agarwal
2
1(Processing/ Pan India Consultants, Pvt. Ltd., India)
2(Processing/ Pan India Consultants, Pvt. Ltd., India)
Abstract: Velocity analysis is one of the prime aspects of seismic data processing. Velocity analysis is an
iterative process and one keeps on improving subsurface velocity field at different stages of processing. These analyses require an initial velocity field, but in a virgin area, it is required, to estimate this, from the seismic data itself by employing CVS (Constant Velocity Stack) or t
2-x
2 methods. In the present context, we demonstrate
using field data, that t2-x
2 method based velocities are more reliable than CVS based velocities for the
subsequent velocity analysis purposes.
Keywords:– Gather, mute, spectrum, stack, Velocity analysis.
I. Introduction A good estimate of initial velocity model has always been a forte for the subsequent velocity analysis
otherwise semblance peaks in a velocity spectrum establish themselves away from the true real earth scenario, which in turn forces user to pick velocities either out of the main spectrum or succumb to wrong ones.
The t2-x
2 velocity analysis is a reliable way to estimate stacking velocities. The accuracy of the method
depends on the signal-to-noise ratio, which affects the quality of picking (Yilmaz, 2001). Stacking velocities are picked directly from the constant velocity stack (CVS) panel by choosing the
velocity that yields the best stack response at a selected event time (Yilmaz, 2001). In this analysis, we have employed both methods to derive the respective initial velocity models and furnish the subsequent velocity analysis and stack output with incisive remarks.
II. Method In this study, we have used land 3D and land 2D seismic data sets of onshore Cambay basin, India.
First of all, for both the data sets, geometry and navigation information is updated in trace headers, field statics is incorporated, a band pass filter (3-8-70-83 Hz) & time gain function is tested and applied and first break mute is designed and applied.
2.1 CVS velocity estimation Next, CVS have been computed using a range of velocity from 1800 m/s to 4500 m/s on seismic
gathers. In this, gathers are dynamically corrected using the constant velocity chosen over the velocity range supplied and stacked then after. The most important reason to obtain a reliable velocity function is to get the best quality stack of signal. Therefore, stacking velocities often are estimated from data stacked with a range of constant velocities on the basis of stacked event amplitude and continuity (Yilmaz, 2001). The best stacking velocity at a particular time corresponds to the best stack at that instance.
A group of 20 CDP gathers 700-719 for land 3D and 1000-1019 for land 2D are chosen for analysis. CVS panels for land 3D and land 2D datasets are shown in Fig. 1 and Fig. 2 respectively. CDP range and trial velocities used are depicted in the abscissa of these figures.

CVS vs. t2-x
2 velocity analysis
DOI: 10.9790/0990-03611823 www.iosrjournals.org 19 | Page
Figure 1. Land 3D: CVS Velocity Estimation
Events are picked on the basis of amplitude sharpness and better continuity over the rest. Time-
Velocity pairs for best stacked events have also been shown in boxes.
Figure 2. Land 2D: CVS Velocity Estimation
2.2 t2-x
2 velocity estimation Further, t
2-x
2 velocities are estimated by picking six different hyperbolic events (event1 to event6) on
the same gathers (gather number 700 in land 3D case and gather number 1000 in land 2D case), which are used in CVS approach. Time (t) and source to receiver offset (x) along the hyperbolic trajectory of a particular picked event are plotted on a t
2 vs. x
2 graph. The inverse of the slope of the best fit line to these t
2 vs. x
2 scatters is an
estimate of v2. Six such Time-Velocity pairs have been estimated, where time is the zero offset time for a
particular event. These events and corresponding estimations for land 3D and land 2D are depicted in Fig. 3 and Fig. 4 respectively.

CVS vs. t2-x
2 velocity analysis
DOI: 10.9790/0990-03611823 www.iosrjournals.org 20 | Page
Figure 3. Land 3D: t
2-x
2 Velocity Estimation.
Figure 4. Land 2D: t
2-x
2 Velocity Estimation
2.3 Velocity analysis
Using Time-Velocity pairs as reference velocity functions estimated from CVS and t2-x
2 approaches,
interactive velocity analysis is carried out at every 50th
CDP (corresponding to an interval of 1 km). Velocity picking is shown for a representative CDP gather of an inline for land 3D case in Fig. 5. It consists of two frames, where left frame is based on CVS approach and right one is based on t
2-x
2 approach. These are
composite frames and each shows velocity spectrum and NMO corrected gather in two panels. Picked velocities in the velocity spectrum are shown in blue circles with black connecting lines and mute function is shown in green in NMO corrected gather panel for CVS and t
2-x
2 approaches respectively (Fig. 5). It is aimed to flatten
CVS vs. t2-x
2 velocity analysis
DOI: 10.9790/0990-03611823 www.iosrjournals.org 21 | Page
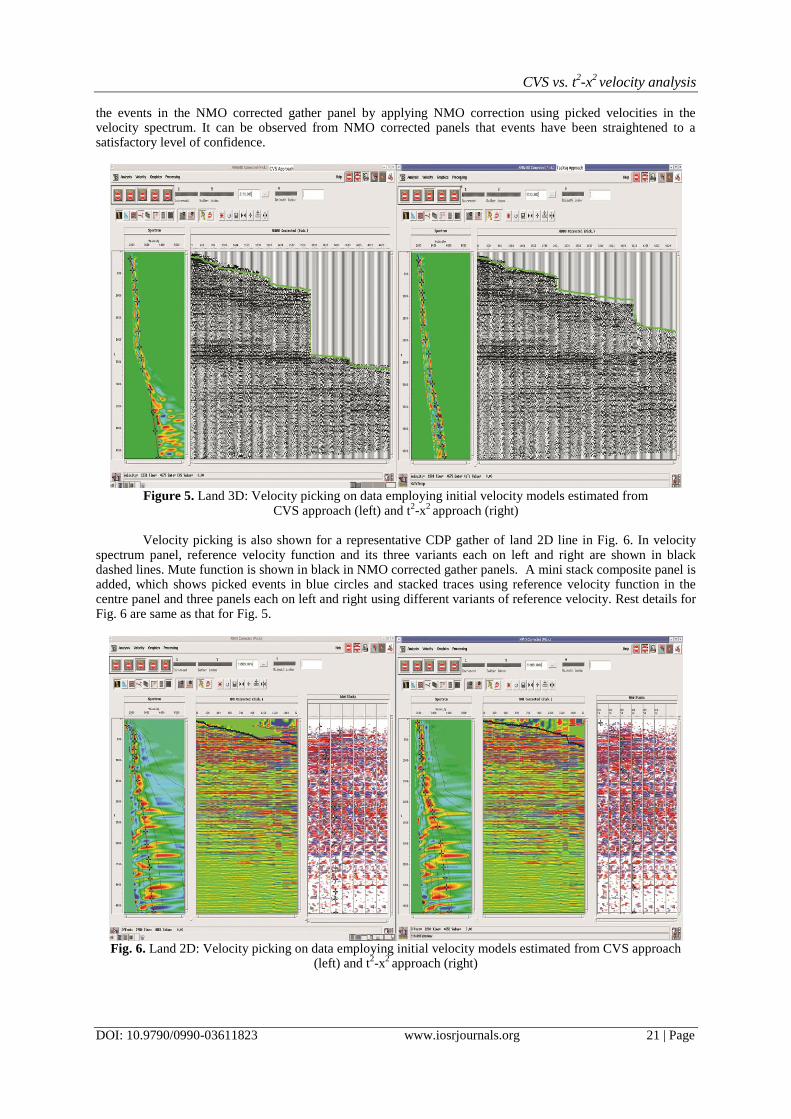
the events in the NMO corrected gather panel by applying NMO correction using picked velocities in the velocity spectrum. It can be observed from NMO corrected panels that events have been straightened to a satisfactory level of confidence.
Figure 5. Land 3D: Velocity picking on data employing initial velocity models estimated from
CVS approach (left) and t2-x
2 approach (right)
Velocity picking is also shown for a representative CDP gather of land 2D line in Fig. 6. In velocity
spectrum panel, reference velocity function and its three variants each on left and right are shown in black dashed lines. Mute function is shown in black in NMO corrected gather panels. A mini stack composite panel is added, which shows picked events in blue circles and stacked traces using reference velocity function in the centre panel and three panels each on left and right using different variants of reference velocity. Rest details for Fig. 6 are same as that for Fig. 5.
Fig. 6. Land 2D: Velocity picking on data employing initial velocity models estimated from CVS approach
(left) and t2-x
2 approach (right)

CVS vs. t2-x
2 velocity analysis
DOI: 10.9790/0990-03611823 www.iosrjournals.org 22 | Page
III. Results And Discussion Velocity picking is primarily aimed to straighten the hyperbola by incorporating NMO correction at an
instance of time on all offsets spanned by the seismic event. As a result of the NMO correction, a frequency distortion occurs, particularly for shallow events and at large offsets. This is called NMO stretching. This problem can be circumvented by muting the stretched zones in the gather (Yilmaz, 2001).
Moreover, picking away from the velocity spectrum to straighten hyperbolic events indicates reference velocity function is unsuitable to the data. Secondly, harsh muting of data offers a narrow band of traces to be flattened and delimits the far offsets to come into the process of genuine velocity picking.
3.1 Land 3D In the velocity spectrum panel of CVS frame, it is evident that picking is enforced to be done away
from the main spectrum below 3500 ms to straighten the events, while, picking in t2-x
2 frame is well within the
velocity spectrum over whole record length despite farthest offsets having been contained (Fig. 5). This triggers a lower level of confidence during picking in case of CVS based analysis than that of t
2-x
2 based analysis.
Automatic data mute which allows waveform stretching up to 100% is designed and is used for both the approaches. It can be seen that muting is encountered spatially early (i.e. harsher) for offsets in CVS frame than that in t
2-x
2 frame which in turn delimits the far offset traces to be straightened and stack quality thereof.
As a final product, a brute stack using CVS and t2-x
2 picked velocities is generated and shown for a
representative inline. Left panel is a stack based on CVS approach while right one is based on t2-x
2 method. The
stack illustrates that continuity of events is better in shallow horizons in case of t2-x
2 approach than that of CVS.
Also, t2-x
2 based amplitude spectrum is riding slightly high on CVS based spectrum at all frequencies up to 80
Hz (Fig. 7).
Figure 7. Land 3D: Brute Stack using CVS (left) and t
2-x
2 (middle) based velocities and respective spectra
(right) 3.2 Land 2D
Although, picking in CVS & t2-x
2 frames is well within the spectrum extensions, yet picking on t
2-x
2
frame is following the central reference velocity function for most of the times as seen in spectrum and mini stacks panel of Fig. 6. This suggests that t
2-x
2 velocity based spectrum ensures more confidence during picking
than that of CVS approach based. In this land 2D case maximum offset is 2310 m., so relative muting difference is not so well developed but muting is subtly harsher in CVS approach based NMO corrected gather. Finally, a stack using CVS and t
2-x
2 picked velocities is generated and illustrated in left and right panels respectively (Fig.
8). The event continuity in stack and the spectrum strength at all frequency components is higher in case of t2-x
2
approach than that of CVS (Fig. 8).

CVS vs. t2-x
2 velocity analysis
DOI: 10.9790/0990-03611823 www.iosrjournals.org 23 | Page
Figure 8. Land 2D: Brute Stack using CVS (left) and t
2-x
2 (middle) based velocities and respective spectra
(right)
The relatively better continuity and boosted frequency components in 3D and 2D case, is a repercussion of in phase constructive interference and stacking then after, which is governed by the velocity being applied.
IV. Conclusion
Based on velocity analysis, mute function, level of confidence during velocity picking and overall stack and spectrum quality of the output, it is inferred that t
2-x
2 based approach is more reliable than CVS approach
for building a reference velocity function for the subsequent velocity analysis. The t2-x
2 based estimation
consists in following and picking the hyperbolic events while CVS based estimation seeks for guessing the trial velocities and spacing in between them. This basic difference in these two approaches offers more confidence on t
2-x
2 method than that of CVS method.
Acknowledgments We thank the management of Pan India Consultants, Pvt. Ltd. to facilitate and inspire us during this work.
References [1]. Yilmaz Ozdogan, Seismic Data Analysis, (SEG, 2011) 283-284, 289-290.