Customer Efficiency, Channel Usage and Firm Performance …web.mit.edu/sis07/www/xue.pdf ·...
48
1 Customer Efficiency, Channel Usage and Firm Performance in Retail Banking Mei Xue Operations and Strategic Management Department The Wallace E. Carroll School of Management Boston College 350 Fulton Hall, 140 Commonwealth Avenue Chestnut Hill, MA 02467 Phone: (617)552 -6821 ⋅ Fax: (617)552-0433 [email protected] Lorin M. Hitt Operations and Information Management Department The Wharton School University of Pennsylvania 571 John Huntsman Hall Philadelphia, PA 19104 Tel: 215-898-7730 ⋅ Fax: 215-898-3664 [email protected] Patrick T. Harker Operations and Information Management Department The Wharton School University of Pennsylvania 1000 SHDH, 3620 Locust Walk Philadelphia, PA 19104-6364 Phone: (215) 898-4715 ⋅ Fax: (215) 573-5001 [email protected] Forthcoming in Manufacturing & Service Operations Management (http://msom.pubs.informs.org/)
-
Upload
trinhtuong -
Category
Documents
-
view
217 -
download
0
Transcript of Customer Efficiency, Channel Usage and Firm Performance …web.mit.edu/sis07/www/xue.pdf ·...
1
Customer Efficiency, Channel Usage and Firm Performance in Retail Banking
Mei Xue Operations and Strategic Management Department
The Wallace E. Carroll School of Management Boston College
350 Fulton Hall, 140 Commonwealth Avenue Chestnut Hill, MA 02467
Phone: (617)552 -6821 ⋅ Fax: (617)552-0433 [email protected]
Lorin M. Hitt
Operations and Information Management Department The Wharton School
University of Pennsylvania 571 John Huntsman Hall Philadelphia, PA 19104
Tel: 215-898-7730 ⋅ Fax: 215-898-3664 [email protected]
Patrick T. Harker
Operations and Information Management Department The Wharton School
University of Pennsylvania 1000 SHDH, 3620 Locust Walk Philadelphia, PA 19104-6364
Phone: (215) 898-4715 ⋅ Fax: (215) 573-5001 [email protected]
Forthcoming in Manufacturing & Service Operations Management
(http://msom.pubs.informs.org/)

2
Customer Efficiency, Channel Usage and Firm Performance in Retail Banking
Innovations in technology and service design have increasingly enabled firms to incorporate self-
service technology to augment or substitute for “traditional” employee-provided service channels.
Although it is clear that self-service can reduce cost, less is known about how customers utilize
self-service channels in a multi-channel service delivery system and the resulting impact on firm
performance. An important aspect of service operations is that customers are co-producers of the
service. Thus, the performance of the delivery system and customers’ use of service channels can
be affected by customers’ own efficiency or productivity in service co-production (customer
efficiency). In this paper we utilize prior theoretical frameworks in service operations and
economics to hypothesize relationships among customer characteristics (especially co-production
efficiency), channel utilization, and firm performance. We then test these hypotheses using
panel data from a large retail bank. Overall, we find that higher customer efficiency in self-
service channels is associated with greater profitability and has a complex relationship with
customer retention and product utilization.
Key words: service operations management, service delivery system, self-service technology
(SST), service co-production, customer efficiency.
1. Introduction
Customer participation has always been an indispensable part of any service delivery process
(Chase, 1978, Lovelock and Young, 1979, Karmarkar and Pitbladdo, 1995). In many processes,
the labor of the customers and the employees of the firm are, to some extent, substitutable.
Although self-service has long been an alternative to full service by employees in many
industries (e.g., gas stations), the development of new information technologies and innovations
in product design have led to an unprecedented increase in the scale and scope of self-service
utilization. Around the world, millions of consumers use the Internet for shopping, managing
bank accounts, trading stocks, booking flights, buying movie tickets, tracking packages, and
selling everything from a silver spoon to a used car. The profound impact of this proliferation of
self-service is evident in almost all major service industries.

3
In this wave of the so-called “self-service revolution,” a multi-channel service delivery system
that combines a portfolio of employee and self-service channels in both physical and virtual
environments has become the dominant model, replacing systems that rely primarily on
employee service delivered in physical channels. Figure 1 shows such a multi-channel service
delivery system in retail banking. Similar systems can also be found in the transportation and
retail sectors. The popularity of self-service is a result of decades of service delivery innovation
in pursuit of lower costs and higher quality, fueled by the advancement of technology, especially
information technology. In some industries, especially in the Western world, the provision of
such a multi-channel service delivery system has become a competitive necessity (The Banker,
2003). Moreover, service delivery systems can have a significant effect on firms’ operations
strategy such as capacity management (Roth and Menor 2003, Ellram et al. 2004), as well as on
the operational performance of other business processes that directly interact with the customer,
such as sales and marketing.
The appeal of adding customer self-service to the overall service delivery mix is straightforward.
By offloading tasks onto customers and enabling them to pursue their own service needs, firms
can often provide customized services at mass production cost levels. In addition, many of the
technologies underlying self-service, such as Internet-based ordering or customer support, also
enjoy significant economies of scale while providing greater access, flexibility and convenience.

4
Figure 1: The Multi-Channel Service Delivery System in Retail Banking
In a world in which a significant number of customers obtain their service from multiple service
channels, the design and management of such a system requires understanding of how customers
decide which channels to utilize and how these choices affect both the optimal design of service
delivery systems as well as related business processes. For instance, the widespread adoption of
Internet banking has required changes of traditional banks in the service capacity and skill
requirements of call center representatives (e.g., to provide computer technical support), the
design of different types of banking products to compete against the online-only banks, the
approaches used to cross-sell or up-sell incremental banking products, the distribution of
physical service channels such as ATMs and branches, and the mitigation of potential new risks
such as online identity theft. These interdependencies have caused firms to recognize that
without an integrated perspective on channel utilization, firms may miss opportunities for better
resource allocation, improved operational performance, and stronger customer relationships.
Management of the performance of self-service channels presents an unusual problem in that the
performance of the service system is affected by the actions of the customers with uncertain
capabilities, incentives and goals. Thus, customers’ own actions and cognitive abilities can have
Retail Bank Service Delivery Channel System
Physical Channel Virtual Channel
Self-service Channel Employee Service channel
Self-service Channel Employee Service Channel
Automatic Teller Machine (ATM)
Branch/Teller Internet
Voice Response Unit (VRU)
Call Center
Automatic Clearance House (ACH)
Branch/Platform Sales Representative

5
a greater impact on service quality in self-service channels than in employee service channels.
Moreover, because customers are generally free to choose the channels in which they obtain their
service, perhaps shaped by incentives from the service provider, uncertainty in overall customer
use of a channel can be further compounded by uncertainty in customer behavior (Davis 1993,
Ellram et al. 2004). Some institutions have experimented with denying a subset of customers
access to certain channels, such as access to bank branches or other high cost services. Often,
however, these innovations were either misunderstood or rejected by consumers. In some
industries, such as airlines and retail brokerage, explicit price incentives for channel use have
been implemented (e.g., a booking fee for use of a human ticket agent), although uncertainty
about customer reaction to explicit pricing for different channels has limited the diffusion of
these types of practices. Despite these difficulties, many financial institutions are continuing to
experiment with a variety of methods to encourage customers to utilize the “right” channel for
their service needs.
The focus of this study is to provide an empirical analysis of the determinants of self-service use,
and how customers' channel choices are associated with firm performance. Utilizing insights
from prior models of service operations (Huete and Roth 1988, Roth 2001, Boyer et al. 2002,
Heskett et al., 1997), we hypothesize that customers choose among channels to perform these
transactions based on the relative costs and benefits they receive from each choice. Because self-
service involves an aspect of co-production, these costs are directly influenced by customer
capabilities in self-service channels (or “customer efficiency” as in Xue and Harker (2002)) in
addition to other customer and channel characteristics. While this theoretical structure is
straightforward, it is unclear which factors, both absolutely and relatively, are important in
determining service demand. Therefore, our first of two major research questions is: “What
drives a customer’s use of different channels in a multi-channel service delivery system?”
Second, although customers make their channel choice decisions based on their own costs and
benefits of using different channels, their decisions may not necessarily maximize the profits of
the service provider. Given that most organizations have made only limited efforts to influence
customer channel choice and that customers are heterogeneous, we have the opportunity to
observe the effects on the firm of a wide array of individual channel choices. The aggregate

6
results of these individual customer behaviors affect critical dimensions of firm performance
such as customer profitability, customer retention and product adoption. This leads us to our
second major research question, “How does customers’ channel use influence firm
performance?”
A key empirical challenge of this work is to measure customer efficiency. Xue and Harker
(2002) developed a customer efficiency measurement framework that utilizes direct measures of
customer inputs (e.g. time, effort) and output. However, this approach cannot be directly applied
when customer inputs are hard to measure (especially if some costs are intangible) or when firms
seek to measure efficiency using archival data that did not include direct measures of customer
costs (e.g., data in transaction processing systems). In this paper, we present an alternative
approach in which we infer customer efficiency by revealed channel choice. After accounting for
non-customer factors such as channel availability (e.g., location) and factors unrelated to service
co-production efficiency (e.g., transaction requirements), customers who concentrate their
activity in self-service channels when a full-service alternative is available for the same
transaction are inferred to be more efficient. We can partially validate this measure by
comparing it to factors such as education and experience, which should be associated with
efficiency in our empirical setting, and we also incorporate this measure into models that predict
performance.
We test our hypotheses using a panel dataset of monthly transaction data for approximately
25,000 customers of a large retail bank from July 2002 to June 2003. Our data include detailed
observations on transaction activity, customer demographic information, and customer
profitability, loyalty and product adoption measures. Overall, our results suggest that there is
considerable variation in revealed customer efficiency and that customers with higher measured
efficiency tend to be younger, have more education, and be more experienced with computers
and banking services in general, which is consistent with our prior expectations. We also find
that other factors, unrelated to customer efficiency, also affect channel choice, which suggests
that our measure of customer efficiency is related to but distinct from a customer’s overall use of
self-service itself. Second, customers who appear to be more efficient have greater profitability.
and utilize more bank services and have a lower chance to leave the bank, although the effects of

7
customer efficiency on product adoption and retention seem to have diminishing returns. Overall,
this suggests that our concept of customer efficiency is relevant for understanding customer
channel choice as well as customer profitability and, therefore, has the potential to be
productively used in practice for understanding customer channel choices and incorporating
these choices into the design of service delivery systems.
2. Literature Review
2.1 Self-Service and Service Operations
The role of the customer as a “co-producer” in service operations has a long history in service
operations management. Fuchs (1968) notes that customers are always either passively or
actively involved in the service production process. Subsequent research on service operations
management recognized the interaction between the customer and firm (Chase 1978) and the
importance of integrating the production role of customers into the design of service delivery
systems (Globerson and Maggard 1991). Prior research has also noted that the design of these
self-service delivery systems can have significant competitive implications (Karmarkar and
Pitbladdo 1995, Heskett et al. 1997).
With customers as co-producers, it is increasingly important to understand and manage
customers’ service choices and their performance in service production activities. Lovelock and
Young (1979) utilize case analysis to demonstrate that developing service systems that account
for customer needs and preferences is essential to realizing productivity gains from self-service
operations. Subsequent work identified the factors which drive customers’ decisions to use self-
service channels, namely time, control, effort, dependence, efficiency, and human contact
(Bateson 1985). Other research has suggested parallels between managing customers and
managing employees, using insights from human resource management (Bowen 1986, Kelley et
al. 1990). Combining insights from the prior literature on service co-production with approaches
from efficiency analysis, Xue and Harker (2002) propose the concept of “customer efficiency” to
capture the notion that customers may vary in their ability to effectively participate in self-
service, which in turn affects both customer outcomes (e.g., satisfaction, perceived cost) as well
as firm profitability.
8
Self-service systems are more than just a standalone feature of the organization. The literature
has increasingly focused on the observation that self-service systems need to be integrated with
other aspects of organizational design. As Roth and Menor (2003: 151) observe: “Central to
service delivery system design is explicit consideration of the nature of customer contacts (e.g.,
face–to-face, electronically mediated, and back-office support interactions).” Whereas these
issues have long been part of customer contact theory (Chase 1978, 1981, Kellogg and Chase,
1995, Soteriou and Chase 1998), new types of self-service channels introduced new
considerations into these approaches. For instance, recent work considered how electronically
mediated (or “virtual”) service activities interact with traditional face-to-face service approaches
(Froehle and Roth 2004) and how these new service options affect strategies for market
positioning and customer relationship management (Voss 2000).
In this literature stream, our work is most closely related to the Service Strategy Design Matrix
(Huete and Roth 1988), the Product-Process-Proximity ( 3p ) Matrix for Services (Boyer,
Hallowell, and Roth 2002), the E-service Customer Retention Model (Roth 2001), the Service
Profit Chain model (Heskett et al. 1997), and the Customer Efficiency Management (CEM)
framework (Xue and Harker 2002). Our model extends the Service Strategy Design Matrix and
the 3p model framework by modeling customer choice of delivery channel in a multi-channel
system, while the 3p model focuses on firm choice of delivery channel by addressing the
tradeoffs between industrialization level (technical mediation level at the customer touch point)
and customization. Our model also extends the E-service customer retention model (Roth 2001)
by extending the setting from a single channel (Internet) to a multi-channel service delivery
system with both physical and virtual employee service and self-service channels.
Xue and Harker (2002) propose the “customer efficiency” concept to study the role and impact
of a customer as a co-producer in service co-production. An “efficient customer” is one who
consumes less resource to produce more or the same amount of output in her participation in the
service co-production process. In essence, the concept of customer efficiency parallels the
classical concept of employee productivity. However, the “dual roles” of a customer (both as co-
producer and as consumer) imply an important distinction between a firm view of efficiency (the
firm's benefits versus firm costs for facilitating and supporting the customer’s co-production

9
activity) versus a customer view of efficiency (the customer's value versus direct costs and
opportunity costs faced by the customer for conducting the co-production activity). Xue and
Harker (2002) also note that coordinating service design with other complementary firm
decisions (e.g., marketing and product or service design) to build an efficient customer base can
have significant impact on operational performance, a process they refer to as customer
efficiency management (CEM).
2.2 Online Service in Financial Services
Prior work has also explicitly examined the role of the Internet as a distribution channel in the
financial services industry. Apte and Vepsalainen (1993) examined the tradeoff between using
“high tech” versus “high touch” channels and argued that the former is effective for cost
reduction and the latter is more effective for relationship building. Roth and Jackson III (1995)
found a negative correlation between total factor productivity and service quality, which
underscores the importance of cost-benefit tradeoffs in service design. Menor et al. (2001)
showed that operations agility, which is defined as the ability to excel simultaneously on
operations capabilities of quality, delivery, flexibility and cost, is as vital for retail banks’
performance as it is for manufacturing firms. Hitt and Frei (2002) examined customer behavior
using in retail banks and found that customers who utilize online banking used more products
and were more profitable, but that these differences existed prior to the adoption of online
banking. However, this study did not consider channel usage. Chen and Hitt (2002) showed that
customer retention in the online brokerage industry can be influenced by the design of self-
service systems and other product design choices. Choi et al. (2005) presented a modeling
framework for service delivery in retail banking, examining how two alternative service delivery
processes (conventional and electronic) affect customer costs, process economics, market
segmentation, and competition.
2.3 Customer Efficiency and Firm Performance
Prior literature suggests a positive link between customer efficiency and firm performance such
as profitability and loyalty for two major reasons. First, the lower cost of operating self-service
channels than employee service channels offers the opportunity of significant cost savings

10
(Chase 1978, 1981, Lovelock and Young 1979, Heskett et al., 1997, Bitner et al. 1997). Second,
a more efficient customer gains greater value from self-service (Xue and Harker 2002), which, in
turn, encourages greater product adoption and a longer relationship length (Roth 2001, Xue and
Harker 2002).
However, while efficient customers may realize greater value from their service interactions and
more extensively utilize low-cost channels, they may also engage in other behaviors that can
negatively impact their loyalty and profitability. Since efficient customers are expected to utilize
self-service channels more than employee service channels, the reduced personal contact may
undermine the bond between the customer and the service provider and thus reduce customer
loyalty (Selnes and Hansen 2001). Also, while self-service channels may present a new sales
opportunity, it may come at the expense of reduced contact in employee service channels where
sales efforts can be more effective, yielding a “sales penalty” of self-service (Heute and Roth
1988). Efficient customers, with their deeper knowledge of the firm's products, may also be
better at optimizing their benefits at the expense of the firm by choosing loss-leader products.
Examples of this behavior in retail banking might include minimizing the amount of idle deposits
by keeping money only in interest-bearing accounts, or transferring high-cost loans (e.g., credit
cards) into credit vehicles with lower interest rates and margins (e.g., home equity lines of credit).
Thus, while it is plausible that high efficiency is also associated with higher firm performance,
the relationship between customer efficiency and customer profitability is an empirical question.
3. Model
3.1. Measuring Customer Efficiency Using Channel Choice
When direct measurement of customer inputs and output are possible, customer efficiency can be
calculated directly (Xue and Harker 2002). However, when these data cannot be utilized (either
because all inputs and outputs are not measurable or not available in archival data), customer
efficiency can be inferred from actual customer behavior. Presumably “efficient” customers will
conduct more transactions in self-service channels controlling for other factors that affect self-
service choice because of their relatively lower direct labor and opportunity costs. We utilize
this insight to develop a simple model that relates channel choice to customer efficiency with

11
special attention to measuring variation in efficiency across customers. The model is motivated
by our retail banking setting but appears to be consistent with the structure of other multi-
channel service systems where consumers have discretion over which channels to use for their
transactions.
Consider a customer that can use a multi-channel service delivery system consisting of C
different channels, indexed by c, c ∈ C = {1, 2, …, C} to conduct J possible service or
transaction types, indexed j, j∈ J={1, …, J}. A customer’s cost of labor is w (e.g., time
opportunity cost) per unit of input customer labor (Lcj), and the value of the service is v per unit
of output (Ocj). Service value is independent of the channel through which the service is
acquired but differs by service or transaction type (e.g., deposit, withdrawal, inquiry, account
transfer). Thus, a customer’s utility of using channel c to conduct cjO of type j transactions is:
, ,ccj j cj cju v O wL j J c C= − ∈ ∈ . (1)
Note cJ J⊆ is the subset of transaction types that can be conducted in channel c. The
parameters w and v are assumed exogenous but may vary by customer. Furthermore, assume the
total utility of banking services obtained by the customer is the sum of the utility for each
individual transaction in each channel. Thus, total utility U is given by:1 1 1
C C J
c cjc c j
U u u= = =
= =∑ ∑∑ .
Assuming that there are no production complementarities between activities of different
transaction types in different channels (2
' '
0 ' , 'cj
cj c j
Oc c j j
L L∂
= ∀ ≠ ≠∂ ∂
), each customer’s utility
maximization program reduces to a set of independent labor choices across channels for different
transaction types. Consequently, we now focus on characterizing the input choices for each
channel, allowing each channel to have a different value, production function, or set of input
quantities. Because the quantity of transactions of a given type are principally determined by
daily life events, we assume that total numbers of transactions are exogenous, although the
customer is free to allocate her transactions across channels (thus, , ,ccjO j J c C∈ ∈ are choices
subject to the constraint ,j cjc C
O O j J∈
= ∈∑ where the jO are exogenous).

12
In general, transaction services are produced by a combination of inputs from both consumers
and the firm. Let the production inputs for this channel and transaction type be customer-
invested capital (R), customer labor (L), firm-invested capital (K), and firm employee labor (H).
Assuming that the effects of customer inputs and firm inputs are in multiplicative form, this
yields an overall production function for transaction services of type j in channel c (or output cjO )
of the form:
( , ) ( , )cj c c cj c c cO g R L f K H= (2)
Let the customers’ portion of the production function take the Cobb-Douglas form, commonly
used in production economics: ( , ) ( )c cc c cj c c cjg R L R A Lα β= where ,c cα β are the output elasticities
of customer capital and customer labor, respectively, and cA is a customer-specific factor that
affects the customer’s productivity of labor when using channel c Note that this representation
differs slightly from the usual Cobb-Douglas form which places the productivity term as a
multiplier of both capital and labor 0O A R Lα β= . The two representations are equivalent
because 0A Aβ= . We utilize this non-standard representation to make it clear that our
hypothesized cause of variations in customer efficiency is due to variations in customer labor
input for a given output.. We represent the mean customer as having cA =1, with higher values
of cA representing more productive customers, and lower values of cA representing customers
who are less productive than the average. Note that the firm portion of the production function,
( , )c c cf K H is likely to be slow changing and does not vary across customers with equal physical
access (e.g., geographic location). Therefore, from the perspective of an individual customer,
this term is quasi-fixed. Similarly, since customers do not typically change the location of their
office or residence due to ATM or branch locations, or invest in a computer solely to utilize
online banking, we treat customer capital ( cR ) as quasi-fixed as well. In this formulation, a
customer then chooses an effort level for each channel (which determines the usage of each
channel) to solve:
1 1 1
max max max ( ) max( )c c c
c c c cj
J J J
c cj j cj cj j cj cjL L L Lj j j
U u v O wL v O wL= = =
= = − = −∑ ∑ ∑ , (3)
13
where 1 2( ,..., ,..., )cc c c cJL L L L= is the vector of customer labor input for cJ different types of
transaction using channel c. This problem yields a set of first order conditions in which the
marginal product of labor equals the wage rate (w): * ( | ).cjcj cj
cj j
O wL LL v
∂= =
∂
Substituting the form of the production function for O and differentiating with respect to labor
input yields the first order condition: 1( , )cj c c c
cj
Oc c c c c c cjL R A f K H Lα β ββ∂ −
∂ = , which implies an optimal
labor choice of 1
( , ) 1* [ ]c c
c c c c c c j cR A f K H v
cj wLα ββ β−= . Substituting this back into the original production
function yields: 11
1 1 1 1 1* [ ( , )]c c c
c c c c ccj c c c c c jO R A f K H v w
α β ββ β β β β− − − − −= . (4)
Because * *
1
cJ
c cjj
O O=
=∑ , we have
111 1 1 1 1*
1[ ( , )]
cc c c
c c c c c
J
c c c c c c jj
O R A f K H w vα β ββ β β β β− − − − −
=
= ∑ , (5)
or in logarithms:
1
1* 11 1 1 1
1log log ( , ) log log log log( )
c
c c c c
c c c c
J
c c c c c c jj
O f K H R A w vα β β ββ β β β
−− − − −
=
= + + + + ∑ , (6)
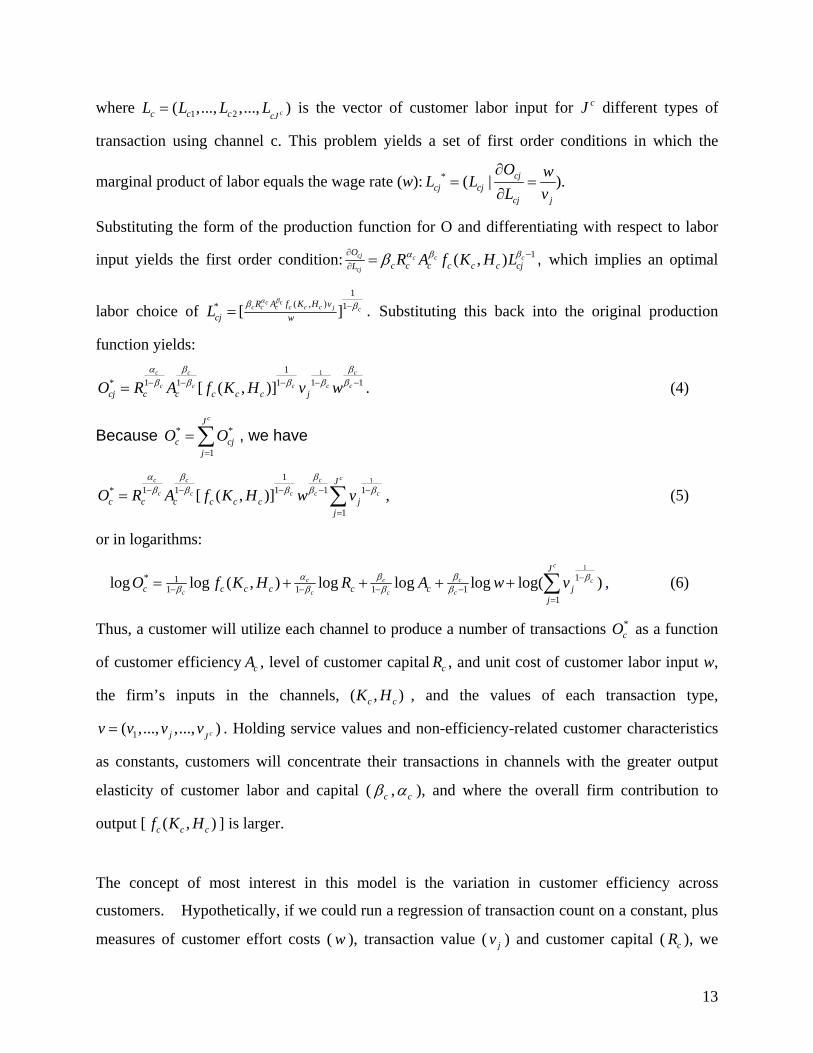
Thus, a customer will utilize each channel to produce a number of transactions *cO as a function
of customer efficiency cA , level of customer capital cR , and unit cost of customer labor input w,
the firm’s inputs in the channels, ( , )c cK H , and the values of each transaction type,
1( ,..., ,..., )cj Jv v v v= . Holding service values and non-efficiency-related customer characteristics
as constants, customers will concentrate their transactions in channels with the greater output
elasticity of customer labor and capital ( cβ , cα ), and where the overall firm contribution to
output [ ( , )c c cf K H ] is larger.
The concept of most interest in this model is the variation in customer efficiency across
customers. Hypothetically, if we could run a regression of transaction count on a constant, plus
measures of customer effort costs ( w ), transaction value ( jv ) and customer capital ( cR ), we

14
could retrieve the efficiency measures as the residual of that equation. This is the approach used
in the empirical production economics literature for the computation of multifactor productivity
(see e.g., Griliches 1994). Formally, consider an empirical model of the form:
1
1* 11 1 1
1log log ( , ) log log log( )
c
c c c
c c c
J
c c c c c j cj
O f K H R w vα β ββ β β ε−
− − −=
= + + + +∑ (7)
The residual term of Equation (7) cε then provides an estimate of the customer efficiency term
for each customer: 1 logc
cc cAββε −= or
1
[exp( )]c
cc cA
ββε−
= based on Equation (6).
There are three issues regarding the direct use of the residual cε as a customer efficiency
measure. First, this residual applies only to a specific channel. Greater precision can be
potentially gained in estimation by aggregating estimates of this measure from observations
across multiple channels, especially if there is some random variation in the residual due to
unrelated factors. Second, other unobservable customer-specific effects might affect customer
channel choice. Thus, the observed residual can include a term (s) which can be a customer-
specific fixed or random effect: '1 logc
cc cA sββε −= + . Third, the production function in Equation (2)
applies to both self-service and employee service channels due to the inherent co-production
nature of each service delivery process (Chase 1978), though the level and extent of a customer’s
participation can vary substantially. Our expectation and much of the prior literature suggests
that the amount of customer labor input in full-service channels is smaller than that in self-
service channels, for a given transaction type (see e.g., Xue and Harker 2002). This implies a low
elasticity of labor input ( 0β ≈ ) in full-service channels, and therefore minimal variation in
channel use due to the direct effect of efficiency ( 1Aβ ≈ ). However, the full-service channel use
may be helpful in estimating individual effects (s), so they can be usefully incorporated into a
composite efficiency measure.
Therefore, to minimize the effect of random variation and eliminate the customer-specific effects,
we construct an overall efficiency measure as a weighted difference between the residuals in full
service (C’’) versus self-service (C’) channels:
15
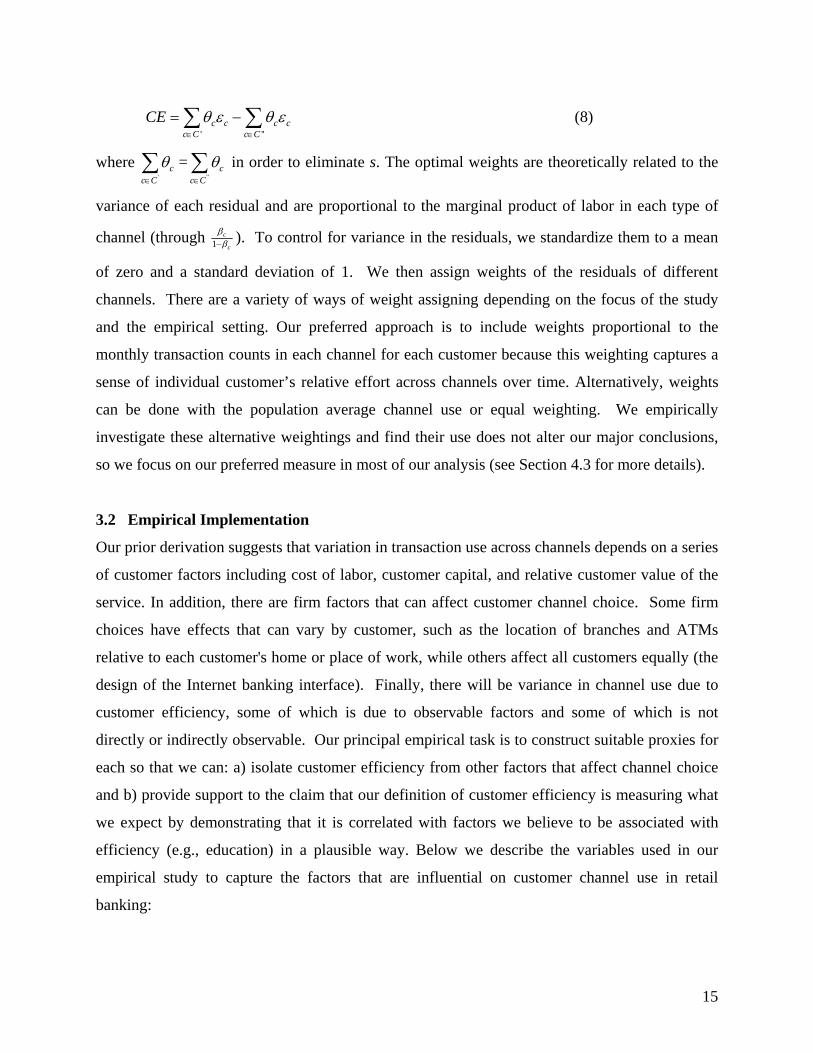
' ''
c c c cc C c C
CE θ ε θ ε∈ ∈
= −∑ ∑ (8)
where '
cc C
θ∈∑ =
"c
c C
θ∈∑ in order to eliminate s. The optimal weights are theoretically related to the
variance of each residual and are proportional to the marginal product of labor in each type of
channel (through 1c
c
ββ− ). To control for variance in the residuals, we standardize them to a mean
of zero and a standard deviation of 1. We then assign weights of the residuals of different
channels. There are a variety of ways of weight assigning depending on the focus of the study
and the empirical setting. Our preferred approach is to include weights proportional to the
monthly transaction counts in each channel for each customer because this weighting captures a
sense of individual customer’s relative effort across channels over time. Alternatively, weights
can be done with the population average channel use or equal weighting. We empirically
investigate these alternative weightings and find their use does not alter our major conclusions,
so we focus on our preferred measure in most of our analysis (see Section 4.3 for more details).
3.2 Empirical Implementation
Our prior derivation suggests that variation in transaction use across channels depends on a series
of customer factors including cost of labor, customer capital, and relative customer value of the
service. In addition, there are firm factors that can affect customer channel choice. Some firm
choices have effects that can vary by customer, such as the location of branches and ATMs
relative to each customer's home or place of work, while others affect all customers equally (the
design of the Internet banking interface). Finally, there will be variance in channel use due to
customer efficiency, some of which is due to observable factors and some of which is not
directly or indirectly observable. Our principal empirical task is to construct suitable proxies for
each so that we can: a) isolate customer efficiency from other factors that affect channel choice
and b) provide support to the claim that our definition of customer efficiency is measuring what
we expect by demonstrating that it is correlated with factors we believe to be associated with
efficiency (e.g., education) in a plausible way. Below we describe the variables used in our
empirical study to capture the factors that are influential on customer channel use in retail
banking:

16
Factors that affect customer efficiency. A large body of literature in labor economics has
emphasized that skill, training and experience can affect labor productivity both generally as well
as in technology-mediated self-service (Bartel and Lichtenberg 1987, Bartel 1995, Ichniowski et
al. 1997; Gurau 2002, Wang et al. 2003). We capture training as the level of education in the
household, because it is plausible that general human capital is associated with efficient
transaction behavior, especially in the Internet channel. We capture experience by a customer’s
tenure. Tenure (measured in years) represents a measure of familiarity with the bank and might
be plausibly related to productivity improvements through learning by doing. We can also
compute the time since adoption of online banking, which provides an alternative learning-by-
doing measure specific to the online banking channel. This measure may also be associated with
computer skill, because early adopters are likely to be more skilled with computers. Finally, we
are fortunate to have an additional potential proxy for computer skill – a market research
indicator of whether the customer shows an “interest in computers” which might be associated
directly with computer skill. We would therefore expect that use of self-service channels and
customer efficiency are positively related to education, tenure, and computer experience and
interest. We also have a measure of customer age. Greater age and experience might be
associated with greater efficiency from learning-by doing argument. However, older customers
may differ from younger customers in that they have less experience or comfort level with
technology-mediated self-service channels (see e.g., Hitt and Frei 2002, Bitner et al. 2000,
Curran et al. 2003, Gurau 2002, Wang et al. 2003). Since our age measure varies only in the
cross-section, customer heterogeneity likely dominates the learning effect and we would
therefore expect a negative correlation between the self-service usage and customer age. Finally,
several of the time-dependent variables, such as age and tenure, may be associated with lifecycle
effects that lead to a non-linear relationship with efficiency. We therefore allow for these effects
by including quadratic terms in the empirical analysis for these variables.
Opportunity Cost. A number of studies have suggested that income is a good proxy for the
opportunity cost of time (Becker 1993). We therefore approximate the unit labor cost (w) by
annual household income of the customer.
17
Transaction Value. We control for the number of transactions of each type that can be conducted
in a channel as a way of normalizing the transaction counts based on the customer’s overall
transaction requirements. This measure is also consistent with treating total transaction counts of
each type as exogenous. These variables may also broadly capture variation in customers’ value
of transactions (v) because value affects the total number of transactions of a given type but not
their allocation across channels.
In addition to potentially capturing transaction value, there is an additional benefit to
incorporating measures of transaction mix into the analysis. A number of prior studies have
shown that the nature of the product and transaction has a strong relationship with the optimal
use of technology mediation for service delivery (Huete and Roth 1988), which would suggest
that more standardized transactions would be likely to be done in self-service channels that have
a high technology mediation level (Boyer et al. 2002, Froehle and Roth 2004). By incorporating
measures of transaction counts, we can empirically examine whether self-service channels are
more closely associated with more routine transactions.
Channel Access. Classical facility and location theories in service operations management have
long established that the ease of access to a physical outlet of a service provider is crucial to a
customer’s decision to choose a service provider (Boyer et al. 2002). The availability of a
channel directly affects the usage of that channel because it lowers opportunity costs. Channel
availability can also affect the demand for other channels for which they are substitutes (Boyer et
al. 2002). Thus, customers located in areas with higher branch density may perform more branch
transactions and less transactions in other channels; similarly, customers located in areas with
more ATMs may perform more ATM transactions and less transactions in other channels.
Customers located in areas where there is a high density of physical channels may use virtual
channels less. Because these factors are really control variables in our analyses, we are
principally interested in whether these variables perform as expected as a check on the model
rather than as an explicit empirical hypothesis.
Channel Design. Channel design and product structure can influence channel choice. However,
because we only observe the choices of a single bank over a relatively short time period, the

18
variation in behavior due to channel design is likely to be small. Nonetheless, to control for
variation over time in channel design or incentives, we incorporate monthly dummy variables.
In addition, the institution we analyze operates across a number of different states with slightly
different products and business practices. Due to banking regulations which are principally
state-specific, products within a state tend to be similar. Thus, we also include dummy variables
for the customer’s state of residence to control for variation in channel design, products or other
aspects of the service production process.
3.3. Testable Hypotheses
Our hypotheses focus on the measurement of customer efficiency and its relationship with firm
performance. First, we can conduct analyses of individual channels to understand whether the
factors associated with efficiency (which we will refer to as efficiency correlates) are correlated
with channel use in the expected way. From our earlier discussion, efficiency correlates should
be positively related to self-service use. Moreover, because self-service channels can substitute
for other channels, more use of self-service may lead to less use of employee service channels.
Thus, we posit that:
Hypothesis 1-1: Factors associated with customer efficiency (age, tenure, education, skill) are
positively correlated with self-service channel use and negatively correlated with employee-
service channel use.
These hypotheses will be tested at a finer level of precision (e.g. correlation between age and use
of teller transactions), but are stated broadly here for concise presentation. Our data also allows
us to examine the relationship between transaction complexity and channel choice as suggested
by the prior literature (Huete and Roth 1988, Boyer et al. 2002):
H1-2: Customers use self-service channels more often than employee-service channels to meet
routine and standard service needs in a multi-channel service delivery system.

19
Second, our interest is in creating a systematic measure of customer efficiency based on the
aggregate channel utilization. Just as our efficiency correlates should show the proper
correlation with each channel, they should show the appropriate correlation with our aggregate
efficiency measures.
H2: Customer efficiency, as defined and measured in this analysis, is positively correlated with
tenure, education, and computer skill, and negatively correlated with age.
Finally, we would like to test whether indeed customer efficiency is associated with firm
performance. Although there are theoretical reasons to expect either a positive or negative
correlation between performance and customer efficiency in banking, we state our hypothesis in
terms of the positive prediction.
H3: Customer efficiency is positively correlated with customer profitability, product utilization
and retention.
The hypothesized relationships among customer efficiency, channel use and firm performance
are shown in Figure 2.

20
Figure 2: Hypothesized Relationships between Efficiency, Channel Usage and Firm
Performance
Customer Channel Use • Transaction counts • Allocation across
channels
Firm Performance/Firm-view Customer Efficiency
• Profitability • Product Utilization • Loyalty
Customer Factors • Customer Efficiency
(customer-view) o Age o Education o Tenure o Computer Skill
• Customer Time Opportunity Cost
• Transaction Value • Service Requirements
Combined Factors (Firm and Customer) • Channel Access
Firm Factors • Channel Design • Product Design (e.g.,
channel use incentives)
21
4. Empirical Analysis
Our empirical analysis includes three components. First, we will examine the determinants of
channel utilization to validate our model of channel use on an individual channel level (to test
H1-1 and H1-2). We will also examine the various control variables for consistency with prior
theoretical predictions about channel access and channel usage. Next, we will compute several
alternative measures of customer efficiency and test the hypothesis that customer efficiency is
related to customer characteristics in a systematic way (H2). Finally, we will use our customer
efficiency measure to investigate the relationship between efficiency and firm performance,
specifically profitability, product utilization and retention (H3). All analyses were performed
using standard procedures in STATA 8.0.
4.1 Data
The retail banking industry has been a pioneer in applying new technology to deliver services to
its customers. Most retail banks today have built multi-channel service delivery systems similar
to the one shown in Figure 1. These systems typically include retail branches (in which
transactions are conducted in person by tellers and “platform” sales representatives), telephone-
based customer service representatives (CSRs), automated Voice Response Units (VRUs),
Automatic Teller Machines (ATMs), and Internet banking. In addition, customers can generate
transactions by writing checks or by using the automated clearing house (ACH) for direct debit
or credit of their accounts. Among these channels, teller, VRU, ATM, Internet and ACH are
often used to handle standard and routine transaction types such as straightforward inquiry,
deposit, withdrawal, and account transfers; CSR and platform are often used to handle more
customized or complex service needs. Although we will analyze our model in all the channels
for which we have data, we will focus our efficiency analysis on one full-service channel (tellers),
and three self-service channels (VRUs, ATMs, and online banking) because these channels have
the best measurement in our data and are not subject to issues such as serving non-standard
transactions (platform) or being fully automated and not requiring any customer effort (ACH).

22
The bank used in our study is one of the largest retail banks in the U.S., and its operational
practices and customer population are regarded as representative of banks of similar size. From
a raw data set of the bank’s several million customers, a random sample of about 25,000
households was drawn and used for this study. We restricted our analysis to customers who
appear in the banks customer information file and who had at least one transactional deposit
account, since it does not make sense to analyze transaction behavior for customers who do not
routinely perform transactions. These data include monthly transaction records for each
customer’s deposit accounts organized by transaction type and channel for each month from July
2002 to June 2003; monthly account balances for each deposit, loan and investment account for
these customers over the same period. We define deposit accounts to include time deposits,
interest and non-interest checking, and money market accounts. Loans include consumer loans,
auto loans, credit cards and mortgages. Investment accounts include trust, asset management,
brokerage accounts and mutual funds (with mutual funds being the most common). We also use
the bank’s bi-monthly profit measure which is based on an internal model that incorporates
interest and non-interest revenue, less service costs (including overhead allocations), expected
loan loss and taxes.
For each customer we have a single cross-section of demographic information which includes
the date the customer first joined the bank, the date the customer obtained Internet banking
access (if any), and standard demographics (age, income, education level, gender, marital status,
presence of children, and zip code of principal residence). In addition, these data also include
market data purchased from a third party which captured “interest in computers” (a binary
measure). Finally, we obtained information on the bank’s own ATM and branch networks,
which provided a count of the number of branches and bank-owned ATMs in each zip code area.
The transactional and account data was obtained from the bank’s transactional systems and
therefore is believed to be of high quality. However, for some channels, notably platform and
telephone CSRs, the bank does not track all transactions in its online systems, so we limit our
analyses of these channels. The transaction file also omits non-inquiry VRU transactions, but
these are believed to be a relatively small portion of overall VRU activity. The customer data
(other than those derived from transactional data) are collected as part of the bank’s normal

23
operations and are supplemented by third-party market research data. These data are also
believed to be highly accurate, although some data are missing. The data of ATM and branch
locations are drawn from the bank’s operational databases and are also believed to be extremely
accurate and complete. As for the profitability data, although there is some subjectivity in the
calculation of customer profitability, especially due to cost allocation procedures, these data are
used for internal performance measures. Regardless of its potential flaws, customer profitability
is one of the measures which the bank actively monitors and attempts to maximize.
All the data described above is at individual customer level, so we conduct our analysis at the
customer level with each observation representing a household in a given month. Observations
are not excluded for missing data on the demographic variables. Instead, we include a dummy
variable to indicate if the data is missing and set the value to the variable mean for a continuous
variable, or have an explicit “missing” category for all categorical variables. This procedure
ensures that the results are not sensitive to the value used to fill missing data. A consequence of
this data selection process is that our data includes a mix of new customers over our period,
customers who stayed throughout the 12-month period, and customers who abandoned some or
all of their accounts. Because the bank retains customer information data after customer
departure, our counts of departure are not skewed by missing data on the characteristics of
customers who departed. We also validated that our proportions of new, departing and
continuing customers match the customer population.
We utilize three outcome measures in our performance analysis: customer profitability (as
computed by the bank), product utilization, and customer retention. Product utilization is
measured by the aggregate balance for each of the three types of accounts a customer holds:
deposit, asset and investment accounts. Because the economics of these three account types are
similar within category (e.g., interest and non-interest checking accounts are similar) but
different across categories (e.g., mutual funds are different from loans), we perform separate
analyses for each of these categories, but do not use broader aggregates. Customer retention is
measured as a binary variable that captures whether a customer closed all her accounts. These
measures are consistent with other research in banking performance at the customer level (e.g.,

24
Hitt and Frei, 2002), as well as with the performance metrics that the bank utilizes internally.
Table 1 presents definitions and summary statistics of our key variables.
4.2 Channel Use Analysis
Using our service co-production model in Section 3, our general empirical model for channel
demand relates the total number of transactions in a channel to correlates of customer efficiency
(age, tenure, interest in computers, online banking tenure), correlates of cost of customer effort
(household income), correlates of transaction value (total transactions by type), channel
availability (branch density, ATM density, having online banking), and other control variables
for customer characteristics (martial status, having children, gender) and variation in bank
characteristics (month, customer state of residence). Time-related variables (age, online banking
tenure, customer tenure) are both entered as linear and as squared terms to account for lifecycle
effects and other non-linear trends. The variables for income and education are categorical and
are expanded to a set of dummy variables, so no ordering is imposed on these measures. Thus,
our baseline empirical model is:
2
2 2
20
2 2
_
log(1 ) log(1 )c j j age comp college graduateagej J
tenure eb tenure atm branchtenure eb tenure
has eb me
T T age age comp college graduate
tenure tenure eb tenure eb tenure atm branch
web
β δ β β β β β
β β β β β β
β β
∈
− −
+ = + + + + + + + +
+ + + − + − + +
+ +
∑
_ _ (9)d income high income gender children
married
med income high income gender children
married state dummies time dummies
β β β
β ε− −− + − + +
+ + + +
We estimate this equation using monthly data of each customer’s transactions in each of five
channels (teller, VRU, ATM and online banking, and ACH), although we exclude ACH from our
efficiency measure later, because ACH is fully automated. Because transaction count variables
(transactions in a given channel cT and transactions of a given type jT ) can be legitimately zero,
we add one to the transaction count before taking the logarithm to prevent a zero observation
from creating an extreme point. Transaction types that cannot be conducted in a particular
channel (e.g., deposits in the VRU channel) are omitted from the regression. For the two sets of
categorical variables for education and income, the “lowest” category is omitted (high school
education, low income). Because the dependent variable is the logarithm of transactions, the

25
coefficients (except for the transaction count controls, which are also in logarithms) can be
interpreted as percentage changes (e.g., collegeβ is the percentage difference in transactions
between a college educated customer and a high school educated customer). For variables
entered in both linear and quadratic terms (e.g., age), both coefficients need to be examined to
determine the relationship. Where relevant, we will discuss both the trend (increasing or
decreasing) and where the minimum/maximum point is achieved (for relationships that are
convex or concave). For example, for age, this point is achieved at 22
age
age
ββ−
. In many cases, this
will show that the minimum or maximum is at the edge of the data range, so the relationship is
effectively monotonic over the sample range. For all channels except the online banking channel,
the estimates will be performed using ordinary least squares with Huber-White robust standard
errors (clustered by customer) to account for repeated customer observations over time
(Wooldridge, 2002). These analyses are done with the STATA “reg” procedure.
For online banking, we have to account for the fact that some customers have not initiated online
banking and therefore their online transaction count will be zero. There are two ways of
handling this issue. One option is to restrict our analysis only to customers with online banking.
However, this analysis can be biased by customer self-selection (Tobin 1958, Maddala 1983).
Our preferred method is to treat the “desired” number of online banking transactions as a latent
variable which is censored at zero. This formulation leads to the use of a generalized Tobit
model (the interval regression model) that allows both censored observations of customers
without Internet accounts and non-censored observations of customers with Internet accounts
(Tobin, 1958, Goldberger 1964, Maddala 1983, Long 1997). This model was estimated using
the STATA “intreg” procedure. The results of these analyses are presented in Table 2, with each
column representing an analysis of an individual channel.
In our testing of hypothesis H1-2 and some other discussions later, we refer to coefficient
comparisons across models for different channels. For these comparisons, we compute statistical
significance by noting that coefficients in two different regressions are statistically independent,
so the standard error of the difference can be computed by the simple formula for the variance of
a difference of two independent random variables. Because the sample size is the same for all

26
our channel use regressions, the appropriate test for the equality of two hypothetical
coefficients 1β and 2β with regression standard errors 1( )SE β and 2( )SE β is a t-test given by:
1 2
2 21 2
1 1[ ( )] [ ( )]2 2
tSE SE
β β
β β
−=
+
.
Overall, the models are all significant (p < .001) and the results (see Table 2) in this analysis are
broadly supportive of the hypothesized relationships among self-service usage and correlates of
customer efficiency (H1-1) and the relationship between self-service usage and transaction type
(H1-2).
Age. Customer age is generally positively associated with full-service transactions (tellers)
( .021, .01tellerage pβ = < ) and age has a negative and significant correlation with the use of self-
service channels which is strongest for online banking ( .026, .01ebankingage pβ = − < ). The quadratic
terms are also significant but small, generally suggesting that the relationship between
transaction use and age is monotonic over the sample (the maximum is reached at
.0205 64.12( .00016)
− =−
years for tellers and the minimum is reached at age 60 years for online
banking, which are both around the 90th percentile of the sample age distribution).
Experience/Tenure. The tenure results are mixed. For the most part, greater relationship length
with the bank is associated with less usage of two self-service channels (ATM and online
banking) as well as less usage of tellers. There are positive relationships with VRU usage and
ACH. Examining the quadratic terms suggests that these trends persist over the entire sample
distribution or at least far out in the upper tail (the earliest minimum is reached in the teller
channel at a tenure of 16.4 years, which is close to the 90% percentile of the tenure distribution).
We therefore conclude that this analysis does not show any systematic relationship between
length of relationship and choice of channel.
Experience/Online Banking Tenure. The results are closer to expectation on online banking
tenure. An additional year of experience in online banking is associated with a 5% decrease in

27
the number of teller transactions (significant at p<.01) and this holds across the entire sample.
The relationship between online banking tenure and the use of other channels is more complex.
Initially, the number of online banking transactions is declining in online tenure, reaches a
minimum at approximately 1.9 years and is increasing thereafter. VRU use initially increases
following the adoption of online banking but decreases as online banking tenure moves beyond
the mean. The initial increase in VRU use may be consistent with the increased demand on
telephone support for Internet customers learning to use the system (this interpretation was
suggested by managers we interviewed as part of this research). The same holds for ATMs, but
the decreasing region is reached much faster (.65 years) suggesting a negative relationship with
online banking tenure. ACH use is increasing in online banking tenure, although this may be
partially expected for technical reasons – automatic bill pay in the online banking channel is
often fulfilled through the ACH system. Overall, the declining use of teller transactions and the
increase use of the online channel for long-time users suggests channel substitution, which is
fully consistent with H1-1. In addition, the convex relationship between online banking use and
online banking tenure suggests that it takes a period of time before online banking is fully
utilized, and at that time it becomes a substitute for other self-service (VRU and ATM) and full-
service channels (teller).
Education. The hypothesized relationships also hold generally for self-service channel usage
and education. Point estimates suggest that the highest levels of education are consistently
associated with greater use of self-service channels and less use of full-service channels except
for VRUs. Customers with a graduate degree perform 12% fewer teller and nearly 15% more
ATM transactions than do customers with a high school education (these differences are
significant at p<.01). The results of online banking are mixed – college educated customers
actually perform fewer online banking transactions than high school educated customers while
customers with a graduate degree perform higher numbers of transactions than either group, but
none of the results are significant. The one unusual finding is that VRU use is declining in
education. This may, in part, be due to the fact that the VRU is a gateway to telephone CSRs,
which makes the VRU channel have some of the appearance of a full-service channel as well
(that is, calls to the CSR are first routed through the VRU, with an option to “speak to a customer
representative”). For this reason, we omit the VRU channel from our subsequent efficiency

28
analysis since our measure of VRU transactions may confound self-service transactions with
attempted full service transactions through CSRs.
Skill/Interest in Computers. Generally, the coefficients on “interest in computers” are in the right
direction but tend to be small and insignificant for most channels. Expressed interest in
computers is associated with 9.3% greater online banking transactions, but even this number is
not significant at conventional levels (t=1.5). Thus, the results on this variable are inconclusive
but not inconsistent with our hypotheses. The lack of power of this variable may simply be due
to imperfect measurement, an issue which can hopefully be addressed in future research.
Channel Availability. There is a clear relationship between customer adoption of online banking
and lower numbers of transactions in all other channels except ACH, which shows a modest
increase. The greatest relationships are the VRU channel (38% less use for customers with
online banking after controlling for tenure) because the capabilities between online banking and
the VRU are similar. Similarly, customers with online banking access perform nearly 13% fewer
teller transactions. As observed in the online banking tenure analysis, ACH appears to be a
complement to online banking. The results are not as strong for other channel availability
measures but are largely consistent with our hypotheses. Greater numbers of available ATMs in
the customer’s home zip code area is associated with fewer teller transactions and more ATM
transactions, suggesting that ATMs are substitutes for tellers, as would be expected. One
additional ATM is associated with a 0.8% decline in teller transactions and a 2% increase in
ATM transactions. ATMs appear to be substitutes for the other channels, although these
coefficients are not significant. The results of branch density are puzzling. More branches are
associated with less branch transactions and more use of online banking. Although this is
inconsistent with our story of branch availability, it could indicate that branches tend to have the
highest densities in communities that also have a propensity to use online banking such as urban
settings. Thus, it appears that it may be acting as a control for unobserved demographic factors.
Unfortunately we are not able to test this further because the branch data and our geographic
control are both at the same level of aggregation (zip code), which means we cannot use a zip
code control to eliminate this source of variation.

29
Opportunity Cost. The results on income are consistent with an argument that customers may
utilize self-service to economize on opportunity costs. Medium-income consumers perform
nearly 13% more online banking transactions and 3% more ACH transactions. The relationship
is even more pronounced for high-income customers: high-income customers conduct 28% more
online banking transactions, 7% fewer VRU transactions and 2% fewer teller transactions
(although the figure for tellers is only marginally significant at p<.1). Interestingly, although
income might be proxy for other factors such as education or computer skill, the fact that these
numbers are substantial after controlling for both education and “interest in computers” provides
greater confidence in our interpretation.
Transaction Volume. The results also support hypothesis H1-2, that simple transactions are more
often accomplished in self-service channels. The coefficients suggest that a 10% greater number
of inquiry transactions is associated with an approximately 1.8% increase in online banking
transactions and a 1.3% increase in ATM transactions, but only a 0.5% increase in teller
transactions. In other words, the results are consistent with the argument that a marginal inquiry
transaction is more likely to be directed to a self-service channel. These differences between the
coefficients on inquiries for the teller channel versus the other channels are all significant at
p<.001.
Other Controls. The control variables for state of residence and month are jointly significant and
in most cases individually significant in all analyses. The same is also true for the family
structure variables. Our theory does not provide specific predictions for these variables, so we
cannot interpret them further in terms of our model. However, one interesting observation is that
households where women are the primary account holder are significantly more likely to perform
transactions in the online channel and less likely to use tellers, an observation that might prove
useful in marketing efforts for online banking.
4.3. Customer Efficiency
Using the approach described in Section 3, we now construct measures of customer efficiency.
We first perform regressions of channel usage against all covariates in our model except those

30
associated with customer efficiency. The standardized residuals from this regression are used to
construct four efficiency measures as described in Section 3. CE1 is computed as the difference
between the two self-service channel residuals (ATM, online banking) weighted by number of
transactions an individual customer performs in each channel each month, and the residual of the
teller channel. CE1 is our preferred measure as it accommodates transaction differences across
consumers over time and does not include the potentially problematic VRU channel. For the
purpose of robustness check we also construct alternative measures. CE2 is the same as CE1
except that it includes VRU as a self-service channel. We also computed two additional
measures, also omitting the VRU channel: CE3 uses weights proportional to population means
rather than customer specific time-varying weights, and CE4 utilizes equal weights. In all cases,
the efficiency measures are standardized to a mean of zero and a standard deviation of 1 to ease
interpretation. These measures are then regressed on the customer efficiency covariates using
ordinary least squares with Huber-White robust standard errors (Wooldridge 2002) using the
STATA “reg” procedure. (see Table3).
Overall, the models are all significant (p< .001) and the results on the efficiency measures mirror
our earlier analysis (Table 3) and lends support to hypothesis H2. Age is negatively related to
efficiency, which is significant for CE2, CE3 and CE4 although not significant for CE1.
Efficiency is shown to be increasing in education, which is significant for the highest education
level “graduate” for CE1 ( 1 0.13, .01CEeduc graduate pβ − = < ) and significant for both “college” and
“graduate” for CE3 and CE4. The efficiency measures are all shown to have a concave
relationship with tenure: for CE1 with the maximum roughly in the middle of the sample (9 years)
– thus, efficiency is initially increasing in tenure, then decreasing. This is similar to the results
for the individual channel analyses. Efficiency is increasing in experience with online banking
up to the midpoint of the sample (the maximum is achieved at 1.6 years) and then declining in
tenure although tenure has a net positive contribution over the entire sample range. Thus,
efficiency is broadly related to age, education, online banking tenure and overall customer tenure
though the results on “interest in computers” are inconclusive.
Overall, examining the columns of Table 3, it appears that although there are some variations in
the results from the different efficiency measures they are broadly consistent, which suggests the
31
empirical performance of our efficiency measure is not particularly sensitive to the choice among
plausible weight schemes.
4.4 Customer Efficiency and Performance
We consider three measures of performance: profitability as computed by the bank, product
utilization, and retention. The baseline model relates the dependent performance variable
(designated generically by P) to customer efficiency (and its square to account for nonlinear
effects), and to a set of control variables suggested by our channel use model. We include
customer efficiency correlates in addition to customer efficiency for two reasons: first, it may
improve empirical performance of the model if these variables have a direct relationship with
performance; second, our results are more conservative and perhaps more relevant because the
efficiency measure now can be interpreted as efficiency that was not otherwise observable
through the efficiency correlates. Thus,
2 2
2 2
2 20
2 2
_
CE age comp collegeCE age
graduate tenure eb tenuretenure eb tenure
atm branch has eb med income
P CE CE age age comp college
graduate tenure tenure eb tenure eb tenure
atm branch web med
β β β β β β β
β β β β β
β β β β− −
−
= + + + + + +
+ + + + − + −
+ + + +
_ _ (10)high income
gender children married
income high income
gender children married state dummies time dummies
β
β β β ε−− + −
+ + + + + +
We also examined variations of the model which include transaction count controls (the counts
of different types of transactions of the customer) and channel count controls (the counts for
transactions in various channels of the customer).
We utilize Huber-White robust standard errors to correct for repeated observations of the same
customer over time (Wooldridge 2002) except in fixed-effects and random-effects analyses
which already control for repeated observations. For the profitability analysis, the dependent
variable is the bank’s internal profit measure. For product utilization, we utilize the logarithm of
account balance as the dependent variable for each type of product (deposit, assets and
investment). All of these models are estimated by ordinary least squares (using the STATA “reg”
procedure) as well as by fixed and random effects panel data models (using the STATA “xtreg”
procedure). For the retention analysis, we utilize logistic regression where the dependent
variable (depart) is set to one if the customer departed the bank and zero otherwise (using the
32
STATA “logit” procedure). Overall the models are all significant (p < .001) although some have
a relatively small R-squared (see further discussion below) and the results are generally
supportive to hypothesis H3.
Profitability. The profit results are shown in Table 4. The baseline model (Column 1) suggests
that more efficient customers are more profitable – a customer that is one standard deviation
above the mean in efficiency contributes $4.76 of additional monthly profit
( 1 1(1) (1) 4.76, .01profit profitCE CE squared pβ β −+ = < ). This relationship continues to hold (and is significant)
when we control for transaction types (Column 2) and actually gets stronger when we utilize a
fixed effects analysis that controls for all time-invariant customer characteristics (Column 4).
Results of a random effects panel data model are similar (not shown).
In addition, the estimates of the model with channel controls (Column 3) suggest that the
allocation of transactions across channels does explain the relationship between efficiency and
profitability. When controls for channel usage are included the coefficients are large and
negative (as channel use incurs cost), and the efficiency coefficient turns slightly negative. This
suggests that more efficient customers are associated with greater profits principally due to
allocation of transaction activity across channels, not because of a change in the overall mix of
actual transaction types (consistent with our treatment of these as exogenous), nor due to
incremental revenue enhancing behaviors. If customer efficiency had no relationship with profits
except through channel transaction volume, this CE1 coefficient should be close to zero. We
will consider the possibility of revenue differences further in the product usage analysis.
The control variables in these regressions also appear to be reasonable. Profitability is increasing
in income, as would be expected. Interestingly, although ATM density is largely unrelated to
profitability, branch density is associated with higher profitability. This is consistent with our
explanation of a prior result that branch density was associated with higher online banking
adoption. It may be that branch density acts partially as a proxy for unobserved demographic
variables in addition to representing the availability of the teller and platform channels. The
overall fit of the regression is somewhat small with an R2 of around 2%. This is not surprising as
customer profitability in retail banking is known to vary considerably across customers (see e.g.,

33
Hitt and Frei 2002) for idiosyncratic reasons. However, due to our large sample size, most of the
variables are significant individually and jointly. Overall, these results lend support for H3.
Attrition. The attrition results shown in (Table 5) suggest a convex relationship between
attrition rate (the probability of departing the bank) and customer efficiency. Column 1 shows
the linear CE1 coefficient to be negative and the quadratic term coefficient to be positive (both
significant at p< .01). A customer with a very low efficiency has a higher attrition rate that is
reduced as efficiency increases. This negative relationship between efficiency and attrition
persists until attrition is minimized at .96 standard deviations above the mean of CE1, and is
increasing with efficiency thereafter. The result is similar, although weaker with transaction type
controls (Column 2). In Column 3 we add channel usage controls. Greater use of tellers and the
online banking channel are both associated with less attrition, although the teller relationship
ln( .22, .01)departtl pβ = − < is more than double the coefficient on online banking
ln( .12, .01)departeb pβ = − < . This suggests that while more use of self-service is associated with
decreased departure, the relationship is much stronger with the full service teller channel.
However, unlike in the profitability analysis, the relationship between attrition and efficiency
(with channel use controls) becomes much stronger and suggests a negative relationship between
attrition and efficiency over almost the entire sample (the departure rate is minimized at 3.7
standard deviations above the sample mean which is above 99% percentile of the sample
distribution). Thus, while the general relationship between efficiency and departure is negative,
the very lowest and highest efficiency customers show greater attrition. Since we believe the
results without channel usage controls are the proper way to interpret CE, this provides mixed
support for H3.
Product Utilization. The results on product utilization are similar in direction to the results on
attrition. In Table 6, we estimate separate regressions for each of the three account types:
liabilities (deposit accounts), asset accounts (loans), and investment products (principally mutual
funds). Each regression was performed using OLS, random effects (not shown but similar to
OLS), and fixed effects models. The results consistently show a concave relationship between
product use and efficiency where balances are maximized around or above the sample mean. In
OLS, deposit balances are maximized at .84 standard deviations above the sample mean of

34
efficiency. Similar results hold for asset balances (concave with maximum at 0.2 standard
deviations) and investment balances (concave with maximum at -.02 standard deviations relative
to the mean). The results of the fixed effects analyses are more consistent – all show concave
relationships with significant linear and quadratic terms and that balances are maximized in the
range of 1.4 to 1.9 standard deviations above the mean (about the 90th percentile of the sample
distribution). Thus, the balances results also provide partial results for H3, although the
relationship between customer efficiency and product utilization is more complex (being
curvilinear rather than linear) than we had anticipated.
The control variables in these analyses are mostly insignificant and generally mixed in sign.
Education is consistently positively associated with balances but often not significant. One
notable exception is income, which as expected has a large and positive relationship with
balances – a high income customer has approximately 87% higher liability balances, 68% greater
asset balances and 37% percent greater investment balances than a low income customer. These
coefficients as well as the coefficients on medium income are all significant at p< .01.
5. Summary and Discussion
Operations managers across service industries face the challenge of designing and managing an
increasingly complex multi-channel service delivery system that consists of both traditional,
physical, employee-provided service channels as well as virtual, self-service channels. Given the
co-production nature of service production, a crucial step toward successful service design and
management is to understand both how customers utilize these channels and the corresponding
impact on firm performance in short and long term. This requires identifying a wide array of
factors that affects customers’ channel choices. Prior literature has developed the theoretical
argument that customer efficiency, defined as a customer’s efficiency of participation in the
service co-production process, should be associated with greater self-service utilization, and that
greater customer efficiency is therefore associated with greater firm performance. In addition,
many of the customer characteristics that should be associated with greater customer efficiency
have been previously identified. We make two specific contributions to this literature. First, we
develop an approach for the measurement of customer efficiency utilizing channel demand,

35
enabling examination of customer efficiency issues without requiring complete data on all
customer inputs and outputs. Instead, we measure efficiency as a residual in a model of self-
service channel use after controlling for channel availability and other factors unrelated to
efficiency. Analysis using this measure suggests that our efficiency measure is correlated with
many demographic characteristics in the expected way. Second, we utilize our efficiency
measure to examine the relationship between customer efficiency and performance, a
relationship which has been hypothesized but rarely tested. Our results suggest that customer
efficiency is strongly and positively associated with customer profitability across the sample.
We also find that customer retention and product balances are increasing in efficiency for at least
half the sample which is consistent with expectations, but that the very highest efficiency
customers have lower retention and lower balances than other customers which was not
anticipated by our model and theoretical discussion. We also find support for theories presented
in prior work in service operations, that self-service channels that often have high automation
levels are relatively favored by bank customers for simple and standard transactions in
comparison to employee service channels.
While our efficiency measure has practical advantages, it also has some theoretical
disadvantages shared with other approaches that capture a latent construct as a residual (for
example, the Solow residual of multifactor productivity – see e.g., Solow 1957 -- also has this
disadvantage). In particular, we rely heavily on prior assumptions and model specification to
establish that our residual measure indeed captures efficiency and not some other latent construct.
As noted by Edwards and Bargozzi (Edwards and Bagozzi 2000) the elimination of unwanted
causal factors from empirical measures is well known but difficult problem for empirical testing
of social science constructs. We attempt to minimize this problem by using theoretically
motivated control variables and checking the results of our analyses for consistency with prior
theoretical and empirical arguments. Nonetheless, the ideal test would be to combine the direct
measurement of customer inputs and outputs with our indirect measurement approach to see how
much of our measure is due to efficiency as opposed to general customer heterogeneity. We
hope to pursue this in future work.

36
Our empirical analysis of transaction behavior uncovered two unexpected relationships. First,
greater branch density is associated with fewer teller transactions and more online banking. This
may be a causality issue because the factors associated with greater online banking usage are
also likely to be associated with the areas with desirable demographics where branches might be
constructed for non-transactional reasons (e.g., selling investment products, opening new
accounts). However, since this variable is utilized as a control it does not lead us to question our
core findings about customer behavior and efficiency. Second, we did not anticipate a strong
concave relationship between product utilization and efficiency. Part of this observation is
consistent with the idea that more efficient customers are better at managing their money which
leads to lower balances. It may also be consistent with the idea that customers for whom
transactional access is costly will tend to use fewer products. Regardless of the explanation, it is
clear that the highest efficiency customers, by our measures, behave differently than other
customers and further investigation into this issue is needed. The attrition results are easier to
explain as there is a tension between online channel usage and increased retention and an even
stronger relationship between retention and teller usage. Without knowing the causal direction
of this relationship, whether loyal customers use online banking and tellers more or whether
these channels build lock-in and encourage loyalty, it is difficult to understand whether
interventions to alter channel utilization are likely to improve retention. It does, however,
suggest, that efficiency and performance are related. It may be possible to disentangle these
effects with a longer time series, which represents another opportunity for future research.
There are four additional limitations of the current study that suggest avenues for future research.
First, our data is from a single bank. Given the random sampling approach and the sheer size of
the bank we consider, our results are likely to be broadly representative of a large population.
However, we cannot investigate the possibility that the customer choices we observe are affected
by specific practices of this bank, such as account features (e.g., fee structure), channel
characteristics (e.g., online banking system design or call center hold times), and brand
positioning. We hope to expand the scope of the data collection in future research. In addition,
although our model was motivated by our discussions with retail banking executives, it appears
the model should apply to multi-channel service delivery systems in other industries as well. A
study in a different industry would help to validate our customer efficiency measurement

37
approach. Second, our customer transaction records only cover transactions for traditional
deposit products. Because this represents the vast majority of discretionary retail banking
transactions, this seems a reasonable starting point. However, as banks are increasingly reliant
on non-traditional products (investment, brokerage, insurance) and these products are
increasingly served through the same service delivery infrastructure, it would be useful to extend
our analysis to consider these products beyond simply examining product utilization. Third, the
explained variance in some of our performance regressions is relatively small, although all the
models are highly significant. While we would generally prefer greater explanatory power, this
most likely suggests that profitability and other performance dimensions are driven heavily by
unobserved differences across customers. However, we do note that the significance levels of
our efficiency measure are on the same order as factors known to be important in banking
profitability, such as household income or transaction volume. Thus, explanatory power is a
broader concern regarding the empirical setting, rather than a concern specific to our approach.
This also suggests it would be beneficial to identify other constructs that can be used to further
distinguish customer profitability differences among customers. Moreover, it also suggests that
without substantial improvements in modeling or data on profitability, large sample sizes will be
required for this type of research. Fourth, and finally, because we measure efficiency as a latent
construct revealed through channel choice, we cannot directly investigate the relationship
between efficiency and self-service usage. Our prior arguments suggest that at least some
components of efficiency may be immeasurable, but it would be useful to compare our measure
of customer efficiency to direct measures of customer behavior (e.g., time spent performing
transactions) for the purpose of examining the accuracy of the measure and to understand the
importance of unobservable components to overall customer efficiency. This issue exactly
mirrors the concern in the firm productivity literature that focuses on methods for “explaining”
multifactor productivity of firms given that it is also measured as a residual concept.
Acknowledgements
This study is supported by National Science Foundation (NSF) grants: SES-0518931 and SES-
0519054. The authors thank Aleda V. Roth, the senior editor and two anonymous referees for
their constructive and valuable comments.

38
References
Apte, U. M., A. P. J. Vepsalainen. 1993. High tech or high touch? Efficient channel designs for delivering financial services. Journal of Strategic Information Systems 2 (1) 39-54.
The Banker. 2003. Tuning into the right channels. 02 December 2003, 116.
Bartel, A., P. R. Lichtenberg. 1987. The comparative advantage of educated workers in implementing new technology. Review of Economics and Statistics, 64 1-11.
Bartel, A. 1995. Training, wage growth, and job performance: evidence from a company database. Journal of Labor Economics. 13 (3) 401-425.
Bateson, J. E. G. 1985. Self-service consumer: an exploratory study. Journal of Retailing 61 (3) 49-76.
Becker, G. S. 1993. Human capital: a theoretical and empirical analysis, University of Chicago Press, Chicago, IL.
Bitner, M. J., S. W. Brown, M.L. Meuter. 2000. Technology infusion in service encounters. Journal of the Academy of Marketing Science. 28 (1) 138-149.
Bitner, M.J., W.T. Faranda, A.R. Hubbert, V.A. Zeithaml. 1997. Customer contributions and roles in service delivery. International Journal of Service Industry Management, 8(3) 193-205.
Boyer, K.K., R. Hallowell, A.V. Roth. 2002. E-services: operating strategy -- a case study and a method for analyzing operational benefits. Journal of Operations Management. 20 175-188.
Bowen, D.E. 1986. Managing customers as human resources in service organizations. Human Resource Management 25 (3) 371-383.
Chase, R. B. 1978. Where does the customer fit in a service operation? Harvard Business Review 56(6) 137-142.
Chase, R. B. 1981. The customer contact approach to services: theoretical bases and practical extensions. Operations Research 29 (4) 698-706.
Chen, P.Y., L. M. Hitt. 2002. Measuring switching costs and their determinants in internet enabled businesses: a study of the online brokerage industry. Information Systems Research 13(3) 255-276.
Choi, D., U. S. Karmarkar, H. Rhim. 2005. Service technology, access, and process economics in retail banking competition. Working paper, the Anderson School of Management, UCLA.
Curran, J. M., M. L. Meuter, C. F. Surprenant. 2003. Intentions to use self-service technologies: a confluence of multiple attitudes. Journal of Service Research. 5 (3) 209-224.

39
Davis, T. 1993. Effective supply chain management. MIT Sloan Management Review 34 (4) 35-46.
The Economist. 2004. You're hired. 372 (8393) 21.
Edwards, J. R., R. P. Bagozzi. 2000. On the nature and direction of relationships between constructs and measures. Psychological Methods. 5 (2) 155-174.
Ellram, L.M., W. L. Tate, C. Billington. 2004. Understanding and managing the service supply chain, Journal of Supply Chain Management. 40 (4) 17-33.
Froehle, C. M., A. V. Roth. 2004. New measurement scales for evaluating perceptions of the technology-mediated customer service experience. Journal of Operations Management 22 1-21.
Fuchs, V. 1968. The service economy. Columbia University Press, New York, NY, U.S.A.
Globerson, S., M. Maggard. 1991. A conceptual model of self-service. International Journal of Operations and Production Management 11 (4) 33-44.
Goldberger, A.S. 1964. Econometric theory. John Wiley Publisher, New York, NY.
Griliches, Z. 1994. Productivity, R&D and the data constraint. American Economic Review 84 (1) 1-23.
Gurau, C. 2002. E-banking in transition economics: the case of Romania. Journal of Financial Services Marketing 6 (4) 362-378.
Heskett, J.L., W.E. Sasser Jr., L. A. Schlesinger. 1997. The Service Profit Chain: How leading companies link profit and growth to loyalty, satisfaction, and value. Free Press, New York, NY.
Hitt L.M., F.X. Frei. 2002. Do better customers utilize electronic distribution channels? The case of PC banking. Management Science 48 (6) 732-748.
Huete L., A. V. Roth. 1988. The industrialization and span of retail banks’ delivery systems. International Journal of Operations Management. 8 (3) 46-66.
Ichniowski, C., K. Shaw, G. Prennushi. 1997. The effects of human resource management practices on productivity. The American Economic Review. 87 (3) 291-313.
Karmarkar, U., R. Pitbladdo. 1995. Service markets and competition. Journal of Operations Management 12 (3-4) 397-411.
Kelley, S.W., J.H. Donnelly, Jr. and S.K. Skinner. 1990. Customer participation in service production and delivery. Journal of Retailing 66 (3) 315-335.
Kellogg, D. L., R. B. Chase. 1995. Constructing an empirically derived measure for customer contact. Management Science 41 (11) 1734-1749.

40
Long, J. S. 1997. Regression models for categorical and limited dependent variables. SAGE Publications, Thousand Oaks, CA.
Lovelock, C.H., R.F. Young. 1979. Look to consumers to increase productivity. Harvard Business Review 57 168-178.
Maddala, G.S. 1983. Limited-dependent and qualitative variables in econometrics. Econometric Society Monographs in Quantitative Economics. Cambridge University Press.
Menor, L. J., A. V. Roth, C. H. Mason. 2001. Agility in retail banking: a numerical taxonomy of strategic service groups. Manufacturing and Service Operations Management. 3 (4) 273-292.
Mills, P.K., J.H. Morris. 1986. Clients as "partial" employees of service organizations: role development in client participation. Academy of Management Review 11 (4) 726-735.
Roth, A. V. 2001. Siete mitos de los servicios electronics (Seven myths of electronic services). Harvard Business Review. 100 88-96.
Roth, A. V., L. J. Menor. 2003. Insights into service operations management: a research agenda. Production and Operations Management 12 (2) 145-163.
Roth, A. V., W. E. Jackson III. 1995. Strategic determinants of service quality and performance: evidence from the banking industry. Management Science 41 (11) 1720 -1733.
Soteriou, A.C., R.B. Chase. 1998. Linking the customer contact model to service quality. Journal of Operations Management 16 495-508.
Selnes, F., H. Hansen. 2001. The potential hazard of self-service in developing customer loyalty. Journal of Service Research 4(2) 79-90.
Solow, R. M. 1957. Technical change and the aggregate production function. Review of Economics and Statistics. 39 (3) 312-320.
Tobin, J. 1958. Estimation of relationships for limited dependent variables. Econometrica. 26 24-36.
Voss, C. 2000. Developing an eService strategy. Business Strategy Review 11 (1) 21-33.
Wang, Y., Y. Wang, H. Ling, T. Tang. 2003. Determinants of user acceptance of Internet banking: an empirical study. International Journal of Service Industry Management. 14 (5) 501-519.
Wooldridge, J. M. 2002. Econometric analysis of cross section and panel data. MIT Press, Cambridge, MA.
Xue, M., P.T. Harker. 2002. Customer efficiency: concept and its impact on e-business management. Journal of Service Research 4 (May) 253-267.

41
Table 1: Data Description and Summary Statistics
Variable Definition No. Subjects
No. of Obs.
Mean Std. Dev.
Min Max
CE1 Customer efficiency measure ( “CE1 squared” is the square term of CE1)
24450 224377 0 1 -5.59 4.97
CE2 Alternative customer efficiency measure (with VRU data)
24450 224377 0 1 -5.49 4.66
CE3 Alternative customer efficiency measure (sample mean proportion weight)
24450 224377 0 1 -5.07 3.56
CE4 Alternative customer efficiency measure (equal weight)
24450 224377 0 1 -4.28 3.87
profit Customer profitability (as measured by the bank)
23089 109428 9.65 117.07 -4,562.63 14,062.06
depart 1 if customer left the bank and zero otherwise
24450 224377 .05 .22 0 1
lnliabbal Liability balance (e.g. deposits) 24450 224377 8.19 2.52 0 17.43 lnastbal Asset balance (e.g. loans) 24450 224377 2.72 4.08 0 15.13 lninvbal Investment balance (e.g. mutual fund) 24450 224377 .62 2.37 0 16.15 lnatm ATM transactions 24450 224377 1.31 1.10 0 5.02 lnvru VRU transactions 24450 224377 .92 1.40 0 6.78 lntl Teller transactions 24450 224377 1.26 .82 0 5.66 lneb Internet/online banking transactions 24450 224377 .40 .97 0 6.07 lninq Account inquiry transactions (all channels) 24450 224377 1.67 1.36 0 6.79 lndep Deposit transactions (all channels) 24450 224377 1.25 .72 0 5.66 lnwd Withdrawal transactions (all channels) 24450 224377 1.72 .85 0 5.36 lnxfr Transfer transactions 24450 224377 .15 .42 0 3.33 tenure Length of relationship (years), tenure2 is the
square 24450 224377 9.63 7.72 0 35.52
eb-tenure Time since online banking initiated (years), eb-tenure2 is the square
24450 224377 2.23 .93 0 6.34
age Customer age, age2 is the square 24450 224377 47.21 15.59 18 90 ATM Count of ATMs in customer’s home zip
code area 24450 224377 1.65 1.92 0 14
branch Count of bank branches in customers’ home zip code area
24450 224377 1.13 1.42 0 9.00
web Has internet banking (1=yes, 0=no) 24450 224377 .36 .48 0 1 gender Gender (1=female, 0=male) 24450 224377 .80 .40 0 1 comp Interest in computers (1=yes) 24450 224377 .05 .21 0 1 children Has children at home 24450 224377 0-missing (69.25%); 1-no (11.73%); 2-yes
(19.02%) married Primary account holder is married 24450 224377 0-missing (33.18%); 1-no (33.71%); 2 –yes
(33.11%) income Annual household income (estimated) 24450 224377 0-missing (19.55%); 1-low (<=$40k) (19.18%),
2- medium ($40~75k) (24.87%), 3-high ( >=$75k)(26.39%)
education Education level of primary account holder 24450 224377 0-missing (87.3%); 1-high school, vacation or technology school (4.54%), 2-college (5.06%), 3-graduate school (3.1%)
Each observation (“obs.”) is a subject in a month. All variables can potentially vary over time except demographic variables (gender, comp, children, married, income, education), and physical channel availability (ATM, branch).

42
Table 2: Channel Use Analysis
(1) (2) (3) (4) (5) Teller Channel VRU Channel ATM Channel ACH Channel Online Banking lntl lnvru lnatm lnach lneb
lninq .050 .832 .130 .181 (.003)** (.004)** (.004)** (0.010)** lnwd .153 .612 .331 .124 (.006)** (.006)** (.005)** (0.016)** lndep .436 .129 .454 (.007)** (.008)** (.006)** lnxfr .452 .737 (.012)** (0.023)** age .021 -.006 -.009 -.007 -.026 (.001)** (.002)** (.002)** (.001)** (0.005)** age2 -.0002 .00005 -.00001 .0001 .0002 (.00001)** (.00002)** (.00002) (.00001)** (.00005)** comp -.005 -.035 .010 .010 .093 (.020) (.026) (.025) (.020) (.062) college -.033 -.052 .087 .006 -.048 (.027) (.035) (.031)** (.024) (.086) graduate -.123 -.123 .153 .018 .060 (.030)** (.040)** (.036)** (.029) (.101) tenure -.012 .015 -.008 .025 -.010 (.00173)** (.002)** (.002)** (.002)** (.006) tenure2 .0004 -.0003 -.00001 -.0006 .0002 (.00006)** (.00007)** (.00007) (.00005)** (.0002) eb_tenure -.053 .101 .019 .102 -.365 (.013)** (.020)** (.015) (.012)** (.025)** eb-tenure2 .003 -.030 -.014 -.017 .093 (.002) (.004)** (.003)** (.002)** (.005)** ATM -.008 -.006 .020 -.004 -.011 (.003)** (.004) (.003)** (.003) (.009) branch -.011 -.015 .032 -.021 .031 (.003)** (.005)** (.004)** (.003)** (.011)** web -.128 -.379 -.191 .132 (.022)** (.0274)** (.024)** (.021)** Med-income -.005 -.025 .002 .026 .133 (.012) (.014) (.013) (.010)* (.036)** High-income -.020 -.071 .006 .022 .281 (.012) (.015)** (.013) (.011)* (.036)** gender -.091 -.023 .044 .045 .155 (.018)** (.023) (.020)* (.016)** (.055)** children .059 -.005 -.015 .021 -.143 (.016)** (.021) (.019) (.015) (.053)** married -.057 -.039 .106 -.044 -.021 (.011)** (.014)** (.013)** (.010)** (.036) Dummy Variables
State, Month State, Month State, Month State, Month State, Month
Observations 224377 224377 224377 224377 224377 R-squared .26 .63 .53 .46 Each column represents a separate regression. The column header is the dependent variable. Huber-White robust standard errors are shown in parenthesis. * - p<.05, ** - p<.01. Dummy variables for missing data (children, married, income, married, and education) are also included (not shown). All models are significant with p< .001. None of the

43
regression coefficients are standardized. Three decimal places are used unless to have more decimal places is necessary (e.g. the coefficients and standard errors of “age2” and “tenure2”).
Table 3: Customer Efficiency Measure and Correlates
(1) (2) (3) (4) Customer-specific
Weights VRU Included Sample Mean
Weights Equal Weights
CE1 CE2 CE3 CE4 age -.003 -.005 -.021 -.018 (.002) (.002)* (.00207)** (.002)** age2 -.00003 -.00002 .00009 .00006 (.00002) (.00002) (.00002)** (.00002)** comp -.002 -.014 .034 .023 (.027) (.027) (.029) (.029) college .044 .024 .107 .116 (.036) (.037) (.039)** (.039)** graduate .105 .061 .235 .235 (.042)* (.043) (.043)** (.043)** tenure .006 .016 .015 .022 (.002)* (.002)** (.003)** (.002)** tenure2 -.0003 -.0006 -.0006 -.0008 (.00007)** (.00007)** (.00009)** (.00008)** eb_tenure .092 .114 .093 .114 (.020)** (.021)** (.018)** (.018)** eb-tenure2 -.028 -.033 -.021 -.025 (.004)** (.004)** (.003)** (.003)** web -.528 -.446 -.304 -.383 (.029)** (.029)** (.031)** (.0309)** Dummy Variables State, Month State, Month State, Month State, Month Observations 224377 224377 224377 224377 R-squared .07 .05 .04 .05 Each column represents a separate regression. The column header is the dependent variable. Huber-White robust standard errors are shown in parenthesis. * - p<.05, ** - p<.01. Dummy variables for missing data (education) are also included (not shown). All models are significant with p< .001. None of the regression coefficients are standardized. Three decimal places are used unless to have more decimal places is necessary (e.g. the coefficients and standard errors of “age2” and “tenure2”).

44
Table 4: Customer Efficiency and Profit
(1) Baseline
(2) Transaction type control
(3) Channel Control
(4) Fixed Effects
profit profit profit profit CE1 4.963 5.522 -2.796 6.638 (.674)** (0.679)** (1.108)* (.652)** CE1 squared -.204 -.171 -.666 .041 (.228) (.229) (.226)** (.213) age -.356 -.228 -.177 (.180)* (.178) (.180) age2 .007 .004 .003 (.002)** (.002)* (0.002) comp 1.136 .418 .570 (2.102) (2.079) (2.082) college 3.752 4.111 3.765 (2.911) (2.868) (2.885) graduate 12.119 11.817 11.117 (3.477)** (3.426)** (3.437)** tenure 2.726 2.975 2.736 15.589 (.227)** (.229)** (.229)** (6.956)* tenure2 -.064 -.072 -.066 -.386 (.007)** (.007)** (.007)** (.073)** eb_tenure 20.872 20.756 19.418 36.381 (1.887)** (1.872)** (1.884)** (3.841)** eb-tenure2 -3.669 -3.531 -3.419 -5.260 (.356)** (.351)** (.358)** (.619)** ATM -.268 -.166 -.406 (.460) (.456) (.467) branch 2.665 2.573 2.623 (.535)** (.530)** (.537)** web 16.828 19.012 15.120 55.139 (2.213)** (2.231)** (2.257)** (6.532)** Med-income 2.002 2.178 2.077 (1.160) (1.149) (1.151) High-income 15.958 15.815 15.785 (1.628)** (1.630)** (1.615)** gender 2.384 3.799 2.400 (2.122) (2.101) (2.101) children .144 1.076 .718 (1.985) (1.963) (1.967) married 2.117 2.215 1.442 (1.426) (1.413) (1.431) lninq -3.802 1.527 (.424)** (.577)** lnwd -7.449 -2.554 (.865)** (.834)** lndep 5.890 -4.747 (.869)** (.897)** lnxfr -7.276 -5.127 (1.175)** (1.357)** lntl -12.806 (1.159)** lnatm -2.038 (.732)** lneb -6.926 (.910)** lnach 8.554 (.818)** lnvru -3.377 (.355)** Observations 109428 109428 109428 109428 R-squared .02 .03 .03 .02
Each column represents a separate regression. The column header is the dependent variable. Huber-White robust standard errors are in parenthesis except for the fixed effects regression. * - p<.05, ** - p<.01. A constant and dummy variables for missing data (income, gender, married, education) are also included (not shown), state and month are also included. Sample size is reduced since

45
profit is only available every two months. All models are significant with p< .001. None of the regression coefficients are standardized. Three decimal places are used unless to have more decimal places is necessary (e.g. the coefficients and standard errors of “age2” and “tenure2”).

46
Table 5: Customer Efficiency and Attrition
(1) Baseline
(2) Transaction type
control
(3) Channel Controls
depart depart depart CE1 -.067 -.034 -.187 (.024)** (.025) (.036)** CE1 squared .035 .026 .025 (.008)** (.008)** (.009)** age -.049 -.048 -.047 (.010)** (.010)** (.010)** age2 .0003 .0003 .0003 (.0001)** (0.0001)** (.0001)** comp -.139 -.134 -.135 (.199) (.199) (.199) college -.066 -.065 -.069 (.226) (.225) (.226) graduate .252 .265 .254 (.254) (.255) (.255) tenure -.081 -.070 -.073 (.013)** (.014)** (.014)** tenure2 .002 .001 .001 (.0006)** (.0006)* (.0006)* eb_tenure .247 .258 .251 (.094)** (.094)** (.095)** eb-tenure2 -.039 -.039 -.038 (.019)* (.0192)* (.019) ATM .016 .017 .011 (.02) (.020) (.021) branch .060 .066 .057 (.023)** (.023)** (.023)* web .089 .128 .132 (.143) (.144) (.146) Med-income -.001 .010 .008 (.083) (.083) (.083) High-income -.084 -.059 -.066 (.088) (.088) (.088) gender -.115 -.094 -.102 (.118) (.118) (.119) children -.221 -.235 -.218 (.144) (.144) (.144) married .561 .550 .526 (.092)** (.092)** (.093)** lninq .029 (.024) lnwd -.034 (.033) lndep -.223 (.038)** lnxfr -.117 (.069) lntl -.216 (.047)** lnatm .063 (.033) lneb -.119 (.039)** lnach -.116 (.041)** lnvru .019 (.021) Dummy Variables Month, State Month, State Month, State Observations 224377 224377 224377
Each column represents a separate logistic regression. The column header is the dependent variable. Huber-White robust standard errors are in parenthesis. * - p<.05, ** - p<.01. Dummy variables for missing data (income, gender, married) are also included (not

47
shown). All models are significant with p< .001. None of the regression coefficients are standardized. Three decimal places are used unless to have more decimal places is necessary (e.g. the coefficients and standard errors of “age2” and “tenure2”).
Table 6: Customer Efficiency and Product Use (1)
Liabilities: OLS
(2) Liabilities: Fixed Effects
(3) Assets: OLS
(4) Assets: Fixed Effects
(5) Investments: OLS
(6) Investments: Fixed Effects
lnliab lnliab lnast lnast lninv lninv CE1 .393 .645 .050 .286 -.006 .042 (.018)** (.005)** (.0231)* (.008)** (.01) (.004)** CE1 squared -.235 -.236 -.050 -.100 -.020 -.011 (.006)** (.002)** (.008)** (.003)** (.004)** (.001)** age .018 .100 .015 (.005)** (.008)** (.005)** age2 .00002 -.001 -.00009 (.00005) (.00007)** (.00005) comp .056 -.12 .097 (.065) (.132) (.096) college .162 .125 .024 (.084) (.169) (.118) graduate .466 .087 .013 (.094)** (.195) (.137) tenure .146 -.785 .131 -.389 .069 -.051 (.006)** (.032)** (.010)** (.050)** (.006)** (.022)* tenure2 -.003 .0001 -.003 -.012 -.002 .007 (.0002)** (.0006) (.0004)** (.001)** (.0002)** (.0004)** eb_tenure .037 .211 .254 .320 .136 .015 (.043) (.032)** (.083)** (.051)** (.052)** (.023) eb-tenure2 .005 .031 -.026 -.045 -.016 .010 (.008) (.005)** (.016) (.008)** (.010) (.004)** ATM -.005 -.007 -.009 (.010) (.017) (.012) branch .114 -.027 .036 (.012)** (.021) (.016)* web .211 .947 .348 .755 .167 .086 (.066)** (.054)** (.129)** (.086)** (.072)* (.039)* Med-income .451 .419 .160 (.037)** (.068)** (.041)** High-income .867 .674 .369 (.038)** (.072)** (.046)** female -.033 .322 -.027 (.063) (.100)** (.064) children -.300 .005 -.074 (.052)** (.104) (.070) married -.232 -.557 .031 (.036)** (.068)** (.04) Dummy Variables
Month, State Month, State Month, State Month, State Month, State Month, State
Observations 224377 224377 224377 224377 224377 224377 R-squared .17 .12 .07 .09 .03 .05

48
Each column represents a separate regression. The column header is the dependent variable. Huber-White robust standard errors are in parenthesis except for the fixed effects regressions. * - p<.05, ** - p<.01. A constant and dummy variables for missing data (income, gender, married, education) are also included (not shown), state and month are also included. All models are significant with p < .001. None of the regression coefficients are standardized. Three decimal places are used unless to have more decimal places is necessary (e.g. the coefficients and standard errors of “age2” and “tenure2”).