Current Use of Geographic Information Systems in Transit...
14
TRANSPORTATJON RESEARCH RECORD 1349 93 Current Use of Geographic Information Systems in Transit Planning CAROL L. SCHWEIGER The advent of geographic information systems (GIS) has facili- tated the incegration of data with geogrilphic element t perform analy is in a variety of disciplines, including transportation. The unique ability of GI to handle complex pacial relation hip, make it a natural rool t u e in the planning and analy i f transportation ·ystems, specifically public I ransportation systems. The current use of GIS technology in public transit agencies and metropolitan planning organization (MPOs for transportation planning and a1rn lysis was investigated . A total of 74 telephone interview were conducted with 67 organization aero 30 states- 46 transit agencies (including both operators and oversight agen- cie ) and 21 MPOs. Of the transit agencies and MP contacted, most were located in the 30 largest metropolitan areas in th e United States (based on the 1990 Census). However, several small transit agencies (having less than 50 buses) and MPO were con- tacted to provide a broad r view of GIS u e in transit planning practice. The results of this inve ti ga ti on h w that GlS i cur- rently being used or being implemented for a wide variety of appljcations, in a wide variety of organizational euing , and for a wide variety of reasons. The implementation of GI for transit is driven primarily by two fact .rs : budget and the need l'O in- tegrate data from severnl sources to perform comprehensive anal- yses. Another significant issue is the use of spatial data , which often requires a igniucant "clean-up" activity tbat has to ta.ke place before the data are fully usable. Geographic information systems (GIS) is a rapidly developing field of information management that enables users to store, retrieve, edit, manipulate, and graphically display spatially referenced data, and to integrate such data from multiple data bases using both topological and attribute information. GIS has the potential to significantly increase the quality of urban transportation planning data while reducing the cost of data collection and preparation by enabling transit and other local agencies to share and use each other's data bases. The purpose of this study was to explore the benefits and obstacles to the use of GIS in transit planning. Specifically, this study investigated the current use of GIS in transit plan- ning. The major objectives of the investigation were to identify • The current penetration of GIS technology into transit planning practice, • The major issues and problems faced by these agencies in adopting GIS technology, and • Specific GIS software products currently being used by transit agencies and their rationale for using them. EG&G Dynatrend, Inc., 21 Cabot Road, Woburn, Mass. 01801. DEFINITION OF GIS GIS has been defined in many ways by the "experts" in the field. The following definition combines those previous def- initions by presenting the two most important characteristics of GIS that separate it from other computerized graphical systems: A GIS is a tool that provides data base management capabil- ities (including capture electi n, storage, editing, querying, retrieval, and reporting (unction. ) for and di play of patial data, and provides the ability to perform analysis of geographic features (points , lines, and polygon) ba.ed on their explicit relationship to each other. An important concept that makes GIS different from other computerized graphical systems is topology. Topology is de- fined (1) as the spatial relationships between connecting or adjacent spatial objects (e.g., points, lines, and polygons). Topological relationships are built from simple elements into complex elements: points (simplest elements), lines (sets of connected points), and polygons (closed sets of connected lines). For example, the topology of a line includes its "from" and "to" points and its left and right polygons. GIS has the ability to extract information from one layer of topology, based on its relationship to another layer, and to integrate information from various topological layers based on their relationships to each other. GIS is the most sophisticated member of a family of com- puterized graphical systems that have varying degrees of ca- pabilities in data base management and spatial functions. This family of graphical systems consist of •Computer-aided drafting and design (CADD), •Automated mapping (AM), • Thematic mapping, and • GIS-raster-based GIS and vector-based GIS. According to Huxhold (2, p. 35), CADD systems provide the ability to interact with a visual image of a drawing by creating, editing, and manipulating lines S)• mbol , and text. Automated map- ping software generally ha the same functions as CADD soft- ware · however, ADD sy tcm arc normally used for arc hi- tectural and engineering drawing , while automated mapping is used for mapping. An example of an applicat i on or auto- mated mapping is di ·playing vehicle locations on ao electronic map as part of an automated vehicle location (A VL) y tern .
Transcript of Current Use of Geographic Information Systems in Transit...
TRANSPORTATJON RESEARCH RECORD 1349 93
Current Use of Geographic Information Systems in Transit Planning
CAROL L. SCHWEIGER
The advent of geographic information systems (GIS) has facilitated the incegration of data with geogrilphic element t perform analy is in a variety of disciplines, including transportation . The unique ability of GI to handle complex pacial relation hip, make it a natural rool t u e in the planning and analy i f transportation ·ystems, specifically public I ransportation systems. The current use of GIS technology in public transit agencies and metropolitan planning organization (MPOs for transportation planning and a1rn lysis was investigated . A total of 74 telephone interview were conducted with 67 organization aero 30 states-46 transit agencies (including both operators and oversight agencie ) and 21 MPOs. Of the transit agencies and MP contacted, most were located in the 30 largest metropolitan areas in the United States (based on the 1990 Census) . However, several small transit agencies (having less than 50 buses) and MPO were contacted to provide a broad r view of GIS u e in transit planning practice . T he results of this inve tigation h w that GlS i currently being used or being implemented for a wide variety of appljcations, in a wide variety of organizational euing , and for a wide variety of reasons. The implementation of GI for transit is driven primarily by two fact .rs: budget and the need l'O integrate data from severnl sources to perform comprehensive analyses. Another significant issue is the use of spatial data , which often requires a igniucant "clean-up" activity tbat has to ta.ke place before the data are fully usable.
Geographic information systems (GIS) is a rapidly developing field of information management that enables users to store, retrieve, edit, manipulate, and graphically display spatially referenced data, and to integrate such data from multiple data bases using both topological and attribute information . GIS has the potential to significantly increase the quality of urban transportation planning data while reducing the cost of data collection and preparation by enabling transit and other local agencies to share and use each other's data bases.
The purpose of this study was to explore the benefits and obstacles to the use of GIS in transit planning. Specifically, this study investigated the current use of GIS in transit planning. The major objectives of the investigation were to identify
• The current penetration of GIS technology into transit planning practice,
• The major issues and problems faced by these agencies in adopting GIS technology, and
• Specific GIS software products currently being used by transit agencies and their rationale for using them.
EG&G Dynatrend, Inc., 21 Cabot Road, Woburn, Mass. 01801.
DEFINITION OF GIS
GIS has been defined in many ways by the "experts" in the field. The following definition combines those previous definitions by presenting the two most important characteristics of GIS that separate it from other computerized graphical systems:
A GIS is a tool that provides data base management capabilities (including capture electi n, storage, editing, querying, retrieval, and reporting (unction. ) for and di play of patial data, and provides the ability to perform analysis of geographic features (points , lines, and polygon) ba.ed on their explicit relationship to each other.
An important concept that makes GIS different from other computerized graphical systems is topology. Topology is defined (1) as the spatial relationships between connecting or adjacent spatial objects (e.g., points, lines, and polygons). Topological relationships are built from simple elements into complex elements: points (simplest elements), lines (sets of connected points), and polygons (closed sets of connected lines). For example, the topology of a line includes its "from" and "to" points and its left and right polygons. GIS has the ability to extract information from one layer of topology, based on its relationship to another layer, and to integrate information from various topological layers based on their relationships to each other.
GIS is the most sophisticated member of a family of computerized graphical systems that have varying degrees of capabilities in data base management and spatial functions. This family of graphical systems consist of
•Computer-aided drafting and design (CADD), •Automated mapping (AM), • Thematic mapping, and • GIS-raster-based GIS and vector-based GIS.
According to Huxhold (2, p. 35), CADD systems provide the ability
to interact with a visual image of a drawing by creating, editing, and manipulating lines S)•mbol , and text. Automated mapping software generally ha the same functions as CADD software· however, ADD sy tcm arc normally used for architectural and engineering drawing , while automated mapping is used for mapping. An example of an applicat ion or automated mapping is di ·playing vehicle locations on ao electronic map as part of an automated vehicle location (A VL) y tern.
94
Again, Huxhold (2, p. 35, p. 27) states:
Functions specific to mapping include: coordinate transforma1ion. map , calc conversion, coordinate geometry, edgcmatching and other rclmcd geometric ope.rations . .. . An enhancement to automated mapping system is the automated mapping and fllcilitic management ( 1\11/FM) sy tcm. AMJ FM sy ·terns utilize a databa c capability to store additional information about the mapped objects (physical features uch as water valves, gas mains. metcL. transformers, etc.) and link those data to rhc map informali n, but genernlly do not include spatial analy i.s capabilities or topological data structures uch as those found in GIS.
Thematic mapping can add colors, labels, and other identifying features LU map entities based on attributes [ descnpt1ve characteristics of a feature (2)1 a ociated with that entity. Thu as the term suggests, tll •matic mapping emphasizes a particular theme on the map by focusing attention on specific attributes of the map entities.
GIS differs from those other graphical sy tern in its ability to handle both attributes and topology. There are 1wo types of GIS tha t handle altribut and topology differently: vectorbased and raster-based GIS . (The majority of GIS applications in transit planning are vector based.) Vector-based GIS (J) represents map features by x,y coordinates. Attributes are associated with the feature, as opposed to a raster-based GIS, in which attributes are associated with a grid cell (an individual point). Thus, vector-based GIS deals explicitly with topology, whereas raster-based does not.
Overall functional capabilities of GIS consist of data capture, storage and maintenance, and analysis and output. Data capture can be digitized or performed using graphical data from existing sources and attribute data from existing files or manually entered. Data storage and management consist of file management and editing. Data analysis consists of data base query, spatial analysis, and modeling. Data output can be generated in the form of maps and reports.
STUDY APPROACH
The approach to performing this investigation was first to design a set of questions (initially developed by GIS/Trans, Ltd.) to be a. ked during a telephone interview, and to develop a list of trnn it ag ncies and Metrop litan Planning Org:mizations (MPOs) that would be contacted. The final set of questions asked during the telephone interviews is shown in Figure 1.
A list of potential contacts was developed by identifying transit agencie a.nd MPOs in the 30 largest metropolitri n area$ in the United States (based on the 1990 Census). To provide a broader view of GIS use in transit planning, several small transit agencies (having less than 50 buses) and MPOs were added to the list. Appropriate contacts within those organizations were identified either before the interview or by the organization during initial contact. The final list of transit agency and MPO contacts is shown in Table 1, along with the respective 1990 population, and the size with respect to number of transit vehicles . (Because of time constraints, not all transit agencies and MPOs in the 30 largest metropolitan areas were contacted.)
TRANSPORTATION RESEARCH RECORD 1349
Next, three "pilot" interviews were conducted with New York City Transit Authority, Omaha-Council Bluffs MPO, and Southern California Rapid Transit District, all of which were selected from the list of contacts. Based on the results of the pilot interviews, the full set of telephone interviews was conducted. The results of the interviews were reviewed and analyzed and appear below. A Federal Transit Administration (Ff A) report entitled Current Use of Geographic Information Systems (3) contains a complete presentation of the results.
SUMMARY OF DATA COLLECTED
During the telephone interviews, data were collected in the following categories:
• Current use of GIS in terms of application areas, software, and perceived problems and benefits;
• Spatial data resources in terms of data types, sources, quality, and clean-up time;
• Knowledge of other agencies active in GIS; • GIS implementation plans in terms of potential applica
tion areas, potential software, organizational issues, and training; and
•The interviewee's definition of GIS was not being used.
USE OF GIS IN TRANSIT PLANNING
A total of 74 telephone interviews were conducted with 67 various organizations across 30 states-46 transit agencies (including 40 operators and 6 oversight agencies) and 21 MPOs. Of the 67 organizations interviewed, 36 currently claim to have GIS. Of the 46 transit agencies, 21 have GIS ( 46 percent), and of the 21 MPOs, 15 have GIS (71 percent). These figures represent a significant use of GIS, particularly in MPOs, which do more than just transportation analysis. Generally, the current use of GIS in transit agencies is based on the need to integrate data from various sources to perform comprehensive transit planning and analysis. The current use of GIS in MPOs is based on wider requirements for areas such as land use planning, population and employment projections, zoning analysis, and growth management.
Current Range of Applications
GIS is currently being used in many transit planning applications by transit agencies and MPOs. However, in most cases, GIS is not being used as a substitute for analytical modeling, which is an integral part of most planning activities; rather, it is being used as a tool to augment the modeling. The following are five major application areas in which GIS is being used (the number of organizations claiming to use GIS in the application area is in parentheses):
1. Transit analysis (30): - Transit ridership forecasting is an important component
of the traditional four-step transportation planning process

1. Interviewer:
2. Date of contact:
3. Name of organization:
4. Initial Contact:
Name: Title: Address: Phone Number:
A. CURRENT USE OF GIS
1. Does your agency currently use GIS? (Yes/No) (If "No," skip to Section B.)
2. In which areas of your organization is GIS used? (Refer to list of potential application areas.)
List of potential application areas:
• Transit ridership forecasting, service planning, market analysis
• Transit scheduling and run-cutting
• Map products design & publishing (for example: system maps, route schedules and maps, operator maps)
• Telephone-based customer information services
• Ridematching (for car & van pools)
• Transit pass sales
• Fixed-route transit dispatching
• Automatic vehicle location
• Paratransit scheduling & dispatching
• Fixed facilities and real estate management (for example: bus stops, transit stations, park & ride lots)
• Police operations
• Any other functional areas?
3. Which GIS product(s) do you use in these areas? (Try to obtain model and version number, if this is known.)
List of GIS (and related) products:
• ARC/INFO • Intergraph • Intergraph • Caliper Corp. (TransCAD, GIS Plus) • McDonnell Douglas (GDS) • GS (GeoSQL) • Maplnfo • Atlas • GeoVision • SPANS • AutoCAD • EMME/2 • TRANPLAN • Others?
FIGURE 1 Interview questions. (continued on next page)

4. Why did you choose this product?
5. When was the product installed?
6. How has GIS use benefitted your organization?
7. What problems have been encountered with its use?
8. What improvements would you like to see to your GIS capabilities?
9. Are you presently considering expansion of your GIS capabilities?
10. How many individuals in your organiution have GIS training?
11. How many individuals in your organization have GIS as part of their job title or job description?
B. SPATIAL DATA RESOURCES
1. Do you have street network data for your service area stored on computer?
2. What is the source of this data?
List of potential data sources:
• DIME (1980 U.S. Census) • TIGER (1990 U.S. Census) • U.S. Geological Survey (Digital Line Graphs) • ETAK • State DOTs • Other sources? • Digitized in-house
3. How much staff time have you devoted to cleaning and correcting this data?
4. What is your appraisal of this data's current quality?
5. Do you have any transit system data stored on computer?
6. What types of data are stored electronically?
List of Lransit system data types:
• Rail transit routes • Bus transit routes • Rights-of-way • Bus stops • Bus timepoints • A VL signposts • Traffic signals (e.g., vehicle-actuated signals) • Transit stations • Park-and-ride lots • Vehicle maintenance and storage facilities (e.g., bus garages, rail vehicle shops, yards, etc.) • Political boundaries • Traffic analysis zone boundaries • Census tract boundaries • Accident locations • Incidents requiring police response • Other data?
7. Does this computer-based data include graphical location information? (For example, latitude & longitude coordinates, digiliz.cr inches)
C. OTHER ACTIVE AGENCIES
1. Do you know of any other transit agencies or MPOs who are presently using or considering implementation of GIS?
FIGURE 1 (continued)

Schweiger 97
2. Who may I contact in these agencies?
Name: Title: Organization: Phone Number:
D. GIS IMPLEMENTATION PLANS
1. Aro you presently considering implementation of OIS for any (other) applications within your organization? (Yes/No) (If "No " skip to end of interview.)
2. Which areas are you considering for implementation of GIS (Refer to list of potential application areas.)
3. Do you already have a particular GIS product in mind for application? (Yes/No) Which product? (Try to obtain model and version number, if this is known.)
4. For what reasons are you considering GIS implementation at the present time?
5. Aie you considering a pilot study to introduce GIS to your organization?
6. Aie you presently developing an organization-wide GIS implementation plan?
7. What obstacles do you anticipate facing in the implementation of GIS?
8. Aie you considering sending any staff to introductory training or workshops on GIS?
9. What department do these personnel work in?
FIGURE 1 (continued)
(trip generation , tri1 discribution modal split and network a ·signment). 'Transit patronage forecasts are the product of a cquence of models used to analyze and predic1 aggregate travel volume in an urban area , the geographic distribution of trip-making , the level of tran ·it travel in specific corridors, and ultimately, patronage on individual routes or services" (4, p. 22).
- Service planning refers to the design and analysis of transit ervice, including route structure (network), headway , tation paci11g and service type (e.g. express service). For an existjng transit system, ervice planning would include the design and analysi · of modification to the existing service.
-Market analysis is the examination of demographic characteristics, such as population, employment, and vehicle owner hip, in relation to the transit service being provided. Market or demographic analysis is also an integral part of the four-step planning process, particularly in performing trip generation and modal split. 2. Design and publication of map product · (21). De. ign
and publication of map product refers to the creation and printing of map used for transit planning and operations. Example include tran it y tem maps, maps showing demographic information for a particular service area, tran il route map , and maps for transit operators (i.e., bu driver ).
3. Facilities/land management (16). Facilitic ·/land management refers to the ability to manage facilities and real estate based on several characteristics, including location, inventory, and condition. Facilities can be either fixed, such as rail storage yards, transit stations, park-and-ride lots, and bus stops, or mobile, such as tran it stop signs and maps. Real estate management can involve additional characteristics such as owner, lessor, and land use.
4. Telephone-based customer information services (7). Telephone-based customer information services can a ist tran it rider in their u e of transit services by providing information over the telephone. The information given to the cu tomer can be generated by computer oftware (e.g. a GIS) .
5. Transit scheduling and run-cutting (6). Tran ·it cheduling and run-cutting refer to those activities necessary to develop schedule for the operation of transit vehicles. Specifically, run-cutting is " the proces oforganizing all cheduled trips operated by a transit system into runs" (4 p. 110).
Comments of Transit Agencies and MPOs About Current Use of GIS
A number of comments were made by transit agencies and MPOs regarding their current use of GIS in tran it planning follow. For example, NYCTA commented that GIS has enabled it to analyze and track propo. ed capital inve tment and to produce map howing demographic trip, and other information together. Further, the NYCTA is using Gr in the analysis of rapid tran it modification and improved transfer point and connection .
In Houston, both Houston Metro and Houston-Galveston Area Council (H-GAC) are performing transit ridership forecasting, ervice planning, and market analysis u ing the ame oftware (Houston Metro's GIS transit applications are cur
rently under development). However , H-GAC i doing ser· vice planning for areas out. ide of Houston Metro's boundaries . H-GAC i using GIS to enhance , not replace, foreca ting model (by developing inputs to the models) and to display the results. Th primary benefit to using GI i its visual capability, according to Houston Metro. " We pend a lot of
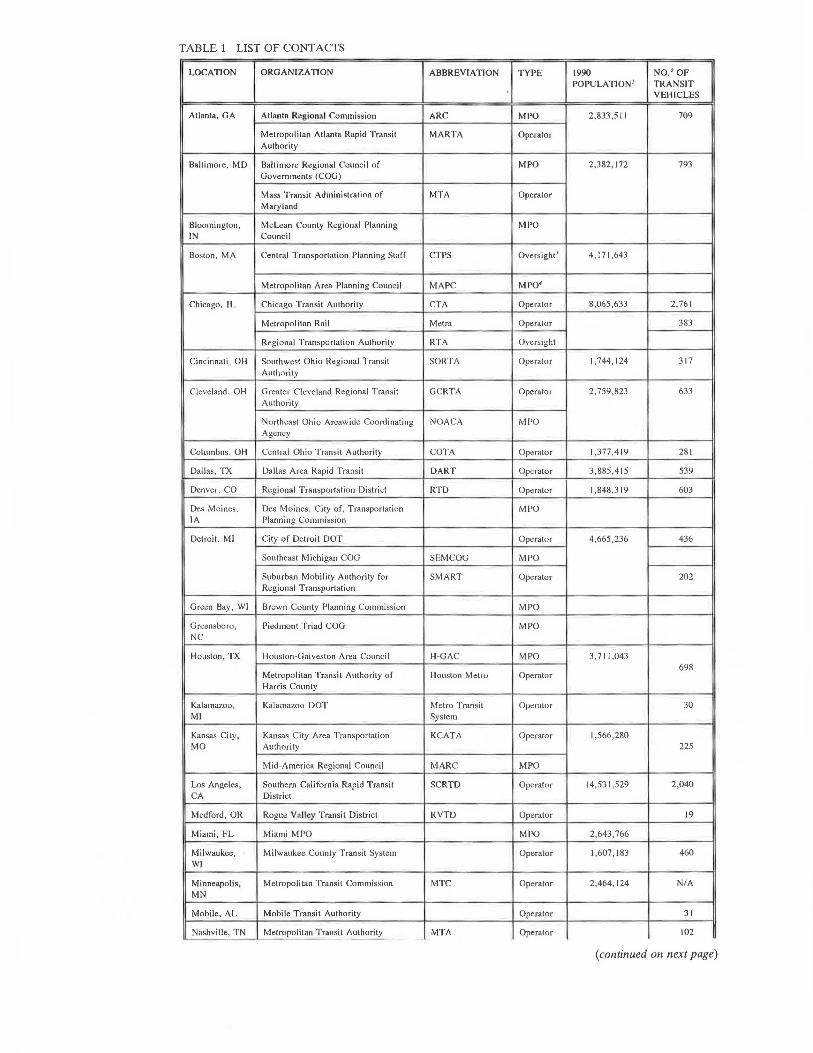
TABLE 1 LIST OF CONTACTS
LOCATION ORGANIZATION ABBREVIATION TYPE 1990 N0. 2 OF POPULATION' TRANSIT
VEHICLES
Atlan1a, GA Atlanta Region"! Commission ARC MPO 2,833,5 t t 709
Metropolitan Atlanta Rapid Transit MARTA Operator Authority
Baltimore. MD Baltimore Regional Council of MPO 2,382, I 72 793 Governmenls (COG)
Mass Transit Administration of MTA Operator Maryland
Bloomington, McLean County Regional Planning MPO IN Council
Boston. MA Central Transportation Planning Staff CTPS Oversight' 4, 171,643
Metropolitan Area Planning Council MAPC MPO'
Chicago, IL Chicago Transit Authority CTA Operator 8,065 ,633 2,761
Melropolitan Rail Metra Operator 383
Regional Transporlation Aulhorily RTA Oversight
Cincinnali, OH Soulhwest Ohio Regional Transit SORTA Operator 1,744, 124 317 Aulhmily
Cleveland , OH Grealer Cleveland Regional Transit GCRTA Operator 2, 759,823 633 Aulhority
Northeasl Ohio Areawide Coordinating NOA CA MPO Agency
Columbus , OH Central Ohio Transil Authority COTA Operator 1,377,419 281
Dallas, TX Dallas Area Rapid Transit DART Operator 3,885,415 539
Denver, CO Regional Transportation District RTD Operator 1,848,319 603
Des Moines, Des Moines, City of, Transportation MPO IA Planning Commission
Detroit, Ml City of Detroit DOT Operator 4,665,236 436
Southeast Michigan COG SEMCOG MPO
Suburban Mobility Authority for SMART Operator 202 Regional Transportation
Green Bay, WI Brown County Planning Commission MPO
Greensboro, Piedmont Triad COG MPO NC
Houston , TX Houston-Galveston Area Council H-GAC MPO 3,71 t ,043 698
Metropolitan Transit Authority of Houston Mellu Operator Harris County
Kalamazoo, Kalamazoo DOT Metro Transit Oµ~rnlor 30 MI System
Kansas City, Kansas City Area Transportation KCATA Operator 1,566 ,280 MO Authority 225
Mid-Ameri ca Regional Council MARC MPO
Los Angeles, Southern California Rapid Transit SCRTD Operator 14,531 ,529 2,040 CA District
Medford, OR Rogue Vnlley Transit District RVTD Operator 19
Miami, FL Miami MPO MPO 2,643, 766
Milwaukee, Milwaukee County Transit System Operator 1,607, 183 460 WI
Minneapolis, Metropolitan Transit Commission MTC Operator 2,464,124 N/A MN
Mobile, AL Mobile Transit Authority Operator 31
Nashville, TN Metropolitan Transit Authority MTA Operator 102
(continued on next page)
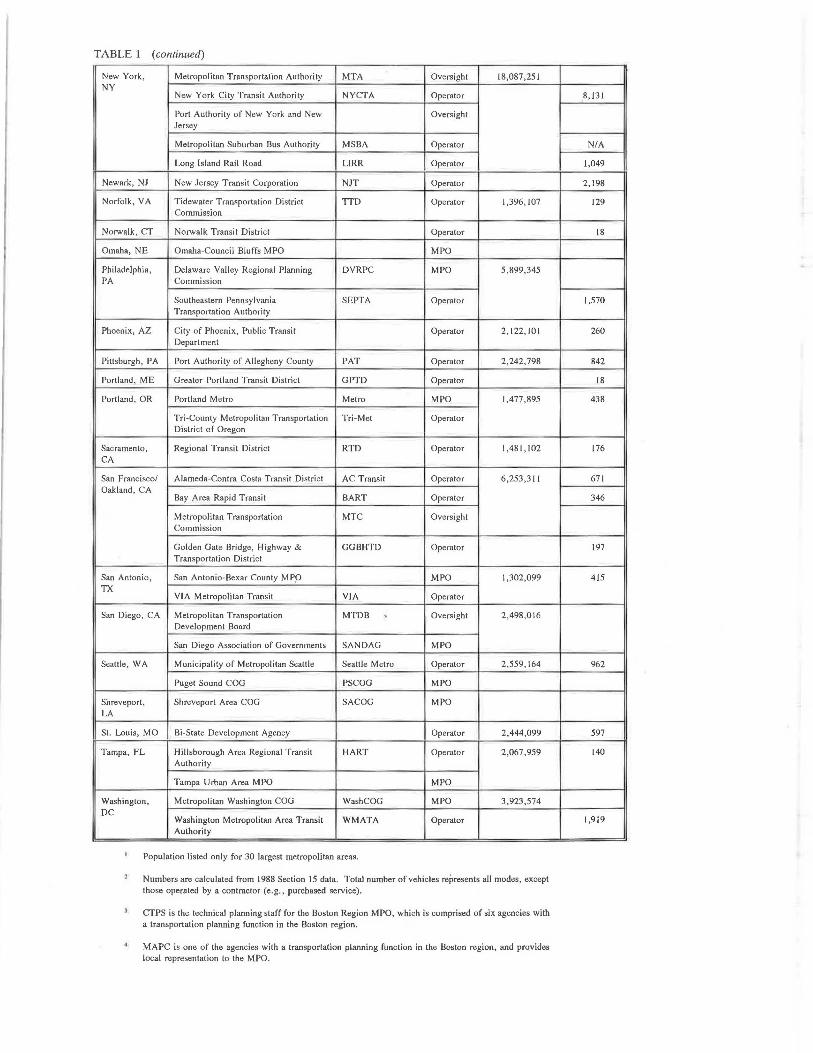
TABLE I (continued)
New York, Metropolitan Transportation Authority MTA Oversight 18,087,251 NY
New York City Transit Authority NYCTA Operator
Port Authority of New York and New Oversight Jersey
Metropolitan Suburban Bus Authority MSBA Operator
Long Island Rail Road LIRR Operator
Newark, NJ New Jersey Transit Corporation NJT Operator
Norfolk, VA Tidewater Transportation District TTD Operator 1,396, 107 ComnUssion
Norwalk, CT Norwalk Transit District Operator
Omaha, NE Omaha-Council Bluffs MPO MPO
Philadelphia, Delaware Valley Regional Planning DVRPC MPO 5,899,345 PA Commission
Southeastern Pennsylvania SEPTA Operator Transportation Authority
Phoenix , AZ City of Phoenix, Public Transit Operator 2, 122,101 Department
Pittsburgh , PA Port Authority of Allegheny County PAT Operator 2,242,798
Portland, ME Greater Portland Transit District GPTD Operator
Portland, OR Portland Metro Metro MPO I ,477,895
Tri-County Metropolitan Transportation Tri-Met Operator Distri ct of Oregon
Sacramento, Regional Transit District RTD Operator 1,481 , 102 CA
San Francisco/ Alameda-Contra Costa Transi t District AC Transit Operator 6,253,3 l I Oakland, CA
Bay Area Rapid Transit BART Operator
Metropolitan Transportation MTC Oversight Commission
Golden Gate Bridge, Highway & GGBHTD Operator Transportation District
San Antonio, San Antonio-Bexar County MP!) MPO I ,302,099 TX
VIA Metropolitan Transit VIA Operator
San Diego, CA Metropolitan Transportation MTDB Oversight 2,498,016 Development Board
S;m Diego Association of Governments SAN DAG MPO
Seattle, WA Municipality of Metropolitan Seattle Seattle Metro Operator 2,559, 164
Puget Sound COG PSCOG MPO
Shreveport, Shreveport Area COG SA COG MPO LA
St. Louis, MO Bi-State Development Agency Operator 2,444,099
Tampa, FL Hillsborough Area Regional Transit HART Operator 2,067 ,959 Authority
Tampa Urban Area M PO MPO
Washington, Metropolitan Washington COG WashCOG MPO 3,923,574 DC
Washington Metropolitan Area Transit WMATA Operator Authority
Population listed only for 30 largest metropolitan areas.
Numbers are calculated from 1988 Section 15 data. Total number of vehicles represents all modes, except those operated by a contractor (e.g., purchased service).
CTPS is the technical planning staff for the Boston Region MPO, which is comprised of six agencies with a transportation planning function in the Boston region.
MAPC is one of the agencies with a transportation planning function in the Boston region, and provides local representation to the MPO.
8,131
NIA
1,049
2,198
129
18
1,570
260
842
18
438
176
671
346
197
415
962
597
140
1,919
100
time with area companies marke ting our services, and planning service for them , and we a re able to pr duce good zipcode level maps to uppon it" (Jim Bunch, telephone conversation with author, April 19, 1991) .
The Dallas Area Rapid Transit's (DART) GIS was installed about 6 years ago when they were looking for a ADD sy -tern. Shortly after the installation, DART was producing "map of minority population with censu. dara without knowing this was GlS ' (Alan Gorman DART, telephone conver ati n with author, May 13, 1991). They state that GIS has benefitted DART in that they "can generate maps from their database management system (DBMS) in 15 minutes that used to take months" (Gorman phone conver ation , May 13, 1991). From other information gathered during the interview with DART's GIS design analyst, GIS has not only improved DART's efficiency and effectiveness in performing funciions in the application area mentioned earlier but it is also being applied to rideshare matching and A VL. Further , DART's appJjcation in lhc area f facilities/land management handle not only fixed facilities and real estale , but deals with lease/license application, right-of-way acquisition, and proximity notification.
In other metropolitan areas , the MPO performs transit analysis and several other functions using GIS, in lieu of the transit agency. For instance, in Washington, D.C., the Metropolitan Washington Council of Governments (WashCOG) uses a variety of GIS software products to perform functions related to market analysis, whereas the Washington Metropolitan Area Transit Authority (WMATA) does not use GIS to perform transit analysis and does not plan to implement GIS in the future .
Another example is the Port Authority of Allegheny County (PAT) in Pittsburgh, which i currently working with the Ciry of Pitt burgh and the County of Allegheny Planning Department. Specifically, they are contributing to a county pilot tudy, which includes a routing and service application.
The Nashville Metropolitan Transit Authority (MTA) was approached by Vanderbilt University to develop a custom GIS system. The first application under development is a customer information system, but eventually the MTA would like to perform other functions. This custom GIS is written in Turbo C and uses precen u T pologically lntegrnted Geographic Encoding and Refe rencing (TIGER) files ( ·ubstanLially ec.1-ited by Vanderbilt) for the CO lmty representation. The program has "click-on" fea tures, whereby, one can click-on an area to show bus routes, or click-on a route and show the schedule for that route.
The MPO in Portland, Oregon, Portland Metro, has a GIS but is primarily using a graphical transportation network modeling package for transit analysis, including corridor studies and light rail transit (LRT) studies. They would like better interaction betwe n these two pieces o'f software so they will be programming in-house to improve the interaction as project demand.
In the San Francisco Bay area , two transit agencies are applying GIS to electoral redistricting. Alameda-Contra Costa Transit District is in the proce s of acquiring and implementing a GIS because of the redistric1ing. Bay Area Rapid Tran i.t {BART) i con idering the implementation of G and one of the potential application areas is census-ba. ed redistricting in terms of demographics. In contrast , the Metropolitan Transportation Commission (MTC) , an oversight
TRANSPORTATION RESEARCH RECORD 1349
agency covering nine Bay Area cities , is acquiring a GIS primarily because MTC wants to collect and maintain information on freeway call box locations , inventory , and usage.
In 1980, Seattle Metro was searching for a GIS to perform operations functions as well as planning functions . Since they could not find their desired functionality in commercially available products , they developed their own GIS, called TransGeo . TransGeo is being used for many applications in addition to the top five application areas mentioned previously:
• Ridematching (TransGeo is providing geocoded information to the ridematching system);
• Transit pass sales analysis; and • Other applications, such as
-Processing automatic passenger counter (APC) data , -Vehicle maintenance/mileage estimation, -Monitoring on-time performance, and -Peak load analysis.
Benefit tO Seattle Metro are numerous. The company has obtained ·ophisticated , broad , and cohesive information from TransGeo. "A lot of people are now getting the same answer to the same question" (Jan Solga, Seattle Metro, telephone conversation with author, June 12, 1991). They are getting good ection 15 data without using a large staff, and shared information is enhancing the cooperation among various divisions . They are also getting good analysis outputs . For example, in a study on siting new park-and-ride lots, Seattle Metro was able to map the residence origins of users of existing lots by studying license plates . The company also has been able to evaluate cu tom bu routing for employer by analyziJ1g residence and work locations and al o ha performed higb-capacity plannrng by taking old and new schedules, obL<tining schedule speeds, and plotting red and green bandwidths. In additi.on, it has exchanged vehicle volume information with the city for arterial planning.
At the San Diego Association of Governments (SANDAG) , GIS has increased productivity and cost effectiveness in dealing with spatial data and has expanded capabilities in solving planning problems. SANDAG is u ing GI for data collection from on-board surveys and faciliti es location. For public facility siting, it can better evaluate the consequem:es of particular sites before building.
In addition to transit analysis, GIS is being used in Southeast Michigan's Council of Governments (SEMCOG) for a vari~ly of applications , including accident analysis, developing travel time coDtours from a point, examining changes in socioeconomic data , producing maps of origin and destination zones for motorists affected by changes , plotting traffic volumes and congestion, and displaying concentrations of variables such as elderly or handicapped persons. GIS has allowed SEMCOG to provide requested information to outside groups such as other cities , the rate, c nsultants , and lawyers.
With the help of GJS, the uburban M bility Authority for Regi nal Transportation ( MART) in Detroit has been able to determine the best locations for bus shelters based on passenger boardings, to do visual queries by community, and to modify routes.
A comprehensive summary of current applications of GIS resulting from the interviews is shown in Table 2. A more

TABLE 2 CURRENT AND FUTURE APPLICATIONS OF GIS'
CURRENT APPLICATION AREAS FUTURE APPLICATION AREAS
Transit ridership forecasting, service planning, Transit ridership forecasting, service planning, market analysis market analysis
Map products design and publishing Map products design and publishing
Fixed facilities and real estate management Fixed facilities and real estate management
Telephone-based customer information services Telephone-based customer information services
Transit scheduling and run-cutting Land use applications
Ridematching (for carpools and vanpools) Transit scheduling and run-cutting
Automatic vehicle location Ridematching (for carpools and vanpools)
Transit pass sales Automatic vehicle location
Police operations Paratransit scheduling and dispatching
Paratransit scheduling and dispatching Police operations
Rapid transit modifications Traffic counts/projections
Improved transfer points and connections Transit pass sales
Capital investment analysis Fixed-route transit dispatching
Infrastructure management Accident data retrieval and locations
Mode choice modeling Bus/feeder bus service planning
Reverse commuter studies Route planning
Corridor studies Pavement management
Pavement management Redistricting - demographic analysis
Freeway call box locations Ridership counts
Traffic signals Updates to route maps
Passenger counting for Section 15 Benefit assessment district proeessing
On-board survey data Improved computer simulation (UTPS analysis)
Demographic profile General displays
Transfer development rights Evaluation of passenger counts
Revenue district tracking Planning and customer service
Proximity notification Route-level databases
Accidents Buses per hour on streets
Travel time contours from a point Bus schedules
On-time performance monitoring Ferry users
Vehicle mileage calculating/estimating Utility locations
Affirmative action reports
Inventory of stops
Evaluating rights-of-way
Incident management
Remote image (raster) integration
Heads-up digitizing
Transit station impact analysis
Capital planning
Tracking regional development trends
Census Analysis
Route information
Boarding locations
Bus stop signs
Dial-in/road call services
Zoning
Applications are listed in order of the largest number of agencies using GIS for the specific application to the least number of agencies using GIS for the specific application.
102
detailed summary of GIS applications by type of respondent (transit operator, MPO, and transit oversight agency) has been previously shown (3).
Future of GIS Implementation
The majority of organizations interviewed expressed an interest in implementing GIS, if they did not already have GIS, or in expanding the use of their existing GIS for other applications. An exhaustive list of areas for future implementation (Table 2) covered not only those application areas listed in the interview questions but also adjunct areas such as incident management, land use planning, trnffic projection, and capital planning. The top five areas having potential for future implementation or expansion by transit agencies are
l. Facilities/land management (16), including - Fixed facilities and -Real estate;
2. Transit analysis (15), including - Transit ridership forecasting, -Service planning, and - Market analysis;
3. Design and publication of map products (12); 4. Telephone-based customer information services (12); and 5. Scheduling and dispatching for
-Fixed-route transit (9) and -Paratransit (5).
For MPOs, the top five were slightly different:
l. Transit analysis (5), including - Transit ridership forecasting , -Service planning, and -Market analysis;
2. Design and publication of map products ( 4); 3. Ridematching (3); 4. Land use applications (3); and 5. Traffic counts/projections (2).
Comments of Transit Agencies and MPOs About Future Use of GIS
A number of comments were made by transit agencies and MPOs regarding their future use of GIS in transit planning. Baltimore's Mass Transit Administration (MT A) is consid ering GIS implementation to develop inputs to ridership projection and route-level planning. MTA needs to develop something more specific with a finer level of detail than its current transportation network modeling software. Currently, MTA is working with the University of Maryland to develop data bases for a GIS.
BART is considering GIS in the development of affirmative action reports, a disabled and minority population areas analysis report, to track utility locations, and for census-based redistricting. They are considering GIS implementation "to sharpen analytic capabilities for planning" (Aaron Weinstein, BART, telephone conversation with author, April 25, 1991).
The City of Des Moines Transportation Planning Commission is considering GIS implementation to perform market analysis of population and employment. The city would like
TRANSPORTATION RESEARCH RECORD 1349
to use TIGER files and to track building permits as a way of making future projections of employment and population.
In the Chicago area, several agencies are considering GIS. The Regional Transportation Authority (RTA) will be using their GIS for mode choice modeling, reverse commuter studies, and corridor studies. Metropolitan Rail's (Metra) primary use of their new GIS system will be evaluating new commuter rail corridors and analyzing current markets and performance.
The Chicago Transit Authority (CTA) is considering GIS implementation for planning and facilities management. In planning, CTA would like to collect data on boarding locations and ridership counts, to inventory bus stop signs, and to use census data to correlate visually with off counts. In facilities, CTA would like to integrate rail lines (power facilities, track, etc.) for display and evaluation of conditions, and to correlate facilities conditions with census and ridership data.
The Southern California Rapid Transit District (SCRTD) is going to use GIS for route planning, producing updates of route maps, benefit assessment, district processing, improving the customer information data base, improving computer simulations, and general display and evaluation of passenger founts.
The Port Authority of New York and New Jersey is considering expansion of their application areas to remote image (raster) integration, heads-up digitizing, customer information/transit information systems, transit station impact analysis (development impact analysis), and possibly capital planning. Engineering is interested in CADD aspects, capital improvement and design , tracking regional development trends, land use and suitability for development, facilities inventory and management, and census analysis.
PAT is planning on implementing a GIS to assist in service planning, transit scheduling, fixed facilities and real estate management, and incident management. PAT will implement the same GIS already in use at city and county planning agencies. PAT's reason for considering GIS implementation is "improved management and control" (Richard Feder, PAT, telephone conversation with author, 1991).
Factors in and Obstacles to GIS Implementation
The reasons for implementing GIS in transit agencies and MPOs are as varied as the number of organizations interviewed. Interview questions about benefits to the organization, problems encountered, and software selection together create a picture of why GIS is being used. Several factors contribute to future implementation or expansion, the most important of which are funding; resources and training; data issues; and outside organizational influences.
In particular, influences from outside organizations are strong, particularly when examining GIS use in transit agencies. More often than not, the selection of software and data by transit agencies is influenced by the experiences other local agencies have had with GIS. Also, the desire to be "compatible" with the software and data of other local agencies is strong, particularly when a cooperative group is formed to address GIS . These factors are analogous to those that were present during the introduction of microcomputer technology-organizations wanted to make educated decisions about purchasing hardware and software, which sometimes meant depending on the experience of other local organizations.

Schweiger
Beyond the aforementioned factors, other major obstacles to and factors in GIS implementation or expansion identified by specific agencies included
• Money required for hardware, software, and/or training; • Lack of interdepartmental coordination and/or
cooperation; • Lack of recognition of GIS capabilities; • Ignorance about the value of GIS technology; • Coordination of data collection; •Updating and maintenance of data; • Lack of appropriate data; • Effort required to input data; • Unwillingness of other agencies to share data; • Unwillingness to establish standards; • Acquisition of base data; • Development and calibration of models; and • Interchange of data between other agencies .
MAJOR ISSUES ASSOCIATED WITH GIS USE
Major issues and problems associated with the implementation and use of GIS for transit planning cover those factors that make GIS successful or impede its success. These factors can be separated into (a) organizational structure and setting and (b) data integrity and management.
Organizational Structure and Setting
Two key issues-the GIS environment and the organizational commitment to GIS-affect how the organizational structure and setting influence the use of GIS. There is a wide variation in organizational structures as they relate to GIS use. Two internal organizational issues were evident from the investigation. First, within an organization, the GIS functions in either a centralized or decentralized environment. Examples of a centralized environment include DART and H-GAC, which have GIS departments. Also , in several organizations, the people trained in using GIS are in one department, rather than across several departments . Seven of the organizations interviewed have trained personnel in one department.
Most of the remaining organizations that have GIS are using it in multiple departments. For instance, the New York MTA "has introduced GIS informally because of the diversity of needs" (Carter Brown, New York MTA, telephone conversation with author, April 26, 1991). The approach has been to try to optimize data sharing and to persuade people to buy data-compatible software. In the future, planners at the MTA will have GIS in their job descriptions .
The identification of GIS in job descriptions shows a commitment to GIS. Beside DART and H-GAC, there are four other organizations that have personnel with GIS in their job descriptions.
Data Integrity and Management
In the investigation, several questions regarding data issues were asked. The issues covered were
• Data sources for street network; •Time spent on data clean-up; •Perception of data quality; and • Types of transit system data available on computer.
103
In terms of data sources for local or regional street networks, the majority of organizations are using or are in the process of loading TIGER files from the 1990 U.S . Census. Fewer organizations are using Geographic Base File/Dual Independent Map Encoding (GBF/DIME) files from the 1980 U.S. Census and Digital Line Graphs (DLGs) from the U.S. Geological Survey. Only one organization, SANDAG, used a commercial data base (EtakMap®) as a primary data source but merged it with GBF/DIME data. Descriptions of these spatial data sources have been discussed previously (3).
In addition to these data sources, a few organizations were using locally developed data sources, including
• Urban Transportation Planning System network; • Aerial maps; •Locally developed sources based on enhanced TIGER
and DIME data; • Utility company data; • Pavement management data; and • Data from 911 program.
One example of a locally developed data source is from MassGIS, which is a cooperative organization of public agencies in Massachusetts run by the Executive Office of Environmental Affairs . MassGIS has not only developed a data base, much of which is based on DLGs, but it also has set standards on map scale and has coordinated data input from its members.
Another example is the Demographic Data Task Force in San Antonio. The purpose of this task force, which consists of the MPO, transportation agencies, utilities, and school districts, is to exchange mapping information rather than ask the task force members to change their data sources. Furthermore, an elected official is in charge of the Task Force, so there is political support for the group's efforts .
Organizations indicated that data clean-up and correction can be a significant effort. The amount of time required for data clean-up ranged from a few weeks to over two labor years per year. This wide range of effort is caused by such factors as the size of the area that the data represent, the accuracy of the source data in that region, and the application of the data in the GIS.
Perception of data quality varied as well, but the majority of organizations said that the quality was adequate. Obviously, after the completion of data clean-up/correction efforts, most interviewees have said that the quality was good. A few MPOs stated that the data quality was adequate for regional analysis but not for detailed local analysis .
GIS SOFTWARE PRODUCTS
The purpose of this section is to identify the software products that are in use for transit planning and to point out specific applications of the software in transit planning. In the investigation, a total of 16 software products were identified as being used by transit agencies and MPOs. Of those claiming

104
to have GIS, 13 products were identified (Figure 2). The other three products are graphically enhanced transportation planning packages.
Description of Available Software
Almost 100 GIS and related software products are listed in The 1990 GIS Sourcebook, by GIS World, Inc. (5). These products cover many disciplines besides transportation, such as environment and natural resources, utilities, real estate, marketing, and agriculture. Although it is not exhaustive, the list of areas in which GIS has been applied represents major application areas. It would be impossible to review all GlS software products in this report, but it is important to review those products that are currently in use in transit planning.
GIS Software for Transit Planning
As stated previously, 13 GIS products are in use for transit planning by the organizations interviewed. Ten of these products are commercially available (Pinnacle is a customdesigned system being used by SMART, SEMSAS is a system developed in-house for SEMCOG, and TransGeo is a system developed in-house for Seattle Metro). The companies associated with these commercial products, along with the transit agencies and MPOs that use them, the computers they work on, their interface to DBMS, and other pertinent information are shown in Table 3. All of the packages listed in this table are classified as GIS because they all claim to have some topological functions (5). No independent verification of these claims has been made by this study.
Of the commercially available GIS products, TransCAD is the only one that contains specific transportation planning functions relating to the four-step planning process. Most transit agencies and MPOs that are doing planning are still using transportation planning packages in addition to a GIS.
There is a distinct difference between GIS data functions, such as data extraction from overlays, and network analysis capability, which is an important feature of GIS used specifically for transit planning purposes. A number of packages listed in Table 3 claim to have network analysis capabilities, which are essential for routing analysis and service planning where routes are displayed and plotted. Detailed descriptions of the successful use of each GIS by particular agencies have been described previously (3).
TransCAD/GisPlus 9
ATLAS"GIS 2
FIGURE 2 Use of GIS products.
lll'U\IGo.o l - SEMSAS 1
TRANSPORTATION RESEARCH RECORD 1349
Interfaces with Other Planning Tools
A number of existing packages perform traditional transportation planning functions. The investigation showed that several agencies are using these packages in addition to GIS . These packages include FTA's public domain UTPS and the commercial products EMME/2, MINUTP, and TRANPLAN.
Since the interview questions did not concentrate on the use of these products, a significant amount of information is not available on the specific use of these products. However, all of these packages, as well as TransCAD, have similar capabilities with respect to transportation planning functions. They all have capabilities in network building and editing, trip generation, trip distribution, modal split, and network assignment (traffic and transit). They also provide graphic displays and plotting and general output capabilities.
The subject of GIS integration with other planning tools, specifically those transportation planning packages mentioned above, was identified as an issue during the interviews. Where planning tools and GIS are being used, they tend to be used separately. For instance, in the Atlanta Regional Commission (ARC), the MPO for the Atlanta region, TRANPLAN is being used for transportation planning, and ARC/INFO is being used elsewhere in ARC. Now that it has been exposed to ARC/INFO, the transportation planning group would like to integrate TRANPLAN and ARC/INFO.
Tampa Urban Area MPO wishes to integrate the Florida Standard Urban Transportation Modeling Structure (which merges land use and transportation data) with their GIS, Genamap, to produce graphics. Tampa also has two other transportation planning packages. The mainframe package is UTPS and the PC package is TRANPLAN.
Portland Metro (MPO for Portland, Oreg.) has used ARC/ INFO to examine land ownership adjacent to the LRT line. However, Portland is currently using EMME/2 for transportation modeling and has expressed an interest in integrating both of these packages by developing interaction routines.
WashCOG is using PC ARC/INFO, Gis Plus, and MINUTP (it is also evaluating a raster-based GIS, SPANS). WashCOG has successfully integrated data bases and plans to use ARC/ INFO as a data base builder and a front end.
CONCLUSIONS AND RECOMMENDATIONS
Three major conclusions can be derived from the results of this investigation. First, the transit agencies and MPOs interviewed clearly have an understanding of what GIS is. However, in several cases, the relationship between GIS and transit planning may not be as clearly understood, particularly for organizations that are considering GIS implementation for a variety of applications beyond typical transit planning functions. These functions may include
•Operations; including -Scheduling, run-cutting, and dispatching (these oper
ational functions might include Americans with Disabilities Act paratransit service area determination) and
-AVL; • Planning, including
- Ridership forecasting,

Schweiger
-Service planning/modification, -Market analysis, and -Transit and land use development review analysis;
• Marketing, including - Market/demographic analysis, -Customer information services, and -Transit pass programs;
• Facilities inventory and management; • Real estate inventory and management; •Maintenance, including
-Right-of-way,
105
-Vehicles, and -Stations; and
• Engineering.
Second, the selection of GIS software to perform transit planning functions seems to be based on several factors, including
•Funding, • Resources, • Compatibility with other local organizations, and • Capability to perform transit planning functions.
TABLE 3 COMMERCIAL GIS PRODUCTS USED IN TRANSIT PLANNING' (5)
SYSTEM COMPANY USERS COMPUTERS DBMS MEASUREMENTS GENERATE POLYGON NETWORK NAME INTERFACES (Proximity Analysis BUFFERS (Around OPERATIONS
and Area Points, Lines and (Point in Measurement) Polygons) Polygon, Line
in Polygon, and Polygon Overlay)
ARC/INFO ESRI ARC, Bi-State, Workstations INFO, CTPS, H-GAC, and PC-DOS ORACLE, Houston Metro, INGRES, MAPC, Miami Sybase, MPO, Port INFORMIX, • • • • Authority of NY DB2, Rdb, & NJ, Portland SQL, DS, Metro, dBASE Ill & SAND AG, IV SCRTD, WashCOG
ATLAS•GIS Strategic Houston Metro, PC-DOS dBASE Ill and Mapping, Metra compatible S' s s Inc.
GDS McDonnell DART Workstations Any SQL-based • • • • Douglas database
Genamap Genasys II, Tampa Urban Workstations INGRES, Inc. Area MPO and PC-DOS ORACLE,
INFORMIX, • • • • HP ALLBASE, SQL 400, DB2
GisPlus, Caliper NOA CA, PC-DOS Lotus 1-2-3, TransCAD Corporation WashCOG, Generic with
Baltimore MTA, ASCII export LIRR, NJT, capability NYCTA, • • • • NYMTA, Port Authority of NY & NJ, Chicago RTA
IDRISI Clark RVTD PC-DOS dBASE Ill, University, Professional Graduate File • • • • School of Geography
LandTrak Geo Based City of Phoenix PC-DOS Proprietary s s s • Systems Public Transit database
Maplnfo Map Info Houston Metro, PC-DOS dBASE, Corp. MARC, Bay FoxBase,
Area MTC, ASCII • s • Omaha-Council Bluffs MPO, PSCOG , TTD
MGE Intergraph DVRPC, Intergraph ORACLE, Corporation NYCTA UNIX INGRES, • • • • Workstations INFORMIX,
DB2
A portion of the information in this table is from GIS World, Inc., 171e 1990 GIS SOURCEBOOK, pages 20-37.
"S" indicates that the software does not have full functional capability in this area, based on summary information from the 1990 GJS SOURCEBOOK.

106
The last factor, capability to perform transit planning functions, is not usually weighed as heavily as the other factors .
It is important that the selection process involve a balanced examination of all these factors in relation to the specific transit analysis needs of the organization. Thus, the following issues in software procurement and implementation should be considered:
•Performing a GIS needs analysis, including matching the "needed" analysis tools with available products;
•Procuring the appropriate software and hardware; and • Developing an organizational structure or modifying an
existing structure to effectively implement GIS technology .
Third, given the importance of using spatial data in GIS, and given the inconsistent nature of these data, the following data processes should be closely examined before software implementation, including
•Data acquisition; • Data integrity and maintenance, which require local and/
or regional coordination and communication similar to the federal interagency activities within the Federal Geographic Data Committee; and
• Other data issues, such as appropriate scales for certain data and data use, which require local understanding and agreement.
Fourth, the information currently available on GIS software comes from the vendors. Thus, a more objective evaluation of functionality is needed, specifically oriented toward transit applications. The following factors describing commercially available GIS products should be evaluated before selection:
•Typical transportation planning functional capabilities; •Hardware requirements; •Data base capabilities/interfaces; • Geographic/topological capabilities; and • Output capabilities.
TRANSPORTATION RESEARCH RECORD 1349
In conclusion , at the federal level, the integration of land use and transportation policy and planning is critically important in addressing mobility in metropolitan areas. GIS is the tool that is capable of examining this relationship and providing a decision support mechanism for developing policies and programs based on that relationship.
ACKNOWLEDGMENTS
The research presented in this paper was sponsored by the Department of Transportation's Research and Special Programs Administration, John A . Volpe National Transportation Systems Center. The author thanks Bruce D. Spear of the Volpe National Transportation Systems Center, for his guidance and assistance in performing the research. The author also acknowledges Deanna Mirsky ofEG&G Dynatrend, Inc., for her effort in performing the telephone interviews, and Robert W. E. Antonisse of GIS/Trans, Ltd., for his work in drafting the initial set of questions and assisting in a review of those questions.
REFERENCES
1. Understanding GIS-The ARC/INFO Method. Environmental Systems Research Institute, Inc., Redlands, Calif., 1990.
2. W. E. Huxhold. An Introduction to Urban Geographic Information Systems. Oxford University Press, New York, 1991.
3. C. L. Schweiger. Current Use of Geographic Information Systems. Report DOT-T-92-02. FTA, U.S. Department of Transportation, 1992.
4. D. H. Pickrell. Urban Rail Transit Projects: Forecast Versus Actual Ridership and Costs. Report DOT-T-91-04. FTA, U.S. Department of Transportation, 1990.
5. 1990 GIS Sourcebook. GIS World , Inc., Fort Collins , Colo ., 1990.
Publication of this paper sponsored by Committee on Public Transportation Planning and Development.