Current REDD+ and FLEGT-VPA-Related Achievements and ...
208
Current REDD+ and FLEGT-VPA-Related Achievements and Limitations for Sustainable Forest Management on the Subnational Level Dissertation with the aim of achieving a doctoral degree at the Faculty of Mathematics, Informatics and Natural Sciences Department of Biology of University of Hamburg submitted by Laura Antonia Prill 2020 in Hamburg
Transcript of Current REDD+ and FLEGT-VPA-Related Achievements and ...

Current REDD+ and FLEGT-VPA-Related Achievements and
Limitations for Sustainable Forest Management
on the Subnational Level
Dissertation
with the aim of achieving a doctoral degree
at the Faculty of Mathematics, Informatics and Natural Sciences
Department of Biology
of University of Hamburg
submitted by
Laura Antonia Prill
2020 in Hamburg

Day of oral defense: 12.04.2021
The following evaluators recommend the admission of the dissertation:
1. Supervisor: Prof. Dr. Michael Köhl
2. Supervisor: Prof. Dr. Jörg Ganzhorn


I
Acknowledgments
Firstly, I would like to express my sincere gratitude to the BMEL, especially to Dr. Thomas Baldauf for
giving me the opportunity to do the research of my doctorate within the scope of the SAFARI project.
Secondly, I sincerely thank Prof. Dr. Köhl for letting me conduct the thesis and letting me work as a
researcher at the Institute of World Forestry, for the supervision of this dissertation and for the constant
support, guidance and trust in me during the last five years.
I also want to express my gratitude to Prof. Dr. Ganzhorn for his willingness to be the second supervisor.
Furthermore, I would like to thank the entire SAFARI team, especially Bruno Verbist, Yitagesu Tekle,
Pieter Moonen and Jo van Brusselen for their cooperation and support during the initial stages of the
research. A very special ‘thank you’ goes out to my colleague and friend, Prem Neupane, who was
always available throughout the entire process of the thesis. Thanks especially for the many discussions
in the beginning and the comments and recommendations at the end of the journey.
I also thank Tunggul Butarbutar for his help in getting along in Indonesia, and Reonaldus Reonaldus for
assisting me during the data collection. Without the support of these two guys I could not have completed
the study.
I am also very grateful to Dr. Olaf Conrad for helping with GIS matters, to Matthew Hewitt and Max
Rodriguez Gomez for helping with the transcription of the interviews, to Archana Gauli for her feedback
on selected parts of the study, to Karin Mantel for her feedback on the structure of the thesis, to Susan
Ortloff for reviewing the English language, to Suprianto Suprianto for taking care of all my data needs,
to Peppy Handayani for accompanying me in the field and arranging new contacts, to Pak Bambang
Wahyudi for helping with concession related matters and to everyone else who has made the research
and my stay in Indonesia possible: specifically to GIZ and TNC staff in East Kalimantan and Berau and
FMU Berau Barat staff (the indoor soccer was great!). Very special thanks also explicitly to all the
interviewees and discussion partners for their time and willingness to share their opinions and
knowledge with me.
Furthermore, I want to thank Frau Kruse and Frau Wöbb for their constant availability and help in
whatever ‘annoying matter’, to Philip Mundhenk for his thoughtful and constructive opinions right when
I needed them, and to everyone else at the Institute of World Forestry. I also like to thank the ‘old crew’
of the Institute, especially Anna Vorländer, Neda Lotfiomran, Simon Bodi and Daniel Kübler for
providing such a great working atmosphere — we were a great team! To Daniel, special thanks also for
his methodological — especially R-related — and emotional support during the beginning of this study.
Last but not least, I want to express my deepest thanks to all of my friends who have over and over
listened to all of my worries and frustrations during the progress of this work. Life was just at the most
crucial and important turnaround for me when I began this thesis and the most important was their
support throughout the upcoming years. Thanks to all of you for cheering me up, for distracting me, for
offering me new perspectives and for making me laugh, specifically to Lorena for your emotional
support and for understanding ‘who I am’, to Lina for still being my one and only and for upholding my
roots since the very beginning, to Jessi for your easiness and for always being there to talk to as a roomie
and a friend, to Eli for the exhilarating ‘runs & chats’ and your critical eye on the layout, to Wiebs for
the delicious vegan, saturated-fatty-acid-poor dinners, and to Lotte, Etje and Sarah for the numerous
hang outs and talks over cinnamon bun, ice cream and beer.
Finally, and most importantly I like to thank my family in Germany and in Mexico, especially my mum
and Clemens for the general support in life, and my dad, my sister and my brother for the spiritual
support during the last years. No matter where you all are or how far away, knowing that each and every
single one of you is (finally) there means the world to me, gracias!

II
Summary
Global forest governance is shaped by numerous instruments and initiatives. These approaches, referred
to hereafter as forest-based approaches (FbAs), strive to promote the holistic concept of sustainable
forest management (SFM). Yet, despite their common goal, FbAs often vary in scope, focus and their
applied strategies and measures, depending on the purpose and actual priority of each approach and,
therefore, also their relevance to SFM. Two current FbAs are REDD+ (Reducing emissions from
deforestation and forest degradation and the role of conservation, sustainable management of forests and
enhancement of forest carbon stocks in developing countries) and FLEGT (Forest Law Enforcement,
Governance and Trade). REDD+ aims to compensate developing countries for foregone costs related to
avoiding deforestation and forest degradation, the conservation and enhancement of forest carbon stocks
and SFM. FLEGT, through the implementation of legally binding trade agreements between the EU and
a timber producing country outside the EU, so called Voluntary Partnership Agreements (VPAs), aims
to address the issue of illegal logging and related trade.
The purpose of this study is to investigate the contributions made by REDD+ and FLEGT-VPA to the
holistic concept of SFM on the subnational level with a focus on five specific research questions:
1. What are the current REDD+ achievements and limitations relevant to SFM on the subnational
level?
1.1 Do subnational REDD+ activities contribute to forest loss reduction on the
jurisdictional level?
2. What are the current FLEGT-VPA-related achievements and limitations relevant to SFM on the
subnational level?
2.1 Do national forest certification schemes under a FLEGT-VPA contribute to forest loss
reduction on the concession level?
3. What are the current driving forces of and hindrances to subnational REDD+ implementation?
Research was carried out in the Indonesian East Kalimantan Province and Berau District where both
FbAs have been implemented. To address research question 2 and 2.1, the study examines the following
FLEGT-VPA-related certification schemes in Indonesia: Timber Legality Assurance System (TLAS),
the Sistem Verificasi Legalitas Kayu (SVLK) that became the core of the Indonesian VPA, and the
Pengelolaan Hutan Produksi Lestari (PHPL) – the Indonesian SFM certification adopted under the legal
framework of the SVLK.
REDD+ achievements and limitations relevant to SFM on the subnational level
Subnational REDD+ (and FLEGT-VPA) achievements to SFM in the focus area were identified from
interview surveys and the analysis of REDD+ (and FLEGT-VPA) policy, implementation and
evaluation reports. The seven International Tropical Timber Organization (ITTO) criteria1 were used as
an evaluative framework.
The study shows that REDD+ has the potential to contribute to the holistic concept of SFM. No
contradictions were found. REDD+ achievements (as those of FLEGT-VPA) are mostly classified as
outputs (i.e. immediate results of an intervention) while only fewer outcomes (i.e. behavioral,
institutional or social changes that take place over 3-10 years of an intervention’s output) were observed.
Major achievements were identified in relation to the establishment of enabling conditions for SFM
(criterion 1) and to the improvement of the land use (changes) data base (criteria 3 and 2).
Results suggest that REDD+ can promote (ongoing) governance reforms on the subnational level, but
that the process is slow. Achievements related to the criteria ‘forest ecosystem health and resilience’,
‘forest production’, ‘forest biological diversity’ and ‘economic, social and cultural aspects’ remain in
the pilot stages without a clear outcome on the jurisdictional level. Progress generally decreased from
the provincial to district level.
1 Criterion 1: Enabling conditions for SFM, criterion 2: Extent and condition of forests, criterion 3: Forest ecosystem health
and resilience, criterion 4: Forest production, criterion 5: Forest biological diversity, criterion 6: Soil and water protection,
criterion 7: Economic, social and cultural aspects.

III
Contribution of subnational REDD+ activities to forest loss reduction
This part of the study draws on an analysis of satellite data. Results suggest that the REDD+ readiness
process was unable to reduce forest loss on the provincial or district level between 2009/10 – when
REDD+ was introduced – and 2016. Triangulating study results reveal that the major sources of forest
loss remained unaddressed under the district and provincial REDD+ programs. Over 60% of the total
forest loss between 2001 and 2016 in both jurisdictions occurred on land officially classified as ‘non-
forest land’ (the Indonesian land classification system does not necessarily coincide with the actual
forest cover). Accordingly, more than half of Berau’s forest loss occurred within industrial land use
permit boundaries (natural forest, timber plantation, mining or oil palm permits).
FLEGT-VPA-related achievements and limitations relevant to SFM
Results reveal that the VPA between the EU and Indonesia both contributes to and contradicts with
SFM. Key achievements were identified in relation to the establishment of enabling conditions for SFM
(criterion 1) and to the criterion ‘forest production’. As a result of the SVLK implementation, consulted
stakeholders perceive a decreasing trend in illegal logging of timber destined for the export market
(criterion 2), but the data to prove this is limited. Issues related to ‘forest biological diversity’, ‘soil and
water protection’ and ‘economic, social and cultural aspects’ remain unaddressed under the SVLK.
Gaps were found in relation to land and forest allocation, whose clarity is vital under the Indonesian
TLAS. Despite related objectives to improve forest governance, this study demonstrates that no
measures to influence subnational governance and improve the spatial planning process are provided
under the VPA.
The study also reveals that FLEGT-VPA reinforces traditional unsustainable practices anchored in
Indonesian law; among those the application of an outdated harvesting system and the legal conversion
of forests to other land uses. Results demonstrate that timber defined as ‘legal’ under the VPA might
not originate from a sustainably managed forest.
Contribution of VPA certification schemes to forest loss reduction
Results of the remote sensing analysis offer no evidence that the VPA-related certification schemes
contributed to forest loss reduction on the forest concession level in Berau, neither on loss associated
with forest management nor with loss associated with the conversion of forests. Most of the loss in the
investigated concessions is associated with mining or the permanent conversion of natural forests to oil
palm plantations, the remaining is linked to forest management activities. Study findings demonstrate
that large-scale forest loss is highly prevalent in PHPL-certified concessions.
Driving forces of and hindrances to the REDD+ implementation
Empirical material for this part of the study was drawn from expert interviews and REDD+ policy,
implementation and evaluation reports. Results reveal that international organizations and academics
are the main drivers of the REDD+ process. The forestry faculty in the focus area played an important
role in this process. The long history of conservation programs, the existing technical know-how and
financial and human resources facilitated the REDD+ process.
Reasons for the failure to achieve many intended objectives of the REDD+ readiness process in the
focus area involve the lack of political support beyond the political leader and the late integration of
related strategies into regional development plans. The low level of ownership and support among
subnational governments is explained by a lack of autonomy from other sectors that drive deforestation,
limited involvement of the subnational parliament, a poor understanding of and interest in REDD+
related issues among policy decision-makers, other nationally-driven priority strategies and limited
translation of REDD+ related national policies at the local level.
Conclusion and implications
Based on the study results and their discussion, conclusions were made on the achievements and
limitations of REDD+ and FLEGT-VPA for SFM on the subnational level. It is concluded that REDD+
and FLEGT have different strengths and weaknesses in terms of SFM. Both approaches support ongoing
policy reforms, but neither approach led to reduced forest loss in the respective units of analysis during
the investigation period.

IV
Conclusions specific to REDD+ include the need to address the region-specific main drivers of forest
loss. For the focus area it is important that improvements be made to the spatial planning and land use
classification processes and that the non-forestry sector is better engaged in land use management.
Successful pilot stage activities need to be upscaled and the necessary resources for implementation
secured.
Conclusions specific to FLEGT-VPAs comprise implications of their sole focus on legality. In order to
ensure that timber concessions also comply with sustainability measures requires considering and
questioning the national legislation of the VPA partner country in terms of SFM which would ultimately
influence its national sovereignty.

V
German summary
Die globale Politikgestaltung im Forstsektor ist von zahlreichen Instrumenten und Initiativen geprägt.
Diese Ansätze, im Folgenden als forstbasierte Ansätze (FbAs) bezeichnet, verfolgen das Ziel, das
holistische Konzept einer nachhaltigen Waldbewirtschaftung (SFM) zu fördern. Trotz ihres
gemeinsamen Ziels unterscheiden sich FbAs in Abhängigkeit ihres jeweiligen Ansatzes, in Umfang,
Schwerpunkt und angewandten Strategien. Entsprechend variiert ihre Bedeutung für SFM. Zwei
aktuelle FbAs sind REDD+ (Minderung von Emissionen aus Entwaldung und Schädigung von Wäldern,
sowie die Rolle des Schutzes, der nachhaltigen Waldbewirtschaftung und der Verbesserung der
Kohlenstoffvorräte der Wälder in Entwicklungsländern) und FLEGT (Rechtsdurchsetzung,
Politikgestaltung und Handel im Forstsektor).
Die Grundidee von REDD+ ist, Entwicklungsländer für die entgangenen Kosten im Zusammenhang mit
der Vermeidung von Entwaldung und Walddegradation finanziell zu entschädigen. FLEGT verfolgt das
Ziel, durch die Realisierung rechtsverbindlicher Handelsabkommen zwischen der EU und einem
Holzproduktionsland außerhalb der EU, so genannter Voluntary Partnership Agreements (VPAs), die
Einfuhr von illegal produziertem Holz in die EU zu verhindern und so den illegalen Holzeinschlags im
Produktionsland zu bekämpfen.
Ziel der vorliegenden Studie ist es, zu untersuchen inwiefern REDD+ und FLEGT-VPA zum
holistischen Konzept von SFM auf subnationaler Ebene beitragen, wobei fünf spezifische
Forschungsfragen im Mittelpunkt stehen:
1. Was sind aktuelle SFM relevante Errungenschaften und Grenzen von REDD+ auf subnationaler
Ebene?
1.1 Tragen subnationale REDD+ -Aktivitäten zur Verringerung des Waldverlustes auf der
Ebene der Gerichtsbarkeit bei?
2. Was sind aktuelle SFM relevante Errungenschaften und Grenzen von FLEGT-VPA, die für die
subnationaler Ebene von Bedeutung sind?
2.1 Tragen nationale Waldzertifizierungssysteme im Rahmen eines FLEGT-VPAs zur
Reduzierung des Waldverlustes auf Konzessionsebene bei?
3. Was sind die aktuellen Treiber und Hindernisse der subnationale REDD+ Implementierung?
Die Untersuchungen wurden in der indonesischen Provinz Ost-Kalimantan und dem Bezirk Berau
durchgeführt, wo beide FbAs implementiert werden. Um die Forschungsfragen 2 und 2.1 zu
beantworten, wurden die folgenden FLEGT-VPA-relevanten indonesischen Zertifizierungssysteme
untersucht: das Legalitätssicherungssystem für Holz, das sogenannte Sistem Verificasi Legalitas Kayu
(SVLK), das im Zentrum des indonesischen VPAs steht, und die SFM-Zertifizierung, die sogenannte
Pengelolaan Hutan Produksi Lestari (PHPL), die gesetzlich an das SVLK angegliedert ist.
SFM relevante REDD+-Errungenschaften und Grenzen auf subnationaler Ebene
Subnationale REDD+ (und FLEGT-VPA) -Errungenschaften im Untersuchungsgebiet wurden anhand
von Interviews und der Analyse von Politik-, Implementierungs- und Evaluierungsberichten ermittelt.
Die sieben SFM Kriterien2 der International Tropical Timber Organization (ITTO) wurden als
Bewertungsrahmen verwendet.
Die vorliegende Studie zeigt, dass REDD+ das Potenzial hat, zum holistischen Konzept von SFM
beizutragen. Es wurden keine Widersprüche gefunden. REDD+-Errungenschaften (wie auch jene von
FLEGT-VPA) werden meist als Output (das heißt als unmittelbares Ergebnis einer Intervention)
eingestuft, während nur wenige ‘Outcomes‘ (das heißt Verhaltens-, institutionelle oder soziale
Veränderungen, die über einen Zeitraum von 3 bis 10 Jahren nach Realisierung des Outputs stattfinden)
beobachtet wurden. Zu den Haupterrungenschaften zählen insbesondere solche, die zur Schaffung der
Rahmenbedingungen für SFM (Kriterium 1) beitrugen, sowie die Verbesserung der
Landnutzungsdatengrundlage (Kriterium 3 and 2).
2 Criterion 1: Enabling conditions for SFM (Rahmenbedingungen für SFM), criterion 2: Extent and condition of forests
(Umfang und Zustand der Wälder), criterion 3: Forest ecosystem health and resilience (Gesundheit und Resilienz des
Waldökosystems), criterion 4: Forest production (Forstproduktion), criterion 5: Forest biological diversity (biologische
Vielfalt des Waldes), criterion 6: Soil and water protection (Boden und Wasserschutz), criterion 7: Economic, social and
cultural aspects (wirtschaftliche, soziale und kulturelle Aspekte).

VI
Die Ergebnisse zeigen außserdem, dass REDD+ (laufende) Reformen der Regierungsführung auf
subnationaler Ebene fördern kann, dieser Prozess jedoch langwierig ist. Errungenschaften in
Zusammenhang mit den SFM Kriterien „Gesundheit und Widerstandsfähigkeit des Waldökosystems“,
„Forstproduktion“, „biologische Vielfalt des Waldes“ und „wirtschaftliche, soziale und kulturelle
Aspekte“ befanden sich zum Zeitpunkt der Studie in der Pilotphase, und zeigten deshalb keine
eindeutigen Auswirkungen auf Provinz- oder Distriktebene. Die Errungenschaften auf der Distriktebene
blieben im Allgemeinen hinter derer der Provinzebene zurück.
Beitrag von subnationalen REDD+ Aktivitäten zur Reduzierung des Waldverlustes
Die Analyse von Satellitendaten lässt keinen Schluss darauf zu, dass der REDD+ Prozess in der
Untersuchungsregion den Waldverlust zwischen 2009/10 – dem Zeitpunkt der REDD+-Einführung –
und 2016 reduzieren konnte. Die Triangulation von Studienergebnisse zeigt, dass die Hauptursachen für
die Waldverluste auf Distrikt und Provinzebene durch die dortigen REDD+-Programme nicht bekämpft
werden konnten. Über 60% des gesamten Waldverlustes zwischen 2001 und 2016 in den beiden
administrativen Einheiten wurde in der Landklasse „Nicht-Wald“ beobachtet (das indonesische
Landklassifizierungssystem stimmt nicht zwangsläufig mit der tatsächlichen Waldbedeckung überein).
Mehr als die Hälfte des Waldverlustes in Berau fand innerhalb industrieller
Landnutzungsgenehmigungen für Naturwald, Holzplantagen, Bergbau oder Ölpalmenplantagen statt.
SFM relevante FLEGT-VPA Errungenschaften und Grenzen auf subnationaler Ebene
Die Ergebnisse zeigen, dass das VPA zwischen der EU und Indonesien einen positiven Beitrag zu vielen
Kriterien des holistischen SFM-Konzeptes leisten kann, dass einzelne Elemente des VPAs jedoch im
Widerspruch zur Nachhaltigkeit stehen. Die wichtigsten Errungenschaften wurden im Zusammenhang
mit der Schaffung von Rahmenbedingungen für SFM (Kriterium 1) und dem Kriterium
„Forstproduktion“ beobachtet. Die im Rahmen der Interviews befragten Personen gaben darüber hinaus
an, als Folge der SVLK Implementierung einen abnehmenden Trend illegal eingeschlagenen und für
den Exportmarkt bestimmten Holzes zu beobachten (Kriterium 2). Aufgrund der allgemein schlechten
Datengrundlage ließ sich dies nicht faktisch belegen. Aspekte im Zusammenhang mit den SFM Kriterien
„biologische Vielfalt des Waldes“, „Boden- und Wasserschutz“ und „wirtschaftliche, soziale und
kulturelle Aspekte“ wurden im Rahmen des Indonesischen Legalitätszertifizierungssystems nicht
adressiert.
Defizite wurden darüber hinaus im Zusammenhang mit der Land- und Waldzuteilung festgestellt, deren
Klarheit für die Umsetzung des indonesischen TLAS von entscheidender Bedeutung sein sollte. In
diesem Zusammenhang konnte gezeigt werden, dass trotz eng damit zusammenhängender Ziele zur
Verbesserung der Regierungsführung im Forstsektor, keine entsprechenden Maßnahmen zur
Beeinflussung der subnationalen Regierungsführung und zur Verbesserung der Raumplanung im
Rahmen des VPA vorgesehen sind.
Die Studie zeigt außerdem, dass das untersuchte FLEGT-VPA traditionelle, nicht nachhaltige Praktiken,
die im indonesischen Recht verankert sind, verstärkt. Beispiele hierfür sind die Anwendung eines
veralteten Erntesystems und die großflächige legale Umwandlung von Wäldern in andere
Landnutzungsformen. Die Ergebnisse zeigen, dass unter VPA gehandeltes ‚legales‘ Holz, nicht
zwangsläufig aus nachhaltiger Waldwirtschaft stammen muss.
Beitrag von VPA-Zertifizierungssystemen zur Reduzierung des Waldverlustes
Die Analyse von Fernerkundungsdaten liefert keinen Hinweis darauf, dass die VPA-
Zertifizierungssysteme zu einer Verringerung der Entwaldung auf Konzessionsebene beigetragen
haben. Es wurde weder eine Reduzierung im Zusammenhang mit forstwirtschaftlichen Aktivitäten noch
mit großflächiger Umwandlung von Waldfläche in andere Landnutzungsformen festgestellt. Der größte
Teil der Waldverluste in den untersuchten Konzessionen wurde auf Bergbau oder die dauerhafte
Umwandlung natürlicher Wälder in Ölpalmplantagen zurückgeführt. Basierend auf den Ergebnissen,
fanden großflächige Waldverluste darüber hinaus in PHPL-zertifizierten Konzessionen statt.
Treiber und Hindernisse für die REDD+ Implementierung
Dieser Teil der Studie basiert auf der Analyse von REDD+-Experteninterviews und Politik-,
Implementierungs- und Evaluierungsberichten. Die Ergebnisse zeigen, dass internationale
Organisationen und Akteure aus Wissenschaft und ziviler Gesellschaft die Haupttreiber des REDD+-

VII
Prozesses in der Untersuchungsregion sind. Eine entscheidende Bedeutung kam dabei den
Forstfakultäten zu. Darüber hinaus begünstigte das langjährige Vorhandensein von
Naturschutzprogrammen, das vorhandene technische Know-how, sowie die finanziellen und
personellen Ressourcen in der Untersuchungsregion den dortigen REDD+-Prozess.
Zu den Gründen für die Nichterreichung beabsichtigter Ziele der REDD+ Programme im
Untersuchungsgebiet zählten unter anderem die mangelnde Unterstützung seitens der Regierung und die
späte Integration von mit REDD+ zusammenhängenden Strategien in regionale Entwicklungspläne. Das
geringe Engagement der subnationalen Regierungen in REDD+ lässt sich aus einem Zusammenspielt
mehrerer Faktoren erklären, darunter die mangelnde Autonomie von anderen Sektoren, die maßgeblich
zum Waldverlust beitragen, die begrenzte Einbindung des subnationalen Parlamentes, das mangelnde
Verständnis und Interesse an REDD+-Themen politischer Entscheidungsträger, nicht mit REDD+ in
Einklang stehende nationale Interessen und die mangelnde Übersetzung nationaler Ziele auf lokaler
Ebene.
Schlussfolgerung und Implikationen
Basierend auf den Studienergebnissen werden Schlussfolgerungen zu den SFM relevanten
Errungenschaften und damit verbundener Grenzen von REDD+ und FLEGT-VPA auf subnationaler
Ebene gezogen. REDD+ und FLEGT weisen unterschiedliche Stärken und Schwächen in Bezug auf
SFM auf. Beide Ansätze unterstützen laufende politische Reformen, aber keiner der beiden Ansätze
führte während des Untersuchungszeitraums zu einem geringeren Waldverlust in den jeweiligen
Analyseeinheiten.
Schlussfolgerungen spezifisch für REDD+ beinhalten die Notwendigkeit die regionalen Haupttreiber
des Waldverlustes zu adressieren. Für die Untersuchungsregion bedeutet dies, dass die Raumplanung
und Landnutzungsklassifizierung verbessert werden und der nicht-forstwirtschaftliche Sektor in ein
verantwortungsvolleres Landnutzungsmanagement einbezogen werden muss. Erfolgreiche Aktivitäten
in der Pilotphase müssen großflächig anwendbar gemacht und die für die Implementierung
erforderlichen Ressourcen gesichert werden.
Schlussfolgerungen und Implikationen spezifisch für FLEGT-VPA beziehen sich unter anderen auf die
Defizite des alleinigen Legalitätsziels. Um sicherzustellen, dass Forstkonzessionen nicht nur dem
Legalitätsaspekt gerecht werden, sondern darüber hinaus auch Nachhaltigkeitsstandards erfüllen, ist es
notwendig, die vorherrschenden nationalen Rechtsvorschriften des nicht Europäischen VPA-
Partnerlandes in Bezug auf SFM zu Berücksichtigen und gegebenenfalls in Frage zu stellen. Dies würde
letztendlich heißen, die nationale Souveränität zu beeinflussen.

VIII
Table of Contents
Acknowledgments ................................................................................................................................... I
Summary ............................................................................................................................................... II
German summary .................................................................................................................................V
Table of Contents ............................................................................................................................. VIII
List of Figures .................................................................................................................................... XII
List of Tables ....................................................................................................................................... XV
Abbreviations .................................................................................................................................... XIX
1 Introduction .................................................................................................................................. 1
1.1 Forest governance ................................................................................................................ 1
1.1.1 REDD+ and FLEGT ............................................................................................................. 2
1.2 Background on sustainable forest management ................................................................... 5
1.3 Motivation and scope of the research ................................................................................... 7
1.4 Study goals ........................................................................................................................... 7
1.5 Structure of the work ............................................................................................................ 9
2 State-of-the art ............................................................................................................................ 10
2.1 Achievements and limitations of REDD+ relevant to SFM ............................................... 11
2.2 Achievements and limitations of FLEGT-VPA relevant to SFM ...................................... 13
2.3 Driving forces of and hindrances to REDD+ implementation ........................................... 15
2.4 Conclusion .......................................................................................................................... 16
3 The Indonesian forestry context ................................................................................................ 18
3.1 Country size and population ............................................................................................... 18
3.2 Forest industry .................................................................................................................... 18
3.3 Forest cover in Indonesia ................................................................................................... 18
3.4 Indonesian forest land use classes and their functions ....................................................... 18
3.5 Forest management in Indonesia ........................................................................................ 21
3.6 Threats to Indonesian forests .............................................................................................. 23
3.7 National FLEGT-VPA and REDD+ processes in Indonesia .............................................. 24
4 Materials and methods ............................................................................................................... 30
4.1 Research design .................................................................................................................. 30
4.2 The study area .................................................................................................................... 31
4.3 Research framework ........................................................................................................... 35
4.4 Data collection .................................................................................................................... 36
4.4.1 Interviews and field observation ........................................................................................ 37
4.4.1.1 Field observations ........................................................................................................ 37
4.4.1.2 Interviews .................................................................................................................... 37
4.4.2 Key documents ................................................................................................................... 39 4.4.3 Land use change and forestry data ..................................................................................... 41
4.5 Data analysis ...................................................................................................................... 41
4.5.1 Analytical background of specific study elements ............................................................. 42
4.5.1.1 Assessing the achievements of REDD+ and FLEGT-VPA ......................................... 42
4.5.1.2 Before-After comparison of forest loss ....................................................................... 46
4.5.1.3 Driving forces and challenges to the REDD+ implementation ................................... 48
4.5.2 Content analysis of interview transcripts and key documents ............................................ 51
4.5.3 Analysis of remote sensing data (forest loss analysis) ....................................................... 52
5 Results .......................................................................................................................................... 60
5.1 Achievements and limitations of REDD+ in East Kalimantan and Berau ........................ 60
5.1.1 Criterion 1: Enabling conditions for sustainable forest management ................................. 64
5.1.1.1 Outputs related to policies and regulations for governing forests ............................... 64

IX
5.1.1.2 Outputs related to institutions supportive of forest management ................................ 64
5.1.1.3 Outcomes related to forest governance ....................................................................... 65
5.1.1.4 Outcomes related to political commitment and ownership to support REDD+ ......... 65
5.1.1.5 Outputs related to the development of strategy and action plans for forests ............... 65 5.1.1.6 Outcomes/outputs related to building institutional capacity and capacity in land
use management .......................................................................................................... 67
5.1.1.7 Outputs related to the integration of forests in land-use planning ............................... 68
5.1.1.8 Outputs related to monitoring and planning of SFM related projects ......................... 68
5.1.1.9 Outputs related to funding committed to SFM – incentives to encourage SFM ........ 69
5.1.2 Criterion 2: Extent and conditions of forests ...................................................................... 69
5.1.2.1 Outputs/outcomes related to the extent of and change in forest area and carbon
stocks ........................................................................................................................... 69
5.1.2.2 Outputs related to forest area in compliance schemes ................................................. 70
5.1.2.3 Outputs related to multiyear forest management plans ............................................... 70
5.1.3 Criterion 3: Forest ecosystem health and resilience ........................................................... 70
5.1.3.1 Outputs/outcomes related to addressing threats to forests and climate change
adaption ....................................................................................................................... 70
5.1.3.2 Outputs related to restoring forest land ....................................................................... 71
5.1.4 Criterion 4: Forest production ............................................................................................ 71
5.1.4.1 Outputs/outcomes related to silvicultural operations and their monitoring in
natural forests .............................................................................................................. 71
5.1.4.2 Outputs related to resource assessment ....................................................................... 72
5.1.4.3 Outputs related to forest product tracking system ....................................................... 72 5.1.5 Criterion 5: Forest biological diversity .............................................................................. 72
5.1.5.1 Outputs related to ecosystem diversity ........................................................................ 72
5.1.5.2 Outputs related to forest species diversity ................................................................... 72
5.1.5.3 Outputs related to biodiversity conservation in production forests ............................. 73
5.1.6 Criterion 6: Soil and water protection ................................................................................ 73
5.1.6.1 Outputs related to the protective function of (production) forests for soil and
water ............................................................................................................................ 73
5.1.7 Criterion 7: Economic, social and cultural aspects ............................................................ 73
5.1.7.1 Outputs related to local livelihoods and forest management ....................................... 73
5.1.7.2 Outputs related to the economic aspects of forests ...................................................... 74
5.1.7.3 Outputs related to resolving disputes between forest stakeholders ............................. 74
5.1.7.4 Outputs related to village forest management rights ................................................... 75
5.2 Forest loss in East Kalimantan and Berau .......................................................................... 75
5.2.1 Forest cover in East Kalimantan and Berau ....................................................................... 75
5.2.2 Forest loss in East Kalimantan and Berau boundaries ....................................................... 78
5.2.2.1 Total and annual forest loss in East Kalimantan ......................................................... 78
5.2.2.2 Comparing forest loss of ‘non-REDD+’ and ‘REDD+-period’ in East
Kalimantan .................................................................................................................. 81
5.2.2.3 Total and annual forest loss in Berau .......................................................................... 82
5.2.2.4 Comparing forest loss of ‘non-REDD+’ and ‘REDD+- period’ in Berau ................... 83
5.2.3 Forest loss in forest land use permits in Berau ................................................................... 84
5.2.3.1 Comparing forest loss of ‘non-REDD+’ and ‘REDD+-period’ .................................. 86
5.2.4 Forest loss in non-forest land use permits in Berau ........................................................... 86
5.2.4.1 Comparing forest loss of ‘non-REDD+’ with ‘REDD+ period’ ................................. 88
5.3 Achievements and limitations of FLEGT-VPA in East Kalimantan and Berau ............... 88
5.3.1 Criterion 1: Enabling conditions for sustainable forest management ................................. 91
5.3.1.1 Outputs related to policies and regulations for governing forests ............................... 91
5.3.1.2 Outputs related to institutions supportive to forest management ................................ 91

X
5.3.1.3 Outcomes/outputs related to building institutional capacity ....................................... 91
5.3.1.4 Outputs/outcomes and limitations related to forest management planning and
monitoring ................................................................................................................... 92
5.3.1.5 Outputs and limitations related to stakeholder participation in forest
management monitoring .............................................................................................. 92
5.3.1.6 Outputs related to building capacity in forest management planning and
monitoring ................................................................................................................... 93
5.3.1.7 Outcomes related to forest governance ....................................................................... 93
5.3.1.8 Outputs related to funding committed to SFM ............................................................ 94
5.3.1.9 Outputs and limitations related to incentives to encourage SFM ................................ 94
5.3.2 Criterion 2: Extent and conditions of forests ...................................................................... 95
5.3.2.1 Outputs/outcomes and limitations related to the extent of and change in forest
area .............................................................................................................................. 95
5.3.2.2 Outputs related to forest area in compliance schemes ................................................. 95
5.3.2.3 Outputs related to multiyear forest management plans in concessions ....................... 95
5.3.3 Criterion 3: Forest ecosystem health and resilience ........................................................... 96
5.3.3.1 Outputs/outcomes and limitations related to addressing threats to, and
vulnerabilities to forests .............................................................................................. 96
5.3.4 Criterion 4: Forest production ............................................................................................ 96
5.3.4.1 Outputs and limitations related to resource assessment .............................................. 96
5.3.4.2 Outputs related forest product tracking systems .......................................................... 96
5.3.4.3 Outputs and limitations related to silvicultural operations and their monitoring
in natural and planted forests ....................................................................................... 96 5.3.5 Criterion 5: Forest biological diversity .............................................................................. 97
5.3.5.1 Outputs/limitations related to biodiversity conservation in production forests .......... 97
5.3.6 Criterion 6: Soil and water protection ................................................................................ 98
5.3.7 Criterion 7: Economic, social and cultural aspects ............................................................ 98
5.3.7.1 Outputs/limitations related to the economic aspects of forests ................................... 98
5.3.7.2 Outputs/limitations related to resolving disputes between forest stakeholders .......... 98
5.3.7.3 Outputs related to labor rights and equitable benefit resolution .................................. 99
5.3.7.4 Outputs related to village forest management rights ................................................... 99
5.4 Forest loss on the concession level in Berau .................................................................... 100
5.4.1 Forest loss in the entire natural forest concession (HA) area ........................................... 101
5.4.1.1 Separating small- from large-scale forest loss ........................................................... 102
5.4.2 Forest loss in single HA concessions ............................................................................... 103
5.4.2.1 Separating small- from large-scale forest loss ........................................................... 104
5.4.3 Forest management certifications in Berau ...................................................................... 107
5.4.4 Forest loss by certification status ..................................................................................... 108
5.4.4.1 Small- and large-scale forest loss by certification status ........................................... 110
5.5 Driving forces of and hindrances to the subnational REDD+ process ............................. 115
5.5.1 Hindrances to the subnational REDD+ process ............................................................... 115
5.5.1.1 Hindrances related to the institutional setting ........................................................... 115
5.5.1.2 Hindrances related to policy arena ............................................................................ 117
5.5.2 Driving forces of subnational REDD+ process ................................................................ 122
5.5.2.1 Driving forces related to institutional setting ............................................................ 122
5.5.2.2 Driving forces related to policy arena ....................................................................... 125
6 Discussion .................................................................................................................................. 129
6.1 Key findings ..................................................................................................................... 129
6.1.1 REDD+ ............................................................................................................................. 130
6.1.2 FLEGT ............................................................................................................................. 131
6.1.3 Joint lessons of REDD+ and FLEGT for SFM ................................................................ 132

XI
6.2 Subnational REDD+ achievements and limitations relevant to SFM .............................. 133
6.2.1 Objective 1: Providing the enabling conditions for SFM ................................................. 133
6.2.2 Objective 2: Ensuring forest ecosystem health and vitality ............................................. 135
6.2.3 Objective 3: Maintaining the multiple functions of forests to deliver products and
environmental services ..................................................................................................... 135
6.2.4 Objective 4: Integrating social, cultural and economic aspects to implement SFM ....... 136
6.3 Contribution of REDD+ to forest loss reduction .............................................................. 137
6.4 Subnational FLEGT-VPA-related achievements and limitations relevant to SFM......... 141
6.4.1 Objective 1: Providing the enabling conditions for SFM ................................................. 142
6.4.2 Objective 2: Ensuring forest ecosystem health and vitality ............................................. 144
6.4.3 Objective 3: Maintaining the multiple functions of forests to deliver products and
environmental services ..................................................................................................... 145
6.4.4 Objective 4: Integrating social, cultural and economic aspects to implement SFM ....... 146
6.5 Contribution of FLEGT-VPA to forest loss reduction ..................................................... 147
6.6 Driving forces of and hindrances to subnational REDD+ ................................................ 150
6.7 The methodological approach and its limitations ............................................................. 153
7 Conclusion ................................................................................................................................. 156
References .......................................................................................................................................... 158
Annex I: List of interviewees ............................................................................................................ 168
Annex II: Interview guidelines ......................................................................................................... 171
REDD+ interview guideline ........................................................................................................... 171
FLEGT interview guidelines ........................................................................................................... 172
Annex III: Forest loss in forest concessions in Berau .................................................................... 173

XII
List of Figures
Figure 1: Description of the three phases of REDD+ implementation based on COP decision
1/CP.16. Source: United Nations Environment Programme (2017). ................................... 3
Figure 2: Research questions. .............................................................................................................. 7
Figure 3: Linking the different components of the study. Blue frame = research question 3; red
frame = research question 1 and 2; the linkages between the holistic concept of SFM
and REDD+ and FLEGT are exemplarily indicated. ........................................................... 8
Figure 4: Land use classes in Indonesia. ........................................................................................... 19
Figure 5: National REDD+ landscape in Indonesia. JIC = Joint Implementation committee; green
flags = FCPF related milestones; blue flags = REDD+ institutional landscape; yellow
flags = grants. ..................................................................................................................... 25
Figure 6: FLEGT landscape in Indonesia. Red flags = FLEGT-VPA related milestones; blue flag
= PHPL milestone. ............................................................................................................. 26
Figure 7: Institutional set-up of SVLK. Source: Indonesia and EU (2015). ..................................... 28
Figure 8: Forest cover in East Kalimantan Province (above) and Berau District (below) in 2000.
HA = natural forest concession boundaries. ...................................................................... 32
Figure 9: Research framework. FbA = forest-based approaches. ..................................................... 36
Figure 10: Examples of reference and certification periods of concessions. No permit = concession
obtained their concession permit later than 2001............................................................... 47
Figure 11: Steps of preparation and analysis of interviews and their synthesis with other study
elements. Discussion is part of validation. ......................................................................... 51
Figure 12: Process of generating the area per land use class. Division = province or district; SK
718/2014 = Spatial plan of 2014; projected from degrees into m². ................................... 53
Figure 13: Process of generating forest cover base maps of 2000 (‘Forest cover 2000_Division’)
and of calculating forest cover in land use class and permit boundaries;
Borneo_FCDF_1973-2016 = data set of Gaveau et al. (2016). ......................................... 53
Figure 14: Process of calculating annual forest loss in the divisions East Kalimantan and Berau and
in their land use classes and permits. ................................................................................. 54
Figure 15: Process of determining annual small- and large-scale forest loss in natural forest
concession boundaries. ...................................................................................................... 56
Figure 16: Product of focal statistic. Showing the range of the sum of cells (1-81) in the
neighbourhood of each pixel for a 9x9 rectangle moving window with ‘sum’ as a statistic
type. ................................................................................................................................... 57
Figure 17: Example of large-scale forest loss in Berau in Google Earth as of 12/2016 (1° 58.413’
N 117° 1.321’ E). ............................................................................................................... 58

XIII
Figure 18: Large-scale forest loss between 2001 and 2016 in ArcGIS of the excerpt in Figure 17. ... 58
Figure 19: Example of small-scale forest loss in Berau in Google Earth as of 12/2016 (2° 16.204’
N 117° 7.588’ E). ............................................................................................................... 59
Figure 20: Small-scale forest loss between 2001 and 2016 in ArcGIS of the excerpt in Figure 19. ... 59
Figure 21: Land use classes of East Kalimantan as of spatial plan SK 718/2014. .............................. 76
Figure 22: Land use classes of Berau as of spatial plan SK 718/2014. ............................................... 77
Figure 23: Forest loss in East Kalimantan from 2001 to 2016 based on Gaveau et al. (2016) and M.
C. Hansen et al. (2013). ..................................................................................................... 79
Figure 24: Forest loss in Berau from 2001 to 2016 based on Gaveau et al. (2016) and M. C. Hansen
et al. (2013). ....................................................................................................................... 79
Figure 25: Share of annual forest loss of each district from 2001 to 2016 in East Kalimantan. ......... 80
Figure 26: Total forest loss per land use class from 2001 to 2016 in East Kalimantan. ..................... 81
Figure 27: Annual forest loss in each land use class from 2001 to 2016 in East Kalimantan. ............ 81
Figure 28: Annual forest loss in each land use class from 2001 to 2016 in Berau District. ................ 83
Figure 29: Total forest loss per land use class from 2001 to 2016 in Berau. ...................................... 83
Figure 30: Forest loss in natural forest concession permit (HA) and industrial timber plantation
permit (HTI) boundaries from 2001 to 2016 in Berau. ...................................................... 84
Figure 31: Annual forest loss in natural forest concession permit boundaries from 2001 to 2016 in
Berau (Number of concessions = 21)............................................................................... 85
Figure 32: Annual forest loss in industrial timber plantation permit boundaries from 2001 to 2016
in Berau. ............................................................................................................................. 85
Figure 33: Forest loss in oil palm and mining permit boundaries from 2001 to 2016 in Berau. ......... 87
Figure 34: Annual forest loss in oil palm permit boundaries from 2001 to 2016 in Berau. ................ 87
Figure 35: Annual forest loss in mining permit boundaries from 2001 to 2016 in FMU Berau Barat.
........................................................................................................................................... 88
Figure 36: Forest loss in natural forest concession boundaries (HA) from 2001 to 2016 in Berau. . 101
Figure 37: Small-scale forest loss in natural forest concession boundaries (HA) from 2001 to 2016
in Berau. ........................................................................................................................... 102
Figure 38: Large-scale forest loss in natural forest concession boundaries (HA) from 2001 to 2016
in Berau. ........................................................................................................................... 103
Figure 39: Distribution of annual forest loss expressed as a percentage of a concessions’ 2000 forest
cover of the 18 concessions under investigation. ............................................................. 104

XIV
Figure 40: Annual forest loss expressed as a percentage of a concessions’ 2000 forest cover from
2001 and 2016 of the 18 concessions under investigation. Blue intercept = year of
legality certification; red intercept = year of PHPL certification; y-scales vary;
concession no. 5, 12, 13 and 16 obtained their permission after 2001, annual forest loss
in those years was not calculated. .................................................................................... 105
Figure 41: Annual small- and large-scale forest loss expressed as a percentage of a concessions’
2000 forest cover of the 18 concessions under investigation. .......................................... 106
Figure 42: Natural forest concessions and their certification status as of 2016 in Berau. Concessions
had obtained only PHPL or legality (LK) certifications or had first obtained a LK and
later a PHPL certification (LK & PHPL); inactive = inactive concession or unknown
certification status. ........................................................................................................... 107
Figure 43: Number of concessions for each certification status between 2000 and 2016. Non =
without forest certification; LK = with legality certification; PHPL = with PHPL
certification. ..................................................................................................................... 107
Figure 44: Annual forest loss expressed as percentage of a concessions’ 2000 forest cover by
certification status from 2001 to 2016 of the 18 concessions under investigation; non =
without certification LK = with legality certification; PHPL = with PHPL certification.
................................................................................................................................... 109
Figure 45: Distribution of annual forest loss expressed as a percentage of a concessions’ 2000 forest
cover among the 18 concessions by certification status. Non = without certification; LK
= with legality certification; PHPL = with PHPL certification. ...................................... 110
Figure 46: Difference in the mean annual forest loss (expressed as a percentage of a concessions’
2000 forest cover) between the certification period(s) and the reference period of the 18
concessions under investigation; LK = with legality certification; PHPL = with PHPL
certification. ..................................................................................................................... 110
Figure 47: Annual forest loss expressed as a percentage of a concessions’ 2000 forest cover of the
18 concessions under investigation by certification status from 2001 to 2016; non =
without certification LK = with legality certification; PHPL = with PHPL certification.
......................................................................................................................................... 111
Figure 48: Distribution of small- and large-scale annual forest loss expressed as a percentage of a
concessions’ 2000 forest cover of the 18 concessions under investigation by certification
status; non = without certification ; LK = with legality certification; PHPL = with PHPL
certification. ..................................................................................................................... 113
Figure 49: Difference in the mean annual small- and large-scale forest loss (expressed as a
percentage of a concessions’ 20000 forest cover) between the certification period(s) and
the reference period of the 18 concessions under investigation; LK = with legality
certification; PHPL = with PHPL certification. ............................................................... 114
Figure 50: Interplay of identified hindrances related to the policy arena of the subnational REDD+
process in the focus area .................................................................................................. 117
Figure 51: Interplay of identified driving forces of the subnational REDD+ process in the focus
area; CS = civil society. ................................................................................................... 122

XV
List of Tables
Table 1: Forest cover of legally designated ‘forest’ and ‘non-forest area’ based on Indonesian law
and FAO (2015). I MoEF and RoI (2018) define forests as a land area of more than 6.25
ha with trees higher than 5 m at maturity and a canopy cover of more than 30%. II FAO
(2015) defines forest as an area of land of more than 0.5 ha with tree canopy cover of
more than 10% and trees higher than 5 m at maturity. ...................................................... 19
Table 2: Land use classes potentially harbouring forest by function in Indonesia. Adapted and
modified from Margono et al. (2012); NTFP = Non-timber forest products. .................... 20
Table 3: PHPL criteria and indicators. Source: Maryudi et al. (2017)............................................. 22
Table 4: Planned and unplanned drivers of deforestation and forest degradation. Adapted from
Government of Indonesia (2014). ...................................................................................... 23
Table 5: Elements of the Indonesian TLAS. Source: EU (2014) and EU FLEGT Facility. ............ 27
Table 6: Indonesian legality standards. Source: EC (2015). ............................................................ 28
Table 7: Principles and criteria of legality standard in production forest zone. Source: EC (2015).
........................................................................................................................................... 29
Table 8: Number of consulted stakeholders in 2016 & 2017. *Includes four stakeholders that
were also consulted for semi-structured interviews. .......................................................... 37
Table 9: List of consulted people by approach and stakeholder group during first and second field
stay. Three stakeholders were consulted for both REDD+ and FLEGT and are,
therefore, listed under both regimes................................................................................... 37
Table 10: (Spatial) data and its sources used for analysis on the provincial, district and concession
level. ................................................................................................................................... 41
Table 11: Evaluative framework: ITTO objectives and criteria for the sustainable management of
tropical forests and the corresponding NLBI SFM element. Source: ITTO (2016). ........ 44
Table 12: Analytical time frame. ....................................................................................................... 46
Table 13: Evaluative framework: Operationalization of enabling conditions to achieve a REDD+
environment. Adapted and modified (to subnational context) from Korhonen-Kurki et
al. (2014), Brockhaus et al. (2016) and Korhonen-Kurki et al. (2018), and building on
Angelsen et al. (2012). ....................................................................................................... 50
Table 14: List of variables on the provincial, district and concession level. ..................................... 55
Table 15: Summary of subnational REDD+ achievements (outputs and outcomes) relevant for
SFM in East Kalimantan (incl. Berau). BFCP = Berau Forest Carbon Program; RPJMD
= regional development plan; RTRWK = regional spatial plan; ER = Emission
Reduction; HCV = High Conservation Value; FPIC = Free, Prior and Informed Consent;
NTFP = Non-Timber Forest Products. ............................................................................. 60

XVI
Table 16: Land use class area (calculated based on SK 718/2014) and their forest cover in 2000
(based on Gaveau et al. (2016)) in East Kalimantan.......................................................... 77
Table 17: Land use class area (calculated based on SK 718/2014) and their forest cover in 2000
(based on Gaveau et al. (2016)) in Berau. ......................................................................... 77
Table 18: Annual forest loss in East Kalimantan and Berau. ............................................................ 80
Table 19: Annual and total forest loss in each land use class in East Kalimantan from 2001 to 2016;
range = minimum and maximum annual forest loss values; *with data from Gaveau et
al. (2016) and M. C. Hansen et al. (2013); I with data from spatial plan SK78/2014. ....... 82
Table 20: Annual and total forest loss in each land use class in Berau from 2001 to 2016; range =
minimum and maximum annual forest loss values; *with data from Gaveau et al. (2016)
and M. C. Hansen et al. (2013); I with data from spatial plan SK78/2014. ........................ 84
Table 21: Annual and total forest loss in forest and non-forest land use permit boundaries in Berau
from 2001 to 2016; range = minimum and maximum annual forest loss values. ............. 86
Table 22: Summary of FLEGT-VPA achievements (outcomes and outputs) with a relevance for
the focus area; MFP = Multi-stakeholders Forestry Programme; JIC= Joint
Implementation Committee; FPIC = Free, Prior, and Informed Consent; SME = small
and medium enterprise. ...................................................................................................... 89
Table 23: Basic information of incorporated concessions in Berau District. Baseline = 2001 for all
concessions that obtained their permit before 2001, or year of concession permit
issuance; concession size as of permit decree; forest cover within concession boundaries
in Berau calculated based on forest cover base map of 2000; LK = timber legality
certificate; PHPL = PHPL certificate. .............................................................................. 100
Table 24: Total forest loss within the concession area within Berau between 2001 and 2016.
Regarding only those losses that occurred under a concession permit. I expressed as a
percentage of the 2000 forest cover of the area covered by the 18 concessions within the
Berau district. ................................................................................................................... 101
Table 25: Averages of annual forest loss of the concession area within Berau from 2001 to 2016.
Regarding only those losses that occured under a concession permit. I expressed as a
percentage of total forest cover in 2000 of the area covered by the 18 concessions within
the Berau district. ............................................................................................................. 102
Table 26: Total forest loss of the reference (period without certification), legality (LK) and PHPL
certification period between 2001 and 2016. Regarding only those losses that occurred
under a concession permit. ............................................................................................... 108
Table 27: Averages of annual forest loss of a concession by certification status between 2001 and
2016 in Berau. Non = period without certification (reference period); LK = legality
certification period; PHPL = PHPL certification period. Regarding only those losses that
occurred under a concession permit. ................................................................................ 108
Table 28: Averages of annual small- and large-scale forest loss of a concession by certification
status between 2001 and 2016 in Berau. Non = period without certification (reference
period); LK = legality certification period; PHPL = PHPL certification period. ............ 111

XVII
Table 29: Operationalization of enabling conditions to establish a REDD+ environment. Adapted
and modified to the subnational context in East Kalimantan and Berau from Korhonen-
Kurki et al. (2014), Brockhaus et al. (2016) and Korhonen-Kurki et al. (2018).
Conditions in Berau and East Kalimantan based on interviews and key document
analysis. ........................................................................................................................... 127
Table 30: List of consulted interviewees. ........................................................................................ 168
Table 31: Forest loss in concessions in Berau from baseline year to 2016. CN = concession
number; n year permit = number of years with concession permit; %-values = forest loss
expressed as percentage of a concessions’ 2000 forest cover; values for comparison
among concessions = annual (yr) forest loss [%]. ........................................................... 173
Table 32: Small-scale forest loss in concessions in Berau from baseline year to 2016. CN =
concession number; n year permit = number of years with concession permit; %-values
= forest loss expressed as percentage of a concessions’ 2000 forest cover; values for
comparison among concessions = annual (yr) forest loss [%]. ........................................ 174
Table 33: Large-scale forest loss in concessions in Berau from baseline year to 2016. CN =
concession number; n year permit = number of years with concession permit; %-values
= forest loss expressed as percentage of a concessions’ forest cover in 2000; values for
comparison among concessions = annual (yr) forest loss [%]. ........................................ 175
Table 34: Total forest loss results of each concession by certification status. CN = concession
number; Ref = period without certification (reference); LK = period with legality
certification; PHPL = period with PHPL certification; Ʃ loss = total forest loss from
baseline year to 2016; Y = length of reference or certification period in years; %-values
= forest loss expressed as percentage of a concessions’ 2000 forest cover.. .................. 176
Table 35: Average annual forest loss values of each concession. CN = concession number;
Reference = without certification; LK = with legality certification; PHPL = with PHPL
certification; X̄ = mean annual forest loss from baseline year to 2016; Y = length of
reference or certification period in years; %-values = forest loss expressed as percentage
of a concessions’ 2000 forest cover. ................................................................................ 177
Table 36: Total small-scale forest loss results of each concession by certification status. Reference
= without certification; LK = with legality certification; PHPL = with PHPL
certification; Ʃ loss = total forest loss from baseline year to 2016; Y = length of reference
or certification period in years; %-values = forest loss expressed as percentage of a
concessions’2000 forest cover. ........................................................................................ 179
Table 37: Average annual small-scale forest loss values of each concession. CN = concession
number; Reference = without certification; LK = with legality certification; PHPL =
with PHPL certification; X̄ = mean annual forest loss from baseline year to 2016; Y =
length of reference or certification period in years; %-values = forest loss expressed as
percentage of a concessions’ 2000 forest cover. .............................................................. 180
Table 38: Total large-scale forest loss results of each concession. Reference = without
certification; LK = with legality certification; PHPL = with PHPL certification; Ʃ loss =
total forest loss from baseline year to 2016; Y = length of reference or certification
period in years; %-values = forest loss expressed as percentage of a concessions’ 2000
forest cover. ..................................................................................................................... 182

XVIII
Table 39: Average annual large-scale forest loss values of each concession. CN = concession
number; Reference = without certification; LK = with legality certification; PHPL =
with PHPL certification; X̄ = mean annual forest loss from baseline year to 2016; Y =
length of reference or certification period in years; %-values = forest loss expressed as
percentage of a concessions’ 2000 forest cover. .............................................................. 183

XIX
Abbreviations
APL Non-forest area
BAU Business as Usual
BFCP Berau Forest Carbon Program
CAB Conformity Assessment Bodies
CBD Convention on Biological Diversity
CIFOR The Center for International Forestry Research
CITES Convention on International Trade in Endangered Species
COP Conference of the Parties
CSO Civil Society Organisation
DDPI Dewan Daerah Perubahan Iklim (Regional Council on Climate Change)
DFID Department for International Development of the UK
DGCC Directorate General of Climate Change Oversight
EIA Environmental Impact Assessment
ER-PIN FCPF Carbon Fund Emissions Reduction Program Idea Note
EU European Union
EUTR EU Timber Regulation
FAO Food and Agriculture Organisation
FbA Forest-based Approaches
FCPF Forest Carbon Partnership Facility
FLEGT Forest Law Enforcement, Governance and Trade
FMU Forest Management Unit
FSC Forest Stewards Council
GDP Gross Domestic Product
GHG Greenhouse Gas
GIZ Gesellschaft für Internationale Zusammenarbeit
HA Natural Forest Concession
HCV High Conservation Value
HK Conservation Forest
HL Protection Forest
HP Permanent Production Forest
HPK Convertible Production Forest
HPT Limited Production Forest
HTI Timber Plantation Concession
IPK Izin Pemanfaatan Kayu (Timber Utilization Permit)
ITTO International Tropical Timber Organization
JPIK Jaringan Pemantau Independen Kehutanan (Independent Forest Monitoring Network)
LK Legalitas Kayu (Timber Legality)
LoI Letter of Intent
MCAI Millennium Challenge Account Indonesia
MFP Multi-stakeholder Forestry Program

XX
MoEF Ministry of Environment and Forestry
MoF Ministry of Forestry
MRV Measurement, Reporting and Verification
NGO Non-Governmental Organisation
NLBI Non-legally binding Instrument on all types of forests
OMI One Map Initiative
PHPL Pengelolaan Hutan Produksi Lestari (Sustainable Production Forest Management)
RAD-GRK Regional Action Plan for GHG emission Reduction
REDD+ Reducing Emissions from Deforestation and Forest Degradation and the Role of
Conservation, Sustainable Management of Forests and Enhancement of Forest Carbon
Stocks in Developing Ccountries
RIL Reduced Impact Logging
RIL-C Reduced Impact Logging-Carbon
RPJMD Provincial Mid-term Development Plan
SEA Strategic Environmental Assessment
SFM Sustainable Forest Management
SIGAP-
REDD+
Communities Inspiring Action for Change in REDD+
SIS Safeguard Information System
SME Small and Medium Enterprise
SRAP Provincial Strategy and Action Plan
SVLK Sistem Verificasi Legalitas Kayu (Timber Legality Assurance System)
TBI The Borneo Initiative
TFCA Tropical Forest Conservation Act
TLAS Timber Legality Assurance System
TNC The Nature Conservancy
TPTI Tebang Pilih Tanam Indonesia (Indonesian Selective Cutting with Replanting System)
UNCCD United Nations Convention to Combat Desertification
UNFCCC United Nations Framework Convention on Climate Change
UNMUL University Mulawarman Samarinda
VLK Verification of Timber Legality
VPA Voluntary Partnership Agreement
WWF The World Wide Fund for Nature

Chapter 1: Introduction
1
1 Introduction
For decades, the international forestry arena has seen numerous instruments and initiatives seeking to
halt deforestation and forest degradation and currently shaping global forest governance (McDermott,
2014; Secco et al., 2014). A common element of these approaches – hereafter referred to as forest-based
approaches (FbA) – is the promotion of sustainable forest management (SFM). Despite their ultimate
goal to foster SFM, it remains unclear how these approaches actually contribute to SFM, especially on
the subnational level.
This study investigates the contribution to SFM on the subnational level of two recent FbAs, namely
REDD+ (Reducing emissions from deforestation and forest degradation and the role of conservation,
sustainable management of forests and enhancement of forest carbon stocks in developing countries)
and FLEGT-VPAs (Forest Law Enforcement, Governance and Trade-Voluntary Partnership
Agreements). Specifically, this study identifies REDD+ and FLEGT-VPA related achievements and
their limitations relevant for SFM in East Kalimantan, Indonesia. As a key requirement to sustaining
forests, special attention is given to achievements in relation to reducing forest loss. Factors that drive
and hinder the subnational REDD+ implementation are, moreover, identified. These factors ultimately
influence the success of FbAs in a specific region and therewith their ability to contribute to SFM.
The following briefly introduces the concepts of ‘forest governance’ and ‘sustainable forest
management’. The global approaches of ‘REDD+’ and ‘FLEGT’ are then subsequently introduced. The
subsequent chapters outline the motivation and scope of the research, the study’s objectives and the
structure of the thesis.
1.1 Forest governance
Various definitions exist for the concept of forest governance. Following Cowling et al. (2014), forest
governance “comprises all the social and economic systems that affect how people interact with forests,
including bureaucracies, laws, policies, traditional norms and culture, patterns of land tenure, and
markets” (p. 13). An alternative and more comprehensive definition that represents both private actors
and institutions, and governments is proposed by Giessen and Buttoud (2014):
“forest governance comprises a) all formal and informal, public and private regulatory structures, i.e.
institutions consisting of rules, norms, principles, decision procedures, concerning forests, their
utilisation and their conservation, b) the interactions between public and private actors therein and c)
the effects of either on forests” (p. 1).
Global forest governance is shaped by several global initiatives – or as referred to in this study as
FbAs – legally or non-legally binding in nature and directly or indirectly relating to forests. Among
those are norms such as the Forest Principles or the Non-Legally Binding Instrument on all Types of
Forests that directly apply to forests but are not legally binding. Agreements such as the three United
Nations Rio Conventions (UNFCCC3, UNCBD4 and UNCCD5) are legally-binding but relate only
indirectly to forests as they focus on different regulatory subjects (e.g. on the conservation of
biodiversity).
Other recent examples of such FbAs are REDD+ and FLEGT.
The issues of forests are thus distributed among numerous treaties and mechanisms. Rodríguez
Fernández-Blanco et al. (2019) found that global forest governance in 2014 was composed of 41 forest-
focused and forest-related institutional elements, among them the aforementioned UN conventions and
REDD+. Global forest governance is, therefore, often referred to as being ‘fragmented’, ‘incomplete’,
and ‘ineffective’ (Faggin & Behagel, 2017; Giessen, 2013; Singer & Giessen, 2017).
3 United Nations Framework Convention on Climate Change (UNFCCC) 4 Convention on Biological Diversity (CBD) 5 United Nations Convention to Combat Desertification (UNCCD)

Chapter 1: Introduction
2
Those characteristics are closely related to the inherent complexity of forest governance in the absence
of a legally binding forest instrument (forest convention).
No approach has so far succeeded in halting forest loss – which is a key requirement for SFM. The
fragmentation of global forest governance itself has partly been blamed for its ineffectiveness as each
approach lacks the comprehensiveness and forest-specific detail of a forest convention (Eikermann,
2015; Giessen, 2013; Singer & Giessen, 2017).
1.1.1 REDD+ and FLEGT
In the absence of a legally binding forest instrument (or forest convention), the international governance
and protection of forests is regulated and promoted by different forest-related initiatives (Roessing Neto,
2015). Such FbAs are typically multi-actor, multi-sectors and multi-level (Lemos and Agrawal, 2006;
Rametsteiner, 2009 in Secco et al. (2014)). They are designed on an international or global level and
influence national forest policies that in turn influence subnational policies and programs (ibd.). General
goals that are formulated in international agreements have to be translated into more concrete objectives
and activities on the local level. Depending on the national circumstances, this can be realized in many
different ways.
While a common element of these FbAs is the concept of SFM to reverse global forest cover loss, their
scope and focus on forests as well as their applied strategies and measures vary depending on the purpose
and actual priority of each instrument and therewith their interlinkage with the concept of SFM
(Eikermann, 2015).
Two such relatively new FbAs are REDD+ and FLEGT-VPA. While REDD+ originally focuses on the
reduction of greenhouse gas (GHG) emissions from the forestry sector and the increase of GHG
removals, FLEGT-VPAs aim to tackle the trade of illegal logging. Both require the establishment of a
country-specific national framework that regulates implementation on the ground.
REDD+
REDD+ was proposed in 2005 at the 11th Conference of the Parties (COP) to the UNFCCC and
enshrined into the Paris Agreement concluded at the COP21 in 2015. The underlying idea of is to
compensate countries or individuals for foregone costs related to avoiding deforestation and forest
degradation, conservation and enhancement of forest carbon stocks and sustainable forest management.
Result-based payments thereby provide positive incentives to developing countries to reduce emissions
and increase removals in the forestry sector.
Since 2007, the UNFCCC COP have published guidances on REDD+, the most relevant being the seven
Warsaw Framework for REDD+ adopted at COP 19 in 2013. Through COP decision 1/CP. 16 countries
are requested to have the following REDD+ elements in place to receive result-based payment under the
UNFCCC6:
- A National strategy or Action Plan
- A National Forestry Monitoring System including Measurement, Reporting and Verification
(MRV)
- A Safeguard Information System (SIS) and
- A Forest Reference Emission Level and/or Forest Reference Level
REDD+ implementation can be achieved in three phases: Readiness phase, implementation phase and
result-based actions phase. In practice, the single phases overlap in their implementation. Figure 1
provides more detail on each phase.
There are currently more than 60 countries participating in REDD+7. One of these is Indonesia.
6 For more information on the single elements see https://redd.unfccc.int/. 7 https://redd.unfccc.int

Chapter 1: Introduction
3
Following the promotion of the REDD+ mechanism through the UNFCCC COP decisions, a plethora
of subnational pilot activities have revealed in nearly all of the participating REDD+ countries.
Activities aim to test the different REDD+ elements and generate important lessons for the development
of the national REDD+ framework.
Figure 1: Description of the three phases of REDD+ implementation based on COP decision 1/CP.16.
Source: United Nations Environment Programme (2017).
FLEGT
In 2003, the European Commission presented an Action Plan on Forest Law Enforcement, Governance
and Trade (FLEGT EU Action Plan) to address the growing problem of illegal logging and related trade
(European Commission [EC], 2003). The FLEGT EU Action Plan sets out demand and supply side
measures. It thereby recognizes the shared responsibilities between consumer and producer countries
(Jonsson et al., 2015). The following seven measures are set out in the FLEGT EU Action Plan (EC,
2003):
- Support to timber-producing countries: for example, support of timber producing countries to
set up verification systems to identify legally harvested timber destined for the EU market,
encourage greater transparency of information within the forest sector, support to build capacity
to implement broad governance reforms, support policy reforms
- Promoting trade in legal timber: for example, through building bilateral or regional FLEGT
partnership agreements and developing a multilateral framework and international collaboration
by engaging other major timber consumers to restrict illegally harvested timber
- Promoting public procurement policies: for environmental aspects through the use of the
Handbook on Green Procurement that will present clear guidance on the utilization of
environmental considerations in public procurement procedures
- Supporting private sector initiatives: for example, encouraging the private sector in the EU to
work with the private sector in timber-producing countries according to voluntary codes of
practice for timber harvesting and procurement

Chapter 1: Introduction
4
- Financing and investment safeguards: for example, by encouraging banks and financial
institutions to take environmental and social factors into account when conducting due diligence
- Supporting the Action Plan with existing legislative instruments: for example, through
encouraging Member States to designate illegal logging as a crime under money laundering,
promoting research on endangered timber species to justify their inclusion in Appendices I and
II to CITES
- Addressing the problem of conflict timber, that is, timber traded by armed groups to fund armed
conflicts: for example, through initiate discussion with Member State, other donors and forested
countries on the role of forests during conflicts
The core of the FLEGT EU Action Plan are legally binding bilateral trade-agreements, so called
Voluntary Partnership Agreements (VPAs), between the EU and a timber producing country outside the
EU. The main purpose is to ensure that only legal timber and timber products are imported to the EU.
VPAs build on national state authority through better law enforcement. A core element of a VPA is a
Timber Legality Assurance System (TLAS). VPAs, moreover, contain frameworks for monitoring and
evaluating implementation and commitments to improve transparency and other aspects of forest
governance8.
Countries entering a VPA, design and develop their own TLAS that is commonly based on existing
control mechanisms and on the country-specific legislative context9. TLAS resemble forest management
certification schemes and verify that timber products conform to national laws. The following elements
are common to all TLAS (European Forest Institute 201910):
- A legality definition
- Supply chain control
- Verification of compliance
- FLEGT licensing
- Independent Audit
The single elements are exemplarily defined for Indonesia in Table 5.
After the ratification of the VPA and the development and implementation of a TLAS, partner countries
can issue FLEGT licenses for timber products destined for the EU market. FLEGT licenses are
documents that confirm that timber products comply with the law of the exporting country. Those
licenses are also recognized to comply with the requirements of the EU Timber Regulation (EUTR).
There are currently 15 tropical countries negotiating or implementing VPAs11. Indonesia is one of the
early VPA partner countries of the EU and was the first – and by the time of study conduction – only
country to issue FLEGT licenses12.
A second key element of the FLEGT EU Action Plan is the EUTR that came into force on March 3,
2013. It aims to ensure that no illegal timber enters the EU market. It stipulates three requirements for
European operators (European Parliament & The Council of the European Union, 2010; Jonsson et al.,
2015):
- The placing on the market of illegally harvested timber or timber products derived from such
timber is prohibited
8 For more information see http://www.vpaunpacked.org/en/web/vpa-unpacked-multilang/vpa-elements. 9 http://www.euflegt.efi.int/en/web/guest/vpa-elements 10 http://www.vpaunpacked.org/en/web/vpa-unpacked-multilang/timber-legality-assurance-system 11 http://www.flegtlicence.org/vpa-countries 12 See under 3.7 for the VPA between the EU and Indonesia as an example of how a VPA might be translated to the national
context.

Chapter 1: Introduction
5
- Operators shall exercise due diligence when placing timber or timber products on the market.
To that end they need to provide access to information on the timber product, implement risk
assessment and mitigation measures and procedures to minimize the likelihood of illegality
- Traders placing timber on the EU market have to keep record of the operators who have supplied
the timber and the traders to whom they have supplied the timber
As REDD+, the FLEGT EU Action Plan ultimately aims to encourage SFM (EC, 2003).
1.2 Background on sustainable forest management
In the following a brief background on the concept of SFM and its development is given.
The holistic concept of SFM
In global forest governance SFM is a key concept (Faggin & Behagel, 2017).
A cornerstone in the development of the SFM concept were the non-legally binding agreements reached
at the UN Conference on Environment and Sustainable Development, also called Rio or Earth Summit
in 1992. Two guiding documents for the management of forests were adopted there: The Forest
Principles and the Agenda 21 with chapter 11 ‘combating deforestation’. They provided the basis on
which to build a common understanding of SFM (Food and Agriculture Organization [FAO], 2005).
In the Forest Principles (United Nations [UN], 1992) it is stated that “Forest resources and forest lands
should be sustainably managed to meet the social, economic, ecological, cultural and spiritual needs of
present and future generations.” This definition stretches the multiple values and functions of forests.
Accordingly, the guiding objective of the Forest Principles is to contribute to the management,
conservation and sustainable development of all types of forests and to provide for the multiple and
complementary functions and uses (UN, 1992).
Since 1992 the concept of SFM continued to evolve through the Intergovernmental Panel on Forests,
Intergovernmental Forum on Forests, United Nations Forum on Forests and several international and
regional initiatives that aimed to translate the concept of SFM into practice and monitor its progress
(Wilkie et al., 2003). This involved the development of criteria and indicators of SFM as supported by
the Food and Agriculture Organisation (FAO) and the International Tropical Timber Organization
(ITTO) (Wilkie et al., 2003).
In 2007, the concept of SFM was further sharpened through the Non-legally binding Instrument on all
types of forests (NLBIs). There, SFM is broadly defined as a “dynamic and evolving concept, [is]
intended to maintain and enhance the economic, social and environmental value of all types of forests,
for the benefit of present and future generations” (UN, 2007, p. 2). Drawing from the criteria identified
by existing criteria and indicator processes, seven thematic elements were considered as a common
reference framework for SFM in the NLBIs (UN, 2007), these are:
1. Extent of forest resources
2. Forest biological diversity
3. Forest health and vitality
4. Productive function of forest resources
5. Protective function of forest resources
6. Socio-economic functions of forests
7. Legal, policy and institutional framework
Criterion 1 refers to the quantity of forests, or forest area and its changes, and to the aim of monitoring
the extent and characteristics of forests. Criteria 2 to 6 relate to the quality of forests and ecosystem
services that forests provide (Tegegne et al., 2018). Closely related to those five criteria is the aim to
assess, monitor and report on biological diversity (criterion 2), disturbances of forest ecosystems
(criterion 3), timber and non-timber forest products (criterion 4), the role of forests in water and soil
protection (criterion 5) and the economic and social benefits of forest management (criterion 6).

Chapter 1: Introduction
6
The last criterion, criterion 7, refers to the enabling condition of implementing SFM. It provides the
basis for the implementation of SFM and addresses the effective development and implementation of
forest policy and the related institutional capacity of national and subnational forest agencies (FAO,
2010).
Those seven thematic elements capture the environmental, social, economic and governance dimensions
of forests and embody the holistic concept of SFM (Tegegne et al., 2018).
In this study, SFM is understood as such a holistic approach that aims to balance environmental,
economic, social and governmental functions of forests.
The scale of SFM
Another important dimension of SFM is the scale at which it is applied.
The FAO13 and ITTO14 have introduced different geographical scales to the application of SFM. Their
classifications differ slightly.
One of these scales is the national level where goals and strategies, the legislative framework for the
sustainable management of forests and its monitoring is laid down and enabling conditions for the
subnational implementation are provided and prepared. Those national policies and objectives are
influenced by international and global processes on SFM.
The level below this is the subnational – or landscape – level that may stretch over a water catchment
area or an entire administrative unit, for example, a province or a district. On this level, the national
legislative framework is translated to the subnational context, for example, through the release of
governor decrees, the implementation of regional moratoriums, the formulation of regional land use
plans or the establishment and operationalization of subnational forest agencies. At these scales, a means
of considering multiple land use systems (forestry, forest plantations, agriculture or livestock areas) is
afforded and trade-offs will usually have to be made in the mix of services forests offer (International
Tropical Timber Organization [ITTO], 2016). Regional planning processes will decide over the quantity
and type of forests in a geographical or administrative unit and over their management.
The local level is referred to as the forest management unit level. It is guided through the subnational
level requirements and strategies and comprises individual forest stands that should be managed
sustainably according to their local conditions and purpose in the landscape.
The use of forests is planned on all levels (ITTO, 2016). The goals, strategies, policies, instruments and
institutional arrangements to implement SFM may vary considerably depending on the scale, but the
overall aim is to maintain and balance the various services of forests at all scales.
SFM today is implemented through various initiatives focusing on different aspects of forests and their
related problems. Examples are voluntary global or (mandatory) national certification schemes like the
Forest Stewards Council (FSC), the Programme for the Endorsement of Forest Certification Schemes
(PEFC) or the Indonesian Lembaga Ekolabel Indonesia (LEI). The latter is a voluntary SFM certification
scheme in Indonesia. Approaches like REDD+ and FLEGT are other examples of recent forest
approaches that aim to promote SFM through individual foci, strategies and instruments. While FLEGT
aims to foster SFM through addressing the problem of illegal logging and its related trade (EC, 2003),
REDD+ applies SFM as a strategy to reduce emissions from deforestation and forest degradation.
13 http://www.fao.org/forestry/sfm/85084/en/ 14 International Tropical Timber Organization (ITTO) (2016): Criteria and indicators for the sustainable management of
tropical forests.

Chapter 1: Introduction
7
1.3 Motivation and scope of the research
Forest-based approaches like REDD+ and FLEGT aim to foster the implementation of SFM. Despite
their objective to do so, latest data on global forest cover shows that deforestation and forest degradation
continue at an alarming rate (FAO, 2020). No global approach was successful in sustaining forest
resources and lead towards a broader change of SFM.
Against this background, it is relevant to ask how FbAs like REDD+ and FLEGT actually interlink with
the concept and promote the implementation of SFM (Cosslett, 2013; Eikermann, 2015; Neupane et al.,
2019; Tegegne et al., 2018; TEREA et al., 2016).
The interlinkage between the holistic concept of SFM and REDD+/FLEGT has only rarely been
investigated so far. The few studies that exist (e.g. Cosslett (2013) and Tegegne et al. (2018)), focused
mainly on the theoretical level, exploring potential overlaps based on policy documents. Key questions
remain on the impacts of FbAs on the ground. Such gaps can be explained by the few assessments of
related local initiatives (Angelsen et al., 2018; Arts et al., 2019; TEREA et al., 2016; Youn et al., 2017).
A logical consequence of the lack of local studies is the poor understanding of aspects that drive and
hinder the local implementation of FbAs. A better understanding of such aspects can help to explain
discrepancies between stipulated policy objectives of FbAs and missing outcomes on the ground and
help to overcome local barriers that FbAs face thereby fostering their contribution towards SFM. While
there have been a number of global comparative and national studies carried out that aimed to identify
such factors in the REDD+ policy arena (Brockhaus et al., 2016; Korhonen-Kurki et al., 2014;
Korhonen-Kurki et al., 2017; Korhonen-Kurki et al., 2018), studies for the subnational level were largely
neglected.
The present study seeks to close these research gaps.
1.4 Study goals
The overarching objective of the present study is to analyze the subnational implementation of the
concept of SFM through recent FbAs that shape forest governance. REDD+ and FLEGT-VPA are
chosen as two examples of such recent approaches.
To meet the overall objective, five research questions are formulated:
1. What are the current REDD+ achievements and limitations relevant to SFM on the subnational
level?
1.1 Do subnational REDD+ activities contribute to forest loss reduction on the
jurisdictional level?
2. What are the current FLEGT-VPA-related achievements and limitations relevant to SFM on the
subnational level?
2.1 Do national forest certification schemes under a FLEGT-VPA contribute to forest
loss reduction on the concession level?
3. What are the current driving forces of and hindrances to subnational REDD+ implementation?
Figure 2 introduces these research questions. The research framework is in more detailed described in
chapter 4.3.
Figure 2: Research questions.

Chapter 1: Introduction
8
Figure 3 shows how the five research questions are linked. The contribution of REDD+/FLEGT-VPA
towards SFM is influenced by various factors. It is influenced by the interlinkages between their global
policy designs and the holistic concept of SFM. REDD+ and FLEGT-VPA will, due to their different
scopes, objectives, measures and applied instruments, not influence and contribute to SFM equally. They
may show overlaps with some of the SFM elements but likely not evenly with all of them.
This interlinkage with SFM is anchored in REDD+/FLEGT policy documents and hereafter referred to
as the ‘thematic overlap’. Within this thematic overlap, the actual achievements (outputs, outcomes and
impacts) in terms of SFM will be realized on the ground. The reduction of tree loss as a key component
of SFM and requirement for the conservation of global forests is one of the most important outcomes
required.
Considering the past challenges of reversing the ongoing global deforestation trend, not all of the
stipulated objectives of REDD+ and FLEGT-VPAs relevant for SFM will likely be observed on the
ground. Reasons for this can be manifold. Understanding those aspects that drive and hinder the
implementation of FbAs can help explain why certain envisaged objectives in terms of SFM are not
achieved while others have been.
Findings under each respective research question are – where meaningful – combined and triangulated
to answer the overall objective.
The focus of the present study lies on the subnational level that comprises the Province of East
Kalimantan in Indonesia and there especially the Berau District and – in the case of FLEGT-VPA – the
forest management level (concessions). While national REDD+ policy arenas and institutional settings
are explicitly not dealt with, the national legal policy framework of FLEGT-VPA is considered as it
mainly determines the implementation on the local level.
Figure 3: Linking the different components of the study. Blue frame = research question 3; red frame =
research question 1 and 2; the linkages between the holistic concept of SFM and REDD+ and
FLEGT are exemplarily indicated.

Chapter 1: Introduction
9
1.5 Structure of the work
This work contains seven chapters. Chapter one introduces the thematic background of the study and
informs on the concepts of ‘forest governance’, ‘SFM’ and the global approaches ‘REDD+’ and
‘FLEGT-VPA’. It, moreover, outlines the motivation, study goal and research questions of this study.
Chapter two provides existing knowledge on the linkages between REDD+/FLEGT-VPA and the
concept of SFM. It comprises a summary of existing lessons on the (potential) achievements relevant
for SFM of both approaches and on factors that hinder and drive the REDD+ process. The chapter ends
with positioning this study against the existing research.
In chapter three, relevant background information on the study-country Indonesia is given. This
comprises basic features of Indonesia’s forestry sector, its legal framework and its threats. The chapter
also contains a description of the Indonesian-EU FLEGT-VPA and the Indonesian REDD+ process.
The materials-and-method chapter, chapter four, outlines the research design, data collection and
analysis methods. It further comprises a description of the study area and provides for the research
framework.
Chapter five presents the results of the study. They are presented along the five research questions.
In chapter six the results of the study are discussed. The chapter starts with a summary of the key
findings. In the following five chapters results of each research question are discussed in terms of their
meaning, expectancy and position vis-à-vis existing research. The last subchapter of chapter six
critically discusses the chosen methodological approach and limitations to the research.
The final chapter, chapter seven, draws conclusions on the overall objective of the study, and discusses
implications for politicians, practitioners, and future research.

Chapter 2: State-of-the art
10
2 State-of-the art
This chapter outlines current knowledge on the linkages between the concept of SFM and REDD+ and
FLEGT-VPA.
The chapter starts with a general overview of existing research and then specifically outlines knowledge
on the topics of the five research questions of this study, namely:
- REDD+ achievements and limitations relevant to SFM (on the subnational level)
o Contribution of subnational REDD+ activities to forest loss reduction on the
jurisdictional level
- FLEGT-VPA-related achievements and limitations relevant SFM to (on the subnational level)
o Contribution of national forest certification schemes under a FLEGT-VPA to forest loss
reduction on the concession level
- Driving forces of and hindrances to the (subnational) REDD+ implementation
Under 2.4 of this chapter, existing patterns, contradictions and gaps of current research are concluded
and summarized and the present study positioned in this context.
In the past decades numerous initiatives aiming to halt deforestation have emerged in the international
arena. Although they commonly support the implementation of SFM, their linkages with the underlying
concept of SFM remains poorly understood (Tegegne et al., 2018). A reason for this is that research has
only very recently begun to focus on such linkages. Evaluation reports of FbA – like that of the FLEGT
EU Action Plan – accordingly stated that “FLEGT’s contribution to the higher objective of Sustainable
Forest Management is unclear and needs to be made more explicit” (TEREA et al., 2016, p. 3).
Cosslett (2013), Neupane et al. (2019) and Tegegne et al. (2018) are the few authors that have yet
focused specifically on the links between REDD+ and/or FLEGT and SFM.
Cosslett (2013) analyzed the impact of REDD+ on the financing, implementation and achievements of
each of the seven thematic elements of SFM as listed in the NLBIs (UN, 2007). Neupane et al. (2019)
based their analysis on specialist interviews and applied the ITTO Criteria and Indicator framework to
explore specialists viewpoint on FLEGT-VPAs and REDD+s contribution towards SFM in Indonesia.
Tegegne et al. (2018) based their analysis on a content analysis of global REDD+ and FLEGT policy
documents. They employed the seven thematic elements of SFM as listed in the NLBIs and self-
developed so called ‘sub-topics’ for each of those elements. Despite their different approaches, all
frameworks are based on the seven thematic elements of SFM.
Authors like Bastos Lima et al. (2017) and Tegegne et al. (2018) showed that one possibility to analyze
the linkages between different approaches and concepts is to analysis related policy documents for
stipulated objectives relevant for SFM. While this may reveal common overlaps in stipulated objectives,
it does not address the actual thematic overlaps on the implementation level. Of the three mentioned
authors, only Neupane et al. (2019) based their research on real-life experiences. The remaining authors
used policy documents as the basis for their analysis and, therefore, remained on a theoretical level.
Few other authors, for example, C. P. Hansen et al. (2018) and Lesniewska and McDermott (2014)
picked out single aspects of SFM and critically discussed selected approaches – here FLEGT – in regards
of those.
One expects that research would (at least) cover the main objectives of FbAs (that could ultimately be
related to single SFM elements). For REDD+ and FLEGT, this is the reduction of emissions from
deforestation and forest degradation and the reduction of illegal logging and related trade. However,
existing research is poor, mainly because of constraints of reliable data and a lack of assessments of
local initiatives (Angelsen et al., 2018; Arts et al., 2019). Underlying reasons are financial,
methodological, data and political challenges of implementing impact evaluations.
While there are thus generally more lessons required for the thematic overlaps between FbAs and the
concept of SFM, there are particularly more empirical lessons needed, especially from the
implementation level.

Chapter 2: State-of-the art
11
2.1 Achievements and limitations of REDD+ relevant to SFM
The following summarizes and analyzes current knowledge on REDD+ and SFM based on existing
research and REDD+ policy documents relevant for Indonesia.
Since SFM is an activity under REDD+, it can be assumed that it aims to implement SFM in its entirety
and as such overlaps with it to 100%. Considering that a clear hierarchy between carbon and non-carbon
objectives and benefits in REDD+ can be observed (Bastos Lima et al., 2017), REDD+ will likely not
equally overlap with every of these functions. Existing literature consequently points towards a different
extent of REDD+ achievements for the single thematic SFM elements.
Cosslett (2013) and Tegegne et al. (2018) concluded that REDD+ overlapped closely with the first SFM
element “extent of forest resources”. That is, because the ultimate goal of REDD+, reducing emissions
from deforestation and forest degradation and enhancing carbon stocks, directly complies to conserving
forest resources.
In Indonesia, this linkage of REDD+ and forest conservation is anchored in national law, namely in
regulation No.: P. 30/Menhut-II/2009 on Procedures for Reducing Emissions from Deforestation and
Forest Degradation. There it says that the purpose of REDD is to reduce deforestation and forest
degradation in order to achieve SFM and improve community welfare (Chapter II Article 2.2).
Despite those overlaps of REDD+ objectives and SFM element one, real life has shown that
deforestation continues and that the transformational change away from Business as Usual (BAU) forest
loss has globally not taken place under REDD+ (Arts et al., 2019). Duchelle, Simonet et al. (2018), that
reviewed scientific literature to understand the outcomes of REDD+ on the ground, found a moderately
encouraging picture, especially at the local level of REDD+ interventions in terms of carbon outcomes.
For Indonesia, Neupane et al. (2019) showed that the ITTO indicator ‘change in forest area’ was not
estimated as a major issue that REDD+ (nor FLEGT) contributed to from a specialists point of view.
In line with this perception, data on forest loss in Borneo, where the focus area of this study is located,
revealed that annual forest loss generally showed an increasing trend between 2001 and 2016, with a
maximum of 0.61 Mha in Indonesian Borneo in 2016, and a sharp decline in 2017 (0.25 Mha) (Gaveau
et al., 2018).
Scientists, however, also acknowledged that there have been too few evaluations in the context of carbon
outcomes (Duchelle, Simonet et al., 2018).
These examples suggest that there is a discrepancy between lessons drawn from empirical and
theoretical scholarship in relation to SFM element one.
Cosslett (2013) and Tegegne et al. (2018) also assumed that REDD+ could generate important
biodiversity (SFM element two) and forest health and vitality (SFM element three) co-benefits through
reduced deforestation and forest degradation, enhanced connectivity among forest areas and forest fire
management.
A positive contribution to SFM element two and three should also be assured through a functioning and
operational REDD+ Safeguard Information System (SIS), especially in relation to safeguard 515
(decision 1/CP.16).
Through Safeguard 5, REDD+ also has the potential to contribute towards the fifth SFM element
“protective function of forest resources”.
15 That actions are consistent with the conservation of natural forests and biological diversity, ensuring that the actions
referred to in paragraph 70 of this decision are not used for the conversion of natural forests, but are instead used to
incentivize the protection and conservation of natural forests and their ecosystem services, and to enhance other social and
environmental benefits, taking into account the need for sustainable livelihoods of indigenous peoples and local
communities and their interdependence on forests in most countries, reflected in the United Nations Declaration on the
Rights of Indigenous Peoples, as well as the International Mother Earth Day.

Chapter 2: State-of-the art
12
In Indonesia, nationally planned activities under REDD+ address SFM elements two, three and five.
Among those are activities such as the rehabilitation and restoration of degraded areas (Indonesian
REDD+ Task Force, 2012). These activities could also enhance soil productivity and water retention
capacity. It remains, however, unclear how much and what areas should be rehabilitated under a REDD+
program as does the current process on the realisation of these activities.
A REDD+ related achievement in relation to SFM element two, three and five in Indonesia was the
enactment of a national forest moratorium on the suspension of new conversion permits in primary forest
and peatland in 2011. Based on Murdiyarso et al. (2011), of the total forest moratorium area (66.4 Mha)
about 22.5 Mha were newly covered, that is, had not been protected before the enactment of the
moratorium. The remaining area had already been legally protected. The moratorium suspends new
conversion licenses in all types of peatlands. Before, the suspension was limited to peatlands with a
depth of > 3 m (Murdiyarso et al., 2011).
Despite these positive outputs, Groom et al. 2018 as cited in Angelsen et al. (2018) found only marginal
impacts associated with the moratorium.
These examples show that despite the development of REDD+ outputs – here the enactment of the forest
moratorium – actual changes (outcomes) are yet to be observed. This suggests that there remain
limitations in terms of the translation to and/or operationalization of achieved outputs on the ground.
Drawing conclusions on the contribution of REDD+ towards forest biodiversity was, moreover,
hampered by a scarcity of studies on biodiversity outcomes (Duchelle, Simonet et al., 2018). Most of
their reviewed studies claimed biodiversity benefits based on reforestation and conserved forest area,
taking tree cover loss as a proxy for biodiversity.
In practice, the contribution of REDD+ towards SFM elements two and three on the ground, therefore,
remains widely unclear.
Cosslett (2013) stretched both benefits and trade-offs in relation to the fourth SFM element
“productive function of forest resources” induced by REDD+. They argued that REDD+ may on the
one hand lead to a reduction in timber production by placing certain forests under conservation which
would be a trade-off and contrary to the objectives of SFM element four. On the other hand, they argued
that REDD+ may lead to improved forest management practices through the implementation of Reduced
Impact Logging (RIL) or FSC certifications standards. Cosslett (2013), moreover, suggested a reduction
in timber supply from ‘conversion wood’.
In the Indonesian study by Neupane et al. (2019), specialists ranked ‘Reduced impact harvesting and
silvicultural operations’, as one of the key contributions of REDD. Apart from this study, there was a
lack of information on REDD+ achievements on the ground in relation to these aspects of SFM.
Cosslett (2013) and Tegegne et al. (2018) both came to the conclusion that REDD+ also had the potential
to have important socio-economic impacts (SFM element six “socio-economic function of forests”).
Through the Cancun safeguards 3, 4 and 5 REDD+ could contribute to local benefit and well-being,
resource rights, public participation and traditional knowledge and use.
In Indonesia, those thematic issues are addressed through the REDD+ national strategy framework
(Indonesian REDD+ Task Force, 2012), namely through pillar five ‘the inclusion/involvement of
stakeholders’. There, the facilitation of the interaction between stakeholders, the development of social
and environmental safeguards and the assurance of benefit sharing is envisaged. Each of these objectives
is followed up by several strategies (ibd.).
Cosslett (2013), however, also named some potential challenges. Concerns relate to the opportunity
costs to other non-sustainable land use activities that REDD+ must adequately compensate and the
stability of benefit flows from REDD+.
Duchelle, Simonet et al. (2018) concluded from their review of REDD+ studies that effects on welfare
were small and with mixed signs. Land tenure and its clarity have been considered a major challenge
for REDD+ throughout those case studies.

Chapter 2: State-of-the art
13
Cosslett (2013) and Tegegne et al. (2018) further suggested a major direct contribution of REDD+
towards the seventh SFM element “legal, policy and institutional framework”, especially through its
readiness phase.
In line with this perception, nearly half of the respondents in the study of Neupane et al. (2019) ranked
‘forest governance’ in Indonesia on rank one (level of contribution of REDD+ towards ITTO SFM
criteria and indicator). Other indicators with particular high response under this ITTO criterion were
‘Policies, laws and regulations for governing forests’, ‘Institutions responsible for, and supportive of,
forest management’ and ‘Integration of forests in national and subnational land-use planning’ (ibd.).
Overall, respondents in Neupane et al. (2019) indicated that REDD+ in Indonesia had positively
contributed towards the enabling conditions for SFM, especially in relation to institutional
strengthening, reinforcing policies and regulations, appropriate governance and attracting additional
funding.
Several other authors (Astuti & McGregor, 2015b; Austin et al., 2014; Korhonen-Kurki et al., 2017;
Mulyani & Jepson, 2017; Wells & Paoli, 2011) had assessed and analysed the impacts of REDD+
outputs on forest governance in Indonesia, among those were studies on the One Map Initiative16 (OMI),
the former national REDD+ Agency and the national forest moratorium.
Findings of those studies uniformly suggested that REDD+ contributed towards national forest
governance reform in Indonesia because REDD+ was able to raise the need for and/or support long-
needed policy reforms on land use assessment, inter-ministerial communication and coordination, public
participation and transparency.
Studies for example suggested that the development of the OMI, prompted through REDD+ as a measure
to harmonize existing data and overlapping land claims, provoked better coordination amongst
government ministries, greater transparency and increased public participation on the national level
(Mulyani and Jepson, 2017).
Despite the rather quick adoption of these policies on the national level, research has indicated that the
follow up into lower levels of governance constituted a clear gap. However, the literature review also
suggested that much less is currently known about the impacts of REDD+ on forest governance on the
subnational level. All consulted studies focused on the national level.
2.2 Achievements and limitations of FLEGT-VPA relevant to SFM
In the following current knowledge on FLEGT-VPA and SFM is summarized and analyzed based on
existing research and FLEGT policy documents relevant for Indonesia.
Tegegne et al. (2018) suggested that FLEGT could directly contribute towards the first SFM element
“extent of forest resources”, particularly in relation to ‘forest inventory and data’ because FLEGT-
VPAs intent the development of forest management plans and forest resource inventories at the
management level.
This was supported by findings of Neupane et al. (2019). In their study, specialists ranked the
contribution of Indonesian FLEGT-VPA towards ITTO indicators ‘Forest area in compliance schemes’
and ‘Multiyear forest management plans in FMUs’ as particular high.
Neither of them, however, suggested a direct contribution to reducing forest loss – the fundamental issue
to sustain forests. In theory, improved legality and law enforcement in the timber production could
reduce the occurrence of illegal logging, that is, forest degradation, which is often a precursor of wider
forest loss (EC, 2003), and thus positively affect the occurrence of deforestation in forest concessions.
The FLEGT EU Action Plan, moreover, deems that for countries whose legal forestry framework is
based on the principles of SFM, better law enforcement will also lead to more sustainable forest
management bearing the potential to reduce tree loss on the forest management level (EC, 2003).
16 The OMI was introduced as a measure to harmonize existing data and overlapping land claims and aims for one single
reference map that is used among all ministries and government levels (Mulyani and Jepson (2017)). On 11th of December
2018, the One Map Policy Geoportal was launched as a reference for land use planning (Jakarta Post 2018).
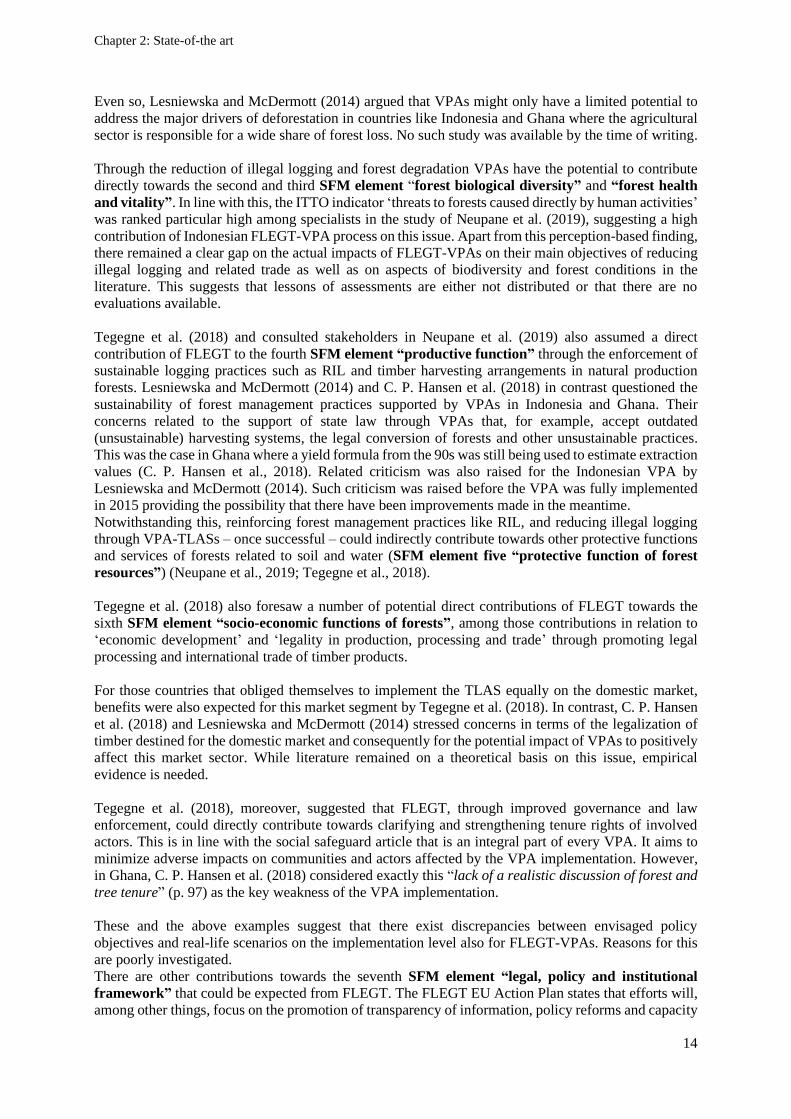
Chapter 2: State-of-the art
14
Even so, Lesniewska and McDermott (2014) argued that VPAs might only have a limited potential to
address the major drivers of deforestation in countries like Indonesia and Ghana where the agricultural
sector is responsible for a wide share of forest loss. No such study was available by the time of writing.
Through the reduction of illegal logging and forest degradation VPAs have the potential to contribute
directly towards the second and third SFM element “forest biological diversity” and “forest health
and vitality”. In line with this, the ITTO indicator ‘threats to forests caused directly by human activities’
was ranked particular high among specialists in the study of Neupane et al. (2019), suggesting a high
contribution of Indonesian FLEGT-VPA process on this issue. Apart from this perception-based finding,
there remained a clear gap on the actual impacts of FLEGT-VPAs on their main objectives of reducing
illegal logging and related trade as well as on aspects of biodiversity and forest conditions in the
literature. This suggests that lessons of assessments are either not distributed or that there are no
evaluations available.
Tegegne et al. (2018) and consulted stakeholders in Neupane et al. (2019) also assumed a direct
contribution of FLEGT to the fourth SFM element “productive function” through the enforcement of
sustainable logging practices such as RIL and timber harvesting arrangements in natural production
forests. Lesniewska and McDermott (2014) and C. P. Hansen et al. (2018) in contrast questioned the
sustainability of forest management practices supported by VPAs in Indonesia and Ghana. Their
concerns related to the support of state law through VPAs that, for example, accept outdated
(unsustainable) harvesting systems, the legal conversion of forests and other unsustainable practices.
This was the case in Ghana where a yield formula from the 90s was still being used to estimate extraction
values (C. P. Hansen et al., 2018). Related criticism was also raised for the Indonesian VPA by
Lesniewska and McDermott (2014). Such criticism was raised before the VPA was fully implemented
in 2015 providing the possibility that there have been improvements made in the meantime.
Notwithstanding this, reinforcing forest management practices like RIL, and reducing illegal logging
through VPA-TLASs – once successful – could indirectly contribute towards other protective functions
and services of forests related to soil and water (SFM element five “protective function of forest
resources”) (Neupane et al., 2019; Tegegne et al., 2018).
Tegegne et al. (2018) also foresaw a number of potential direct contributions of FLEGT towards the
sixth SFM element “socio-economic functions of forests”, among those contributions in relation to
‘economic development’ and ‘legality in production, processing and trade’ through promoting legal
processing and international trade of timber products.
For those countries that obliged themselves to implement the TLAS equally on the domestic market,
benefits were also expected for this market segment by Tegegne et al. (2018). In contrast, C. P. Hansen
et al. (2018) and Lesniewska and McDermott (2014) stressed concerns in terms of the legalization of
timber destined for the domestic market and consequently for the potential impact of VPAs to positively
affect this market sector. While literature remained on a theoretical basis on this issue, empirical
evidence is needed.
Tegegne et al. (2018), moreover, suggested that FLEGT, through improved governance and law
enforcement, could directly contribute towards clarifying and strengthening tenure rights of involved
actors. This is in line with the social safeguard article that is an integral part of every VPA. It aims to
minimize adverse impacts on communities and actors affected by the VPA implementation. However,
in Ghana, C. P. Hansen et al. (2018) considered exactly this “lack of a realistic discussion of forest and
tree tenure” (p. 97) as the key weakness of the VPA implementation.
These and the above examples suggest that there exist discrepancies between envisaged policy
objectives and real-life scenarios on the implementation level also for FLEGT-VPAs. Reasons for this
are poorly investigated.
There are other contributions towards the seventh SFM element “legal, policy and institutional
framework” that could be expected from FLEGT. The FLEGT EU Action Plan states that efforts will,
among other things, focus on the promotion of transparency of information, policy reforms and capacity

Chapter 2: State-of-the art
15
building for partner countries (EC, 2003). Consequently, each VPA agreement includes commitments
to improve transparency and other aspects of forest governance17 (except of Ghana that misses the
transparency annex (Lesniewska & McDermott, 2014)). VPAs, moreover, contain an article on the
‘Stakeholder involvement in implementation’ to assure public participation in the VPA process.
Accordingly, Tegegne et al. (2018) concluded a potential direct contribution of FLEGT towards issues
of ‘capacity building’, ‘country-level legal, policy, and institutional frameworks’ and ‘public
participation’.
The independent evaluation of the FLEGT EU Action Plan by TEREA et al. (2016) suggested that
“the EU FLEGT Action Plan is resulting in improved forest governance in all targeted countries” (p. 3)
especially in terms of equitable solutions, transparency, capacity building of civil society and
government and engagement of various national stakeholder in the VPA process (TEREA et al., 2016).
Results from the Indonesian study confirmed this. Specialists in Neupane et al. (2019) ranked the ITTO
indicators ‘forest governance’, ‘policies, laws and regulations for governing forests’ and ‘availability of
professional and technical personnel to perform and support forest management’ as particularly high
(ranked among the first 10), suggesting a strong contribution of the Indonesian FLEGT-VPA process
on these issues.
While these sources uniformly point towards a positive contribution of FLEGT-VPAs in terms of
national forest governance, none of them has made references to subnational forest governance.
2.3 Driving forces of and hindrances to REDD+ implementation
The literature review on REDD+ and FLEGT achievements relevant for SFM above revealed that many
of the envisaged targets of both approaches have not been observed yet. This raises the question of what
hampers the processes on the implementation level. In the following, existing knowledge on factors that
drive and hinder the REDD+ implementation is summarized.
Authors like Angelsen et al. (2012) and Korhonen-Kurki et al. (2018) suggested a number of factors and
conditions that influenced the success of REDD+ in the past. To identify and conceptualize challenges
and opportunities across the (national) REDD+ policy arenas, Angelsen et al. (2012) applied a political
economic lens that focused on ‘Institutions’ (rules, path dependencies18 or stickiness), ‘Interests’
(potential material advantages), ‘Ideas’ (policy discourses, underlying ideologies or beliefs) and
‘Information’ (data and knowledge, and their construction and use). Their framework was taken up by
Korhonen-Kurki et al. (2017). Korhonen-Kurki et al. (2017) took the former national REDD+ Agency
in Indonesia as an example to assesses factors that favored and restricted the REDD+ process in
Indonesia.
The ‘autonomy of the state from economic interests of actors that drive deforestation’, which includes
for example, collusion, corruption and rent seeking, and the ‘political will’ were factors that influenced
the success of REDD+ identified by Angelsen et al. (2012). Depending on whether those factors are
present or absent, they could enable and foster the REDD+ outcome/process or hamper it.
Key challenges specific to REDD+ raised by Angelsen et al. (2012) were its ‘multi-level character’,
‘multiple actors’ and ‘requirement for policy change beyond the forestry sector’. In Korhonen-Kurki et
al. (2017) the ‘lack of multilevel and multisectoral governance’ and a ‘lack of information flow’ were
among the hindrances that the implementation of the national REDD+ Agency faced. Other such factors
included ‘no recognition of REDD+ by other policy sectors’ and ‘limited budget support’.
17 http://www.vpaunpacked.org/en/web/vpa-unpacked-multilang/vpa-elements 18 “is characterized by the resistance to change often seen in state organizations responsible for the management of natural
resources. Ministries of forestry in forest-rich countries may be afraid of losing parts of their sphere of influence, or
ministries of agriculture fear that REDD+ will restrict opportunities for new agricultural land. One way to overcome this
institutional stickiness would be to create new institutions and introduce new actors, but this comes with its own trade-offs.
Formal power typically rests with the ‘stickiest’ organizations – those with enough influence to resist change – while new
institutions and actors are ignored or remain marginalized” Angelsen et al. (2012, p. 22).

Chapter 2: State-of-the art
16
Factors that drove the national REDD+ Agency process were for example, ‘incentives to avoid
deforestation and forest degradation’ and ‘novel and alternative governance mechanisms’ (novel
institutions like REDD+ working groups).
While a number of challenges towards the REDD+ implementation in Indonesia were also outlined in
REDD+ policy documents (e.g. Indonesia’s REDD+ Readiness Self-Assessment that was submitted to
the Forest Carbon Partnership Facility (FCPF) in 2017), driving forces were rather – if at all – indirectly
reported.
The mentioned studies mainly focused on the national policy arena and national institutional setting
while there remained a lack of comprehensive assessments of factors that hinder and drive the REDD+
performance on the subnational level. This is insofar surprising as there exist – especially in
Indonesia – several REDD+ pilot projects and demonstration activities. This suggests that lessons are
either not sufficiently collected or not distributed beyond the project boundaries.
2.4 Conclusion
Above the current knowledge of the overlaps between REDD+/FLEGT and the holistic concept of SFM
was summarized. Existing research on factors that drive and hinder REDD+ achievements relevant for
SFM were, moreover, outlined. The following conclusions can be drawn from this for the study
approach:
1. Research has only recently started to focus on the direct overlaps between the holistic concept
of SFM and REDD+ and FLEGT
2. The holistic concept of SFM has been used as an evaluative framework to analyse the overlaps
between both approaches and SFM in recent literature
3. Existing research mainly remained on a theoretical level, exploring potential overlaps between
REDD+/FLEGT objectives and SFM but there remains a need for further investigations on the
subnational level
4. Some studies have identified general achievements of REDD+ and FLEGT that can be
translated to the context of SFM but research in this context has focused on national
achievements, especially in relation to forest governance, while evaluations fall short on
achievements relevant for the subnational level
5. Existing literature has shown that there are overlaps between REDD+/FLEGT objectives in
policy documents with each SFM element but that the extent and quality of the overlaps vary
by approach and SFM element; overlaps were especially found with SFM element seven
6. Studies suggested that FLEGT could apply mechanism that contradict with the holistic concept
of SFM
7. The desk review reveals that there exist discrepancies between REDD+/FLEGT(-VPA) policy
objectives and observed impacts on the ground for many SFM elements. Building upon the
above summary, this may be explained by the following aspects:
o Policy documents lack the follow-up of policy objectives, that is, they lack a concrete
formulation of policy measures to achieve a stated objective. Without those measures,
policy objectives risk to remain ‘blank’ statements
o The design of policy measures and instruments are not adequate. The related question
here is how effective they are and how adequate they were designed (and realized) to
achieve the stipulated policy objective
o There are region-specific factors that drive or hinder the implementation of
REDD+/FLEGT-VPA. Depending on their presence or absence, they hamper or drive
the achievement of REDD+s/FLEGT-VPAs objectives and consequently their
contribution towards SFM

Chapter 2: State-of-the art
17
8. Literature has acknowledged that too few empirical assessments exist in the context of
REDD+’s and FLEGT’s main objectives, namely reducing deforestation and forest degradation,
illegal logging and related trade as well as on related aspects of forest biodiversity and the
implementation of SFM practices; the same was observed for factors that drive and hinder,
especially the subnational implementation of REDD+
9. The desk review revealed that identified driving forces and hindrances have not been related to
REDD+’s potential to contribute towards SFM on the ground
Behind the above-stated conclusions, this study assesses achievements of REDD+ and FLEGT-VPA
relevant for SFM on the subnational level. The seven thematic elements of SFM are used as an evaluative
framework. A particular emphasis is given to the contribution of REDD+ and FLEGT-VPA towards
reducing forest loss as it is suggested that the prevention of ‘forest loss’ is fundamental to sustaining
forests (Lesniewska & McDermott, 2014).
To better understand where the barriers to achieving the global policy objectives of REDD+ and
FLEGT-VPA relevant for SFM lie, an additional focus of this study is on the driving forces of and
hindrances to the subnational REDD+ implementation. The understanding about these factors can
inform the global design of FbAs to better adapt its measures to local circumstances. Real-life lessons
on these aspects can, moreover, raise the likelihood that potential overlaps between SFM and FbAs
actually turn out as such on the ground. The interlinkages of the single study aspects are shown in
Figure 3.
Combining the findings of all analyses will allow conclusions to be drawn on the limitations and
potentials to implement SFM through recent forest-based approaches that shape forest governance like
REDD+ and FLEGT.

Chapter 3: The Indonesian forestry context
18
3 The Indonesian forestry context
This chapter introduces the (forestry) background of the Indonesia country relevant for this study.
Chapters 3.1 to 3.3 outline basic feature of Indonesia and its forestry sector. Chapters 3.4 and 3.5.
summarize relevant aspects of Indonesia’s legal forestry framework and chapter 3.6 summarizes major
threats to Indonesian forests and strategies adopted to address these. National REDD+ and FLEGT
processes in Indonesia are outlined in more detail in the chapter 3.7.
3.1 Country size and population
Indonesia’s total land area is 1,811,570 km² (FAOSTAT 201619). The total population in 2017 was
263,991,379.00 (The World Bank20), which makes Indonesia the fourth most-populous country in the
world. Its population had a density of 145.73 people/km² of land area in 2017 (The World Bank21) and
an annual growth rate of 1.1% in 2017 (The World Bank22). The same year, 5.7% of the population lived
on less than US$1.90 (at 2011 international prices) (The World Bank23). About 48 million people live
in and around Indonesia’s forests (Ministry of Forestry, 2009).
3.2 Forest industry
Estimated total roundwood production in 2014 was 113 million m³ and industrial roundwood
62 million m³ (FAOSTAT). Plywood production yielded 5.8 million m³ in 2014 (3.3 million m³
exported), making Indonesia the third largest producer and second biggest exporter of plywood behind
China and the US. Comprehensive figures of the total timber production and consumption, especially
those of the domestic timber market in Indonesia, are scarce and very difficult to obtain. This is mainly
due to the existence of many unregistered or illegal small producers which do not report to the Ministry
of Environment and Forestry (MoEF).
3.3 Forest cover in Indonesia
Indonesia harbours the eighth largest forest cover in the world. Based on the FAO Forest Resource
Assessment of 2015 (FAO, 2015), forest cover was 91.01 million ha or 53% of Indonesia’s land area in
2015. Of this, 46.02 million ha was primary forest (50.6% of Indonesia’s forest area) and 40.04 million
ha, or 44% of Indonesia’s forest area, was other naturally regenerated forest. Four point ninety-four
million ha or 5.4% of Indonesia’s forest cover was planted (idb.). Fifty-seven million point sixty-six
million ha was production forest in 2015 (idb.). Carbon stocks in above-ground biomass were estimated
to be 9,391 million t and 3,098 million t in below ground biomass (ibd.).
3.4 Indonesian forest land use classes and their functions
Indonesia’s land area is divided into two classes: ‘forest area’ and ‘non-forest area’ (APL land). This
classification is anchored in the Indonesian forestry law of 1967 and 1999 and was based on the
administrative responsibilities of the forest ministry at that time.
Under Indonesian law, the area legally designated as ‘forest area’ is 120.6 million ha or 63% of its total
land area. The area legally designated as ‘non-forest area’ is 67.4 million ha, see Table 1.
‘Non-forest area’, or APL land, can be used for agriculture, settlements and other uses except forestry,
for example, for oil palm. The MoEF is responsible to manage the ‘forest area’.
19 http://www.fao.org/countryprofiles/index/en/?iso3=idn (accessed 19.03.2019) 20 https://data.worldbank.org/indicator/SP.POP.TOTL?locations=ID (accessed 19.03.2019) 21 https://data.worldbank.org/indicator/EN.POP.DNST?locations=ID (accessed 19.03.2019) 22 https://databank.worldbank.org/data/source/health-nutrition-and-population-statistics (accessed 19.03.2019) 23 https://data.worldbank.org/indicator/SI.POV.DDAY?locations=ID&year_high_desc=true (accessed 19.03.2019)

Chapter 3: The Indonesian forestry context
19
It is important to consider that the ‘forest area’ class does not necessarily harbour trees and that the ‘non-
forest area’ class can actually harbour trees. Table 1 presents and compares the areas legally designated
as ‘forest area’ and ‘non-forest area’ and their actual forest cover as reported in the Global Forest
Resource Assessment (FAO, 2015) and the State of Indonesia’s Forests 2018 (Ministry of Environment
and Forestry [MoEF] & Republic of Indonesia [RoI], 2018).
In the following, the term ‘forest cover’ is used to refer to land area that is still forested. The separation
between the ‘forest area’ class as defined by Indonesian law and ‘forest cover’ as estimated based on
satellite images, is an important issue throughout the present work, especially in the context of the forest
loss per land use class.
Table 1: Forest cover of legally designated ‘forest’ and ‘non-forest area’ based on Indonesian law and FAO
(2015). I MoEF and RoI (2018) define forests as a land area of more than 6.25 ha with trees higher
than 5 m at maturity and a canopy cover of more than 30%. II FAO (2015) defines forest as an area
of land of more than 0.5 ha with tree canopy cover of more than 10% and trees higher than 5 m at
maturity.
In million ha Forest cover Without forest cover Total area
‘Forest area’I 85.8 34.7 120.6
‘Non-forest area’I 8.1 59.3 67.4
Forest cover (FAO)II 94.4 94.4
The ‘forest area’ is further classified based on its function into three classes, see Figure 4:
1) conservation forest (HK), for the preservation of biodiversity and their ecosystems, including national
parks and nature reserves, 2) protection forest (HL), for the protection of environmental services such
as erosion control, protection of watersheds, prevention of floods, and 3) production forest with the main
function of producing forest products.
Production forest is divided into limited production forest (HPT), permanent production forest (HP) and
convertible production forest (HPK). Limited production forest is designated for the prevention of soil
erosion and shows stricter regulations in terms of timber harvest, it is managed through selective cutting.
Decisive for the classification into this forest class is the slope, type of soil and rainfall intensity of the
area (Government of Indonesia [GoI], 2010). Permanent production forest shows lower harvest rules
and allows clear cutting for the establishment of timber plantations (which are in Indonesia classified as
forest).
Based on Forestry Law 41/1999, Article 38, the utilization of production and protection forest area is,
moreover, allowed for non-forestry activities such as mining. Mining companies must obtain a lease-
use license from the MoEF for these activities.
Convertible production forest is reserved for activities other than forestry, for example, oil palm, and
can be released to ‘non-forest area’. Associated deforestation is categorized as ‘planned deforestation’.
Table 2 characterizes the different land use classes and provides for the land area under each forest class.
Figure 4: Land use classes in Indonesia.

Chapter 3: The Indonesian forestry context
20
In 2017, 78.5% of Indonesia’s conservation, 80.6% of its protection forest area, 79.4% of its limited
production forest area, 58.3% of its permanent production forest area and 49.1% of its convertible
production forest area was covered by natural forest (consisting of primary and secondary forests)
(MoEF & RoI, 2018).
Legal changes to land use classes
Under Indonesian law, Government Regulation 10/2010, the function of forests can be altered within
the ‘forest area’ class (forest area remaining forest area). The change in the function of forest is
theoretical possible for all three forest classes: protection forest, conservation forest and production
forest either based on a partial basis or for provincial territory.
Changes from conservation and protection forest into production forest (or vice versa) and from
protection into conservation forest (or vice versa) based on a partial basis or provincial basis can only
be made where the criteria of each forest class are no longer fulfilled but meet the criteria of another
class. The most relevant change is the change in function within the class production forest. Those
changes can be made “to meet the need for the optimum area of production forest to support the stable
supply of raw materials to the wood processing industry” (GoI, 2010, Article 42(2)a). Here, the
following changes are possible (GoI, 2010, Article 42):
- Limited production forest to permanent production forest and/or convertible production forest
- Permanent production forest to limited production forest and/or convertible forest
- Convertible production forest to limited production forest and/or permanent production forest
Table 2: Land use classes potentially harbouring forest by function in Indonesia. Adapted and modified from
Margono et al. (2012); NTFP = Non-timber forest products.
Forest area by
function Code
Million
haI (%) Purpose & function
Possible
management
practices
Meaning for SFM
Conservation
forest HK 22.1
Preservation of flora and
fauna diversity and
ecosystems
Forest
preservation
No deforestation
and forest
degradation
Protection forest HL 29.7
Protecting the water system
to prevent flooding, control
erosion, protect sea water
intrusion and maintain soil
fertility
Forest
protection,
community use
of NTFP
No deforestation
and very low
intensity
degradation
Production forest: 68.8
- Limited
production
forest
HPT 26.8
Low intensity logging Selective
logging,
post-logging
silviculture
treatments
Forest degradation
- Permanent
production
forest
HP 29.2
Logging, industrial timber
plantations
Selective
logging,
post-logging
silvicultural
treatments,
clear cutting
Temporary
deforestation,
forest degradation
- Convertible
production
forest
HPK 12.8
Logging Clear cutting Permanent and
temporary
deforestation,
forest degradation
I MoEF and RoI (2018)

Chapter 3: The Indonesian forestry context
21
Based on the same regulation, ‘forest area’ can also be released to ‘non-forest area’ (forest area not
remaining forest area) either on a partial or provincial basis (GoI, 2010, Chapter II, Part 1, Article 6). A
total of 30% of the forest cover of a province or a watershed must, however, be maintained. ‘Forest area’
can be released by (GoI, 2010):
- Swap of forest area: a change in permanent production forest and/or limited production forest
into non-forest area accompanied by incorporating substitute land from non-forest area into
forest area
- Release of forest area: a change in the appropriation of convertible production forest area into
non-forest area
Under certain requirements, ‘forest area’, can also be released to ‘non-forest area’ for provincial territory
as part of the spatial planning process (Article 30).
Through the potential of changing the forest area function and transforming ‘forest area’ to ‘non-forest
area’, basically each of the forest classes have the potential to be transformed to all other land use classes.
For example, by law, oil palm plantations can only be established in ‘non-forest area’ land but because
convertible production forest can be released to ‘non-forest area’ and forested area in the limited and
permanent production forest class be transformed to the convertible production forest class, forested
‘forest area’ can be in a two-step process released to the ‘non-forest area’ class and then be converted to
oil palm.
3.5 Forest management in Indonesia
In the following, the Indonesian forest management framework relevant for the study context is outlined.
It comprises the Indonesian SFM certification scheme that is integrated into the Indonesian TLAS, the
national harvesting system and the forest management unit (FMU) system.
The Indonesian SFM certification – the PHPL
SFM in all forest concessions in Indonesia became mandatory in 2002 with Government Regulation
No. 34/2002 ‘Concerning the forest structuring and making of forest management plans, utilization of
forest and use of forest areas’. The same year, the state-driven Pengelolaan Hutan Produksi Lestari
(PHPL), the Sustainable Production Forest Management certification scheme, was introduced through
decree no. 4795/Kpts-II/2002 and 4769/Kpts-II/2002 on ‘Criteria and Indicators of Sustainable
Management of Natural Tropical Forests at the Management Unit’ and their assessment procedures.
The PHPL certification is mandatory for all forest companies with a concession permit in state
production forest including natural forest concessions and forest plantations (Maryudi et al., 2017). The
PHPL certification scheme consists of four criteria: 1) main preconditions, 2) production aspects,
3) ecological aspects and 4) social aspects. They are further described by various indicators, see Table
3, and their respective verifiers. Depending on the relevance of each verifier, they are distinguished
between dominant (with score 2) and co-dominant (score 1) verifiers. Depending on its performance,
each verifier is categorized into the classes “good”, “intermediate” or “poor”. The values of all verifiers
are aggregated based on their weight to achieve the final score. Concession holders fail to pass the
certification when their final score is “poor”, that is, “< 60% of the total possible score and/or not
meeting the legality verification, or with at least one dominant verifier graded as poor” (Maryudi et al.,
2017, p. 172).
In 2009, the mandatory SFM certification became part of the Indonesian TLAS, the Sistem Verificasi
Legalitas Kayu (SVLK)24.
24 See chapter 3.7 for more information.

Chapter 3: The Indonesian forestry context
22
Table 3: PHPL criteria and indicators. Source: Maryudi et al. (2017).
The Indonesian Harvesting System
Based on the Director General of Forestry decree No. 35/1972 of 1972, Indonesia’s forests should be
managed on a sustainable basis by applying the Indonesian Selective Cutting System (TPI). In 1989, the
TPI was replaced by the Indonesian Selective Cutting with Replanting System, the Tebang Pilih Tanam
Indonesia (TPTI). In addition to the TPI, the TPTI includes aspects of regeneration and maintenance of
the residual stand such as enrichment plantings in the second year after harvesting. In 2005 and in 2009,
the TPTI was revised through the Director General of Forest Production Management No. 226/VI-
BPHA/2005 and P.9/VI/BPHA/2009 and the silvikultur Intensif, referred to as SILIN, was introduced.
Under this approach, the minimum cutting diameter was set from 50 cm to 40 cm for lowland production
forests and from 60 cm to 50 cm for hill forest and limited production forest. The cutting cycle was
reduced from 35 to 30 years. The TPTI assumes an annual diameter increment of commercial trees of
1 cm (Romero et al., 2015; Yasman, 1998). The system aims to ensure a sustainable timber supply
derived from natural forests (Rimbawanto, 2006).
Forest Management Units (FMUs)
To strengthen Indonesia’s forest governance and management at the site level, the implementation of
629 FMUs all over Indonesia had been envisaged until 2019. As a decentralized unit, FMUs are
responsible for developing, implementing and overseeing forest governance and management on the site
level while the forest service is responsible for forest administrative issues such as the issuing of permits
(Kawai et al., 2017; P3SEKPI, 2017). As such, FMUs will be responsible for the development of
management plans, overseeing license holders and monitoring land use activities. Approximately
120 FMUs had been established by the time of writing. As the main intervention unit for REDD+ locally,
pilot FMUs have been highly supported by the REDD+ readiness process.

Chapter 3: The Indonesian forestry context
23
3.6 Threats to Indonesian forests
Indonesia is considered a High Forest cover High Deforestation (HFHD) country.
In 2017, Indonesia showed the third highest global tree cover loss of 1.3 million ha or 0.81%, ranking
right after Brazil and the Democratic Republic of the Congo25. Deforestation dropped in comparison to
2016, where it was 2.42 million ha or 1.5%26. Corresponding emissions were 557 Mt in 2016 and 213
Mt in 2017. Over the period 1990 to 2014, the land use change and forestry sector contributed to 68%
to Indonesia’s total GHG emissions8. The drop in primary forest loss in 2017 was among other things
associated with the national peat drainage moratorium in effect since 2016 and the El Nino year of
201627.
Drivers of deforestation and forest degradation
The Indonesian government has divided deforestation into planned and unplanned deforestation
(Government of Indonesia, 2014). Planned deforestation refers to the loss of forest in the ‘non-forest
area’ and convertible production forest class caused, for example, by approved legal conversion of
forests based on regional spatial plans. Planned forest degradation refers to the approval of timber
utilization permits in natural forests and of timber industrial plantations in natural forests (Republic of
Indonesia, 2014). Table 4 lists direct drivers of deforestation and forest degradation as outlined in the
FCPF Carbon Fund Emissions Reduction Program Idea Note (ER-PIN) for Indonesia:
Table 4: Planned and unplanned drivers of deforestation and forest degradation. Adapted from
Government of Indonesia (2014).
Type of forest
loss Un/planned Examples
Deforestation
and forest loss
Planned
- Expansion of local administrative/governance regions for infrastructure
and other uses
- Approved legal forest conversion (based on spatial plans/RTRW)
- Forest conversion on lands reserved for other purposes (APL)
- Forest conversion for mining concessions (e.g. coal)
- Forest conversion for estate crop plantations (e.g., oil palm)
Unplanned
- Unplanned forest conversion for estate crop plantations (e.g., oil palm)
- Encroachment for timber, fuel wood, agriculture and small-scale mining
- Uncontrolled forest fires
- Land claims leading to conversion of forest areas
Forest
degradation
Planned - Approval of timber utilization permits (concessions) in natural forests
- Approval of industrial plantations in natural forests
Unplanned
- Timber harvesting outside the annual allowable cut
- Illegal logging
- Forest fires due to natural factors
- Small human-induced forest fires for land clearing
25 World Resource Institute: https://www.wri.org/blog/2018/06/2017-was-second-worst-year-record-tropical-tree-cover-loss,
June 26, 2018 (accessed on 22.03.2019) 26 Global Forest Watch (accessed on 22.03.2019) 27 World Resource Institute: https://www.wri.org/blog/2018/08/indonesias-deforestation-dropped-60-percent-2017-theres-
more-do, August 14, 2018 (accessed on 22.03.2019)

Chapter 3: The Indonesian forestry context
24
Poor spatial planning, weak and unclear tenurial rights, ineffective forest management, poor governance
and weak law enforcement have been identified as underlying causes of deforestation and forest
degradation (Government of Indonesia, 2014).
The decentralization policy that had been in effect since 2000 had substantially affected deforestation in
Indonesia. As part of this policy, governors and district heads were given the authority to issue small-
scale timber concession licenses (Suwarno & Hein, 2015). The decentralization policy resulted in
overlapping authorities, power struggles between different governmental levels and the uncontrolled
exploitation of Indonesia’s forests (Mulyani & Jepson, 2017; Myers et al., 2016).
As a response to the weak and often corrupt land use governance on the local level, the national
government of Indonesia issued decree no. 23/2014. With this decree, district authority of various areas,
including the forestry sector, was taken back from the district to the provincial level. The decree entered
into force in October 2016. With this, the district forestry offices were shut down. It remains to be seen
how this change will affect the current forestry set up.
3.7 National FLEGT-VPA and REDD+ processes in Indonesia
To cope with the threats to its forest, Indonesia has engaged early on in the REDD+ and FLEGT-VPA
processes.
REDD+
In 2009, Indonesia had committed to reduce its GHG emission by 26% to BAU by 2020 without
international help and by 41% with international support through the “National Action Plan to Reduce
GHG Emissions” (RAN GRK). During the COP 21 in Paris in 2015, this target was updated to 29% by
2030.
A substantial contribution to this target should originate from the reduction of emissions from
deforestation and forest degradation since land use change and forestry activities accounted for 84% of
Indonesia’s total emissions (Republic of Indonesia, 2014). To achieve this, Indonesia has actively
engaged in REDD+ related activities since 2007.
Indonesia has developed all relevant REDD+ elements required by the COP decision 1/CP.16. (i.e. a
National Strategy, a National Forest Monitoring System, a Safeguard Information System and a Forest
Reference Emission Level). Indonesia, moreover, declared 11 provinces as pilot provinces and had
registered 35 REDD+ demonstration activities, including sub-national and project level initiatives
(Kawai et al. 2017). By 2012, 11 provinces had completed their REDD+ strategies, among them East
Kalimantan (Republic of Indonesia, 2018). Several other steps have been undertaken since (see Figure
5 for the REDD+ landscape in Indonesia). A REDD+ Task Force was established in 2010. It was
replaced by the national REDD+ Agency in 2013 that, together with the former Ministry of Forestry
(MoF), led the REDD+ Readiness process until early 2015.
When the MoF and the Ministry of Environment were merged into the MoEF in 2014, the REDD+
Agency was dissolved, and its tasks and functions integrated into the MoEF. A new division in the
MoEF, called the Directorate General of Climate Change Oversight (DGCC), took over the functions of
the REDD+ Agency. All REDD+ related matters were managed under the DGCC by the time of writing.
During the last years, Indonesia was among others supported by UN-REDD28, the FCPF and the Forest
Investment Program of the World Bank. In 2010 it signed a Letter of Intent (LoI) with Norway on the
development of a REDD+ policy. In the LoI over 1 billion USD, Indonesia agreed to complete a National
REDD+ Strategy, establish a special agency to coordinate REDD+ related issues, a MRV system, design
a funding instrument and implement a 2-year suspension on all new concessions for conversion of peat
and natural forest (Government of the Kingdom of Norway & RoI, 2010).
28 The UN-REDD is the United Nations Collaborative Programme on Reducing Emissions from Deforestation and Forest
Degradation in Developing Countries. It supports nationally led REDD+ processes.

Chapter 3: The Indonesian forestry context
25
Other funds included those from Australia, Germany, the KfW Development Bank, the Gesellschaft für
Internationale Zusammenarbeit (GIZ) and the United States Agency for International Development
(USAID).
Indonesia has, moreover, enacted several regulations or policies related to REDD+. Among those for
example Minister Regulation No. 68/2008 on the implementation of REDD+ demonstration activities
and MoF Regulation P.30/Menhut-II/2009 on Procedures for Reducing Emissions from Deforestation
and Forest Degradation.
Within the last decade, the national REDD+ readiness process in Indonesia has initiated, catalysed
and/or supported several efforts to improve forest governance. Among those are ongoing policy reforms
such as the One Map Initiativ16, the Forest Moratorium on new conversion permits, a land tenure reform,
the recognition of customary rights, a FMU reform, social forestry initiatives and recentralization efforts
(Korhonen-Kurki et al., 2017; P3SEKPI, 2017).
Figure 5: National REDD+ landscape in Indonesia. JIC = Joint Implementation committee; green
flags = FCPF related milestones; blue flags = REDD+ institutional landscape; yellow
flags = grants.
FLEGT-VPA
By the end of the 1990s, the rising recognition of problems related to illegal logging and unsustainable
forest management led to first measures to tackle the unsustainable use of timber in Indonesia.
Measures included signing Memorandums of Understandings (MoUs) with timber-importing countries
and a Presidential Instruction (No. 4 of 2005) that directed the leaders of 18 government bodies to co-
operate and co-ordinate to eradicate illegal logging and to seek to intensify forest certifications. In 2001,
Indonesia hosted the East Asia Ministerial Conference on Forest Law Enforcement and Governance
(FLEG) in Bali. It resulted in the Declaration on Forest Law Enforcement and Governance’ (Bali
Declaration).
Figure 6 provides for an overview of the national FLEGT landscape in Indonesia.
The negotiations for a VPA between Indonesia and the EU officially started in 2007 and concluded in
2011. In 2014, the VPA entered into force.

Chapter 3: The Indonesian forestry context
26
The core of the VPA became the Indonesian TLAS, the Sistem Verificasi Legalitas Kayu (SVLK), that
was first launched in 2009. Apart from the SVLK, the VPA further includes the following elements:
- Commitments to improve transparency, involve stakeholders in implementation, social
safeguards and public information
- A joint implementation committee to oversee the VPA implementation; consisting of
representatives from the EU, government, private sector and civil society
- Market monitoring: to “collect and analyse information on the acceptance of Indonesian
FLEGT-licensed timber in the Union market” (European Union [EU], 2014, Annex VII(1))
- Impact monitoring to monitor the impacts of the VPA on the timber industry and local
communities
Figure 6: FLEGT landscape in Indonesia. Red flags = FLEGT-VPA related milestones;
blue flag = PHPL milestone.
Indonesia’s Timber Legality Assurance System – the SVLK
The TLAS described in the VPA is based on the SVLK (Indonesia & EU, 2015). The SVLK is
implemented as an operator-based licensing scheme that resembles forest management certification
systems (EU, 2014). It became law in 2009. The SVLK is destined for domestic and international
markets. It should thus also apply to timber and timber products exported to non-EU countries and those
placed on the domestic market.
The SVLK consists of the following elements: 1) Legality standards, see Table 6 and Table 7, 2) Control
of supply chain, 3) Verification procedures, 4) Licensing scheme and 5) Monitoring. Table 5
characterizes each of those elements29. Figure 7 shows the relation between the five elements.
The VPA requires that 1) auditees (timber producers, traders, processors and exporters) comply with the
Indonesian legality definition and 2) that permit or landowner and companies (in the case of traders,
processors and exporters) demonstrate that “every node of their supply chain is controlled and
documented […]” (EU, 2014, Annex V(3)).
To do so, auditees (concession permit holders) are assessed against a set of standards. Related audit
reports are made public through assessment bodies. For the control of the timber supply chain, provincial
and district forestry officials are required to undertake field verification and validate the documents of
permit holders, landowner, or processors. Related documents include for example, log felling reports,
transport documents or log listings.
29 For more information see Indonesia and European Union (EU) (2015) and www.euflegt.efi.

Chapter 3: The Indonesian forestry context
27
In 2011, the former MoF launched the V-legal logo as part of the SVLK for designated export
consignments (Hentschel & Fripp, 2013). A V-legal document is an export license issued through the
SVLK system that confirms that the timber product complies with the legality (and/or sustainability)
standard of Indonesia. From January 2013 on it became mandatory for all Indonesian exporters to have
a V-Legal document.
As already mentioned, the Indonesian TLAS also incorporates the PHPL standard30. The corresponding
regulation, the latest being regulation no. P.14/PHPL/SET/4/2016 issued by the General Directorate of
Sustainable Management of Production Forests, consists of two standards: 1) standards for the
assessment performance of sustainable production forest management (PHPL), that is, standards for
SFM and 2) standards for verification of timber legality (VLK).
Both certification schemes are further related as forest concessions that apply the PHPL scheme are also
required to comply with the legality standards. PHPL-certified concessions thus also have a legality
certificate that eventually is used as a FLEGT license (Maryudi et al., 2017). Forest concession holders
can decide whether they immediately apply for the PHPL certification or for the legality certification
first. However, they must comply with the PHPL certification standards, no later than the expiry of the
first legality certificate, that is after 3 years. Table 7 outlines the legality standards that forest
concessionaires in production forest need to comply with.
The SVLK was fully implemented in April 2016. With this, Indonesia became the first country to issue
FLEGT licenses for timber exports to the EU.
Table 5: Elements of the Indonesian TLAS. Source: EU (2014) and EU FLEGT Facility31.
Elements Description
Legality
standard
A definition of what constitutes legal timber; it provides criteria and indicators to be used to
check compliance with relevant laws. Five legality standards have been defined, see Table 6.
They are closer described by several principles and criteria that forest actors need to comply
with, see Table 7 for those in the production forest class.
Control of
supply chain
A procedure for verifying control of the supply chain to ensure that timber comes from legal
sources. Forest actors (forest concession permit holders, landowner or companies) must
demonstrate that every node of their supply chain is controlled and documented according to
the latest regulation (P.14/PHPL/SET/4/2016).
Verification
procedure
Tools to verify that all requirements of the VPA legality definition and supply chain controls
are met to ensure that timber products are legal. The Indonesian National Accreditation
Body, the Komite Akreditasi Nasional or KAN, accredits Conformity Assessment Bodies
(CABs). CABs are independent private companies (audits) that audit the performance of
forest actors (auditees) based on the principles set out in the legality and SFM (PHPL)
standards. They issue legality and PHPL certificates in the case of full compliance with all
requirements. The legality certificate is valid for 3 years. See Figure 7 for the relation
between the different institutions involved.
Licensing
Scheme
Licensing authorities issue export licenses for international markets: for non-EU markets
those are V-Legal Documents and for EU Markets those are FLEGT licenses.
Monitoring
Independent entities monitor the implementation of the TLAS. They assess the compliance of
the auditees and CABs with the Indonesian TLAS. Civil society has been appointed as the
Independent Monitor. In addition, a periodic evaluation assesses the functioning of the SVLK
annually.
Following the annual report on the VPA implementation (Indonesia & EU, 2017), by the end of 2016,
23.3 million ha of production forests had been audited for SVLK (total production forest area in 2011:
53,32 million ha (No.: P.49/Menhut-II/2011)) and 3.197 timber industries.
It was, moreover, estimated that all large primary timber processing industries
(processing capacity > 6000 m³/year) had been SVLK certified by mid of 2017 (Sucofindo, 2018).
30 See chapter 3.5. 31 http://www.euflegt.efi.int/vpa-elements

Chapter 3: The Indonesian forestry context
28
The Multi-stakeholder Forestry Program (MFP) has financially and technically supported the
development and implementation of the Indonesian TLAS. The MFP is a bilateral program between the
government of Indonesia and the Department for International Development (DFID) of the United
Kingdom (UK). The MFP concluded its third phase in 2017 in which it focused on the acceleration of
the VPA, especially the SVLK, implementation. It also aimed to address other factors relevant for the
VPA implementation, among those to provide assistance to the government to implement policies that
address tenure to forest land and to allocate resources to community-based forest enterprises (Multi-
Stakeholder Forestry Program [MFP], 2014a).
Figure 7: Institutional set-up of SVLK. Source: Indonesia and EU (2015).
Table 6: Indonesian legality standards. Source: EC (2015).
Legality Standard
1 The standard for concessions within production forest zones on state-owned lands: Natural Forest,
Plantation Forest, Ecosystem Restoration, Forest Management Right (see Table 7)
2 The standard for community plantation forest and community forest within production forest zones on
state-owned lands
3 The standard for privately-owned forests
4 The standard for timber utilization rights within non-forest zones or from convertible production forest on
state-owned lands
5 The standard for primary and downstream forest-based industries and traders

Chapter 3: The Indonesian forestry context
29
Table 7: Principles and criteria of legality standard in production forest zone. Source: EC (2015).
Legal status of area and right to utilize
K1.1. Forest management unit (concession) is located within the production forest zone
Comply with the system and procedures for harvesting
K2.1. Permit holder possesses a harvest plan for the cutting area that has been approved by the competent
administrative authorities
K2.2. Work plan is valid
The legality of the transport or the change of ownership of round logs
K3.1. Permit holders ensure that all the logs transported from a log yard in the forest to a primary forest
products industry, or registered log trader, including via an intermediate log yard, is physically
identified and accompanied by valid documents
K3.2. Permit holder has settled the payment of applicable fees and levies for the commercial extraction of
timber
K3.3. Inter-island transportation and trade
K.3.4. Compliance of V-Legal marking
Compliance with environmental and social aspects related to timber harvesting
K4.1. Permit holder has an approved applicable Environmental Impact Assessment (EIA) document and has
implemented measures identified in it
Compliance with labor laws and regulations
K5.1. Fulfilment of occupational safety and health (OSH) requirements
K5.2. Fulfilment of workers’ rights

Chapter 4: Materials and methods
30
4 Materials and methods
The following outlines the methods used in this study. Chapters 4.1 to 4.3 present the research design,
consisting of the study scale, the description of the study area and the research framework. This is
followed by a discussion of each method of data collection in chapter 4.4. Subsequently,
chapter 4.5 describes the method of analysis including its analytical background.
4.1 Research design
Scale of research
Following Gibson et al. (2000) as cited in Secco et al. (2014), a ‘scale’ can be described as “the spatial,
temporal, quantitative, or analytical dimensions used to measure and study any phenomenon” (p.218).
The spatial and analytical dimensions for analysing the five research questions of this study were
determined by the global design of FLEGT and REDD+. Due to their different characteristics, research
on the subnational FLEGT-VPA and REDD+ implementation was carried out on distinct levels (spatial
scales), through distinct approaches and with a focus on different elements.
While REDD+ is regulated on the national level, its implementation affords the translation of national
policies to subnational levels. In decentralized countries like Indonesia, this renders the development of
subnational institutional arrangements, region-specific strategies and measures and the participation of
various stakeholder groups on all subnational governmental levels necessary. Depending on the local
conditions, the subnational REDD+ implementation in a given jurisdictional area can thus be developed
in various ways.
Research on REDD+, therefore, focused on the jurisdictional scale, specifically on:
a) the provincial level in East Kalimantan, see Figure 8, and
b) the district level – more specifically – the jurisdictional REDD+ pilot project in the Berau
District
Focusing on the provincial and district level can be regarded as a “nested approach”. There are several
advantages to working at these different spatial scales:
a) Choosing a province as one focus area for the research on REDD+, had the advantage of
integrating the administrative unit with the greatest responsibility for the subnational REDD+
implementation and the institutional linkages between local needs and REDD+ plans
(Indonesian REDD+ Task Force, 2012). This responsibility of provinces was notably enforced
by law 23/201432, which came into force in 2016. Through this law, provinces were equipped
with major authority over district resources including forests.
a) The provincial level is also the administrative unit with the greatest importance for (non-)
governmental organisations working on the subnational level. As such, many of the
organizations working at the district level had their subnational base on the provincial level
where they were actively engaged in the provincial REDD+ process.
b) Research on the district level (as on the concession level in the case of FLEGT), permitted to
take into account site-specific conditions, for example, terrestrial information and specific
activities, for example, of concessionaires. It, moreover, allowed for the analysis of forest loss
changes and their linkages to particular drivers.
c) Advantages to the “nested approach” included the potential to determine the relative importance
of and to compare the drivers and hindrances of the subnational REDD+ and SFM
implementation that operate at different spatial scales (Gardner et al., 2013).
32 See chapter 3.6 for more details.

Chapter 4: Materials and methods
31
It, moreover, allowed connections to be made between the individual REDD+ pilot project and
the larger provincial-scale conservation and climate objectives.
d) Due to the interdependence of the district and province, processes in the district could,
moreover, hardly be separated from the development on the provincial level while the real
impacts of provincial strategies and processes could only be seen on the local, that is, district
level.
In contrast, the implementation of the core element of the FLEGT-VPA, the timber legality and related
PHPL certifications, are clearly regulated through regulation P.14/PHPL/SET/4/2016. This regulation
obliges forest concession holders to comply with the legality and sustainability standards related to the
management and processing of forests and their products33. Here, the private sector is responsible for
the implementation of these certification schemes.
Research on FLEGT, therefore, focused on:
a) the FLEGT-VPA regulatory framework relevant for the subnational level and
b) the concession level within the Berau District, see Figure 8
Choosing the VPA regulatory framework and natural forest concessions, permitted to make connections
between results of individual forest concession units and the higher objectives of the FLEGT-VPA.
4.2 The study area
Research on the subnational level was conducted in East Kalimantan Province, see Figure 8. East
Kalimantan is Indonesia’s third largest province. It consists of seven districts and three cities, the capital
is Samarinda. The population of East Kalimantan was about 3.5 million ha in 2016 with a density of
27.13 people/km² (RoI, 2019). Population growth was significant and increased by 15% between 2010
and 2016.
About half (6.8 million ha) of East Kalimantan is forested with approximately 2.1 million ha covered of
primary dryland forest and 4.3 million ha of secondary dryland forest (RoI, 2019).
East Kalimantan’s forest estate is divided into 20 FMUs. Eight of these are currently operational (ibd.).
Annual forest loss between 2006 and 2016 was estimated to be 114,054 ha (RoI, 2019). Degradation of
primary forest to secondary forest was 83,192 ha over the same period (ibd.). Main drivers of
deforestation and degradation since 2006 were oil palm, mining, timber planation and poor concession
management (RoI, 2019).
REDD+ in East Kalimantan
One of the first steps of the REDD+ process in East Kalimantan was the set-up in 2008 of a REDD+
working group through the government of East Kalimantan representing members from the provincial
forestry service, organization like The Nature Conservancy (TNC) and the GIZ, the private sector, the
University Mulawarman (UNMUL) in Samarinda and communities. Its task comprised collecting and
analysing data and information related to REDD+, building a common understanding on REDD+ among
related stakeholders, coordinating the REDD+ process in East Kalimantan and handling the vertical and
horizontal communication between the REDD+ working group and other institutions and governmental
levels (Governor’s Decree No. 522/K.215/2010).
Following its establishment, a number of actions have been carried out to prepare for REDD+: In 2010,
a “Green East Kalimantan Program” (Kaltim Hijau) was launched with the vision to reduce GHG
emissions in East Kalimantan by 19% by 2020 (Hovani et al., 2018). In 2012, through Governor
Regulation No. 54/2012, another target to reduce provincial carbon emissions from deforestation and
land degradation to 15.6% by 2020 was formulated (Anderson et al., 2016; DNPI & Government of East
Kalimantan, 2010).
33 See chapter 3.5 and 3.7.

Chapter 4: Materials and methods
32
Strategy and action plans to achieve these emission reduction targets were subsequently developed,
among those the “East Kalimantan Environmentally Sustainable Development Strategy” (DNPI &
Government of East Kalimantan, 2010), the “Strategy and Action Plan (SRAP) on REDD+”
(Government of East Kalimantan, 2012) and the “Regional Action Plan for GHG Emission Reduction”
(RAD-GRK).
East Kalimantan has, moreover, developed a forest reference emission level and implemented several
REDD+ pilot projects.
Figure 8: Forest cover in East Kalimantan Province (above) and Berau District (below) in 2000.
HA = natural forest concession boundaries.
In 2011, as the first province of Indonesia, a Regional Council on Climate Change, the Dewan Daerah
Perubahan Iklim (DDPI), was established. It is chaired by the governor of East Kalimantan and
represents members from 13 provincial governmental agencies among those the heads of the
Environmental Agency, the Mining and Energy Office, the Forestry Service, the Plantation Service, and
experts from the university. While there are formally no members of civil society, the DDPI cooperates

Chapter 4: Materials and methods
33
with local non-governmental organisations (NGOs) and organisations such as the GIZ, TNC and WWF,
CIFOR and the private sector.
The DDPI was established as an ad-hoc organization to coordinate REDD+ related activities and provide
advice to the governor on issues related to climate change. Other tasks included to formulate policies
and strategies related to climate change and to monitor and evaluate the policy implementation
(Government of East Kalimantan, 2012).
There are currently three working groups under the DDPI: the working group on REDD+/Land use, land
use change, and forestry, the working group on MRV system and the working group on Green Growth.
All working groups are chaired by initial members of the REDD+ Working Group.
In 2014, East Kalimantan was chosen as the pilot province of the FCPF Carbon Fund program of
Indonesia. The DDPI became the focal point and coordinator of the FCPF Carbon Fund (RoI, 2016).
The importance of East Kalimantan
East Kalimantan was chosen as a focus area for multiple reasons:
As a REDD+ pilot province East Kalimantan plays an important role in the national REDD+ context.
The province engaged early on in the REDD+ process and has, therefore, a fare record of REDD+ history
and related institutions – among those the DDPI.
East Kalimantan, moreover, harbors several REDD+ pilot projects, among those jurisdictional district-
wide projects, one of those being the Berau Forest Carbon Program (BFCP) in the Berau District.
East Kalimantan is, moreover, the centre of timber production and forest cover in Indonesia (Inoue et
al., 2013). This also made it a suitable area for research related to FLEGT-VPA. About 2.6 million ha,
or 38% of forest, were found within natural forest management concessions.
In comparison to other provinces like Central Kalimantan that has already been widely deforested, the
province of East Kalimantan, moreover, still harbours a remaining forest area that was relatively high.
However, the province’ forest area has recently been affected by forest conversion to other land uses
and forest degradation, reflecting the drivers that have caused wide-scale deforestation in other areas.
The Institute of World Forestry of the University of Hamburg, moreover, maintains strong working
relationships in the area of East Kalimantan. Members of the Institute of World Forestry that are at the
same time working for the GIZ in East Kalimantan have been involved in the REDD+ process in East
Kalimantan since the very beginning and significantly supported the present research.
The Berau District
Special focus in East Kalimantan was given to the Berau District, see Figure 8, and there especially to
the district-wide REDD+ Demonstration Activity “The Berau Forest Carbon Program” (BFCP) and the
natural forest concession (HA) area.
Berau is divided into 13 sub-districts and 107 villages. The capital is Tanjung Redeb. Berau has a
population of 210,135. Its land area is approximately 2.2 million ha.
Berau’s economy is dominated by the mining (40% of GDP) and forestry sector (30% of GDP) (SEA
Taskforce of Berau District, 2016).
Berau is among the districts with the largest area of remaining low land rain forest in Indonesia (Berau
REDD+ Working Group, 2011). About 75% of its area is covered with primary (~580.000 ha) and
secondary forest (1.16 million ha) (Casson et al., 2015).
Most of Berau’s land area has been allocated to land use concessions (logging, oil palm, mining). In
2016, there were 21 companies whose forest concessions stretched over Berau District boundaries, see
Figure 8.
Deforestation in Berau is particularly driven by palm oil, timber, pulp, and mining production/extraction
(SEA Taskforce of Berau District, 2016). With an estimated annual deforestation of more than
24,000 ha per year, the forestry sector was responsible for more than 10 MtCO2e per year (Berau REDD+
Working Group, 2011).
Berau’s forest area is divided into four FMUs. One of those, the FMU Berau Barat, was operational by
the time of writing.

Chapter 4: Materials and methods
34
REDD+ in Berau – the Berau Forest Carbon Program (BFCP)
In 2009, the district-wide REDD+ pilot program, the BFCP, was initiated with the establishment of a
district REDD+ working group. By decree no. 716/2009 (Bupati Berau, 2009) the working group
comprises 22 members. It is led by the regent, vice regent, chairman of the parliament and the regional
secretary of the Berau District. Other members comprise representatives from local governmental
agencies such as the forestry service and the land agency of Berau, TNC, members from the
“Community Empowerment Agency and Village Government” (Badan Pemberdayaan Masyarakat dan
Pemerintag Kampung) and the private sector represented through forest concessionaires.
The district-wide working group was initially established as an ad-hoc institution to prepare the
establishment of a steering committee. Other tasks comprised among other things, the collection of
baseline data on natural resource management, the development and mainstreaming of REDD+ action
plans, the development of strategies for marketing distribution and financing and the provision of advice
to the local government in policy formulation.
The BFCP is a partnership program between the government of Berau, the East Kalimantan Province,
the MoEF, NGOs and other government and funding institutions. By the time of study conduction, the
BFCP was mainly supported by TNC, FORCLIME (GIZ) and local NGOs. Financially, the BFCP was
supported by the Tropical Forest Conservation Act (TFCA) Kalimantan34, and the Millennium
Challenge Account Indonesia35 (MCAI). In 2010 the BFCP became one of the national REDD+
Demonstration Activities of Indonesia.
The BFCP incorporates different activities that are implemented by various organizations under one
common strategy. The strategic program for the first five years (Berau REDD+ Working Group, 2011)
was published in 2011 with the goal to improve and refine land-use planning, reduce forest carbon
emissions of at least 10% to BAU, improve forest management and public welfare, protect valuable
ecosystems, biodiversity and watershed functions and build capacity for stakeholders. This should be
achieved through (Berau REDD+ Working Group, 2011):
1. an enabling condition reinforcement strategy that seeks to address the underlying drivers of
deforestation and forest degradation, among which were the issues of spatial and land-use
planning and forest governance, and
2. a site-based investment strategy that aims to develop carbon emission reduction and
sequestration models for different types of land in Berau
A program steering committee was established in March 2011. It was the highest level of authority and
consisted of the head of the district (Bupati), the vice Bupati and national government officers from the
National Planning Agency and the former Ministry of Forestry (Berau REDD+ Working Group, 2011).
Its tasks were to ensure the integration of the BFCP strategic plan into the regional development plan
and into provincial and national policies; to coordinate between different governmental levels, to
develop policy guidelines, to provide guidance and supervision and evaluate the BFCP implementation
(idb.)
In 2010, the FMU Berau Barat was established and became the main intervention site of the BFCP. In
2014, the district became one of the focus districts of the Indonesian FCPF Emission Reduction (ER)
Program. No funding has been generated through the sale of carbon credits (Sills et al., 2014).
34 The TFCA Kalimantan is a partnership between the Government of Indonesia and the Government of the USA. It supports
the BFCP and the Heart of Borneo (HOB) initiative in 4 districts: Kapuas Hulu, Berau, Kutai Barat and Mahakam Ulu
with a total intervention area of 966,299 ha through a debt-for nature swap (TFCA Kalimantan (2017)). In total, until 2017
almost US$ 5 million had been committed to the BFCP under the TFCA Kalimantan of which 63% had been distributed
(TFCA Kalimantan (2018)). 35 Under the MCAI, a total of US$ 332.5 million had been dedicated to the Green Prosperity Project, a funding facility that
supports achievements of climate change targets including sustainable management of natural resources and renewable
energy in Berau district.

Chapter 4: Materials and methods
35
The importance of the Berau District and the BFCP
The large area of remaining forest area makes Berau a suitable location for the present research. Other
favorable conditions for choosing Berau as a focus area for the subnational REDD+ and FLEGT-VPA
research at the time the study was conducted include:
- The Berau District engaged early on in REDD+ and, therefore, showed a relatively long history
of REDD+ readiness activities and institutions
- Being a district-wide national demonstration activity and a focus area of the FCPF ER program,
the BFCP played an important role in the development of the national REDD+ framework
- Berau’s natural resources had increasingly been exploited during the last decade, placing its
intact forest and biodiversity under threat. As a consequence, the district contributed greatly to
the province’ emission profile: in 2009, it was estimated that Berau was the fifth largest emitter
of GHG emissions in the industrial sectors in East Kalimantan and to contribute to 8.5%
(21 MtCO2e) to the total emissions of the East Kalimantan Province (Berau REDD+ Working
Group, 2011). By this time, the major contributor was the forestry sector
- The forestry sector in Berau and, therefore, also the subnational REDD+ implementation faced
challenges and threats that other districts and regions in Indonesia could not cope with in the
past
- The Berau district, moreover, harbored several active natural forest concessions that were in the
process of getting certified or that had already complied with the TLAS and PHPL certification
standards
Given this interplay of factors, the district provided ideal conditions for analyzing the driving factors
and challenges to the subnational REDD+ implementation and REDD+ and FLEGT-VPA-related
achievements relevant for SFM on the subnational level.
4.3 Research framework
To derive broader lessons of how recent FbAs implement SFM, this study assessed the subnational
implementation of the REDD+ and FLEGT-VPA processes in Indonesia.
The study applied a mixed-method approach combining qualitative and quantitative data and analysis
techniques with the aim of triangulating results. Triangulation is usually applied to cancel out the
weakness of each respective single method.
Figure 9 shows the research framework of this study. The interlinkages of the single research questions
and their main topics are described in chapter 1.4.
Research on subnational REDD+ focused on the East Kalimantan province and the BFCP in the Berau
District. Research on FLEGT-VPA focused on the SVLK and PHPL legal framework relevant for the
subnational implementation and the concession level in Berau.
Empirical material for the assessment of research question 1 and 2: ‘What are the current REDD+ and
FLEGT-VPA achievements and limitations relevant to SFM on the subnational level’, was drawn from
a) REDD+ and FLEGT policy, implementation and evaluation reports and b) transcripts from REDD+
and FLEGT interviews.
Interview transcripts and policy, implementation and evaluation reports were analysed in terms of
reported achievements by means of content analysis. The ITTO criteria were used as an evaluation
framework. Data was separately collected and analysed for REDD+ and FLEGT.
Empirical material for their sub-questions 1.1 ‘Do subnational REDD+ activities contribute to forest
loss reduction on the jurisdictional level?’ and 2.1 ‘Do national forest certification schemes under a
FLEGT-VPA contribute to forest loss reduction on the concession level?’ was drawn from the analysis
of remote sensing data on the provincial, district and concession level.

Chapter 4: Materials and methods
36
Figure 9: Research framework. FbA = forest-based approaches.
The forest loss analysis on the provincial and district level was carried out to estimate the impact of the
bundle of provincial and district-wide REDD+ activities on reducing forest loss. The analysis involved
mapping forest loss from 2001 to 2016 in East Kalimantan Province and Berau District and comparing
the forest loss dynamics of the reference (‘non-REDD+ period’) with the ‘REDD+ period’.
The forest loss analysis on the concession level in Berau was carried out to estimate the potential impact
of VPA-related certification schemes on a reduction in forest loss. Annual forest loss was compared in
forest concessions that had obtained a VPA-related certification with concessions that had not obtained
a certification (yet). During this analysis, small-scale forest loss, associated with harvesting activities,
was isolated from large-scale forest loss, associated with forest conversion.
Empirical material for the assessment of research question 3 ‘What are current driving forces of and
hindrances to the subnational REDD+ implementation?’ was drawn from a) REDD+ documents and
b) transcripts of REDD+ interviews. The analysis was based on and inspired by the studies and findings
from Angelsen et al. (2012), Korhonen-Kurki et al. (2014), Korhonen-Kurki et al. (2017) and Korhonen-
Kurki et al. (2018) (chapter 4.5.1.3). Building upon their approaches and lessons, factors that enabled
and hampered the REDD+ process in East Kalimantan and the Berau District were identified by means
of content analysis.
Field observations from two field trips complemented the research on all themes and objectives.
All data sources and analysis had the same weight and were used to verify the respective other data
source.
4.4 Data collection
In the following each method of data collection is outlined. Data collection was carried out between
2016 to early 2018. The following data sources were used for this study:
- An expert interview survey of REDD+ and FLEGT stakeholders (chapter 4.4.1.2)
- Field observations (chapter 4.4.1.1) of two field stays, involving informal discussions with
stakeholders and key informants, natural forest concession and FMU visits and a plywood
company guided tour
- REDD+ and FLEGT related policy, evaluation and implementation documents (chapter 4.4.2)
- Remote sensing data on land use and land use change (chapter 4.4.3)

Chapter 4: Materials and methods
37
4.4.1 Interviews and field observation
Interviews and field observations provided data to answer research question 1 ‘What are the current
REDD+ achievements and limitations relevant to SFM on the subnational level?’, research question 2
‘What are the current FLEGT-VPA-related achievements and limitations relevant to SFM on the
subnational level?’ and research question 3 ‘What are the current driving forces of and hindrances to the
subnational REDD+ implementation?’.
4.4.1.1 Field observations
Two field stays in East Kalimantan were conducted by the author of this study in 2016 from June to July
and in 2017 from March to April.
The first field stay in 2016 aimed to provide for a sound fundament to decide for the scale and design of
the study and to learn about the REDD+ and FLEGT-VPA processes in Indonesia. Informal discussions
with REDD+ and FLEGT-VPA stakeholders on various levels were conducted, new contacts
established, existing ones deepened, and first unstructured explorative interviews held.
The second field stay in 2017 served to carry out semi-structured, in-depth interviews with REDD+ and
FLEGT stakeholders.
During the two field stays, the Model FMU Berau Barat in the Berau District and one of the REDD+
model villages of TNC under the BFCP were visited. The latter included informal discussions with the
village head. A guided tour through and discussions with the Deputy Head of Logging Division of a
plywood processing company in Samarinda that applies SVLK and visits of three natural forest
concessions in Berau District were, moreover, conducted.
4.4.1.2 Interviews
In total, 48 stakeholders either related to FLEGT-VPA, REDD+ or general forestry aspects were
consulted during the two field stays. With 30 of those, semi-structured, in-depth interviews were carried
out and 22 of those were approached for unstructured interviews, see Table 8.
Table 9 provides an overview of these stakeholders by approach and stakeholder group. Annex I
provides a list of all consulted stakeholders during both field trips.
Table 8: Number of consulted stakeholders in 2016 & 2017. *Includes four stakeholders that were also
consulted for semi-structured interviews.
Semi-structured interviews (2017) Unstructured interviews (2016 & 2017)
Total 30 22*
REDD+ 16
FLEGT-VPA 11
Concessionaires 3
Table 9: List of consulted people by approach and stakeholder group during first and second field stay. Three
stakeholders were consulted for both REDD+ and FLEGT and are, therefore, listed under both
regimes.
Stakeholder groups N total N REDD+ N FLEGT
Government institution 10 7 4
Private sector 10 1 9
International organization 10 10 2
NGO 8 5 3
Academic/researcher 8 4 4
Others 2 2
Total 48 29 22

Chapter 4: Materials and methods
38
The selection of interviewees aimed to consider the diverse set of stakeholder groups. A pre-selection
of interviewees had been identified prior to the interview survey with the help of key informants working
for over decades in the study area. The snowball sampling techniques was then used, that is, interviewees
identified additional informants.
REDD+ stakeholders were either entrusted with the implementation of REDD+ activities in the Berau
District, with the coordination and/or development of REDD+ related activities in East Kalimantan
and/or the Berau District. They involved employees of local NGOs, national and international
organization, representatives of government institutions (e.g. REDD+ Working Groups, DDPI, FMU)
and stakeholders from the research/academia on the provincial and district level.
FLEGT-VPA/SVLK respondents represented the private sector, for example, audit companies, forest
concessionaires, national certification institutions; and local NGOs, among them members of the
independent monitoring network and representatives from the academia/research.
Most REDD+ and FLEGT-VPA stakeholders were approached in Samarinda, the Berau District and
Jakarta.
Unstructured interviews
Twenty-two stakeholders were consulted for only selected issues of the semi-structured, in-depth
interviews, and to deepen the understanding on specific issues (e.g. on the district REDD+ Working
group and the DDPI). Some of the stakeholders were approached multiple times over the study duration.
Recurring themes during these unstructured REDD+ interviews were:
- challenges to reduce emissions in the forestry sector in East Kalimantan/Berau
- achievements of REDD+ in East Kalimantan/Berau
- the coordination of REDD+ activities on the subnational level
- the establishment and progress of the REDD+ working groups and DDPI in East
Kalimantan/Berau
Recurring aspects in relation to the FLEGT-VPA were:
- achievements of the SVLK, including its impact in terms of illegal logging
- the major sources of illegal logging and
- the issue of domestic timber under the SVLK
General aspects discussed in the unstructured interviews related among other things to the issue of tenure
conflicts, the management system of Indonesian forests and the FMU system.
Notes were taken during the unstructured interviews. They were transcribed and analyzed by means of
content analysis.
Semi-structured in-depth interviews
One source of data for this study was the conduction of in-depth interviews. In-depth interviews are used
to gather detailed information on new issues and can provide outcome data (Boyce & Neale, 2006).
In total, 30 semi-structured, in-depth interviews were carried out from March to April 2017. Sixteen of
those were mainly related to REDD+ and 14 mainly to FLEGT-VPA including three forest
concessionaires with whom separate semi-structured interviews were conducted. The focus here was on
the SVLK/PHPL scheme.
Interview guidelines were prepared prior to the conduction of the interviews. Different guidelines were
prepared for REDD+ and FLEGT stakeholders36.
All questions used in this study were open-ended questions. Questions were kept broad, instead of
narrowing the questions down to one specific aspect, which is good practice applied in qualitative
research to provide for the full and detailed perception of interviewee. Questions were specified where
36 See Annex II: Interview guidelines.

Chapter 4: Materials and methods
39
necessary. This approach made it possible to focus on the individual knowledge and experience of each
interviewee.
Interviews were mainly conducted in English. On the district level, some interviews needed to be
conducted in Bahasa.
With both, REDD+ and FLEGT stakeholders
- the perceived threats to SFM
- the potential contribution of REDD+/FLEGT-VPA to SFM in this context
- their overall strength and weakness and
- opportunities and threats to them
were discussed.
REDD+ interviews further focused on:
- REDD+-related activities in the focus area and their challenges
- the coordination and monitoring of REDD+ activities
- the development of the district REDD+ working group and the DDPI as examples of REDD+
- outputs on the subnational level
FLEGT-VPA interviews further focused on:
- the SVLK achievements in terms of reducing illegal logging
- the issue of conversion timber under the SVLK
- the implementation of the SVLK and
- the role and work of the Independent Monitoring
All interviews were prepared, conducted and analyzed by the author of this study. Each interview was
recorded and lasted about 1 to 2 hours. Interview trials had been conducted prior to the interview survey
and resulted in several adjustments to assure that the initial research objectives were met.
Depending on the time availability of the interviewee, his/her background, knowledge and willingness
to share his/her views, not all questions could be discussed with every interviewee. Results of the
interviews were triangulated with results of the document and forest analysis.
4.4.2 Key documents
Together with the interviews and field observations, REDD+ and FLEGT related policy, evaluation, and
implementation documents provided data to answer research question 1 ‘What are the current REDD+
achievements and limitations relevant to SFM on the subnational level?’, research question 2 ‘What are
the current FLEGT-VPA-related achievements and limitations relevant to SFM on the subnational
level?’ and research question 3 ‘What are the current driving forces of and hindrances to the subnational
REDD+ implementation?’. They were analyzed by means of content analysis.
As common with pilot projects (such as REDD+ pilot projects) and instruments under development
(such as the SVLK), there are only few scientific published studies available. For the assessment of
REDD+ progress on the subnational level, it was, therefore, not straightforward to find evaluation
reports that would assess the progress of the BFCP and REDD+ development in East Kalimantan. By
the time of study conduction, only one rapid evaluation of the BFCP had been conducted. It was
undertaken in 2016. The author gained access to the summarized results. No evaluation of the provincial
REDD+ process had been carried out by the time of study.
For those reasons, the study primarily needed to rely on grey literature. The combination of using those
reports, the expert interviews and the forest loss analysis offered sufficient different data sources to draw
reliable lessons learnt.

Chapter 4: Materials and methods
40
Key policy documents used for the analysis of factors that have enabled and hindered the subnational
REDD+ process (driving factors and hindrances) and for the assessment of subnational achievements of
REDD+ on the provincial level were (predominantly but not exclusively) the:
- Revised ER Program Idea Note Draft (RoI, 2016)
- Provincial Strategy and Action Plan (SRAP) of East Kalimantan (Government of East
Kalimantan, 2012)37
- East Kalimantan Environmentally Sustainable Development Strategy (DNPI & Government of
East Kalimantan, 2010)37
- REDD+ Readiness Self-Assessment for Indonesia submitted to the FCPF (P3SEKPI, 2017)
Key documents on the district level for the BFCP in Berau were the:
- BFCP Strategic Program 2011-2015 (Berau REDD+ Working Group, 2011)
- Rapid District Assessment of the Millennium Challenge Account-Indonesia (CDM International
Inc [CDM Smith] & Hatfield Consultants Partnership, 2014)
- Update Reports of the Berau REDD+ Working Group (Pokja REDD Berau, 2009a, 2009b)
- Internal evaluation report of the BFCP of 2016 (Noor, 2016)
The following key documents were additionally assessed for subnational achievements of the REDD+
process in the focus area:
- Annual reports of TFCA Kalimantan from 2015-2017 (TFCA Kalimantan, 2016, 2017, 2018)
- Internal project reports, NGO directories and presentations related to the BFCP in Berau (e.g.
Marquardt (2015))
- Provincial REDD+ regulations and policy documents (e.g. related to DDPI; Local Action Plan
for GHG Emission Reduction (RAD-GRK))
Hovani et al. (2018) that described major milestones, results and lessons learnt of the jurisdictional
approaches in Berau and East Kalimantan, and the FCPF ER Program Document were not available by
the time data was collected. These documents were used for fact checking and the discussion.
Key policy documents for the analysis of VPA achievements, included (primarily but not exclusively)
the:
- VPA text between the EU and Indonesia and its latest amendment (EC, 2015; EU, 2014)
- The umbrella regulation of the SVLK and PHPL schemes (Director General of Sustainable
Production Forest Management, 2016)
- Annual progress reports on the FLEGT-VPA implementation in Indonesia of 2014-2015 and
2015- 2016 (Indonesia & EU, 2015, 2017)
- The final report of the evaluation of the FLEGT Action Plan 2004-2014 (TEREA et al., 2016)
- The periodic evaluation report of the FLEGT-VPA of Indonesia and the EU (Sucofindo, 2018)
- Reports of the Indonesian Independent Monitoring of 2014 and 2018 (Meridian et al., 2014;
Meridian et al., 2018)
- Multistakeholder Forestry Program reports (MFP, 2014b, 2017; Suparno & Nurbaiti, 2018)
- An analysis of audit reports (Maryudi et al., 2017)
Some issues that were identified through the analysis of key documents and raised by interviewees
required the review and analysis of additional literature or databases to verify and improve the
understanding of those aspects. References are given in the result section.
All mentioned documents were reviewed and analysed by means of content analysis38.
37 See ‘REDD+ in East Kalimantan’ in 4.2 for a brief description of these documents. 38 See chapter 4.5.2.

Chapter 4: Materials and methods
41
4.4.3 Land use change and forestry data
Remoting sensing and forestry data were collected and analyzed to answer research question 1.1 ‘Do
subnational REDD+ activities contribute to forest loss reduction on the jurisdictional level?’ and
2.1 ‘Do national forest certification schemes under a FLEGT-VPA contribute to forest loss reduction on
the concession level?’.
Table 10 provides for the land use change data that was used for the forest loss analysis on the provincial,
district and concession level. Most of the data was freely available while some data was shared by GIZ
East Kalimantan.
Table 10: (Spatial) data and its sources used for analysis on the provincial, district and concession level.
Data Source
Province & district boundaries Latest spatial plan of East Kalimantan SK 718/2014 (Provided by GIZ
East Kalimantan)
Land use classes s. above
Forest loss data 2001 to 2016 M. C. Hansen et al. (2013)
Deforestation data Indonesian
Borneo
Gaveau et al. (2016)
Forest concession boundaries (HA
& HTI) East Kalimantan
BPKH wilayah IV Samarinda39 2016 provided by GIZ East Kalimantan
Oil palm concessions boundaries
East Kalimantan
Greenpeace 2015
Mining concessions boundaries East
Kalimantan in FMU Berau Barat
Provided by GIZ East Kalimantan
Information about date of forest
concession permit issuance in Berau
concessions
BPKH wilayah IV Samarinda39 2016 provided by GIZ East Kalimantan;
cross-checked with forest concession lists of June 2014 of BP2HP
Wilayah XIII Samarinda40 and ISDHP41
Certification status and date of
forest concessions in Berau
www.jpik.or.id; Anti Forest-Mafia Coalition (2014); Audit companies
websites; SILK database
4.5 Data analysis
The different thematic elements of this study and the different types of data sources required the
application of different analytical methods. Interview and document data of research question 1 and 2
‘What are the current REDD+ and FLEGT achievements and limitations relevant to SFM on the
subnational level’, was analysed by means of content analysis. The ITTO criteria were chosen as an
evaluative framework.
Interview and document data for research question 3 ‘What are the current driving forces of and
hindrances to the subnational REDD+ implementation’, was also analysed by means of content analysis.
The analysis was carried out in the context of lessons made from Angelsen et al. (2012), Korhonen-
Kurki et al. (2014), Korhonen-Kurki et al. (2017) and Korhonen-Kurki et al. (2018).
The analysis of the remote sensing data related to research question 1.1 ‘Do subnational REDD+
activities contribute to forest loss reduction on the jurisdictional level?’, and 1.2 ‘Do national forest
certification schemes under a FLEGT-VPA contribute to forest loss reduction on the concession level?’,
required quantitative analytical techniques. A Before-After comparison was chosen to compare forest
loss during the ‘REDD+/FLEGT period’ with forest loss during the ‘reference period’ (‘non-
REDD+/FLEGT period’).
39 Regional forest planning unit of the Ministry of Forestry (MoF) located in Samarinda 40 Regional office of forest monitoring and forest utilization of MoEF located in Samarinda 41 Directorate of forest inventory and forest resource utilization

Chapter 4: Materials and methods
42
The chapter is organized as follows:
- First, the analytical background towards each research question is outlined, comprising
o the ITTO criteria framework (research questions 1 and 2)
o the Before-After comparison of forest loss in East Kalimantan and Berau
(research questions 1.1 and 1.2)
o the national enabling conditions and challenges framework (research question 3)
- Then, each analysis method is described, comprising:
o The content analysis of interview transcripts and key documents
(research questions 1, 2 and 3)
o The analysis of remoting sensing data (research questions 1.1 and 1.2)
4.5.1 Analytical background of specific study elements
In the following, the different analytical backgrounds of each research question are outlined.
4.5.1.1 Assessing the achievements of REDD+ and FLEGT-VPA
Identifying and assessing the achievements of REDD+ and FLEGT-VPA in terms of SFM (research
question 1 and 2) was one of the approaches to analyze how FbAs implement SFM on the subnational
level.
The introduction and state-of-the-art chapter already outlined how both REDD+ and FLEGT-VPA aim
to foster the implementation of SFM and have by its global design several overlaps with it (‘thematic
overlap system’). This assumption stipulates the entry point of the following analysis.
The seven elements of SFM42 have been employed by several studies as a conceptual framework to
assess the contribution of different forest-related instruments towards SFM (Cosslett, 2013; Tegegne et
al., 2018). In this study, the SFM criteria and indicator framework by ITTO (ITTO, 2016) is proposed
as an evaluative framework. A similar approach was applied by Milbank et al. (2018) that assessed the
extent to which REDD+ project objectives align with the Sustainable Development Goals (SDGs) taking
the SDGs as an evaluative framework.
ITTO proposes seven criteria that are based on the seven SFM elements proposed by the NLBIs. These
criteria are organized under four objectives. They are more closely defined in Table 11 that, moreover,
shows the interrelation between the four ITTO objectives (column 1 & 2), the seven ITTO criteria
(column 3) and the NLBI SFM elements (column 4). In the following, each of the seven ITTO criteria
is briefly introduced.
ITTO criterion 1: Enabling conditions for sustainable forest management, deals with issues of policies,
laws, and regulations for governing forests, forest tenure and ownership, forest governance, the
institutional framework and the planning, monitoring, and economic framework.
ITTO criterion 2: Extent and condition of forests, relates to the stability and performance of forest area
and inter alia addresses issues of total area under comprehensive land-use plans, multiyear forest
management plans in FMUs, forest area under compliance schemes, change in forest area and forest
carbon stocks.
ITTO criterion 3: Forest ecosystem health and resilience, addresses threats to, and vulnerabilities of,
forests and the restoration of degraded forests and lands. The former comprises issues such as threats
caused by human activities, vulnerability of forests to natural disturbances and forest resilience and
climate change adaption.
42 See chapter 1.2.

Chapter 4: Materials and methods
43
ITTO criterion 4: Forest production, relates to issues of resource assessment, harvesting planning and
control procedures and silviculture in natural and planted forests. This comprises issues of forest
inventories and carbon stocks, timber harvesting arrangements, timber log tracking systems and reduced
impact harvesting as well as the monitoring of these operations.
ITTO criterion 5: Forest biological diversity, addresses issues of ecosystem, species and genetic
diversity and the biodiversity conservation in production forests. Specifically, this refers to the forest
extent in protected areas, buffer zone management, threatened forest-dependent species and biodiversity
conservation measures in natural production forests inter alia.
ITTO criterion 6: Soil and water protection, primarily relates to the forest extent designated to the
protection of soil and water and protection of downstream catchment areas as well as to the protective
function in natural production forests.
ITTO criterion 7: addresses economic, social and cultural aspects and relates to community and
indigenous peoples’ rights and participation in forest management. Related aspects are the contribution
of the forest sector to the gross domestic product, wood and non-wood forest product processing
capacities and efficiency, capacity building of forest workers in forest management and industry,
procedures to ensure the health and safety of forest workers, mechanisms for resolving disputes between
forest stakeholders, local livelihoods, forest tenure and user rights of indigenous people and local
communities and their involvement in forest management inter alia.
Each criterion is further described by indicator groups and/or several indicators. In total the ITTO criteria
and indicator framework comprises 18 indicators groups and 58 indicators43.
No matter the evaluative framework, literature has acknowledged that certain challenges exits when
measuring or identifying achievements of an intervention, including the following:
Aiming to identify achievements, renders the question about the attribution of an intervention to a
specific result necessary. Attributing a specific result (output, outcome, impact) to an intervention
(causality) is especially challenging when the outcome can be a result of various variables (Angelsen et
al., 2012). For example, donor agencies or organisations are usually one of several actors working on
the same objective in a region so that it can be difficult to identify the share of an actor on achieving the
particular result (Organisation for Economic Cooperation and Development [OECD], 2014). This was
also the case in the focus areas in East Kalimantan and the Berau District where several organisations
work on joint objectives like reducing emissions and forest loss, conserving biodiversity and managing
forests sustainably.
Another challenge is the timing of an assessment (Angelsen et al., 2012). The full impact which REDD+
and FLEGT-VPA aim to achieve can only be assessed at a later stage.
Another challenge refers to achievements that are related to issues such as ‘capacity building’, ‘policy
reforms’ and ‘governance’. Those issues are not as easily measurable and quantifiable as technical
issues. In the case of REDD+, among the potential achievements are not only reduced emissions and
deforestation but also changes in governance. Likewise, FLEGT-VPA does not merely aim to reduce
illegal logging, but also to strengthen forest governance and overall SFM.
For the sake of these challenges, Angelsen et al. (2012) suggest that it may be useful to include expert
judgment in the overall assessment. Tools such as surveys and feedback loops that provide qualitative
data have, moreover, been explored as new methods for measuring results of development interventions
(OECD, 2014). Generating an in-depth understanding of the environment surrounding an intervention
for example, by consulting local organisations or using innovative approaches such as the use of third-
party monitoring data are ways to circumvent some of these challenges.
43 See ITTO (2016) for more information.

Chapter 4: Materials and methods
44
Table 11: Evaluative framework: ITTO objectives and criteria for the sustainable management of tropical
forests and the corresponding NLBI SFM element. Source: ITTO (2016).
ITTO objective Characterization of objective ITTO criteria Corresponding
SFM element
Providing the
enabling conditions
for SFM
Political commitment, supportive national
policies, strong institutions, laws and
regulations, appropriate governance,
security of forest tenure and clearly defined
access and use rights, including customary
and traditional rights, are necessary
conditions for SFM
Managing tropical forests sustainably
requires that land allocation and spatial
planning within and outside forests maintain
or enhance the economic, social and
environmental values of forests at a
landscape scale. This requires the adoption
of a forest planning framework at the
national, subnational or landscape scale
ITTO 1:
Enabling
conditions for
sustainable
forest
management
Element 7:
Legal, policy and
institutional
framework
ITTO 2:
Extent and
condition of
forests
Element 1:
Extent of forest
resources
Ensuring forest
ecosystem health and
vitality
Resilience is a key tenet of SFM in natural
tropical forests; it is essential to maintain or
enhance it to reduce risks to sustainability.
Climate change is likely to affect tropical
forests and the people who depend on them.
It is essential to identify, prevent, monitor
and manage threats to forests and to protect
them from destructive agents and stresses
ITTO 3:
Forest
ecosystem
health and
resilience
Element 3:
Forest health and
vitality
Maintaining the
multiple functions of
forests to deliver
products and
environmental
services
The role of natural tropical forests as
providers of multiple goods and
environmental services should be
safeguarded by the application of sound
planning and management practices that
maintain ecosystem functions and the
potential of the forest to yield the full range
of benefits to society. In timber production
forests, it is essential to have an approved
management plan with clearly stated
objectives and the silvicultural measures to
help meet those objectives
ITTO 4:
Forest
production
Element 4:
Productive
function of forest
resources
ITTO 5:
Forest biological
diversity
Element 2:
Forest biological
diversity
ITTO 6:
Soil and water
protection
Element 5:
Protective
function of forest
resources
Integrating social,
cultural and
economic aspects to
implement SFM
SFM needs to accommodate forest-based
production (particularly of timber),
environmental protection and local
development concerns. Natural tropical
forests perform a wide range of
socioeconomic and cultural functions, which
must be recognized and maintained
ITTO 7:
Economic,
social and
cultural aspects
Element 6:
Socio-economic
functions of
forests

Chapter 4: Materials and methods
45
Study approach
Against this background, the following framework was drawn for the identification of REDD+ and
FLEGT-VPA-related achievements and limitations in terms of SFM:
1. REDD+ and FLEGT-VPA policy, implementation and evaluation reports and REDD+ and
FLEGT-VPA interview transcripts were screened for reported achievements and limitations in
relation to the seven ITTO criteria by means of content analysis. The ITTO indicator groups and
indicators helped to further subdivide findings under each criterion.
2. ‘Achievements’ throughout this study refer to outputs, outcomes or impacts (intended or
unintended) of the bundle of REDD+ and FLEGT-VPA interventions that are characterized
based on their location on the result chain44. The following definitions were used (Angelsen et
al., 2012; OECD, 2014):
o Output: immediate results of the intervention such as products, capital goods and
services, for example, policy adopted and enforced
o Outcome: the likely or achieved short-term and medium-term effects of an
intervention’s outputs; observable behavioural, institutional and societal changes that
take place over 3 to 10 years of an intervention’s output, for example, quantified
reductions in deforestation
o Impact: broader and longer-term effects (10 years or more) produced by an intervention
(directly or indirectly, intentionally or unintentionally), for example, quantified changes
in carbon emissions
The output-outcome-impact model has frequently been used to measure project performance
against a set of initial project targets. While this study did not aim to do so in the first place (and,
therefore, did not apply an entire result chain), the idea and proposed terminology of the model
was used to classify and characterize SFM related ‘achievements’ into outputs, outcomes and
impacts.
3. Because impacts are not yet expected to be observed for the majority of activities outputs, the
study focused on outputs and outcomes (rather than impacts) of the REDD+ and FLEGT-VPA
processes.
4. Certain achievements under REDD+ or FLEGT-VPA may not have been in line with all of the
elements of SFM or may not have had an effect on an SFM element yet, in the following referred
to as ‘limitations’.
5. The study focused on achievements attributed to the REDD+ and VPA processes in Indonesia.
This means that the basis for the outputs have been outlined in related REDD+ or VPA policy
documents and/or their attribution has been demonstrated by already conducted research.
6. The joint outcomes of all related REDD+/FLEGT interventions and not the outcome of every
single intervention were regarded. In this context, it is recognized that the observed outcomes
might not be attributed to REDD+ or FLEGT-VPA alone, but may be the result from a collective
action with other conservation or development interventions that are not closer regarded within
this study (the UK Department for International Development results framework as reported in
OECD (2014)).
7. To identify outcomes, triangulation of results was applied. For example, the perception of
interviewees was not further questioned when the same outcome was also reported by other
interviewees and/or reported in the analyzed key documents. To minimize potential perception
bias of REDD+ and FLEGT interviewees some validation steps were nevertheless applied45.
44 The result chain is “the causal sequence for a development intervention that stipulates the necessary sequence to achieve
desired objectives beginning with inputs, moving through activities and outputs, and culminating in outcomes, impacts,
and feedback”(Organisation for Economic Cooperation and Development (OECD) (2014, p. 14)). 45 See chapter 4.5.2.

Chapter 4: Materials and methods
46
8. The validity of REDD+ project implementation reports and FLEGT-VPA evaluations was not
questioned. They were used to explore the relevance and efficacy of REDD+ and FLEGT-VPA
for SFM on the subnational level.
9. As the prevention of forest loss is fundamental to sustaining forests (Bartley, 2014), special
emphasis was given to the potential of REDD+/FLEGT to contribute towards a reduction in
forest loss. Because such an analysis is better based on remote sensing data, the document
analysis was complemented by a forest loss analysis. Results of this analysis relate to ITTO
criterion 2: Extent and condition of forests.
4.5.1.2 Before-After comparison of forest loss
The aim of this analysis was to assess the ability of REDD+ activities and FLEGT-VPA-related
certification schemes to contribute to forest loss reduction. Forest loss was taken as a single outcome
indicator for SFM in these analyses. For REDD+, the analysis was applied on the provincial and district,
for FLEGT-VPA-related certification schemes on the concession level.
Forest loss on the provincial and district level (REDD+)
The analysis on the provincial and district level in this study was carried out in the context of concrete
targets and strategies of reducing emissions through deforestation and forest degradation, see also 4.2,
among those:
- Indonesia’s national CO2e ER target of 29% by 2030 (DNPI & Government of East Kalimantan,
2010; Government of East Kalimantan, 2012)
- East Kalimantan’s target to reduce GHG emissions from the land-use sector by 15.6% by 2020
- Reduction of forest carbon emissions of at least 10% to BAU until 2015 through the BFCP in
Berau
To achieve these targets, REDD+ was chosen as a key strategy.
The units of analysis were the Province of East Kalimantan and the District of Berau. Within those units,
forest loss was mapped and calculated between 2001 and 2016. To differentiate the potential
contribution in different land use classes, the analysis took into account the land use classification on
the provincial and district level. Additionally, on the district level in Berau, forest loss in different forest
and non-forest land use permit boundaries were regarded. Forest land use permits were those of
1) selective logging concessions in natural forests (HA) and 2) timber plantation concessions (HTI).
Non-forest land use permits were those of oil palm and mining concessions.
The basic approach was to compare forest loss during the time of REDD+ activities (‘REDD+ period’)
in each jurisdictional division, their land use classes and – in the case of Berau – its land use permits,
with the forest loss that occurred before REDD+, specifically from 2001 until the REDD+ activities had
commenced (‘reference period’). The establishment of the provincial REDD+ working group in 2008
was taken as the starting point of REDD+ activities in East Kalimantan. The year 2008, therefore,
marked the breaking point in the analysis in East Kalimantan.
On the district level, the initiation of the BFCP in 2009 with the establishment of the district REDD+
working group marked the start of the ‘REDD+ period’ for the present analysis. Table 12 shows the
analysis periods.
Table 12: Analytical time frame.
Division Non-REDD+ period REDD+ period
East Kalimantan Province 2001-2008 2009-2016
Berau District 2001-2009 2010-2016

Chapter 4: Materials and methods
47
Mapping forest loss in the different land-use classes and non-forest permit boundaries was expected to
improve the understanding on the drivers of deforestation in the focus area. This allowed to critically
assess the effectiveness of REDD+ (and FLEGT-VPA) in addressing the sources of forest loss in East
Kalimantan and Berau. Table 10 summarizes the data and its sources used.
Forest loss on the concession level (FLEGT)
This analysis dealt with the two mandatory Indonesian forest certification schemes of forest concessions:
the timber legality (Legalitas Kayu, LK) and SFM certification (Pengelolaan Hutan Produksi Lestari,
PHPL).
The PHPL certification became mandatory in 2002, the legality certification in 2009. By the time of
study preparation, it was, therefore, assumed that all active forest concessions in Berau were already
certified with at least one of those two certification systems. The application of control sites was hence
not logical for which reason a temporal comparison was chosen.
The period under review was from 2001 to 2016. This time frame covered a sufficiently long period
when concessions had not obtained any certification (reference period) and, on the downside, a
sufficiently long certification period when concessions were certified. The chosen time frame, moreover,
coincided with the forest loss data of M. C. Hansen et al. (2013) and Gaveau et al. (2016) that was used
as primary data sources.
A simple Before-After comparison was applied to analyze the potential impacts of current certification
schemes on forest loss in Indonesia. The Before-After method is on the one hand a relatively simple and
objective approach to implement but on the other hand susceptible to external factors of influence (Bos
et al., 2017). A subsequent analysis step was, therefore, applied that aimed to differentiate small- from
large-scale deforestation. The basic idea behind this was that tree cover loss may be the result of different
activities. It could be due to 1) forest management activities such as the establishment of logging roads
or harvesting operations, or 2) permanent conversion of forest to other land uses, for example, to palm
oil plantations.
Figure 10: Examples of reference and certification periods of concessions. No permit = concession
obtained their concession permit later than 2001.
The implementation of the legality and/or PHPL certification schemes primarily aims to improve forest
management by requiring harvest and management plans, implementing RIL or for the commitment to
implement SFM among other things. It was, therefore, assumed that certifications would rather be able
to reduce small-scale forest loss. As large-scale forest loss was associated with activities other than
selective logging it could thus be assumed that those activities were rather not affected through neither
of the two forest certification schemes. In separating small from large-scale deforestation, it was thus
avoided that deforestation and forest degradation stemming from other drivers than forest management
superimposed the effects of forest management within forest concessions.

Chapter 4: Materials and methods
48
Because concessions in Berau obtained the certifications in different years, the length of reference and
certification periods differed between concessions. Some concessions moreover immediately applied
for the PHPL certification and thus never showed a ‘LK certification period’. Each concession,
therefore, showed individual reference and certification periods as exemplarily illustrated in Figure 10.
4.5.1.3 Driving forces and challenges to the REDD+ implementation
Identifying driving forces and challenges of the subnational REDD+ implementation (research question
3) was one of the objectives of this study.
The underlying idea behind this is that the success of a FbAs – and with this its actual contribution
towards SFM – is influenced by the local circumstances and regional setting in which the approach is
implemented. This setting is shaped through factors that drive and hamper the implementation.
In the state-of-the-art chapter, current knowledge of those driving forces and challenges have already
been exemplarily introduced for the REDD+ implementation.
To analyze enabling conditions and challenges to the REDD+ implementation, the studies from
Angelsen et al. (2012), Brockhaus et al. (2016), Korhonen-Kurki et al. (2017), Korhonen-Kurki et al.
(2014) and Korhonen-Kurki et al. (2018) have distinguished the ‘institutional setting’ in which REDD+
is embedded and the REDD+ ‘policy arena’.
Korhonen-Kurki et al. (2014) defined the institutional setting as: “the formal and informal regulations,
rules and norms that are established over time and that are not easily changed or transformed” (p. 169).
REDD+ policy processes take place in this context of pre-existing institutions (Brockhaus et al., 2016).
The ‘policy arena’ is defined as: “being framed by institutions but shaped by the actions of the actors,
whether individuals, communities, organizations or networks, and characterized by more or less
hierarchical or inclusive processes, involving a range of powerful actors, which can foster or prevent
certain policies and influence policy formulation” (Korhonen-Kurki et al., 2014, p. 169).
In the context of the ‘institutional setting’, Korhonen-Kurki et al. (2018) hypothesized that countries
with a ‘scarcity of forest resources’ and an ‘absence of effective forestry framework and policy’, face a
stronger need to engage in REDD+. Key features of effective forestry framework for example,
comprised the existence of a legal framework that defines tenure, use and management rights
(Korhonen-Kurki et al., 2014).
Among the identified factors that explain success or failure in the policy arena were for example, the
‘inclusion of stakeholders’, the ‘national ownership’ to drive the REDD+ policy process (in contrast to
international actors driving it) and the ‘presence of powerful transformational coalitions’ that lead the
policy away from BAU and have access to the decision-making level. The ‘promise of performance-
based funding’ was further seen as a likely driving factor in the national REDD+ process.
For each of their identified enabling factors, Korhonen-Kurki et al. (2014) and Korhonen-Kurki et al.
(2018) outline several characteristics for the absence or presence of those aspects, see also Table 13.
Study approach
The following framework was drawn from the above studies:
1. Challenges and driving forces on the subnational level in the focus area were drawn from key
documents and interview transcripts by means of content analysis
2. Through the preparatory literature review and first informal discussions and meetings with
colleagues working in the study area, it was assumed that many of the identified factors on the
national level were equally existing on the subnational level
3. The driving forces and challenges on the national level were, therefore, used to identify, assess
and categorize the driving forces and challenges
4. Identified driving forces and challenges were classified into the ‘institutional setting’ and
‘policy arena’

Chapter 4: Materials and methods
49
5. Lessons in terms of REDD+’s multi-level character proposed by Angelsen et al. (2012) and
those made by Korhonen-Kurki et al. (2017) for the national REDD+ Agency were taken into
account
6. To summarize the subnational findings, the framework in Table 13 was taken as a basis
REDD+ was chosen as an example because of its subnational implementation that involves provincial
and district governments, civil society and private actors. The FLEGT-VPA, or its core element the
TLAS, follows a different approach: as a national legal requirement, the key element of the TLAS, the
legality certification scheme, is implemented through the private sector. Analyzing driving factors and
challenges was thus not regarded appropriate as it does not represent broader challenges of approaches
that shape forest governance on the subnational level.

Chapter 4: Materials and methods
50
Table 13: Evaluative framework: Operationalization of enabling conditions to achieve a REDD+ environment.
Adapted and modified (to subnational context) from Korhonen-Kurki et al. (2014), Brockhaus et al.
(2016) and Korhonen-Kurki et al. (2018), and building on Angelsen et al. (2012).
Condition in institutional setting
Factors Presence Absence
Pressure from
shortage of forest
resources
Forests are under pressure from high
deforestation rate.
Abundant or recovering forest resources
with a low to medium or negative
(reforestation) deforestation rate.
Key features of
effective forest
legislation, policy
and governance
A sound and clear legal framework with
clearly assigned rights and management
regulations is in place.
Laws and policies are at least partly
effectively implemented by national and
local administrations, which have at their
disposal a minimum of enforcement
mechanisms and implementation capacity.
Tenure and rights are in many respects
unclear and contested.
There are unresolved contradictions
between formal and customary law.
There are no adequate laws and policies,
or they exist but are ineffective because
of lack of implementation mechanisms
and enforcement capacity and/or elite
capture and corruption.
Already initiated
policy change
The government has already formulated and
is implementing policy strategies on climate
change and deforestation, or a low-carbon
development strategies or/and PES schemes
are already established independently from
REDD policies.
The government has not yet formulated
advanced policy strategies on climate
change and deforestation or a low-carbon
development strategy, or existing policies
are highly insufficient or not
implemented at all. No PES schemes
have been established.
Conditions in policy arena
National
ownership
Pro-REDD+ media statements by
government (national and subnational).
National research and NGO actors dominate
policy discourse.
Engagement of national political institutions
in REDD+ policy formulation.
Donor agendas do not dominate process.
Budget allocation to REDD+.
Anti-REDD+ media statements by
national state actors and/or pro-REDD+
statements by international actors
dominate policy discourse.
Policy formulation is mainly by foreign
actors.
Financial incentives from donors are
main reason for REDD+ implementation.
No budget allocation to REDD+.
Inclusiveness of
the policy process
Key stakeholders, including civil society,
private sector, and indigenous people (if
applicable) participate or are at least
consulted during the REDD+ process.
There are formal participation or
consultation mechanisms and the views
expressed by stakeholders are considered in
REDD+ policy documents.
There are no formal mechanisms for the
participation of or consultation with key
stakeholders, civil society, indigenous
people, and the private sector, or any
mechanisms are not applied.
Stakeholders’ views are not represented
in REDD+ policy documents.
Transformational
coalitions
Existence of coalitions of drivers of change
with room to maneuver in the political
structures and impact on the discourse.
Policy actors and coalitions calling for
transformational change are more prominent
in the media than those supporting the status
quo.
No observable coalitions of drivers of
change, or any present are too marginal to
influence policy making and are not
visible in the political discourse on
REDD+.
Media and policy circles are dominated
by coalitions supporting the status quo
and business as usual.
Promise of
results-based
funding for
REDD+
REDD+ funding on a payment-for-
performance basis is available through a
transfer of funds from an international
donor.
REDD+ funding on a payment-for-
performance basis is not available.
Autonomy from
other sector and
sectors
State actors have a high autonomy vis-à-vis
powerful economic interests that contribute
to the main drivers of deforestation and
forest degradation.
Low autonomy of state actors from
business interests that drive deforestation
and degradation limit state actor’s choices
to change current practices (e.g. existence
of rent seeking, fraud, collusion or
corruption).

Chapter 4: Materials and methods
51
4.5.2 Content analysis of interview transcripts and key documents
The interview transcripts and policy, evaluation and
implementation reports conducted or gathered to
address research question 1, 2 and 3 were analyzed by
means of content analysis.
Qualitative content analysis is a (text) interpretation
method for qualitative interviews or other data
materials (Kohlbacher, 2016). The study followed the
proposed steps to analyze interviews of Sutton and
Austin (2015), see Figure 11.
After the conduction and recording of the interviews
(data collection), all interviews were transcribed by
student assistants. The transcription was verified by
the study author, which comprised to correct errors
and anonymize the transcribed interviews.
The actual analysis of the interview transcripts (and
the key documents) was carried out in MaxQDA Plus
12 (VERBI Software, 2019).
The analysis comprised the selection, coding and
theming of relevant text paragraphs.
“Coding refers to the identification of topics, issues,
similarities, and differences that are revealed through
the participants’ narratives and interpreted by the
researcher” (Sutton & Austin, 2015, p. 228). Here,
codes that summarize a paragraph by content or the
concept mentioned, were assigned.
Theming then draw together the codes of different transcripts “to present the findings of qualitative
research in a coherent and meaningful way” (Sutton & Austin, 2015, p. 229). Themes for the purpose
of research question 3 were inspired by the enabling factors and challenges that had been identified by
authors on the national level47 and included for example, ‘funding partnerships’ and ‘political
will/commitment’. Themes related to research questions 1 and 2, that means to REDD+/FLEGT-VPA
related achievements in terms of SFM, were pre-defined by the seven ITTO criteria.
Quotations of interviews given in the result sections exclusively resulted from the 30 semi-structured
in-depth interviews.
Validation of findings
To minimize bias related to the subjectivity of the study author during the analysis, a number of validity
steps were carried out.
The validation of the findings was applied as inspired by Creswell (2007). Creswell (2007) provided
eight strategies for verifying qualitative research findings. Among the strategies is the triangulation of
methods and data sources, negative case analysis, peer debriefing and member-checking. Creswell
(2007) recommends applying at least two of those strategies. The negative case analysis involves the
identification and discussion of data that contradict identified analysis pattern. Peer debriefing should
act as an external check of the research process. Here, an external person not involved in the data
collection or analysis critically discusses methods, meanings and interpretations of the data with the
researcher in regular sessions. In member checking, preliminary analysis and findings are taken back to
participants to let them judge validity and accuracy. Following those recommendations, the findings of
the interview survey were triangulated with findings of the key document and forest loss analysis
46 See chapter 6.7. 47 See chapter 4.5.1.3.
Figure 11: Steps of preparation and
analysis of interviews and their
synthesis with other study
elements. Discussion is part of
validation46.

Chapter 4: Materials and methods
52
(and vice versa). Results of the interviews were further discussed among researchers of the Institute of
World Forestry at several stages.
4.5.3 Analysis of remote sensing data (forest loss analysis)
The analysis of remote sensing data was carried out to answer research question 1.1 and 2.1. It was
based on best available data. Data was assessed in ArcGIS 10.4.1. (ESRI, 2019). All calculations were
undertaken in RStudio 1.0.153 (RStudio Team, 2019).
The following steps were undertaken as part of the analysis:
1. Calculating area per land use class in East Kalimantan and Berau District boundaries
2. Generating forest cover base maps of 2000
3. Calculating forest cover in 2000 in provincial and district boundaries and their land use classes
4. Calculating forest loss in provincial and district boundaries and their land use classes from 2001
to 2016
5. Calculating forest loss in forest and non-forest land use permit boundaries in the Berau District
from 2001 to 2016
For the analysis on the concession level in Berau, additionally the following steps were undertaken:
6. Calculating forest loss in natural forest concession (HA) boundaries of reference and
certification periods
7. Focal statistics (separating small- from large-scale forest loss in HA boundaries)
8. Calculating small- and large-scale forest loss in HA boundaries of reference and certification
periods
The analysis on the concession level used data sets that had been generated during the forest loss analysis
on the district level. In the following, each step is outlined in more detail.
Area per land use class
Provincial and district and land use class boundaries (RTRWP Kalimantan Timur 2019-2036) were
obtained from the latest spatial plan SK 718/2014. Figure 12 shows the data processing for generating
the area of each land use class.
Generating forest cover base maps
The forest product of Gaveau et al. (2016) was used to create forest cover base maps for the year 2000
for East Kalimantan and the Berau District. Figure 13 shows the single steps involved.
Deforestation that occurred between 2001 and 2016 and remaining forest cover in 2016 (intact and
logged forest) in the Gaveau et al. (2016)48 data set were (re)classified as ‘forest’. All other values
contained in the data set, such as water, deforestation before 2000, non-forest areas in 1973, regrowth
1973-2016 were reclassified as ‘NoData’. The generated forest cover base map product of 2000
excluded plantation forests, agriculture land, scrublands and other non-forest areas.
‘Forest’ by Gaveau et al. (2016) was defined as49:
Areas that are mainly composed of closed-canopy (>90% cover) evergreen Dipterocarps.
In some highland regions, ‘Forest’ may also include Kerangas and in coastal areas,
mangroves. ‘Intact forest’ includes pristine old-growth forests, i.e. forests that have never
been disturbed by humans, or for which disturbances were too localized to be detected by
satellites. ‘Logged forest’ are areas of old-growth forest that have been impacted by
48 https://www.arcgis.com/home/item.html?id=e4cfa6b98203475d906e7de88dba41ac 49 https://www.arcgis.com/home/item.html?id=e034a603cd834ec8a0048b5bf7ff97ac

Chapter 4: Materials and methods
53
industrial-scale mechanized selective logging at some point since 1973. They have lost
their original structure but have remained in good condition and regenerate quickly.
‘Regrowth forest’ are areas of forest that were likely young regrowth in 1973 and resemble
old-growth forest in 2015. In 1973, before extractive industries began, forests were mainly
Intact (old growth). ‘Forest’ excludes young forest regrowth, scrublands, tree plantations,
agricultural land, and non-vegetated areas. The latter are clumped into ‘Non-Forest’.
Figure 12: Process of generating the area per
land use class. Division = province
or district; SK 718/2014 = Spatial
plan of 2014; projected from
degrees into m².
Figure 13: Process of generating forest cover base
maps of 2000 (‘Forest cover
2000_Division’) and of calculating forest
cover in land use class and permit
boundaries; Borneo_FCDF_1973-2016 =
data set of Gaveau et al. (2016).
Calculating forest cover in 2000 and 2016
The generated forest cover base maps of East Kalimantan and Berau were overlaid with the land use
classes as obtained by the spatial plan SK 718/2014 to calculate the forest cover in 2000 for each land
use class, see Figure 13.
Calculating forest loss in East Kalimantan and Berau boundaries and their land use classes
The forest cover base maps of 2000 were, moreover, combined with the tree cover loss product from M.
C. Hansen et al. (2013) to calculate (mean) annual and total forest loss from 2001 to 2016 inside forest
areas identified by Gaveau et al. (2016) in the East Kalimantan Province and Berau District boundaries.
In doing so, the study accounted for the non-forest or deforested land in 2000 by Gaveau et al. (2016)
that was handled as forest by M. C. Hansen et al. (2013) following his forest definition of “any vegetation
above 5m” which hence also included timber and oil palm plantations (Margono et al., 2014; Tropek et
al., 2014). This annual forest/non-forest map at 30 m resolution was subsequently combined with the
spatial plan of East Kalimantan and Berau to calculate forest loss within each land use class between
2001 and 2016, see Figure 14 for single steps involved.
Calculating forest loss in forest and non-forest land use permit boundaries
The annual forest/non-forest map was, moreover, combined with forest (HA and HTI) and non-forest
(oil palm and mining) land use permit boundaries in the Berau District to calculate total and annual
forest loss within permits between 2001 and 2016.
Data on oil palm permits was obtained from Greenpeace 201550. Permits in the data set were either
‘location permits’, ‘plantation business licences’ (IUP) or ‘long-term business-use permits’ (HGU)51.
50 https://www.greenpeace.org/archive-indonesia/Global/seasia/Indonesia/Code/Forest-Map/en/data.html 51 Companies first must file an application for a location permit to the district governor for an area that is reflected in the local
spatial plan as suitable for oil palm plantations (Handayani (2010)). The next step involves applying for an ‘plantation
business license’ in the district governor. When having obtained the ‘plantation business licence’, companies are permitted

Chapter 4: Materials and methods
54
As there was no comprehensive data set on mining concessions available, an internal data set from GIZ
Samarinda was used. The data set contained mining permits inside the FMU Berau Barat but did not
differentiate between exploration licenses (for general surveys, exploration and feasibility studies etc.)
and production operation licenses (for activities of construction, mining, processing etc.).
For the analysis on the concession level, for
each HA concession the following information
were additionally gathered or calculated, see
also Table 14 for an overview:
1) the date the concession permit was first
issued, 2) the baseline year of each concession,
3) number of permit years concession held its
concession permit during the period 2001 to
2016, 4) the concession size based on the
current permit, 5) the concessions’ forest cover
in 2000 [ha], 6) the certification status as of
2016, 7) the year the legality and/or PHPL
certification was obtained and 8) the length of
reference and certification period.
For all concessions that obtained their
concession permit before 2001 the baseline was
2001. For all others the actual date of permit
issuance was used as the baseline year that was
first obtained from the BPKH wilayah IV
Samarinda39 data set. The BPKH wilayah IV
Samarinda data set, however, only provided
information about the current permit while in
many cases this recent permit was only a
renewal from a former permit. To account for
this likelihood, all concessions in Berau with permits after 2001 were cross-checked with – by the time
of analysis – still publicly available concession lists of 2014 and 2010 by BP2HP Wilayah XIII
Samarinda40 and ISDHP41. This cross-checking linked six concessions to earlier concession permits
issued before 2001.
The actual concession size was taken from the BPKH wilayah IV Samarinda concession data set.
The forest cover in 2000 in a concession was estimated by overlaying the forest cover base map of Berau
of 2000 with the HA concession boundaries of BPKH Wilayah IV Samarinda (2016), see Figure 13.
Because there was not one single database that held comprehensive information on the date concessions
in Berau obtained their first certification, information on the certification of each concession was
obtained from various sources. The SILK52 and JPIK53 databases were first used to get information on
the certification status of concessions. This information was cross-checked with lists provided under
Anti Forest-Mafia Coalition (2014) and through visiting respective audit company websites. The
information on concessions were cross-checked with a forest management supervisor working in Berau.
Depending on the year a concession obtained their first legality or PHPL certificate, the length of the
certification and reference period varied accordingly among concessions.
Concessions that either had no certification until now based on investigations or that were inactive
(information from key informants) were sorted out for the analysis.
to initiate the plantation development (Paoli et al. (2013)) that involves obtaining a land clearing permit. The last step in
securing long-term plantation tenure rights is that of obtaining the ‘long-term business-use permit’ that allows to plant and
exploit oil palm. ‘Long-term business-use permits’ are granted for 35 years. 52 http://silk.dephut.go.id (accessed in late 2017) 53 https://www.jpik.or.id/database/sertifikasi-lk-hutan/ (accessed in late 2017; does not exist anymore)
Figure 14: Process of calculating annual forest loss in
the divisions East Kalimantan and Berau
and in their land use classes and permits.

Chapter 4: Materials and methods
55
Forest loss in HA concessions was estimated for the time period between a concessions baseline year
and 2016 and was expressed in hectare and as a percentage of a concessions’ 2000 forest cover within
the Berau District boundaries.
Calculated statistical estimators included sample mean, range (difference between highest and lowest
value) and median. The median and the mean of annual forest loss expressed as a percentage of the
concessions’ 2000 forest cover were the crucial variables for a comparison among the single
concessions.
Table 14: List of variables on the provincial, district and concession level.
Variables Definition
Provincial and district level
Land area per land use
class
- in East Kalimantan and
- Berau
as of spatial plan 2014 in hectare
Forest cover
- in East Kalimantan,
- Berau boundaries and
- in their land use classes
for the years 2000 in hectare
Annual & total forest
loss
- in East Kalimantan and
- Berau boundaries and
- in their land use classes,
- in HA & HTI concession boundaries and
- in oil palm & mining concession boundaries in Berau
for years 2000 to 2016 in hectare
Concession level
Permit date Date the concession permit was first issued
Baseline year 2001 or year of permit issuance
Concession size Size in hectare as of latest concession permit
Forest cover Forest cover in hectare of a concession within its boundaries in Berau in 2000
Certification status Non, PHPL or legality (as of 2016)
Certification year Year the certificate was first issued
N years_permit Number of years concession possessed the concession permit during 2001 to
2016; corresponds to ‘2017’ – ‘baseline year’
Length of reference or
certification period
Number of years of reference and certification period of a concession between
2001 and 2016
Calculating forest loss in reference and certification periods
To analyse the potential impact of the legality and PHPL certifications on reducing forest loss in HA
concessions in Berau, for each concession annual forest loss of its reference and certification period(s)
was estimated.
The ‘reference period’ included the time from the baseline year to the year of certification. The
‘certification period’ included the time from the year of certification to 2016. For those concessions that
obtained both legality and PHPL certifications until 2016, forest loss of the non-certified years
(reference period), the legality-certified years (LK certification period) and the PHPL certified years
(PHPL certification period) were calculated.
To do so, for each concession and year (observations), the status of certification was indicated, that is,
a) without certification, b) with legality certification or c) with PHPL cartification.
The different periods were then compared by calculating statistical estimators for each period as already
described above.

Chapter 4: Materials and methods
56
Focal statistics: separating small-scale from large-scale forest loss
The following analysis aimed to distinguish between small- and large-scale forest loss to account for the
different sources of tree loss. This followed the aim of assessing the impact of the legality and PHPL
certifications on reducing both forest loss extends.
A neighbourhood analysis was applied in ArcGIS separating small patches or lines of forest loss
(associated with skid trails, felling gaps) from deforestation (associated with forest conversion to other
land uses). Figure 15 provides an overview of the single steps involved.
Figure 15: Process of determining annual small- and large-scale forest loss in natural forest concession
boundaries.
For the analysis, clusters of tree cover loss pixels were identified using a moving window (focal
statistics). The focal statistics tool of ArcGIS calculates a statistic (e.g. sum, mean, majority) of the
values in the input raster location (forest loss = 1; no loss = NoData, i.e. ignored) within a specified
neighbourhood for each input cell.

Chapter 4: Materials and methods
57
In a first step, the neighbourhood settings, that is, the size of the moving window, needed to be
determined. For this, a) large-scale deforestation due to forest conversion to other land uses and b) small-
scale forest loss due to logging activities of historical pictures of 2016 in Google Earth were exemplary
identified in ArcGIS, see Figure 17 to Figure 20.
The moving window size was accordingly varied/tested to fit the visual interpretation of the small- and
large-scale forest loss excerpts identified in Google Earth starting with a 3x3 cell-window (9 pixel). The
statistic type that was used for the neighbourhood analysis was ‘sum’. Most logging roads and skid trails
in the excerpt of the test side in Berau were identified as such small-scale forest loss when choosing a
window size of 9x9 (81 pixels) and the threshold of 40 pixels. Figure 16 shows the product of this
analysis. With these setting, small- and large-scale forest loss were defined as follows:
- forest loss patches of ≤ 3.6 ha = small-scale loss (associated with skid trails and logging roads)
- forest loss patches of ≥ 3,7 ha = large-scale loss (associated with forest conversion to other land
uses)
Creating annual small- and large-scale forest loss maps
The annual forest loss map of Berau (lossyear_Berau in Figure 15) was reclassified to map total
deforestation between 2001 and 2016. In this operation, annual forest loss between 2001 and 2016 was
assigned the value = 1. All other values were assigned ‘NoData’. This map did hence not further specify
the annual deforestation but only the total deforestation that occurred from 2001 to 2016.
The focal statistic operation was subsequently applied using a rectangular moving window of 9x9 cells
with a threshold of 40. Clusters of 41 or more pixels of tree cover loss were interpreted as large-scale
forest loss while clusters of 40 or fewer were interpreted as small-scale forest loss associated with
logging or selective forest management activities. From this map – through the operation ‘reclassify’ –
two separated maps for total large and small-scale forest loss were generated.
.
Figure 16: Product of focal statistic. Showing the range of the sum of cells (1-81) in the neighbourhood of
each pixel for a 9x9 rectangle moving window with ‘sum’ as a statistic type.
Those two maps were again each overlaid with the annual forest loss map of Berau (lossyear_Berau) to
extract the annual forest losses within the just identified small-scale (large-scale) forest loss patches.
Those two new maps (small_lossyear_Berau and large_lossyear_Berau in Figure 15) then showed the
annual small- and the annual large-scale forest losses of each year between 2001 and 2016 in Berau.
Both maps were once again projected to UTM50N (linear unit = meters) and overlaid with the natural
forest concession (HA) permit boundaries. Small- and large-scale forest loss within the HA boundaries
were then processed in R (RStudio Team, 2019)

Chapter 4: Materials and methods
58
Figure 17: Example of large-scale forest loss in Berau in Google Earth as of 12/2016
(1° 58.413’ N 117° 1.321’ E).
Figure 18: Large-scale forest loss between 2001 and 2016 in ArcGIS of the excerpt in Figure 17.

Chapter 4: Materials and methods
59
Figure 19: Example of small-scale forest loss in Berau in Google Earth as of 12/2016
(2° 16.204’ N 117° 7.588’ E).
Figure 20: Small-scale forest loss between 2001 and 2016 in ArcGIS of the excerpt in Figure 19.

Chapter 5: Results
60
5 Results
Results are presented along the five research questions:
1. What are the current REDD+ achievements and limitations relevant to SFM on the subnational
level?
1.1 Do subnational REDD+ activities contribute to forest loss reduction on the
jurisdictional level?
2. What are the current FLEGT-VPA-related achievements and limitations relevant to SFM on the
subnational level?
2.1 Do national forest certification schemes under a FLEGT-VPA contribute to forest
loss reduction on the concession level?
3. What are the current driving forces of and challenges to the subnational REDD+
implementation?
5.1 Achievements and limitations of REDD+ in East Kalimantan and
Berau
In the following subnational REDD+ achievements relevant for the seven ITTO criteria in East
Kalimantan and the Berau District are outlined. The achievements and limitations presented in this
chapter have been derived from the analysis of REDD+ interview transcripts and policy, evaluation and
implementation reports.
The REDD+ achievements in terms of a reduction in forest loss that were derived from the analysis of
remote sensing data are reported separately in chapter 5.2.
Table 15 summarizes the identified achievements against the seven ITTO criteria.
Table 15: Summary of subnational REDD+ achievements (outputs and outcomes) relevant for SFM in East
Kalimantan (incl. Berau). BFCP = Berau Forest Carbon Program; RPJMD = regional
development plan; RTRWK = regional spatial plan; ER = Emission Reduction; HCV = High
Conservation Value; FPIC = Free, Prior and Informed Consent; NTFP = Non-Timber Forest
Products.
ITTO
criterion Outputs
related to Examples of outputs/outcomes
Outcomes
related to Examples of outcomes
Enabling
conditions
for SFM
Policies &
regulations
for
governing
forests
- East Kalimantan’s Local Action Plan for
GHG Emission Reduction developed
- East Kalimantan’s moratorium on new
land use permits enacted
Forest
governance
- Stakeholder
participation in forest
governance increased
- Coordination &
communication
slightly increased
Institutions
supportive
to forest
management
- Provincial and district REDD+ working
groups established
- Regional Council on Climate Change
(DDPI) established
Political
commitment
&
ownership
on REDD+
- Provincial ER targets formulated
- Enactment of provincial policies &
regulations

Chapter 5: Results
61
Table 15 (continued)
Enabling
conditions
for SFM
Strategy &
action plans
for forests
- Provincial Environmentally Sustainable
Development Strategy developed
- Provincial Strategy and Action Plan on
REDD+ developed
- ER Program Idea Note East Kalimantan
developed
- BFCP strategic plan for 2001-2015
developed
Institutional
capacity &
capacity in
land use
management
- Technical support to FMUs in East
Kalimantan: development of an FMU
forest management plan in Berau
- Support to forest concessions in obtaining
forest certifications: No. of certified
concessions increased (legality, PHPL,
FSC certifications)
- Village workshops on boundary mapping,
FPIC and sustainable agriculture
techniques: inter alia village boundaries
mapped, rice cultivations established
- BFCP stakeholder workshops on remote
sensing
Capacity
- Operationalization of
FMU in Berau
increased
- Increased capacity of
the community, sub-
district and district
government in making
village regulations
Forests in
land-use
planning
- Conduction of land use studies and
assessments on provincial and district
level: new information & data available
- Development of land use data base for
Berau
- Strategic Environmental Assessment of
Berau’s RPJMD 2016-2021 & RTRWK
published
- Integration of BFCP strategies into
Berau’s midterm development plan 2016-
2021
Monitoring
& planning
of SFM
related
projects
- Rapid assessment of the BFCP
performance
Funding
committed
to SFM
- Approval of FCPF ER Program in East
Kalimantan
- Attraction of funding: TFCA Kalimantan,
MCAI
- Financial support related to REDD+ from
TNC and GIZ in East Kalimantan
Extent and
condition
of forests
Forest area
& carbon
stocks
- Availability of information and data on
provincial & district forests, carbon stocks
and land use cover increased and
improved
- Provincial & district Forest Reference
Level developed
- Small-scale preservation of forest area
and carbon stocks on the village level in
Berau

Chapter 5: Results
62
Table 15 (continued)
Extent and
condition
of forests
Forest area
in
compliance
schemes
- Support of forest concessions: all active
forest concessions in Berau legality
and/or PHPL certified; FSC certifications
increased
Multiyear
forest
management
plans
- Support to FMUs and forest concessions
in developing forest management plans
(fmp): FMU fmp developed; all active
concessions possess fmps
Forest
ecosystem
health and
resilience
Threats to
forests &
climate
change
adaption
- Identification and quantification of
drivers of deforestation and forest
degradation in East Kalimantan
- Access and information availability of
forest threats increased
- Conduction of community awareness
campaigns in relation to climate change
and SFM on the village level in Berau
Threats to
forests
- Understanding of
deforestation and
forest degradation
drivers increased on
the provincial and
district level
- Awareness of climate
change and forests on
the provincial level
increased
Restoring
forest land
- Provincial and district strategies on
reforestation and the rehabilitation of
peatlands formulated
- Small-scale land rehabilitation on the
village level in Berau
Forest
production
Silvicultural
operations
& their
monitoring
in natural
forests
- Through support to forest concessions in
Berau in complying with FSC standard:
FSC certified forest concessions in Berau
increasing
- Trials of Reduced impact logging-
Carbon
Resource
assessment
- By supporting forest concessionaires in
complying with legality, PHPL and FSC
standards in Berau: conduction of forest
inventories enforced
- Support to FMUs: forest management
plan of FMU in Berau developed
Forest
product
tracking
system
- Technical support to forest
concessionaires in complying with
legality and PHPL standards in Berau:
log tracking systems in all active
concessions in Berau implemented
Forest
biological
diversity
Ecosystem
diversity
- Protected forest areas strengthened
- Identification of HCV forest areas in
three villages in Berau
- Establishment of new small-scale
protected areas on the village level

Chapter 5: Results
63
Table 15 (continued)
Forest
biological
diversity
Forest
species
diversity
- Conduction of HCV studies & biodiversity
surveys in East Kalimantan: identification
of endangered animal and plant species
- By supporting forest concessionaires in
complying with FSC in Berau: forest
species diversity strengthened
Biodiversity
conservation
in
production
forests
- By supporting forest concessionaires in
complying with FSC in Berau:
conservation of biodiversity in production
forests strengthened
- Mapping of HCV forests in several natural
production forests and villages in Berau
Soil and
water
protection
Protective
function of
forests for
soil & water
- Management decree for Dumaring River
Upstream Forest for two village forest
management units in Berau
- By supporting forest concessionaires in
complying with FSC in Berau: protective
function in terms of soil and water
strengthened
Economic,
social and
cultural
aspects
Local
livelihoods
& forest
management
- By supporting forest concessionaires in
complying with FSC in Berau: various
economic, social and cultural functions of
forests strengthened (also applies to the
following outputs below)
- 26 NGOs working in 78 villages in the
Berau District
- Several communities and villagers in
subsistence farming and other village
development related activities trained
- SIGAP-REDD+ approach in 2 villages
piloted and replicated in 24 villages in
Berau
Economic
aspects of
forests
- Establishment of NTFP community
business groups on the village level
- Technical support of farmers in the
management of NTFP in Berau
Resolving
disputes
between
forest
stakeholders
- Conduction of workshops on spatial
planning and village boundary mapping in
some villages in Berau
- Production of indicative maps of village
boundaries
- Conduction of land tenure assessments and
participatory boundary mapping in various
villages in Berau
Village
forest
management
rights
- Several villages in Berau and the
remaining TFCA Kalimantan intervention
area received village forest management
rights

Chapter 5: Results
64
5.1.1 Criterion 1: Enabling conditions for sustainable forest management
5.1.1.1 Outputs related to policies and regulations for governing forests
Since REDD+ was introduced in East Kalimantan a number of regulations and policies that aim to guide
its implementation have been developed and formulated. Most of those were a direct response to the
threats to climate change and meant to support sustainable development. They outline objectives and
strategies related to reducing emissions in the forestry sector and can therefore directly be related to the
governance and management of forests.
An example is the East Kalimantan governor’s pledged in 2009 to make East Kalimantan a “green
province” (Kaltim Hijau) (Anderson et al., 2016) that was followed by the “Kaltim Hijau” (Green
Kaltim) declaration in 2010 (Government of East Kalimantan, 2010). The declaration outlines
environmental and sustainable goals. In 2011 it was followed up by guidelines for the implementation
of the ‘Green Kaltim’ through Governor Regulation No. 22/2011. They include provisions such as the
formulation of policies to improve forest management through SFM.
Another example is the Regional Action Plan for Reducing GHG Emissions (RAD-GRK)54 of 2012 that
was released through Governor Regulation No. 54/2012. It stipulates objectives and strategies to reduce
provincial carbon emissions from deforestation and land degradation in East Kalimantan and covers
among other things strategies for the forestry, plantation and mining sector. An outlined strategy for the
forestry sector is for example the implementation of SFM and High Conservation Value (HCV) Forest
in selective logging and timber concessions (Government of East Kalimantan, 2014) .
In 2013, the Governor of East Kalimantan, moreover, issued Instruction No. 180/1375-HK/2013, a
moratorium on the issuance of new mining, plantation and logging permits. The moratorium aimed to
allow for a revision of existing land use permits to determine if permits had been issued according to
law (Casson et al., 2014).
5.1.1.2 Outputs related to institutions supportive of forest management
A number of ad hoc institutions were developed as part of the REDD+ process on the provincial and
district level that are supportive to the management and governance of forests. Especially on the
provincial level, their members have frequently been involved in the formulation of REDD+ related
strategy and action plans and in promoting the vision of sustainable development. Interviewees
frequently stated that REDD+, through those institutions, has triggered discussions on issues related to
customary rights and SFM in the focus area.
REDD+ related institutions with a relevance for SFM on the provincial level included the REDD+
working group that was established in 2008 and the Regional Council on Climate Change (DDPI) that
was established in 2011.
Institutions that were established as part of the REDD+ process in Berau, and meant to support the
implementation of the BFCP, included the district-wide REDD+ working group of 2009 and the Steering
Committee of the BFCP of 201155.
The REDD+ working group in Berau was meant to facilitate the communication between different
stakeholders and to coordinate the different activities of implementing organizations and stakeholders
under the BFCP. Based on the interviews, its success in doing so was, however, limited for various
reasons. Interviewed stakeholders from local NGOs were accordingly skeptical about its recent
achievements. One of those reasons were funding concerns. Interviews and field visits revealed that by
the time of study conduction, the working group had not received any funding for two years, leaving the
staff to work voluntarily. By decree no. 716/2009 (Bupati Berau, 2009) all costs that arose from the
establishment of the REDD+ working group should have financially been supported by the Berau
54 RAD-GRKs are based on the National Action Plan to Reduce Greenhous Gas Emissions (RAN GRK). The RAN GRK of
2011 that was approved in Presidential Regulation No. 61 in 2011, was a direct follow up of Indonesia’s national
commitment to reduce GHG emissions by 26/41% and builds substantially on REDD+ Anderson et al. (2016); National
Development Planning Agency (2011). 55 See chapter 4.2 for more information on these institutions.

Chapter 5: Results
65
government, but interviews revealed that in the past most of the funding for the working group was
provided by TNC.
Concerns were also expressed about the BFCP Steering Committee. According to the interviewees, it
had met only twice by 2011 and finalized and endorsed the BFCP strategic plan on its last meeting.
Interviewees complained about the limited actions of the Steering Committee after the endorsement of
the strategy and the lack of follow-up meetings. Apparently, there were no more meetings, activities or
products. Based on those statements, the internal evaluation report of the BFCP concluded that the
Steering Committee had not provided “significant results and impacts” (Noor, 2016).
Meetings with members of the working group and other BFCP stakeholders revealed that seven years
after the initiation of the BFCP, there was (still) no organization or institution taking on the role of
coordinating the different programs under the BFCP.
5.1.1.3 Outcomes related to forest governance
Coordination & communication
As newly established platforms that unite different stakeholder groups and ministries, on the provincial
level, the REDD+ working group and especially the DDPI fostered cross-sectoral communication.
Interviews, however, also revealed that REDD+ related communication was still primarily built on
personal relationships rather than on legal authority between the DDPI and provincial ministries.
Based on interviews, there was still a need to improve coordination and monitoring tasks in relation to
land use and climate change by the government.
On the district level poor communication and coordination in newly established REDD+ institutions
were observed. As mentioned before, an operational institution was lacking to take on responsibility for
the implementation and coordination of activities to achieve the BFCPs objectives.
Stakeholder participation in forest governance
In East Kalimantan, through platforms such as the REDD+ working group and the DDPI, Civil Society
Organisations (CSOs) and academia (universities and research institutes) were frequently involved in
the REDD+ process and therewith in aspects concerning the governance of forests.
Land tenure and ownership
See criterion 7.
5.1.1.4 Outcomes related to political commitment and ownership to support
REDD+
On the provincial and district level, the REDD+ process has gained political support and commitment
from the governmental level that was also important for fostering the implementation of SFM. The
commitment was, for example, expressed through the formulation of provincial ER targets56.
The governmental support formed the basis for the establishment of new institutions and for the
enactment of policies and regulations related to REDD+. However, by the time of study conduction the
REDD+ process in East Kalimantan was still largely influenced by non-governmental actors.
International organizations and academics were the main drivers of the current REDD+ process.
In Berau there was a lack of ownership from the local government on the jurisdictional REDD+ pilot
project observed that resulted in several drawbacks57.
5.1.1.5 Outputs related to the development of strategy and action plans for forests
Several assessments and strategies have been conducted and developed during the REDD+ process in
East Kalimantan and Berau. They inform on various land use related aspects and outline strategies to
achieve the ER targets in the land use sector. In other words, they provide the basis for the sustainable
management of East Kalimantan’s natural resources.
56 See chapter 5.1.1.1 57 See also chapter 5.5.1 on the challenges of the REDD+ implementation in the focus area.

Chapter 5: Results
66
The lack in implementation of such strategies and action plans, however, was raised as a central issue
by interviewees and implementation and evaluation reports. Interviewees pointed to a lack of guidance,
technical support, capacity on the field level and absence of a REDD+ implementation and monitoring
framework at the local level.
Key strategies in East Kalimantan comprised the East Kalimantan Environmentally Sustainable
Development Strategy, the ‘Provincial Strategy and Action Plan’ (SRAP) on REDD+, the FCPF ER
Program Idea Note, and a Master Plan on Climate Change.
The East Kalimantan Environmentally Sustainable Development Strategy identified five key initiatives
to improve land use efficiency and reduce GHG emissions: 1) Zero burning policy, 2) Reduced Impact
Logging, 3) Use of degraded land (for future expansion of oil palm and timber plantations and
agriculture), 4) Rehabilitation of opened peatlands and 5) Reforestation (DNPI & Government of East
Kalimantan, 2010). The document also specifically identified the need to improve harvesting practices
in Indonesia. REDD+ was proposed as an approach to achieve the outlined initiatives.
Measures in the SRAP on REDD+ comprised, among other things, the development of infrastructure in
the land-based sector to prevent deforestation and forest degradation at the provincial level (e.g.
establishment of REDD+ institutions), improved and accelerated implementation of efforts that aim to
prevent or control emissions from deforestation and forest degradation (mostly related to policies and
regulations) and improved land use management, for example, through assistance to the planning and
implementation of RIL. Several strategies, actions and indicators were formulated for the forestry,
agriculture, oil palm plantation and mining sector.
In October 2015, the process of drafting the ER-PIN East Kalimantan began. It was among other things
based on the RAD-GRK and SRAP documents (Republic of Indonesia, 2015).
The Master Plan on Climate Change combined the different strategies and followed the idea of having
only one single reference document for all districts in East Kalimantan. It was initiated by members of
the University Samarinda, REDD+ working group and DDPI.
The issue of climate change had also generally been integrated into East Kalimantan’s mid-term
development plan (RPJMD) of 2013-2018.
A number of assessments and strategies to improve land use management in the Berau District have also
been conducted and developed as part of the REDD+ process there. One of those was the BFCP strategic
plan for the period 2011 to 2015. The strategy comprised various elements of SFM on the landscape
level, among those for example, (Berau REDD+ Working Group, 2011; Hovani, unkown):
- Planning improvement and refinement particularly in relation to spatial planning, land use
planning and spatial permitting processes at the district level
- Bringing at least 800,000 ha of forest land under effective management
- Improvement of public welfare (in income and improved livelihood opportunities) for at least
5,000 people living within or around the forest estate
- Protection of valuable ecosystems, biodiversity and watershed function
- Capacity building within public institutions and for stakeholders, particularly human resources
and funding sustainability
Deforestation was mainly planned to be targeted through the spatial planning process and land use
activities outside the forest estate, such as oil palm. Forest degradation was mainly planned to be targeted
through the improvement of the management of natural forests and timber plantations. For this the BFCP
intended to support natural forest concessionaires in obtaining forest certificates (SVLK/PHPL, FSC),
support them in low emission forest management, help with the establishment of the FMU Berau Barat
and support in directing the establishment of plantation forests to severely degraded forest areas.While
some of the envisaged activities had been implemented, interviews and field observations revealed that

Chapter 5: Results
67
there was no clear follow up on the strategic plan58 and that the main objectives of reducing emissions
through better spatial planning and land use management could not be achieved59.
5.1.1.6 Outcomes/outputs related to building institutional capacity and capacity in
land use management
The REDD+ process contributed to building (institutional) capacity in the study area. Outputs comprised
the training of professional and technical personnel to perform and support forest management60.
Technical support was provided to model FMUs and forest concessions in issues related to forest
management and planning by organizations actively engaged in the REDD+ process such as GIZ and
TNC.
Following the document and interview analysis, FMU support in Berau included developing a forest
management plan; supporting FMUs in resolving land use conflicts; facilitation of partnerships between
communities and land use permit holders, and assisting FMUs in coordinating NGOs through the
establishment of an NGO forum. Interviews and field visits in the subsequent years of 2016 and 2017
showed that the model FMU in Berau increased their operationalisation visibly during those two years.
Nevertheless, the FMU roll-out on the local level still faced several challenges, among those substantial
budget and staff restrictions and unclear forest boundaries. In Berau, the limited resources together with
the many tasks, the vast area of up to 800,000 ha and the poor infrastructure limited the
operationalization of the FMU Berau Barat substantially.
Assisting forest concessionaires comprised to provide technical support to achieve the standards of
voluntary and mandatory forest certifications, namely the legality, PHPL and FSC certifications.
Interviews with forest managers revealed that support in complying with the FSC standard included
specifically training on spatial forest planning, development of forest harvest planning maps support to
implementing RIL, training forest workers on reading established maps and in felling practices in order
to reduce damage of other trees.
Under the BFCP, several NGOs, moreover, carried out capacity building measures on the village level.
Focus there lied on the assistance to and empowerment of communities and the development of
alternative sustainable land use practices. Outputs and outcomes in terms of capacity building on the
village level included (Hansen, 2017a), (Marquardt, 2015):
- Trainings related to village mapping and spatial planning and institutional strengthening
- Training on climate change, Free, Prior and Informed Consent (FPIC) and REDD+ related
issues, this, for example, included a climate change and REDD+ training for elementary school
teachers
- Development of learning materials in the TFCA Kalimantan intervention area on organic honey,
rubber agroforestry, traditional conservation practices, and protection of ecosystems in
ecotourism objects in the Embaloh watershed and in Malemba
- Training communities in the preparation of a Village Medium-Term Development Plan
- Facilitating social forestry partnerships in communities
- Conducting horticulture field schools and establishing rice cultivation and freshwater fish
cultivation
- Computer training, mapping and GPS use, and training for High Conservation Value (HCV) 5
and 6 of community members from various villages
- Increased capacity of the community, sub-district and district government in making village
regulations for sustainable natural resource management
58 See also 5.5.1 on hindrances to conditions to the subnational REDD+ process. 59 See also results of the forest loss analysis in 5.2. 60 See also outputs on the village level under chapter 5.1.7.1 and 5.1.7.2.

Chapter 5: Results
68
Some concerns in this context were that trainings and materials were too difficult to understand for local
communities.
There were also several activities and measures that aimed to train those stakeholders that were
responsible for implementing the BFCP in the study region. During the initiation phase of the BFCP,
between 2009 and 2010 several workshops to prepare the BFCP strategic plan for 2011-2015 were
conducted. They were mostly attended by representatives from the local, provincial and national
government, the private sector, TNC, local NGOs, the academia and members of Berau REDD+ working
group. Besides this, several technical trainings on remote sensing and the analysis of spatial data were
provided to key stakeholders of the BFCP.
TFCA Kalimantan also aimed to increase the capacity of their partners entrusted with the
implementation of their program, particularly in issues related to administration, institutions, finance,
project implementation, and reporting. Between 2014 and 2016, the implementing partners received
training in the form of (Hansen, 2017a):
- Training, workshops and mentoring in institutional management to optimize institutional
mechanisms. Training was related to administration and finance issues, recording and
bookkeeping systems, cost standards, procurement procedures, technical financial reporting,
and to financial internal control mechanisms
- Financial and institutional guidebooks
- Facilitators that supported the implementing partners in various matters, for example, related to
technical and financial issues
However, Hansen (2017a) identified several challenges that grantees (implementing organizations)
faced, among those: a lack of capacity of grantees personal staff, a limited understanding of
administrative and financial procedures and a lack of report submission.
5.1.1.7 Outputs related to the integration of forests in land-use planning
One achievement of the BFCP was the support of the local government in spatial planning and land use
processes through environmental controlling, GIS and development working groups on low emission
(internal evaluation report). Support included gathering and providing new information and data through
the conduction of land use studies, an assessment of Berau’s spatial plan and the development of a freely
available land use data base for the district.
The Strategic Environmental Assessment (SEA Taskforce of Berau District, 2016) of Berau’s Medium-
Term Development Plan (SEA RPJMD) (2016-2021) and the review of Berau’s spatial plan were
undertaken to strengthen sustainable development principles and environmental aspects in the Berau
District. The SEA RPJMD focused among other things on the strategic issues of climate change risks
and deforestation and degradation of forest ecosystems. Financial resources for the assessments were
among other things derived from the district government budget. TNC and a ‘Small Team of Civil
Society’ that worked under the REDD+ program guidelines of Berau facilitated the assessments (SEA
Taskforce of Berau District, 2016).
In 2016, the strategies of the BFCP were integrated into Berau’s latest RPJMD 2016-2021.
5.1.1.8 Outputs related to monitoring and planning of SFM related projects
To learn about the BFCPs performance and thus about its achievements in terms of various aspects
relevant for SFM – TNC initiated an evaluation of the strategic plan in 2016. Three consultants were
hired to conduct a rapid assessment of the BFCP performance. Unfortunately, the study author was not
able to find any baseline or evaluation documents. The same challenge was reported from the evaluators.
Generally, the author of this study observed a lack of monitoring of the BFCP which resulted in a gap
of information on the current progress. The analysis, moreover, revealed that the BFCP project strategy
was not satisfactorily translated into action. Problems were, for example, caused by overly optimistic

Chapter 5: Results
69
and ambitious project objectives and the fact that the non-forestry sector was inadequately involved in
the project conceptualization and design phase.
Given this shortcoming and the lack of an exchange forum for organizations supporting the BFCP, there,
moreover, existed insufficient information on who was actually involved in what and with which
resources.
5.1.1.9 Outputs related to funding committed to SFM – incentives to encourage
SFM
Following interview respondents, the attraction of funding was one of the central achievements of the
REDD+ program in Berau.
In both East Kalimantan and Berau, REDD+ was able to attract various external funding sources. Under
these sources, organisations engaged in the improvement of forests management.
On the district level, a related challenge was that activities under the single funding schemes were
scattered and not aligned to reinforce each other.
Among the funding schemes and programs achieved through the REDD+ process in the focus area were
the FCPF ER Program, the TFCA Kalimantan34 and the MCAI35.
The ER program, that will be piloted in East Kalimantan, will support ongoing policy reforms such as
the implementation of an FMU system to strengthen forest governance (RoI, 2016). The private sector
will, moreover, be engaged in obtaining forest certifications and be supported in low-emission
management practices, such as RIL. Other ER activities will focus on community empowerment and
community forestry, fire control and protection of peat lands. Activities will concentrate on five districts,
namely Berau, Kutai Barat, Mahakam Ulu, Kutai Kartanegara and Paser, and their ongoing REDD+
initiatives there.
One of the envisaged measures to build enabling conditions for the implementation of the BFCP strategy
in Berau was the development of sustainable funding mechanisms. By the time of study conduction
there were two major grant schemes and two organizations financially supporting the BFCP in Berau:
TFCA Kalimantan, the MCAI, GIZ and TNC. The MCAI has focused on the promotion of
environmentally sustainable, low-carbon economic growth and provided a combination of financial and
technical assistance with the aim to reduce the reliance on fossil fuel and improve land management
practices. The initial idea of the TFCA Kalimantan was to finance the BFCP activities, but interview
respondents raised concerns about the missing connection between the TFCA and the BFCP strategic
plan criticising that TFCA was mainly following their own schemes.
Activities of the GIZ and TNC relevant for SFM were, for example, to support forest concessions in
getting legality, PHPL and FSC certified.
5.1.2 Criterion 2: Extent and conditions of forests
5.1.2.1 Outputs/outcomes related to the extent of and change in forest area and
carbon stocks
The REDD+ process in East Kalimantan and Berau led to the availability of new and improved
information and data on the area of forest cover, land use/forest cover change, spatial and temporal forest
maps, forest conditions and wood-growing and carbon stocks. Analysis of drivers of deforestation and
forest degradation were conducted and response strategies to the drivers identified. Provincial and
district forest reference levels were, moreover, established. Information on these aspects related to the
extent of forest and carbon stocks formed the basis to successfully implement SFM and monitor and
plan progress.
The document and interview analysis for example revealed that local NGOs in Berau assisted in the
development of new ecotourism and protected area maps, and in the identification of geographical
conditions of important ecosystems (e.g. karst sites).

Chapter 5: Results
70
Outcomes in terms of conserving forests and reducing forest loss identified through the document and
interview analysis were, however, modest. Among the achievements in Berau was the prevention of
forest conversion of an area of each ~ 4, 900 ha in two villages (TFCA Kalimantan, 2018).
Within the entire TFCA intervention area (966,299 ha in Kalimantan), land use change of 87,486.54 ha
was, moreover, prevented, the planting of an area of 776.21 ha undertaken and forest fire prevention for
an area of 86,456 ha forest established (TFCA Kalimantan, 2018). Other efforts to conserve forest area
for example, through the creation of village forests remained in a preparatory stage by the time of study
conduction (TFCA Kalimantan, 2017).
5.1.2.2 Outputs related to forest area in compliance schemes
One common activity of organisations supporting the REDD+ program in Berau was the support of
forest concessionaires in better forest management. This was mainly achieved through assisting forest
concessionaires in implementing voluntary and mandatory certification standards, namely the PHPL,
legality and FSC standard.
By 2016, all active concessions in Berau had been at least certified for legality and thus possessed forest
management plans. There were six concessions that were in the process of getting FSC certified or that
were already certified. All of those also obtained financial support from The Borneo Initiative61(TBI) –
independent of REDD+.
5.1.2.3 Outputs related to multiyear forest management plans
As part of their support to forest concession holders in complying with the certification standards, these
organisations also assisted in the development of forest management plans.
As already mentioned, organizations actively engaged in the REDD+ process in Berau like TNC and
the GIZ, moreover, facilitated the FMU development and operationalization, for example, through the
development of the FMU’s forest management plan.
5.1.3 Criterion 3: Forest ecosystem health and resilience
5.1.3.1 Outputs/outcomes related to addressing threats to forests and climate
change adaption
Through the identification and quantification of drivers of deforestation and forest degradation, in both
East Kalimantan and Berau, the REDD+ process contributed substantially to the assessment of threats
to forest ecosystems. The access to and availability of this information was significantly improved in
the last few years. New information was not restricted to forest ecosystems but covered the entire land
use sector.
Various strategy and action plans that outline potential strategies to address these identified threats to
forests have subsequently been developed for East Kalimantan and Berau62.
In Berau, related activities included the conduction of scoping studies prior to the BFCP start. One of
those was the study “Carbon Emissions from Land Use, Land Use Change and Forestry in Berau District
East Kalimantan, Indonesia” that tested the feasibility of REDD in the Berau District. It comprised:
1) carbon stock accounting and monitoring, 2) a driver analysis of land use/cover change and 3) a
probability and REDD opportunity cost analysis (Ekadinata et al., 2010).
These studies on the provincial and district level and their underlying assessments resulted in a much
better understanding of deforestation drivers and their underlying causes in the focus area. Interviewees
and documents, moreover, suggested that the awareness on forests was visibly increased.
On the village level, in cooperation with communities, activities to monitor forest fires and illegal
logging in protected forests were, moreover, carried out by NGOs working under TFCA Kalimantan
(TFCA Kalimantan, 2018).
61 The TBI is an international initiative for the promotion of SFM in forest concessions in Indonesia. It financially supports
the adoption of the mandatory and voluntary certification schemes in the focus area. For more information
seehttps://theborneoinitiative.org/. 62 See chapter 5.1.1.5.

Chapter 5: Results
71
Many local NGOs supporting the BFCP, moreover, carried out activities to mainstream the idea of
REDD+ and climate change adaption. Activities for example included (Marquardt, 2015; TFCA
Kalimantan, 2015):
- Preparation and distribution of awareness materials like posters, leaflets, billboards, shirts,
stickers, films
- Development of manuals for forest management practices
- Conduction of community awareness campaigns in relation to climate change, socio-economic
and sustainable management issues
Despite those efforts, the document and interview analysis demonstrated that a limited understanding of
and interest in SFM related aspects, especially from stakeholders of non-forestry land use sectors,
remained in the focus area. Interviewees on the provincial level highlighted the limited understanding
and ownership on REDD+ related issues and projects among provincial government officials.
5.1.3.2 Outputs related to restoring forest land
Envisaged REDD+ activities in East Kalimantan included those related to the rehabilitation and
restoration of degraded areas. Provincial strategies like the East Kalimantan Environmentally
Sustainable Development Strategy of 2010 (DNPI & Government of East Kalimantan, 2010) listed
rehabilitation of open peatlands and reforestation as two of five key initiatives to improve land use
efficiency and to reduce GHG emissions.
Between 2010 and 2014, in total 20,000 ha of critical land were planned to be rehabilitated in Berau
District (Government of East Kalimantan, 2012).
Consequently, REDD+ organizations under the BFCP in Berau worked on the restoration of peatlands
and degraded forests. TFCA Kalimantan (2016), TFCA Kalimantan (2017) and TFCA Kalimantan
(2018) provided the following achievements for the TFCA Kalimantan intervention area:
- Land rehabilitation with agroforestry and restoration schemes in 328.92 ha village forests with
147,859 seedlings planted
- Mapping of degraded areas and plans for rehabilitation in three villages.
5.1.4 Criterion 4: Forest production
Findings under this criterion were mainly derived from the forest concession level in the Berau District.
5.1.4.1 Outputs/outcomes related to silvicultural operations and their monitoring
in natural forests
A central aim of the REDD+ process in East Kalimantan was to improve forest management practices.
Accordingly, one activity of REDD+ initiatives in Berau was to support forest concessions in obtaining
mandatory and voluntary certifications63.
However, there remain knowledge gaps on the impacts especially of the mandatory certification
schemes64.
The support of forest concessions in complying with the FSC standard contributed to sustainable
silvicultural operations. Instead of relying on the national harvesting system, the TPTI65, harvesting
levels at or below a level which can be permanently sustained have been estimated and applied.
Another silvicultural activity carried out by organisations supporting the BFCP was the implementation
of RIL procedures and their monitoring. The development of a methodology for measuring carbon
impacts of RIL practices, referred to as RIL-Carbon (RIL-C), was stated as an important achievement
of the REDD+ program in Berau by interviewees.
By the time of study conduction, in two concessions in Berau, RIL-C had been trialed. Internal TNC
project reports and discussions of the study author with an RIL-C officer revealed that these practices
63 See chapter 5.1.2.2 for outputs related to forest in compliance schemes. 64 See chapter 5.3.4.3. 65 See chapter 3.5.

Chapter 5: Results
72
could reduce up to 30 to 40% emissions compared to conventional logging by maintaining timber
production.
5.1.4.2 Outputs related to resource assessment
Through the support of forest concessionaires in obtaining mandatory and voluntary certifications under
the BFCP in Berau, the conduction of forest inventories was enforced. Another achievement was the
finalization of a business plan for the model FMU in Berau.
5.1.4.3 Outputs related to forest product tracking system
The REDD+ process in Berau indirectly contributed to the implementation of log tracking systems by
technically supporting concessionaires in obtaining related certifications, namely the legality and FSC
certifications.
5.1.5 Criterion 5: Forest biological diversity
The following results were mainly derived from Berau.
5.1.5.1 Outputs related to ecosystem diversity
Various organizations supporting the BFCP in Berau have facilitated or implemented activities related
to forest and ecosystem diversity conservation. These activities have strengthened existing protected
forest areas, facilitated the creation of new ones and supported the identification of HCV areas.
Achievements included (Fishbein & Lee, 2015; Marquardt, 2015; TFCA Kalimantan, 2016, 2017):
- Facilitation of the preparation of management plans in the Lesan River Protected Forest
- Studies on the forest quality of the Lesan River Protected Forest containing information on
biodiversity potential, carbon stocks, hydrological conditions, soil fertility, microclimate
- Facilitation of gazettment of Sungai Lesan Protected Forest
- Construction of a forest health monitoring plot
- Establishment of several new small protected areas
- Identification of HCV Forest areas in three villages
5.1.5.2 Outputs related to forest species diversity
The issue of species diversity was indirectly addressed through the support of forest concessionaires in
obtaining FSC certifications, specifically through the Principle 9: HCV, and 6: Environmental Values
and Impacts (e.g. through criteria 6.4), by organisations actively engaged in the REDD+ process in
Berau.
Organizations working under the TFCA Kalimantan carried out various biodiversity surveys, developed
related information material and protected important habitats. Key achievements in the entire TFCA
Kalimantan intervention area – that covers various districts in Kalimantan including the Berau
District – were as follows (TFCA Kalimantan, 2016, 2017, 2018):
- HCV studies on ‘Increasing the role and contribution of local conservation areas in biodiversity
conservation and management of natural resources’ in various districts: Various plants,
mammal, bird, amphibian and reptile species were identified, among those mammal species
with a critically endangered status (IUCN) or that are listed in CITES appendix 1, various plant
species with an endangered status on the red list of IUCN and endemic bird, amphibians and
reptile species
- Conduction of surveys in mangrove ecosystems in Tanjung Batu village; of proboscis monkeys
in the Berau River delta; of Sumatran Rhino in Kalimantan; of wild cattle species
(Bos javanicus) in ecosystem Hulu
- Compilation of guidelines for an orangutan survey and settlement of conflicts between
orangutans and humans
- Training in surveying orangutan populations in the Lesan River Protected Forest area

Chapter 5: Results
73
- Protection of mangrove ecosystems for Proboscis monkey habitat
- Protection and identification of Irrawaddy dolphin (Orcaella brevirostris) habitat in Kubu Raya
Regency, West Kalimantan
5.1.5.3 Outputs related to biodiversity conservation in production forests
Through the support of forest concessionaires in obtaining FSC certifications, REDD+ related activities
in Berau indirectly addressed several issues related to the conservation of biodiversity in production
forests, especially through Principle 9: HCV and Principle 6: Environmental Values and Impacts (Forest
Stewardship Council [FSC], 2015).
Organisations like TNC facilitated the mapping of HCV forest in several natural production forests and
villages. TFCA Kalimantan, moreover, supported the sustainable management of 233,568.17 ha of
forest area and conducted a biodiversity protection campaign for 10,988 people (TFCA Kalimantan,
2018).
5.1.6 Criterion 6: Soil and water protection
5.1.6.1 Outputs related to the protective function of (production) forests for soil
and water
On the local level in Berau, some organizations supporting the BFCP have carried out activities in
relation to the protective function of forests with the following outputs:
- Installation of hydrological observation stations in eight locations (Nyadeng River in Merabu
Village, Petiwar River Kampung Suaran, Hulu Hewan, Sungai Mud, Gua Peringgi, Hulu Batu
Lepoq, Mensa River, Marang River)
- Support of communities in several villages in watershed areas with the result that the Dumaring
River Upstream Forest received a management decree from MoEF for two village forest
management units in through funding support from TFCA Kalimantan
Organisations supporting the BFCP provided support to FMUs in East Kalimantan in preparing their
periodic forest management plans and thus indirectly strengthened the protective function of forests.
The reason for this is that forest management plans recognize sensitive areas (high slope) and buffer
strips (e.g. along water course), areas where harvesting is not allowed for purposes of soil protection.
By supporting forest concessionaires in obtaining FSC certification, specifically through the
implementation of indicator 6.7 on protection or restoration of natural water courses, water bodies,
riparian zones and their connectivity (FSC, 2015), the BFCP supporting organisations also indirectly
contributed towards the protective function of forests as related to soil and water.
5.1.7 Criterion 7: Economic, social and cultural aspects
The following findings were mainly derived from the village level in Berau.
Supporting forest concessionaires in complying with the FSC standard, especially with
Principle 3: Indigenous Peoples’ Rights, and Principle 4: Community Relations, indirectly strengthened
various economic, social and cultural functions of the forests.
5.1.7.1 Outputs related to local livelihoods and forest management
There were 26 NGOs working in 78 villages in the Berau District by the time of study conduction
(internal presentation & interviews). Many of these NGOs received their funding from the above-
mentioned REDD+ related granting schemes and focused on the empowerment of local communities,
training of villagers in subsistence farming and other village development related activities. Reported
outputs included (Fishbein & Lee, 2015; TFCA Kalimantan, 2016, 2017)66:
66 For more outputs related to the capacity building in forest management see chapter 5.1.1.6.

Chapter 5: Results
74
- Training in forest health monitoring for Lesan River Protected Forest
- Training in nursery techniques
- Planting of seasonal plants (e.g. peanuts, eggplant, sweet corn) grown by 18 farmer groups and
various fruit trees in different villages in Berau
- Training in participatory mapping for communities in Merabu in order to make arrangements
for village forest utilization permits
- Training in participatory mapping in order to map the utilization of mangrove forest ecosystem
areas
- Conduction of livelihood assessment studies in various villages covering human, natural,
infrastructure and economic resources
- Training in sustainable livelihoods in four villages
- Development of sustainable livelihood demonstration plots
Another output related to ITTO criterion seven, was the piloting of the community empowerment
approach ‘SIGAP-REDD+’ (Communities Inspiring Action for Change in REDD+) by TNC in initially
two villages from 2012 to 2014. Through this approach communities were assisted in formulating a
village development plan and in determining low emission intervention activities to prevent the increase
of forest clearing. The approach was just being replicated by local NGOs in additional 24 villages by
the time of study conduction. Some interviewees were, however, ambivalent about the suitability of the
approach and complained about the limited possibility to adapt the approach to their ideas.
5.1.7.2 Outputs related to the economic aspects of forests
Organisations working under the REDD+ program funding schemes in East Kalimantan, contributed
towards the production of non-timber forest products. Within the entire TFCA Kalimantan intervention
area (966,299 ha in Kalimantan) organisations supported the management of non-timber forest products
like honey, coffee, traditional medicinal plant and handicraft (TFCA Kalimantan, 2017, 2018).
On the subnational level in Berau, organizations working under the BFCP have supported or enabled
various economy-related activities in several villages. Outputs included (TFCA Kalimantan, 2017):
- Integration of development and management plans for mangrove and proboscis ecotourism in
Village Regional Long-Term Development Plan for 2016-2022
- Establishment of six community business groups of alternative economic strategies, for
example, banana chips
- Establishment of fresh fish and vegetable cultivation demonstration plots
- Conduction of ecotourism development activities in three villages
5.1.7.3 Outputs related to resolving disputes between forest stakeholders
One focus of REDD+ related projects in East Kalimantan was the assistance and empowerment of
communities in resolving land use conflicts. Measures in Berau included participatory boundary
mapping and the facilitation of land use conflict resolutions. International organizations such as the GIZ
and TNC supported the resolution of conflicts with industry businesses (community and business;
business and business) while local NGOs mainly assisted communities. Examples of specific outputs in
this context in Berau were (Marquardt, 2015; TFCA Kalimantan, 2016):
- Conduction of workshops on spatial planning and village boundaries in four villages to explore
the potential of the natural resources owned by the village and to identify and design the village
boundaries
- Production of indicative maps of village boundaries
- Training in mapping and introduction of FPIC in various villages
- Land tenure assessment and participatory mapping in communities in five villages that are
within a forest concession

Chapter 5: Results
75
Following the study authors observations and interviews, outcomes of these activities were mixed, and
land use conflicts frequently remained to persist even when there had been measures to resolve them
undertaken.
5.1.7.4 Outputs related to village forest management rights
With the support of NGOs working under the TFCA Kalimantan, several villages have received village
forest management rights. By 2016, community-based forest management was implemented in 23
villages comprising an area of 194,887 ha within the entire TFCA Kalimantan intervention area
(966,299 ha in Kalimantan). Specific outputs in Berau included (Fauna & Flora International [FFI],
2017; TFCA Kalimantan, 2017):
- Preparation of village forest in two villages covering an area of 8,988 ha in Berau
- Development of a Village Forest Management Institute (LPHK) in Tebih Daludun for the
management of village forests in the Dumaring River Upper Protection Forest area with a
working area of 3,877.319 ha in Berau
- Agreement over village boundaries and village forest in Hulu Sungai Dumaring protection forest
- Preparation of village forest in communities in three watersheds
5.2 Forest loss in East Kalimantan and Berau
In this chapter the results of the remote sensing data are presented to answer research question 1.1 ‘Do
subnational REDD+ activities contribute to forest loss reduction on the jurisdictional level?’ Results can
be translated to the achievements of REDD+ in terms of ITTO criterion two ‘Extent and conditions of
forests’.
In a first step, results of the forest cover estimations in East Kalimantan and Berau are presented as the
basis for the estimation of forest loss between 2001 and 2016. This is followed by the presentation of
the results of the forest loss analysis within East Kalimantan and Berau boundaries from 2001 to 2016,
their land use classes and – in the case of Berau – within forest and non-forest land use permits.
5.2.1 Forest cover in East Kalimantan and Berau
Figure 21 and Figure 22 illustrates the land use classes in East Kalimantan and Berau following the
spatial plan of 2014 (SK 718/2014). The land area of each class according to the official land
classification (and its respective true forest cover in 2000) is shown in Table 16 for East Kalimantan and
in Table 17 for Berau. ‘Forest area’ is classified into protection forest (HL), permanent production forest
(HP), limited production forest (HPT), convertible production forest (HPK) and conservation area
(KSA/KPA).
Figure 8 shows the forest cover in 2000 in East Kalimantan and the Berau District. Based on the Gaveau
et al. (2016) data set, forest cover in 2000 was 6,416,396 ha in East Kalimantan and 1,767,654 ha in
Berau, that is, 28% of East Kalimantan’s forest cover in 2000.
Most of the forest in East Kalimantan and Berau District was found within the limited production forest
class. About 16% of the total forest cover in East Kalimantan and 22% in Berau was found within the
‘non-forest area’ (APL) in 2000.
The total forest cover in all land use classes – that is, 1,766,396 ha in Berau and 6,413,703 ha in East
Kalimantan – differs slightly to the total forest cover of East Kalimantan and Berau just mentioned,
which is explained by the different water area estimated by Gaveau et al. (2016) and the spatial plan.

Chapter 5: Results
76
Figure 21: Land use classes of East Kalimantan as of spatial plan SK 718/2014.

Chapter 5: Results
77
Figure 22: Land use classes of Berau as of spatial plan SK 718/2014.
Table 16: Land use class area (calculated based on SK 718/2014) and their forest cover in 2000 (based on
Gaveau et al. (2016)) in East Kalimantan.
Land use class Land area according to land use
classification [ha]
True forest cover 2000
[ha]
State forest 8,242,732 5,400,666
Protection Forest (HL) 1,785,807 1,663,311
Conservation Area (KSA/KPA) 437,055 35,052
Limited Production Forest (HPT) 2,876,521 2,383,870
Production Forest (HP) 3,022,828 1,273,696
Convertible Production Forest (HPK) 120,521 44,738
Non-forest Area (APL) 4,301,274 1,013,036
Total land area 12,544,006 6,413,703
Table 17: Land use class area (calculated based on SK 718/2014) and their forest cover in 2000 (based on
Gaveau et al. (2016)) in Berau.
Land use class Land area according to land use
classification [ha]
True forest cover
2000 [ha]
State forest 1,557,879 1,382,377
Protection Forest (HL) 362,818 350,894
Limited Production Forest (HPT) 624,349 606,397
Production Forest (HP) 536,792 398,207
Convertible Production Forest (HPK) 33,921 26,880
Non-forest Area (APL) 600,292 384,018
Total land area 2,158,171 1,766,396
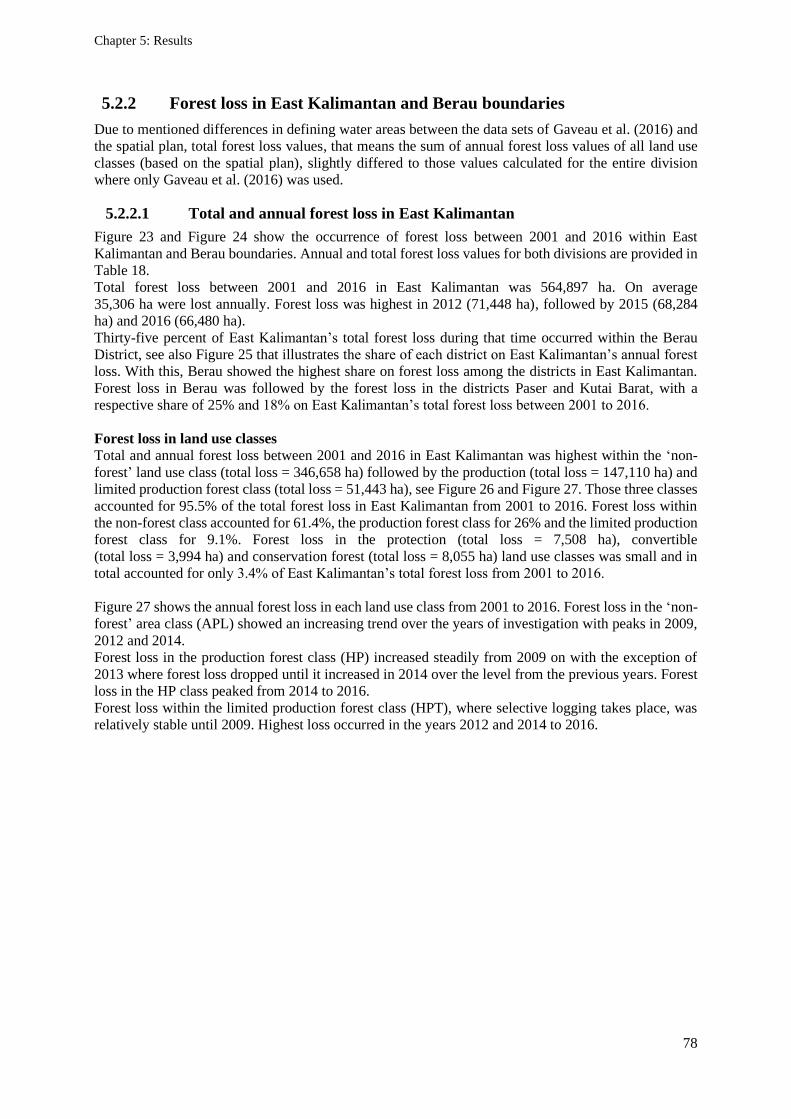
Chapter 5: Results
78
5.2.2 Forest loss in East Kalimantan and Berau boundaries
Due to mentioned differences in defining water areas between the data sets of Gaveau et al. (2016) and
the spatial plan, total forest loss values, that means the sum of annual forest loss values of all land use
classes (based on the spatial plan), slightly differed to those values calculated for the entire division
where only Gaveau et al. (2016) was used.
5.2.2.1 Total and annual forest loss in East Kalimantan
Figure 23 and Figure 24 show the occurrence of forest loss between 2001 and 2016 within East
Kalimantan and Berau boundaries. Annual and total forest loss values for both divisions are provided in
Table 18.
Total forest loss between 2001 and 2016 in East Kalimantan was 564,897 ha. On average
35,306 ha were lost annually. Forest loss was highest in 2012 (71,448 ha), followed by 2015 (68,284
ha) and 2016 (66,480 ha).
Thirty-five percent of East Kalimantan’s total forest loss during that time occurred within the Berau
District, see also Figure 25 that illustrates the share of each district on East Kalimantan’s annual forest
loss. With this, Berau showed the highest share on forest loss among the districts in East Kalimantan.
Forest loss in Berau was followed by the forest loss in the districts Paser and Kutai Barat, with a
respective share of 25% and 18% on East Kalimantan’s total forest loss between 2001 to 2016.
Forest loss in land use classes
Total and annual forest loss between 2001 and 2016 in East Kalimantan was highest within the ‘non-
forest’ land use class (total loss = 346,658 ha) followed by the production (total loss = 147,110 ha) and
limited production forest class (total loss = 51,443 ha), see Figure 26 and Figure 27. Those three classes
accounted for 95.5% of the total forest loss in East Kalimantan from 2001 to 2016. Forest loss within
the non-forest class accounted for 61.4%, the production forest class for 26% and the limited production
forest class for 9.1%. Forest loss in the protection (total loss = 7,508 ha), convertible
(total loss = 3,994 ha) and conservation forest (total loss = 8,055 ha) land use classes was small and in
total accounted for only 3.4% of East Kalimantan’s total forest loss from 2001 to 2016.
Figure 27 shows the annual forest loss in each land use class from 2001 to 2016. Forest loss in the ‘non-
forest’ area class (APL) showed an increasing trend over the years of investigation with peaks in 2009,
2012 and 2014.
Forest loss in the production forest class (HP) increased steadily from 2009 on with the exception of
2013 where forest loss dropped until it increased in 2014 over the level from the previous years. Forest
loss in the HP class peaked from 2014 to 2016.
Forest loss within the limited production forest class (HPT), where selective logging takes place, was
relatively stable until 2009. Highest loss occurred in the years 2012 and 2014 to 2016.

Chapter 5: Results
79
Figure 23: Forest loss in East Kalimantan from 2001 to 2016 based on Gaveau et al. (2016) and
M. C. Hansen et al. (2013).
Figure 24: Forest loss in Berau from 2001 to 2016 based on Gaveau et al. (2016) and
M. C. Hansen et al. (2013).

Chapter 5: Results
80
Figure 25: Share of annual forest loss of each district from 2001 to 2016 in East Kalimantan.
Table 18: Annual forest loss in East Kalimantan and Berau.
Year East Kalimantan [ha] Berau [ha]
2001 10,158 4,200
2002 12,728 4,170
2003 11,305 3,482
2004 19,168 6,834
2005 18,569 6,610
2006 29,756 12,667
2007 22,627 12,152
2008 15,674 3,469
2009 45,249 12,356
2010 25,436 7,656
2011 46,831 16,530
2012 71,448 30,618
2013 45,905 14,117
2014 68284 21,573
2015 55,279 17,931
2016 66,480 21,845
Total 564,897 196,210
Mean 35,306 12,263

Chapter 5: Results
81
Figure 26: Total forest loss per land use class from 2001 to 2016 in East Kalimantan.
Forest loss in the convertible production forest class (HPK) peaked in 2006, 2012 and 2016. Forest loss
in the protection forest class (HL) was relatively stable over the years, except for year 2016 where forest
loss was five times as high as the mean annual forest loss from 2001 to 2016 in the HL class. Forest
loss in the conservation area (KSA) peaked in 2009 and 2014 to 2016.
Figure 27: Annual forest loss in each land use class from 2001 to 2016 in East Kalimantan.
5.2.2.2 Comparing forest loss of ‘non-REDD+’ and ‘REDD+-period’ in East
Kalimantan
Annual forest loss in East Kalimantan showed an increasing trend from 2001 to 2016. Forest loss in the
REDD+-period, from 2009-2016, was clearly elevated in comparison to the first half from 2001 to 2008
where no REDD+ activities had taken place. Table 19 compares the annual and total forest loss of the
time when no REDD+ activities had taken place with the ‘REDD+ period’ in East Kalimantan.
From 2001 to 2008 in total 139,985 ha forest were lost. This corresponds to an annual forest loss of
17,498 ha. Annual forest loss during that time ranged between 10,158 and 29,756 ha. Total loss in the

Chapter 5: Results
82
‘REDD+ period’ (2009 - 2016) was in comparison 424,912 ha, which corresponds to an annual loss of
53,114 ha. Annual forest loss here ranged between 25,436 and 71,448 ha. This means that the mean
annual forest loss tripled within the ‘REDD+ period’.
As Figure 27 and Table 19 demonstrate, this trend was also observable for the forest loss within the
single land use classes. Total and annual forest loss in each land use class was higher within the ‘REDD+
period’ than in the period from 2001 to 2008. Accordingly, and as already stated above, most of the land
use classes showed peaks in their forest loss during the ‘REDD+ period’, that is, between 2009 to 2016.
Table 19: Annual and total forest loss in each land use class in East Kalimantan from 2001 to 2016;
range = minimum and maximum annual forest loss values; *with data from Gaveau et al. (2016) and
M. C. Hansen et al. (2013); I with data from spatial plan SK78/2014.
Land use
class
Total loss [ha] Annual mean forest loss and range [ha]
2001-
2016
No REDD+
2001 - 2008
REDD+
2009 -
2016
2001-2016 No REDD+
2001 - 2008
REDD+ 2009
- 2016
East
Kalimantan* 564,897 139,985 424,912
35,306 (10,158-71,448)
17,498 (10,158-29,756)
53,114 (25,436-71,448)
Non-forest
area*I 346,659 83,887 262,772 21,666
(3,990-50,841) 10,486
(3,990-22,523) 32,846
(15,211-50,841)
Protection
forest*I 7,508 2,342 5,167 469
(166-2,503) 293
(166-465) 646
(244-2,503)
Production
forest (PF)I 147,110 34,211 112,899 9,194
(2,728-22,130) 4,276
(2,728-6,519) 14,112
(6,944-22,130)
Convertible
PF*I 3,994 1,403 2,591 250
(66-650) 175
(66-521) 324
(170-650)
Limited PF*I 51,443 15,831 35,612 3,215
(1,433-8,615) 1,979
(1,233-2,756) 4,452
(1,986-8,615)
Conservation
area*I 8,055 2,259 5,795 503
(72-1,208) 282
(125-546) 724
(72-1,208)
5.2.2.3 Total and annual forest loss in Berau
In total 196,210 ha forest was lost between 2001 and 2016 in Berau. This corresponds to a mean annual
loss of 12,263 ha with an annual minimum loss of 3,469 and a maximum of 30,618 ha. As shown in
Figure 28, annual forest loss showed an increasing trend in the period of investigation. Annual forest
loss from 2011 on exceeded those of the previous year.
Figure 29 shows the total forest loss from 2001 to 2016 per land use class in Berau. Based on the land
classification of the spatial plan of East Kalimantan from 2014 (SK718/2014), most of the forest loss in
Berau during this time period, that is, 126,634 ha or 65%, occurred within the ‘non-forest area’ (APL).
It was followed by the production forest class (HP) and the limited production forest class (HPT) where
49,050 ha or 25% of Berau’s total forest loss and 17,455 ha or 9% were lost, respectively. Forest loss in
the protection forest (HL) and convertible production forest (HPK) accounted for both 1% or 1,093 ha
and 1,919 ha, respectively. With this, the APL, HP and HPT classes accounted for 98.5% of Berau’s
total forest loss between 2001 and 2016.
Annual forest loss between 2011 and 2016 was on average 7,915 ha in the APL, 3,066 ha in the HP,
1,091 ha in the HPT, 68 ha in the HL and 120 ha in the HPK class, see Table 20.
Forest loss in the APL class was relatively low from 2001 to 2003 and in 2008, see Figure 28. From
2006 on it increased with a peak in 2012. Forest loss in the production forest class increased from 2011
on with the exception of the year 2013 where it dropped from the peak in 2012 after it peaked again in
2014 and the following two years. Forest loss in the limited production forest class showed an increasing

Chapter 5: Results
83
trend from 2009 on. Highest forest loss was observed in 2014 and 2016. Forest loss in the protection
forest class peaked in 2012 and 2016, forest loss in the convertible production forest class in 2012.
Figure 28: Annual forest loss in each land use class from 2001 to 2016 in Berau District.
Figure 29: Total forest loss per land use class from 2001 to 2016 in Berau.
5.2.2.4 Comparing forest loss of ‘non-REDD+’ and ‘REDD+- period’ in Berau
Table 20 compares the total and mean annual forest loss of the time before REDD+ activities were
carried out, that is, from 2001-2009, with the time after the REDD+ initiation from 2010 to 2016 in
Berau. Total forest loss almost, and mean annual forest loss more than doubled between the two time
periods with a total forest loss of 65,940 ha from 2001 to 2009 and 130,269 ha from 2010 to 2016 and
a mean annual forest loss of 7,326.6 ha from 2001 to 2009 and 18,609.7 ha from 2010 to 2016.
A similar trend was observable in the single land use classes where total forest loss roughly and mean
annual forest loss more than doubled.

Chapter 5: Results
84
Table 20: Annual and total forest loss in each land use class in Berau from 2001 to 2016; range = minimum
and maximum annual forest loss values; *with data from Gaveau et al. (2016) and
M. C. Hansen et al. (2013); I with data from spatial plan SK78/2014.
Total loss [ha] Mean annual forest loss and range [ha]
Land use
class
2001-
2016
No REDD+
2001-2009
REDD+
2010 - 2016 2001-2016
No REDD+
2001 - 2009
REDD+ 2010
- 2016
Berau* 196,209 65,940 130,269 12,263
(3,469-30,618) 7,327
(3,469-12,667) 18,610
(7,656-30,618)
Non-forest
area*I 126,634 43,924 82,710
7,915 (1,490-21,749)
4,880 (1,490-9,945)
11,816 (5,278-21,749)
Protection
forest*I 1,093 388 705
68 (9-172)
43 (9-81)
101 (25-172)
Production
forest (PF) *I 49,050 15,574 33,476
3,066 (1,006-7,136)
1,730 (1,006-2,820)
4,782 (1,214-7,136)
Convertible
PF*I 1,919 610 1,309
120 (8-447)
68 (8-226)
187 (16-447)
Limited PF*I 17,455 5,416 12,039 1,091
(251-2,299) 602
(251-1,307) 1,720
(964-2,299)
5.2.3 Forest loss in forest land use permits in Berau
Figure 30 illustrates the occurrence of forest loss from 2001 to 2016 in natural forest (HA) and industrial
timber plantation concession (HTI) boundaries. Twenty-two-point two percent of the total forest loss
from 2001 to 2016 in Berau, or 43,558 ha, occurred within HA-boundaries. Ten-point eight percent, or
21,115 ha, occurred within HTI boundaries when using the land use permit data from BPKH Wilayah
IV Samarinda of 2016. This corresponds to an annual forest loss of 2,722 ha (ranging from
741 to 6,528 ha) and of 1,320 ha (ranging from 280 to 4,179 ha) that were lost annually within the entire
HA and HTI boundaries in Berau from 2001 to 2016, respectively.
Figure 30: Forest loss in natural forest concession permit (HA) and industrial timber plantation permit (HTI)
boundaries from 2001 to 2016 in Berau.

Chapter 5: Results
85
Annual forest loss of the entire area in Berau of both concession types is also shown in Figure 31 and
Figure 32. Annual forest loss in the HA boundaries showed an increasing trend between 2001 and 2016
with a peak in 2014. Forest loss within the HTI boundaries peaked in 2012 and remained relatively
stable above the level of the years 2001 to 2011 from 2014 on.
Figure 31: Annual forest loss in natural forest concession permit boundaries from 2001 to 2016 in Berau
(Number of concessions = 21).
Figure 32: Annual forest loss in industrial timber plantation permit boundaries from 2001 to 2016 in Berau.

Chapter 5: Results
86
5.2.3.1 Comparing forest loss of ‘non-REDD+’ and ‘REDD+-period’
Table 21 compares the total and annual forest loss within different land use permit boundaries between
the time when no REDD+ activities had taken place and that of REDD+.
In both forest permit boundaries in Berau, total forest loss roughly doubled from the ‘non-REDD+’ to
the ‘REDD+ period’ while annual forest loss was more than twice as high in the REDD+ than in the
‘non-REDD+ period’.
Table 21: Annual and total forest loss in forest and non-forest land use permit boundaries in Berau from 2001
to 2016; range = minimum and maximum annual forest loss values.
Land use permit
Total loss [ha] Mean annual forest loss and range [ha]
2001-2016
No
REDD+
2001-
2009
REDD+
2010-
2016
2001-2016 No REDD+ 2001-
2009
REDD+ 2010-
2016
Natural forest 43,558 13,544 30,014 2,722
(741-6,528) 1,505
(741-2,497) 4,288
(1,902-6,528)
Plantation forest 21,115 7,180 13,936 1,320
(280-4,179) 798
(442-1,062) 1,991
(280-4,179)
Oil palm 101,291 34,466 66,825 6,331
(980-19,306) 3,830
(980-8,526) 9,546
(4,446-19,306)
Mining 34,803 10,827 23,976 2,175
(534-5,153) 1,203
(534-1,814) 3,425
(1,409-5,153)
5.2.4 Forest loss in non-forest land use permits in Berau
Figure 33 shows the product of overlaying the forest loss of Berau between 2001 and 2016 with oil palm
and mining permit boundaries. Most large-scale forest loss between 2001 and 2016 in Berau occurred
within those land use permits. This corresponds to the results of the share of the single land use classes
on the total forest loss in Berau with most of the forest loss observed within the ‘non-forest’ area class
(APL) where oil palm permits can legally be granted, see also Figure 29. No statement can be made
whether the forest loss attached to the permit boundaries was legal or illegal.
Figure 33, moreover, reveals that a lot of the large-scale forest loss in the central part of Berau occurred
under mining and oil palm permits.
Total forest loss from 2001 to 2016 within the oil palm permit boundaries in Berau was 101,291 ha or
51.6% of Berau’s total loss in the same period. This corresponds to an annual forest loss of 6,331 ha
(ranging from 980 to 19,306 ha) within the area covered by the oil palm permit boundaries. Annual
forest loss, as shown in Figure 34, peaked in 2012 and 2014.
Total forest loss from 2001 to 2016 within mining permit boundaries was 34,803 ha or 17.7% of Berau’s
total forest loss in the same period. As Figure 35 reveals, from 2011 on, annual forest loss was above
the level of the years 2001 to 2010 and peaked in 2014 and 2015. Mean annual forest loss within the
mining permit boundaries of 2001 to 2016 was 2,175 ha ranging from 534 to 5,153 ha annually.

Chapter 5: Results
87
Figure 33: Forest loss in oil palm and mining permit boundaries from 2001 to 2016 in Berau.
Figure 34: Annual forest loss in oil palm permit boundaries from 2001 to 2016 in Berau.

Chapter 5: Results
88
Figure 35: Annual forest loss in mining permit boundaries from 2001 to 2016 in FMU Berau Barat.
5.2.4.1 Comparing forest loss of ‘non-REDD+’ with ‘REDD+ period’
Total forest loss within the area covered by the oil palm and mining permit boundaries roughly doubled
from the ‘non-REDD+ period’ to the time of REDD+, see Table 21. Mean annual forest loss in both
permit boundary types was more than twice as high in the REDD+ period than in the period without any
REDD+ activities.
5.3 Achievements and limitations of FLEGT-VPA in East Kalimantan
and Berau
This chapter presents the achievements and limitations of the FLEGT-VPA process relevant for SFM
for the focus area. The achievements and limitations were derived from the analysis of FLEGT-VPA
policy, evaluation and implementation reports and interview transcripts.
Achievements in terms of a forest loss reduction on the concession level that were derived from the
analysis of remote sensing data are reported separately in chapter 5.4.
Table 22 summarizes the identified achievements against the seven ITTO criteria.

Chapter 5: Results
89
Table 22: Summary of FLEGT-VPA achievements (outcomes and outputs) with a relevance for the focus area;
MFP = Multi-stakeholders Forestry Programme; JIC= Joint Implementation Committee; FPIC =
Free, Prior, and Informed Consent; SME = small and medium enterprise.
ITTO
criterion
Outputs
related to Examples of outputs
Outcomes
related to Examples of outcomes
Enabling
conditions
for SFM
Policies &
regulations
for governing
forests
- Improvement of SVLK regulations
- Technical support to social forestry
reform
Institutions
supportive to
forest
management
- Provincial focal point established
Institutional
capacity &
capacity in
forest
management
& monitoring
- Provision of technical and financial
support to Independent Monitoring
(incl. provincial focal points)
- Training on SVLK for government,
civil society and SMEs
- Collaboration with Universities
- Training of SVLK & PHPL audits
Capacity
- Increased capacity to
audit certification
processes
Forest
management
planning &
monitoring
- SVLK audits strengthened
- Independent Monitoring established
and strengthened
- Independent Monitoring carried out
by civil society: publication of two
reports
Forest
governance
- Establishment of forest data bases
- Platform for stakeholder
participation in forest governance
established, for example,
Independent Monitoring
Forest
governance
- Transparency in
forest production
increased
Funding
committed to
SFM
- Attraction of funding to implement
VPA on all levels: contributions
from EU, Government of Indonesia,
private sector and civil society
- Financial support from MFP
Extent and
condition
of forests
Illegal
logging
- Enforcement of legality certification
requirement for exporting companies
Illegal
logging
- Decreasing trend of
illegal logging
associated with
timber exports
suggested
Forest area in
compliance
schemes
- Enforcement of SVLK and PHPL
schemes: all active forest
concessions in Berau were certified
for legality and/or PHPL
Multiyear
forest
management
plans
- The need for forest concessionaires
to possess harvest and working plans
enforced through SVLK scheme
- All active concessions in Berau
legality certified (with harvest and
work plans)

Chapter 5: Results
90
Table 22 (continued)
Forest
ecosystem
health and
resilience
Threats to
forests
- Enforcement of SVLK on all levels
to fight illegal logging
- Promotion of SVLK and related
issues of illegal logging through
civil society campaigns
Threats to
forests
- Awareness of illegal
logging on all levels
increased
- Decreasing trend of
illegal logging
associated with
timber exports
suggested
Forest
production
Silvicultural
operations &
their
monitoring in
natural forests
- Through adoption of PHPL scheme
into SVLK legal framework,
enforcement of forest regeneration
on the management level
Resource
assessment
- The need to assess and report on
forest resources on the management
level enforced through SVLK
scheme
Resource
assessment
- Transparency on
forest resources
increased
Forest
product
tracking
system
- VPA implementation strengthened
timber product tracking through
enforcement of SVLK scheme,
particularly the timber supply chain
Forest
biological
diversity
Biodiversity
conservation
in production
forests
- Through adoption of PHPL scheme
into SVLK legal framework,
enforcement of ecological indicators
on the management level
Soil and
water
protection
Protective
function of
forests for soil
& water
- Through adoption of PHPL scheme
into SVLK legal framework,
enforcement of ecological indicators
(incl. the requirement to monitor
forest management impacts on soil
and water) on the management level
Economic,
social and
cultural
aspects
Labour rights
& equitable
benefit
distribution
- The health and safety of forest
workers strengthened through
adoption of related criteria in SVLK
scheme
- Through adoption of PHPL scheme
into SVLK legal framework,
standards for equitable sharing of
benefits, conflict resolution
mechanisms and labour rights
enacted
- Social inclusion strategy developed
by MFP
Economic
aspects of
forests
- Financial and technical support to
small-scale businesses in legality
certification matters by MFP
Resolving
disputes
between
forest
stakeholders
- Indicators related to tenurial and
boundary clarity and FPIC adopted
in PHPL regulations
Village forest
management
rights
- Public awareness campaigns on
social forestry schemes on the
community level by MFP

Chapter 5: Results
91
5.3.1 Criterion 1: Enabling conditions for sustainable forest management
The following achievements (outputs and outcomes) of the FLEGT-VPA process have been identified
in terms of enabling conditions for SFM for the focus area.
5.3.1.1 Outputs related to policies and regulations for governing forests
The FLEGT-VPA process, especially the development and implementation of the Indonesian TLAS,
has contributed to ongoing forest policy reform in Indonesia.
One achievement in this context, identified through the document analysis, was the strengthening and
improvement of SVLK related regulations (MFP, 2014b, 2017). As ‘legality’ is one aspect of SFM,
these improvements have a particular relevance for SFM on the subnational level.
The MFP, moreover, technically supported the social forestry reform through the revision of existing
and drafting of new regulations (MFP, 2017; Suparno & Nurbaiti, 2018). The social forestry reform
aims to allocate 12,7 million ha of forest to communities under social forestry schemes, that is,
community forest, community plantation forest, village forest, partnership and customary forest (MFP,
2017). However, interviews revealed that this area should be allocated on lands that do not carry a land
use license yet and as such avoid existing land use conflicts.
5.3.1.2 Outputs related to institutions supportive to forest management
A number of working groups and meeting forums have been developed on the national level to oversee,
monitor and/or implement the VPA and with this the implementation of the SVLK, among those Joint
Expert Meetings and the Joint Implementation Committee. Through its standards laid out in regulation
P.14/PHPL/SET/4/2016, the SVLK obliges forest concessionaires to implement various issues related
to the management of forest, timber production and processing. Therefore, established institutions have
also far-reaching responsibilities over the forest management level.
Despite its scope to oversee the implementation of the VPA/SVLK – that mainly takes place on the local
level – there was only little evidence of related subnational institutional structures in East Kalimantan.
By the time of study conduction, one provincial focal point had been established with the aim to support
the Independent Monitoring. However, field visits revealed that their operationalization was still poor.
5.3.1.3 Outcomes/outputs related to building institutional capacity
A number of capacity building measures have been carried out on the subnational level as part of the
FLEGT-VPA process to accelerate the implementation of the SVLK. Many of these measures were
carried out or supported by MFP. Among other things, the MFP strengthened capacities of FLEGT-
related institutions and actors engaged in the SVLK implementation and, therefore, in the management
of forests. Following their implementation reports, subnational support focused on Java and Sumatra
which were not focus areas of this study. Consequently, this information was not dealt with.
Capacity building measures with a relevance for the subnational level in East Kalimantan comprised
(Indonesia & EU, 2015; MFP, 2014a, 2017):
- Capacity building with a focus on the role of CSO in performing Independent Monitoring tasks
and its role in the JIC
- Support to national and local government agencies including activities to strengthen capacity of
forestry education centres by MPF3 and the MoEF
- Financial support of Independent Monitoring Organization Network (JPIK) to support their
work in monitoring compliance with SVLK
- Training and technical assistance for government officials, civil society representatives and
small and medium enterprises (SMEs) in terms of SVLK provided by MFP3
- Training for focal points to assist SVLK process for community-based forest institutions
supported by MFP3
- Collaboration of MPF3 with four universities, among those the University of Mulawarman in
Samarinda, to pilot the introduction of the SVLK subject into the undergraduate level

Chapter 5: Results
92
Following the study authors findings and observations, by the time of study conduction there were no
capacity measures carried out for the private forest sector in East Kalimantan.
5.3.1.4 Outputs/outcomes and limitations related to forest management planning
and monitoring
Two approaches to monitor the subnational implementation of the SVLK and its impacts have been
introduced and strengthened through the VPA-TLAS process: independent auditors and the Independent
Monitoring67. Both institutions act on the field level to assure compliance with the SVLK standards and
are, therefore, directly entrusted with observing the management of forests.
Interviewees raised concern over the quality of the auditors. Interviewed auditors stated that there was
a risk that concession holders would look for those auditors that were “known” for making the
certification process “easier” or to look for a new auditor once their current auditor “made the process
difficult”.
The document and interview analysis, moreover, revealed that the assessment of the legality and PHPL
standards mainly included verifying the existence of documents to verify the single indicators and that
auditors used environmental impact assessment documents and environmental management plans to
verify FPIC (indicator 1.5).
5.3.1.5 Outputs and limitations related to stakeholder participation in forest
management monitoring
One of the five elements of the Indonesian TLAS is the ‘Monitoring’. It comprises the Independent
Monitoring. The Independent Monitoring of the Indonesian TLAS is carried out by civil society and
assesses the compliance of PHPL and SVLK auditors and auditees with the requirements of the related
certification standards. Through the Independent Monitoring, civil society was provided with a platform
to actively engage in the monitoring of forest management operations.
By the time of study conduction seven networks existed that monitor compliance all over Indonesia.
One of those is the Jaringan Pemantau Independen Kehutanan (JPIK - Independent Forest Monitoring
Network). The JPIK had published two monitoring reports on the Indonesian TLAS by the time of study
conduction. The first one was published in 2014 and was based on the monitoring between 2011 and
2013. The second report for the term between 2014-2017 was published in 2018. Violations of the SVLK
standards mainly related to tenure conflicts and conflicts over boundaries with communities which
corresponded to what was mentioned in interviews with SVLK/PHPL audits.
Although the Independent Monitoring was strengthened through the latest revision of the SVLK
regulation (Indonesia & EU, 2017), interviews and field observations in East Kalimantan showed that
there were still substantial capacity and resource gaps. Interviewed stakeholders working for NGOs that
were part of the JPIK, reported that they had never received any funding for the monitoring and training.
The Independent Monitoring focal point on the provincial level in East Kalimantan in this context
pointed towards the national JPIK focal point holding them partly responsible for the limited resources
and information they received. Stakeholders from the national JPIK focal point, themselves pointed
towards the JPIK on the subnational level accusing them of not fully taking advantage of their
opportunities to apply for financial support.
In summary, consulted stakeholders and key documents revealed that the conduction of the monitoring
tasks was nearly impossible given the vastness of the country and the limited capacity of the Independent
Monitoring.
67 See Table 5 for more information on both elements.

Chapter 5: Results
93
5.3.1.6 Outputs related to building capacity in forest management planning and
monitoring
As part of the VPA process, several auditors were trained to assure compliance of forest permit holders
with the SVLK standards. Indonesia and EU (2017) for example stated that there were 396 SVLK
auditors working for 24 Conformity Assessment Bodies in Indonesia.
The MFP has facilitated the training of auditors in several universities in Indonesia. In line with this, all
interviewed auditors hold a university degree in forestry.
5.3.1.7 Outcomes related to forest governance
The VPA process has resulted in a number of achievements that are relevant for forest governance on
the subnational level in the focus area. Examples are given in the following.
As part of the FLEGT-VPA process, a variety of forest information from the field level has been made
accessible to the public which improved data transparency. Examples are assessments and reports from
the independent monitoring, documents related to the SVLK and FLEGT licenses, and SVLK related
databases. The following are examples of databases that provide data and information on timber
production that have been established or strengthened through the SVLK:
- Forest Products Administration Information System68 (SIPUHH): stores information on timber
production planning, logging, marking, transportation and processing
- Timber Legality Information System69 (SILK): serves as a registry for legality and PHPL
certifications, V-legal documents and FLEGT licenses
- Information System of Industrial Raw Material Receipt70 (SIRPBBI): contains data on timber
flows from and within primary industry
- Integrated Timber Data Management Information System71 (SIPHPL): integrates the existing
information systems and the Non-Tax State Revenue System (SIPNBP)
However, there were some limitations observed in terms of the transparency of those databases. While
the SIPUHH database provided only data on the total (planned) annual production and transported
volume of each province and annual total timber production per land use type throughout Indonesia,
additional or more detailed information was not made public.
Through various platforms, for example the Joint Implementation Committee, technical working groups
and the Independent Monitoring, CSOs were, moreover, given the opportunity to engage in the national
VPA implementation process and thus influence national forest governance. In those forums,
CSOs – many of them acting on the field level – took over the role of constantly reviewing and
monitoring the implementation of the VPA process and pointing out deficits, for example, through
publishing monitoring reports (Meridian et al., 2014; Meridian et al., 2018).
In East Kalimantan, provincial Independent Monitoring focal points certainly did involve CSO,
however, field observations of the study author revealed that both, the focal point itself and NGOs under
the JPIK, were still far from being operational and lacked sources to conduct their monitoring tasks.
Land tenure and ownership
See criteria 7, chapter 5.3.7.
68 http://sipuhh.net 69 http://silk.dephut.go.id/ 70 http://rpbbi.dephut.go.id/ 71 https://si-phpl.menlhk.go.id/

Chapter 5: Results
94
5.3.1.8 Outputs related to funding committed to SFM
The FLEGT-VPA process in Indonesia has attracted a substantial amount of funding to implement the
VPA and, therefore, for measures that follow the EUs wider objective to foster the implementation of
SFM (EC, 2003).
The desk review revealed that the total investment in FLEGT from the EU and member states was
€56.1 million (TEREA et al., 2016). Additionally, the government of Indonesia contributed
approximately €20 million, the private sector at least €10 million for mandatory certification costs and
civil society approximately €5 million obtained from other sources (idb.). The MFP that was since 2000
funded by the DFID’s Forest Governance, Markets and Climate framework programme, attracted
another 11.7 million pounds (~US$ 15.45 million) which was widely used to implement the SVLK
(Suparno & Nurbaiti, 2018, p. 41). The study author did not identify any other funds specifically
provided for the VPA implementation in East Kalimantan by the time of study conduction.
5.3.1.9 Outputs and limitations related to incentives to encourage SFM
It was frequently promoted that “The SVLK provides incentives for legality and sustainability by
promoting market access for verified legal products and blocking market access for illegal products”
(Indonesia & EU, 2015, p. 8; Suparno & Nurbaiti, 2018, p. 41) and that “The SVLK utilizes market forces
to fight illegal logging by providing incentives to timber-based industry players to conduct their
businesses in a sustainable manner” (Suparno & Nurbaiti, 2018, p. 41).
The analysis of interview transcripts and key documents suggested that the certification schemes in their
current forms did not act as an incentive to implementing SFM (nor legality). This is for the following
reasons: First, it is important to differentiate that sustainability is not equal to legality, but that legality
is only one part of SFM. While the quotes read as if the SVLK would automatically promote
sustainability through the implementation of the TLAS, assuring legality under the SVLK can also
support the use of unsustainable practices (such as the legal conversion of forests)72.
A former worker of an independent domestic organization that promotes sustainable natural resource
management through certification and that was involved in the initial legality definition of the SVLK
shared his view as follows:
“I think that [the issue of SVLK] is a very good progress. But I think it will not
automatically develop to the practice of SFM. I think the government […] will have to make
some effort to make that the ultimate goal [of the VPA: SFM] is come to reality. […] what
I see, the government still has the perception that the SVLK is not only the legality
certification. They said it is as well the sustainability certification. But the market response
[is] different with the present perception of the government. […] the [international] market
still thinks that the SVLK is only for legality. Not yet for the sustainability.”
Second, on the management level, concession holders interviewed uniformly stated that they were
hoping for premium prices through the legality certification but that they have not yet received them.
Certification was perceived an extra cost burden.
Third, the national government does not recognize other voluntary but widely recognized certification
schemes such as the FSC although they include all the relevant requirements of the SVLK. This means,
that concessionaires were obliged to obtain the SVLK and/or PHPL certificate, regardless of whether
they complied with FSC. These different and not-yet compatible legality and SFM certification schemes
placed a high burden on concessionaires, especially as the prospect of premium prices for the
concessionaires have not been realized under the SVLK.
72 See also chapter 5.3.4.3.

Chapter 5: Results
95
5.3.2 Criterion 2: Extent and conditions of forests
5.3.2.1 Outputs/outcomes and limitations related to the extent of and change in
forest area
The document analysis and expert interviews showed that there currently remained a knowledge gap on
the impacts of the VPA, namely of the PHPL and SVLK certification schemes in terms of reducing
forest loss and degradation and illegal logging and trade which was explained by a lack of reliable data.
The only estimations found in this context, were those of the evaluation of the FLEGT EU Action Plan
that suggested that achievements related to illegal logging (and trade) of FLEGT in Indonesia “have
been modest” (TEREA et al., 2016). Their estimations indicated that between 2000 and 2013, about half
of the illegal industrial roundwood produced in Indonesia was destined for local end-use (not exported).
While this roundwood production appeared to have been stable over the entire time period of 2000-2013
(~20 million m³/year), estimations indicated a decrease in illegally exported wood between the time
period 2000 and 2007 from which on estimations were more or less stable (varying between 15 to 20
million m³/year.
Many of the interviewees perceived a positive impact of the SVLK towards illegal logging, especially
towards illegal logging that resulted from exporting companies. However, consulted stakeholders also
emphasized the different sources of illegal logging and the limitations of the SVLK in this context.
Undocumented logging from communities, as generally harvesting for the domestic market, was
perceived as not being influenced by the current SVLK process, nor was large-scale deforestation
associated with other land use activities than forest management.
Results of the forest loss analysis on the concession level of this study are presented in chapter 5.4.
5.3.2.2 Outputs related to forest area in compliance schemes
As repeatedly mentioned, there are currently two mandatory forest management certification schemes
in Indonesia: the SVLK and the PHPL. The SVLK became the core element of the FLEGT-VPA. The
PHPL is stipulated within the SVLK regulation and as such part of its legal framework. Forest
concessionaires are obliged to obtain the PHPL certification before the first legality certificate expires.
The VPA process has improved both systems and accelerated its implementation on the ground.
In Berau, all active forest concessions were certified for at least legality by 201673.
In the VPA, Indonesia obliged itself to equally apply the SVLK to the domestic market. Interviewees,
among them forest concessionaires and plywood company officers, uniformly stated that for the
domestic market, there was no SVLK certification needed. While larger industries, for example,
plywood companies, mainly exported their produced and certified timber, small enterprises that feed the
local market as well as rejects from forest industries sold to the domestic markets, did not need a
certificate. The SVLK thus did not cover the domestic market. Interviewees framed that as the following:
“I think the weakness is – at least in the Indonesian context – it [the SVLK] does not really
cover the domestic market which is probably as big as the European one.”
5.3.2.3 Outputs related to multiyear forest management plans in concessions
One of the requirements of the legality certification is that permit holders must possess a valid harvest
plan for the cutting area and a valid work plan. The SVLK thus strengthened forest management
planning in forest concessions and its periodic monitoring. As all active concessions in Berau had been
at least certified for legality by the time of study conduction, they all possessed forest management
plans.
73 See chapter 5.4.3.

Chapter 5: Results
96
5.3.3 Criterion 3: Forest ecosystem health and resilience
5.3.3.1 Outputs/outcomes and limitations related to addressing threats to, and
vulnerabilities to forests
Illegal harvesting is one essential threat to natural tropical forests. To combat illegal logging, Indonesia
has implemented the VPA and strengthened Indonesia’s TLAS. As mentioned before, data on the actual
impacts of the FLEGT-VPA in terms of reducing illegal logging and related trade was poor in reviewed
key documents. TEREA et al. (2016), that evaluated the FLEGT Action Plan from 2004 to 2014,
recognized in this context that the evaluation of FLEGTs main objectives, namely the reduction in illegal
logging and related trade, was hindered by a lack of reliable data. They stated that neither production
nor trade in illegal wood-based products was being monitored.
Nevertheless, following interviewees and key documents, the VPA process has resulted in an increased
awareness on the issues of illegal logging on all levels in Indonesia. As part of the VPA process, a
number of campaign materials were for example produced and distributed to promote the SVLK and
related issues of ‘illegal logging’. Campaigns of civil society played a major role in raising this
awareness on issues of illegal logging and poor forest governance.
5.3.4 Criterion 4: Forest production
5.3.4.1 Outputs and limitations related to resource assessment
The VPA, through the implementation of the SVLK, contributed to the assessment and reporting of
forest resources. Through associated criteria, for example, through criterion 2.174 of the legality standard
in production forests, the SVLK reinforces the need for forest inventories and harvest plans which
specify annual allowable harvest in forest concessions. The standard for concessions within production
forest zones in the VPA further requires that “all the large diameter logs harvested or commercially
extracted have been reported in a Timber Production Report” (EU, 2014).
There was, however, a lack of information available on timber stemming from conversion areas and
being exported under the FLEGT licensing scheme to the public.
5.3.4.2 Outputs related forest product tracking systems
The VPA strengthened timber product tracking in Indonesia which is one requirement under ITTO
criterion 4.
The control of the supply chain is a key element of the SVLK. It requires that permit holders, landowners
and companies demonstrate that “every node of their supply chain is controlled and documented […]”
(EU, 2014, p. 297). This is achieved through related criteria, for example, through criterion 2.1 of the
legality standard for primary and downstream forest-based industry75 or criterion 3.1 of the legality
standard for concessions within production forest zones76.
Interviews revealed in this context, that it was (still) common practice for government officials to
demand “under-the-table costs” from the operators for those checks.
5.3.4.3 Outputs and limitations related to silvicultural operations and their
monitoring in natural and planted forests
Through integrating the PHPL system into the SVLK legal framework, FLEGT-VPA indirectly
contributed towards silvicultural treatments that ensure forest regeneration. A ‘silviculture system
ensuring forest regeneration’ is one of the required indicators. Maryudi et al. (2017) found that most of
the audited concessions scored the best grade on those production indicators (including the above one).
74 ‘Permit holder possesses a harvest plan for the cutting area that has been approved by the competent administrative
authorities’ 75 ‘Existence and application of a system which traces timber in the forest products’ 76 ‘Permit holders ensure that all the logs transported from a log yard in the forest to a primary forest products industry […] is
physically identified and accompanied by valid documents’

Chapter 5: Results
97
However, the content analysis of interview transcripts and key documents also revealed that there
existed gaps in terms of the sustainability of those TLAS and PHPL standards related to silvicultural
operations.
Some interviewees raised general concerns about the sustainability of the Indonesian mandatory SFM
certification, the PHPL, as the following statement of an officer of an international organization
revealed:
“If you look at PHPL, this is a very low standard. And I don’t believe that this is sustainable
at all.”
Concerns referred to the national Indonesian Selective Cutting with Replanting System77 (TPTI) adopted
by the PHPL. Reviewed key documents in this context indicated that the set harvesting diameter was
too low for many species, the current harvesting system, therefore, unlikely sustainable, and that
silvicultural systems based on diameter limit alone, as in the case of the TPTI, could not be compatible
with sustainability (Ruslandi et al., 2014; Sist et al., 1998).
By integrating the PHPL into the legal framework of the SVLK, the VPA also indirectly addressed the
issue of RIL. However, the verifiers under the PHPL focused on administrative requirements and
technical and silvicultural procedures rather than on ecological indicators (Maryudi et al., 2017;
Ruslandi et al., 2014).
Another concern related to the establishment of timber plantations that are addressed through a special
standard under the PHPL scheme. In Indonesia, timber plantation permits should only be issued on
degraded forest land. However, it has been acknowledged that the establishment of forest plantations
may involve the conversion of forests (RoI, 2016). Once a timber plantation permit is issued, there is no
need to demonstrate that the timber plantation was not established following the conversion of natural
forests under the PHPL. Voluntary certifications such as FSC in that case require that “Plantations
established in areas converted from natural forests after November 1994 shall not qualify for
certification” (FSC, 2015, p. 15) to avoid that the purpose of the plantation establishment involves clear-
cut deforestation.
Under the SVLK, the fourth legality standard, moreover, defines the standards for the ‘timber utilization
rights within non-forest zones on state-owned lands’. They apply to the so called ‘Izin Pemanfaatan
Kayu (IPK) permit’. IPK permits are required when clearing forested land and are required for the
conversion of forests to other land uses, for example, for oil palm plantations or mining. In other words,
timber that originates from clear cut areas can legally be supported to the EU market under the FLEGT
licensing scheme.
How much wood of this conversion timber is exported to the European market is unknown. This is due
to the fact that there is currently only limited information available on IPK timber and no information
on the amount of timber that originates from conversion areas and is exported.
5.3.5 Criterion 5: Forest biological diversity
5.3.5.1 Outputs/limitations related to biodiversity conservation in production
forests
Under the SVLK regulations there are no explicit criteria that require biodiversity conservation at the
concession level. Social and environmental issues are, however, indirectly referred to through SVLK
criterion 4 of the legality standard for concessions within production forest zone: “Compliance with
environmental and social aspects related to timber harvesting” (EC, 2015, p. 44). The criterion requires
permit holders to possess an approved applicable EIA document and to implement measures identified
in it.
77 See chapter 3.5.

Chapter 5: Results
98
The PHPL scheme includes an ecological criterion that comprises set-asides for protected areas, forest
protection to disturbances like forest fires, monitoring the forest management impact on soil and water,
and biodiversity (flora and fauna) assessment and management which includes inter alia to identify
protected, rare, endangered and endemic species.
The document analysis revealed that there is almost no information available about field level impacts
of those indicators. The only analysed source that reported on these aspects was Maryudi et al. (2017),
that reviewed PHPL certificates and found that related indicator 3.5: specific protection areas for
endangered, rare, threatened and endemic tree species, and indicator 3.6 for wildlife, appeared to be
problematic for concessionaires to implement. Maryudi et al. (2017) argued that this may indicate that
“activities in the production zones rarely take ecological aspects into consideration” (p.175).
5.3.6 Criterion 6: Soil and water protection
The interview transcript and document analysis did not suggest any direct contributions to this
criterion78.
5.3.7 Criterion 7: Economic, social and cultural aspects
5.3.7.1 Outputs/limitations related to the economic aspects of forests
The MFP carried out a number of activities to support small-scale timber businesses outside the focus
area in Java (not included in the following) and some others that were not closer specified, among those
(MFP, 2017):
- Financial and technical support to SMEs with the result that 525 SMEs were certified during
the MFP3 period
- MFP3 assisted community-based forestry enterprises in developing business proposals for the
‘Environmental Fund Management Agency’
Interviews with forest concessionaires and forest management trainers indicated that local forest
management enterprises did not profit from any increasing market. They all stated that they had not
received any premium prices through the certifications.
5.3.7.2 Outputs/limitations related to resolving disputes between forest
stakeholders
The standards of the SVLK and PHPL certifications that apply to forest permit holders comprise a
number of aspects that are relevant for ITTO criterion 7 but also hold important limitations.
For example, there is no direct reference to land use conflicts or customary rights in the legality standards
under the Indonesian TLAS. For concessions within production forest zones on state-owned land, social
aspects, as well as environmental aspects, are dealt with through EIAs.
For areas covered through legality standard four, that is, ‘the standard for timber utilization rights within
non-forest zones or from convertible production forest on state-owned lands’ (relates to timber from
conversion areas, see Table 6) the following principles are required (EC, 2015):
- Legal status of area and right to utilize
- Compliance with legal systems and procedures for tree harvesting and for the transportation of
logs
- Compliance with labor laws and regulations
No other social requirements exist to obtain a legality certificate in those areas.
Under the PHPL scheme there are a number of indicators that relate to tenure and user rights of
indigenous people and local communities. Related indicators comprise Indicator 1.1 on tenurial clarity
and security of the forests, Indicator 1.5 on FPIC and Indicator 4.1 on clear delineation and marking of
78 See 5.3.5.1 for indirect contributions and limitations in terms of environmental impacts of the PHPL implementation.

Chapter 5: Results
99
the forest area from indigenous people or community lands. Given their adequate implementation, the
Indonesian VPA could indirectly contribute to these aspects of sustainability but neither reviewed
documents nor interviews suggested a substantial impact on those issues. Rather, the review of the PHPL
regulation by the study author revealed that the verifier that relates to tenurial clarity (verifier 1.1.3.) is
a co-dominant verifier79. Apart from that, field observations and interviews suggested that it was very
unlikely that all of the concessions that had obtained a PHPL certificate, and consequently passed those
indicators or verifiers, were actually free from tenurial conflicts (relates to indicators 1.1 and 4.1) and
had implemented FPIC (relates to 1.5). One of the FMU staffs working in Berau accordingly stated that
there were many ongoing conflicts over land in the Berau District despite the fact that all active HA
concessions were certified by the time of interview conduction.
This was also supported by the second monitoring report of the Independent Monitoring published in
2018, where the majority of the 17 monitored natural forest and timber concessions that had obtained
PHPL certifications, showed non-compliance with verifiers related to the clarity over land tenure with
communities (indicator 1.1: Tenurial clarity and security of the forests, and here specifically verifier
1.1.3: stakeholders’ recognition of IUPHHK in forest area (BATB)). Frequent shortcomings were also
found in the ‘dominant verifier’ 4.1.2: Mechanism for participatory boundary delineation/reconstruction
and boundary conflict resolution is available.
Maryudi et al. (2017) showed from their reviewed audit protocols that a high proportion of concessions
scored the best grades on the ‘pre-condition indicator’ 1.1 and ‘social indicators’ 4.1 and 4.3. However,
they were “cautious in drawing a conclusion on the PHPL’s audit results” (p. 173) against the
background of the high occurrence of overlapping land uses in Indonesia. They argued that those results
were likely explained by the audit procedure that was solely based on the availability of licenses and
documents (Maryudi et al., 2017). Maryudi et al. (2017)’s analysis, moreover, revealed that auditors
used EIA documents and environmental management plans to verify FPIC (indicator 1.5).
5.3.7.3 Outputs related to labor rights and equitable benefit resolution
Through other criteria and indicators, the FLEGT-VPA strengthened procedures related to the health
and safety of forest workers. Relevant indicators under the SVLK criterion 5: Compliance with labor
laws and regulations, of the legality standard in production forests are:
- Availability of occupational safety and health procedures and their implementation
- 5.1.2 Freedom of association for workers
- 5.1.3 Existence of collective labor agreements
- 5.1.4 Company does not employ minors/underage workers
Indicators 5.1.2 and 5.1.3 refer, however, to company policies and policy documents rather than their
implementation.
The PHPL system in production forests stipulates wider standards in relation to the equitable sharing of
benefits of forest management, conflict resolution mechanisms and labor rights that are thus indirectly
strengthened through the VPA implementation, they include:
- 4.2 Corporate social responsibility programs
- 4.3 Mechanisms and implementation of fair and equitable benefit distribution
- 4.4 Reliable conflict resolution mechanisms and their implementation
- 4.5 Labour rights, their protection and the improvement of workers’ prosperity
5.3.7.4 Outputs related to village forest management rights
As part of the VPA process in Indonesia, the MFP supported activities related to village forest
management rights on the subnational level, among them the process of obtaining social forestry licenses
through public awareness campaigns on the community level and the issuance of social forestry permits.
In total, during MFP phase 3, social forestry permits covering a total area of 328,145.19 ha have been
issued by the MoEF in Indonesia (MFP, 2017). There was no information available on the location of
these permits in analysed documents.
79 See chapter 3.5 on issue of dominant and co-dominant verifiers in PHPL scheme.

Chapter 5: Results
100
5.4 Forest loss on the concession level in Berau
This chapter provides the results of the analysis of remote sensing data on forest loss to answer research
question 2.1 ‘Do national forest certification schemes under a FLEGT-VPA contribute towards a
reduction in forest loss on the concession level?’
First, forest loss results for the entire forest concession area spanned by the 18 concessions under
investigation, hereafter referred to as the ‘HA-area under investigation’, for the time 2001 to 2016 are
presented. This is followed by the forest loss results of the single concessions. Subsequently, forest loss
between 2001 to 2016 is related to the certification status of the concessions under investigation.
Overview of concessions
Of the 21 concessions in Berau, 18 concessions were integrated into the analysis. The remaining three
were sorted out because they were inactive or lacked information on their certification history by the
time of data collection.
Most of the concessions obtained their concession permit in 2001 or earlier. Only four concessions
obtained their permit later than 2001. Those four concessions consequently showed a different baseline
year. Table 23 outlines basic information about each of these 18 concessions. The ‘concession size’
correspond to those outlined in the current concession permit decree given in the spatial data set. Because
not the entire concession necessarily lied within the Berau District but stretched over more than one
district, the actual concession size within the Berau District differed from the size outlined in the permit
decree in respective cases. The concessions’ forest cover within Berau boundaries was calculated based
on the forest cover base map of 2000 and ranked between 6,730 ha and 129,199 ha for a single
concession. Total forest cover in 2000 within the HA-area under investigation was 723,205 ha.
Table 23: Basic information of incorporated concessions in Berau District. Baseline = 2001 for all concessions
that obtained their permit before 2001, or year of concession permit issuance; concession size as of
permit decree; forest cover within concession boundaries in Berau calculated based on forest cover
base map of 2000; LK = timber legality certificate; PHPL = PHPL certificate.
Concession
no
Permit
date
Concession size
[ha]
Forest cover
[ha]
PHPL
issued
LK
issued
Base-
line
1 1999 42,700 37,845 2017 2013 2001
2 1999 43,680 45,647 2015 2001
3 2000 35,886/30,170 24,340 2016 2001
4 1997 79,899/74,980 6,730 2010 2001
5 2006 138,210 129,199 2010 2006
6 1993 70,700 64,801 2011 2001
7 1993 10,6020 67,787 2013 2001
8 1993 55,604 23,465 2013 2001
9 1999 49,123 46,733 2014 2001
10 1988 66,554/50,400 8,571 2013 2001
11 1999 46,080 53,537 2013 2001
12 2008 25,630 22,120 2013 2011 2008
13 2009 55,150 24,468 2016 2011 2009
14 1999 85,725 11,927 2013 2001
15 1990 63,550 64,513 2013 2013 2001
16 2005 49,250 39,718 2014 2005
17 1999 44,402 42,768 2017 2013 2001
18 2001 14,800 9,036 2015 2001
Total 723,205

Chapter 5: Results
101
5.4.1 Forest loss in the entire natural forest concession (HA) area
In total 43,558 ha of forest – representing 22% of Berau’s total forest loss – were lost within the
concession boundaries from 2001 to 2016 in the Berau District when considering all 21 concessions, no
matter if concessions were inactive or not. Figure 36 shows this forest loss within the concession
boundaries in Berau.
Figure 36: Forest loss in natural forest concession boundaries (HA) from 2001 to 2016 in Berau.
The area covered by the 18 concessions included in this analysis, see Table 23, showed a forest loss of
42,402 ha in the same period.
When taking into account that four concessions obtained their permits after 2001, total forest loss
resulted in 39,160 ha, see Table 24, that represent 20% of Berau’s total forest loss from 2001 to 2016.
This corresponds to 5.42% of the 2000 forest cover of the entire HA-area under investigation. This
calculation only included the total annual forest loss in those concessions that already had a permit in
the given year.
Table 24: Total forest loss within the concession area within Berau between 2001 and 2016. Regarding
only those losses that occurred under a concession permit. I expressed as a percentage of the 2000
forest cover of the area covered by the 18 concessions within the Berau district.
Type of loss Forest cover 2000 [ha] Total loss [ha] Total loss [%I]
Total 723,205 39,160 5.42
Of which
Large-scale / 22,600 3.13
Small-scale / 16,560 2.29
On average 2,448 ha were annually lost in the HA-area under investigation when regarding only those
losses between 2001 and 2016 under a valid concession permit in each given year, see Table 25. Annual
losses ranged between 370 and 6,408 ha/year.

Chapter 5: Results
102
Table 25: Averages of annual forest loss of the concession area within Berau from 2001 to 2016. Regarding
only those losses that occured under a concession permit. I expressed as a percentage of total forest
cover in 2000 of the area covered by the 18 concessions within the Berau district.
Type of loss Mean annual forest
loss & range [ha]
Mean annual forest
loss & range [%I]
Median annual
forest loss [ha]
Median annual
forest loss [%I]
Total 2,448 (370-6,408) 0.34 (0.05-0.89) 2,039 0.29
Of wich
Large-scale 1,413 (26-4,356) 0.2 (0-0.6) 1,218 0.17
Small-scale 1,034 (321-2,886) 0.14 (0.04-0.4) 741 0.1
Table 31 in Annex III, shows the forest loss in each of those 18 concessions expressed in hectare and as
a percentage of a concessions’ 2000 forest cover within Berau boundaries from their baseline year until
201680.
5.4.1.1 Separating small- from large-scale forest loss
In the analysis, small-scale forest loss (defined as loss ≤ 3.6 ha) was differentiated from large-scale loss
(defined as ≥ 3.7 ha). The former was associated with harvesting activities like skid trails and felling
gaps, and logging roads, the latter with forest conversion to other land uses.
Figure 37 and Figure 38 show the distribution of the small- and large-scale forest loss within the HA
boundaries in Berau (21 concessions). Of the 43,558 ha that were in total lost in the 21 HA concessions
in Berau, 18,072 ha were identified as small-scale loss and 25,486 ha as large-scale forest loss,
respectively.
Figure 37: Small-scale forest loss in natural forest concession boundaries (HA) from 2001 to 2016 in Berau.
Small- and large-scale forest loss within the HA area covered by the 18 in the analysis integrated
concessions – the HA area under investigation – resulted in 16,560 ha and 22,600 ha, respectively, see
Table 24. These represent 2.29% and 3.13% of the total forest cover of the HA-area in 2000 that were
lost between 2001 and 2016, respectively.
On average in the HA-area under investigation, 0.14% forest was lost annually due to forest management
activities (small-scale forest loss) and 0.2% due to forest conversion (large-scale forest loss), see Table
25.
80 See also chapter 5.4.2.

Chapter 5: Results
103
Figure 38: Large-scale forest loss in natural forest concession boundaries (HA) from 2001 to 2016 in
Berau.
5.4.2 Forest loss in single HA concessions
This chapter presents the forest loss dynamics from 2001 (or their baseline year) to 2016 of the single
HA concessions, independent of their certification status.
The single forest loss values for each of the 18 concessions are presented in Table 31 in Annex III.
Highest total forest loss between the baseline year and 2016 was 23,749 ha (within 11 years). The lowest
total forest loss observed was 84 ha (within 16 years).
It has to be noted that the total forest loss-values of the single concessions in refer to unique concession
sizes. The calculation periods might have, moreover, varied depending on the baseline year. The last
column indicates this, that is, how many years entered the analysis (baseline year to 2016). More
informative is, therefore, the percentage that was lost annually of a concessions’ 2000 forest cover.
On average a concession within the Berau District boundaries lost 0.22% per year, ranging
from 0 to 3.49%, of its 2000 forest cover between its baseline year and 2016.
Figure 39 shows the distribution of annual forest losses of the 18 concessions [expressed as a percentage
of a concessions’ 2000 forest cover] from 2001 to 2016. Annual forest losses tended to increase.
Figure 40 shows the individual forest losses per year and concession expressed as a percentage of the
concessions’ 2000 forest cover from 2001 and 2016 also indicating when each concession obtained its
certification(s).

Chapter 5: Results
104
Figure 39: Distribution of annual forest loss expressed as a percentage of a concessions’ 2000 forest cover
of the 18 concessions under investigation.
5.4.2.1 Separating small- from large-scale forest loss
Table 32 and Table 33 show the results of the 18 concessions when separating forest loss into small-
and large-scale losses.
On average a concession within the Berau District boundaries lost yearly 0.13%, ranging
from 0 to 0.72%, forest associated with forest management activities of its 2000 forest cover (small-
scale losses) and 0.09%, ranging from 0 to 2.9%, associated with forest conversion (large-scale losses)
between its baseline year and 2016.
Figure 41 shows the range of yearly losses of the 18 concessions associated with small- and large-scale
loss [expressed a percentage of a concessions’ 2000 forest cover]. Annual small-scale loss (associated
with forest management activities) was generally higher than annual large-scale forest loss (associated
with forest conversion). From 2011 to 2016 large-scale losses in individual concessions were highest.

Chapter 5: Results
105
Fig
ure
40
:
An
nu
al f
ore
st l
oss
ex
pre
ssed
as
a p
erce
nta
ge
of
a co
nce
ssio
ns’
20
00
fo
rest
co
ver
fro
m 2
00
1 a
nd
20
16
of
the
18
con
cess
ion
s u
nd
er i
nv
esti
gat
ion
. B
lue
inte
rcep
t =
yea
r of
leg
alit
y c
erti
fica
tio
n;
red i
nte
rcep
t =
yea
r o
f P
HP
L c
erti
fica
tio
n;
y-s
cale
s v
ary
; co
nce
ssio
n n
o.
5,
12
, 1
3 a
nd 1
6 o
bta
ined
th
eir
per
mis
sio
n
afte
r 2
00
1,
ann
ual
fo
rest
lo
ss i
n t
ho
se y
ears
was
no
t ca
lcu
late
d.

Chapter 5: Results
106
Fig
ure
41
:
An
nu
al s
mal
l- a
nd l
arg
e-sc
ale
fore
st l
oss
ex
pre
ssed
as
a p
erce
nta
ge
of
a co
nce
ssio
ns’
20
00
fo
rest
cov
er o
f th
e 18
con
cess
ion
s u
nd
er i
nv
esti
gat
ion
.

Chapter 5: Results
107
5.4.3 Forest management certifications in Berau
To see the effects of the legality and PHPL certification schemes on a reduction in forest loss, forest loss
from 2001 to 2016 within the HA-area in Berau was analysed in consideration of the certification states
of single concessions.
Figure 42: Natural forest concessions and their certification status as of 2016 in Berau. Concessions had
obtained only PHPL or legality (LK) certifications or had first obtained a LK and later a PHPL
certification (LK & PHPL); inactive = inactive concession or unknown certification status.
Most of the 18 concessions obtained their first certification in 2013 or later, see column four and five in
Table 23. In 2016, 13 concessions were PHPL certified while five concessions hold a legality certificate.
Eight of the 18 concessions first obtained a legality before they obtained a PHPL certificate. The
concession 15 obtained both certifications in 2013. The time after 2013, was consequently regarded as
a ‘PHPL period’. Figure 42 shows the certification status as of 2016 of the single concessions.
Figure 43: Number of concessions for each certification status between 2000 and 2016. Non = without
forest certification; LK = with legality certification; PHPL = with PHPL certification.

Chapter 5: Results
108
Figure 43 shows the number of concessions that hold PHPL and legality certificates in each year and
those that had not obtained any certification and were consequently classified into the ‘reference period’.
As a consequence, the respective sizes of the total HA-area of the certification and reference periods
varied each year depending on the concessions that “newly” entered the certification period, that
“dropped” out of the reference period or changed from the ‘legality’ to the ‘PHPL status’.
In total, during the reference period (those years and concessions without a certification), 12,814 ha
were lost. During the legality and PHPL certification period in total 1,051 ha and 25,296 ha were lost,
see Table 26. It has to be noted that these hectare values cannot be compared between the different
certification states because of their different number of observations.
Table 26: Total forest loss of the reference (period without certification), legality (LK) and PHPL certification
period between 2001 and 2016. Regarding only those losses that occurred under a concession permit.
Type of loss Certification status Total loss [ha] N observations
Total
Reference 12,814 189
LK 1,051 20
PHPL 25,296 55
Of wich
Large-scale
Reference 5,566 189
LK 174 20
PHPL 16,860 55
Small-scale
Reference 7,247 189
LK 877 20
PHPL 8,436 55
5.4.4 Forest loss by certification status
Table 34 and Table 35 in Annex III summarize the total and average annual forest loss of all 18
concessions by certification state. Annual forest loss values expressed as a percentage of a concessions’
forest cover of 2000 can be compared between the different certification states of a single concession
and among the 18 concessions.
Table 27: Averages of annual forest loss of a concession by certification status between 2001 and 2016 in
Berau. Non = period without certification (reference period); LK = legality certification period;
PHPL = PHPL certification period. Regarding only those losses that occurred under a concession
permit.
Certification status Mean annual forest loss and
range [%]
Median annual forest loss
[%]
N
observations
Non 0.14 (0-1.25) 0.07 189
LK 0.17 (0-0.36) 0.16 20
PHPL 0.52 (0-3.49) 0.34 55
On average a concession lost 0.14% of its 2000 forest cover during the reference period annually. This
corresponds to a median of 0.07%, see Table 27. Annual forest loss values of the concessions ranged
from 0 to 1.25% of its 2000 forest cover.
In the legality and PHPL periods, annual forest loss of a concession was on average 0.17%
(median = 0.16%), ranging from 0 to 0.36%, and 0.52% (median = 0.34%), ranging from 0 to 3.49, of
its 2000 forest cover, respectively. Figure 44 shows the distribution of annual forest losses among the
non-certified and certified concessions expressed as a percentage of its 2000 forest cover.

Chapter 5: Results
109
Figure 44: Annual forest loss expressed as percentage of a concessions’ 2000 forest cover by certification
status from 2001 to 2016 of the 18 concessions under investigation; non = without certification
LK = with legality certification; PHPL = with PHPL certification.
Average annual forest loss appeared to be highest during the PHPL period and slightly higher in the
legality certification than during the reference period. Yearly losses, moreover, varied more during the
PHPL period than during those of the reference and legality certification period. Figure 40, that presents
the individual forest losses per year and concession expressed as a percentage of the concessions’ 2000
forest cover from 2001 and 2016, reveals that about half of the concessions showed an increasing forest
loss trend during the last years under investigation which roughly coincided with the date of certification
obtainment.
Figure 45 shows the range of forest losses of all concessions in each year between 2001 and 2016 by
certification status. For example, the red boxplot in 2002 shows the distribution of the forest loss in the
year 2002 of all concessions that had not obtained any certification by that time. As can be seen, annual
forest loss among the concessions varied markedly from 2010 coinciding with the certification periods.
Concessions without a certification, moreover, showed a relatively stable forest loss distribution from
2010 onwards while annual forest loss appears to be higher in the legality and PHPL periods. No
causality between the forest losses and certification states are made.
Figure 46 illustrates the difference in the annual forest loss of each single concession from their
certification period(s) to their reference period, that is, it shows how much smaller or larger the annual
forest loss in the certification period was in comparison to the reference period.
Of the seven concessions that had obtained a legality certificate at some point, five concessions showed
a higher mean annual forest loss in the certification period than in the reference period. Of the 13 PHPL
certified concessions, 10 concessions showed a higher, partly very pronounced, mean annual forest loss
in the certification period.

Chapter 5: Results
110
Figure 45: Distribution of annual forest loss expressed as a percentage of a concessions’ 2000 forest cover
among the 18 concessions by certification status. Non = without certification; LK = with legality
certification; PHPL = with PHPL certification.
Figure 46: Difference in the mean annual forest loss (expressed as a percentage of a concessions’ 2000 forest
cover) between the certification period(s) and the reference period of the 18 concessions under
investigation; LK = with legality certification; PHPL = with PHPL certification.
5.4.4.1 Small- and large-scale forest loss by certification status
To take into account that the certification schemes under investigation would rather contribute towards
a reduction in forest loss associated with forest management activities (small-scale loss) than with losses
associated with forest conversion (large-scale loss), in the following, results of the separation into small-
and large-scale forest loss are presented.
In total, in the reference period, 7,247 ha associated with small-scale forest activities and
5,566 ha associated with large-scale activities were lost (Table 26). Within the legality certification

Chapter 5: Results
111
period, in total 877 ha classified as small-scale and 174 ha classified as large-scale forest loss were lost.
In the PHPL period, in total 8,436 ha small-scale and 16,860 ha large-scale forest loss occurred.
Table 28: Averages of annual small- and large-scale forest loss of a concession by certification status between
2001 and 2016 in Berau. Non = period without certification (reference period); LK = legality
certification period; PHPL = PHPL certification period.
Type of forest
loss
Certification
status
Mean annual forest loss
and range [%]
Median annual
forest loss [%] N observations
Large-scale
Non 0.035 (0-1.11) 0.0008 189
LK 0.034 (0-0.21) 0.0061 20
PHPL 0.28 (0-2.9) 0.026 55
Small-scale
Non 0.1 (0-0.56) 0.06 189
LK 0.14 (0-0.31) 0.12 20
PHPL 0.24 (0-0.72) 0.23 55
On average a concession lost annually 0.1% (median = 0.06%) of its 2000 forest cover due to forest
management activities, ranging from 0 to 0.56% in the single concessions (Table 28), and 0.035%
(median = 0.0008%) due to forest conversion, ranging from 0 to 1.11%, in the reference period
(Figure 47). In the legality certification period, this was 0.14% (median = 0.12%) and 0.034%
(median = 0.0061 %), respectively. In the PHPL certification period, a concession lost annually 0.24 %
(median = 0.23%) of its 2000-forest cover defined as small-scale forest and 0.28% (median = 0.026%)
defined as large-scale loss. Based on the median, annual small-scale losses in a concession were, thus,
greater than annual large-scale losses.
Relating the losses to the certification status (Figure 47) reveals that annual small- and large-scale losses
in a concession tended to be both largest during the PHPL certification period.
Figure 47: Annual forest loss expressed as a percentage of a concessions’ 2000 forest cover of the 18
concessions under investigation by certification status from 2001 to 2016; non = without
certification LK = with legality certification; PHPL = with PHPL certification.
Figure 48 shows this annual small- and large-scale forest loss of all 18 concessions for each year between
2001 and 2016 by certification status. Again, annual small-scale forest losses during the certification
periods tended to be higher than those of the reference period. Annual small-scale forest loss in the
PHPL certification period showed a larger range of annual losses than both other periods.

Chapter 5: Results
112
The distribution of annual large-scale forest losses reveals that these annual losses were also lower in
the reference period than in the certification periods. Annual large-scale loss was clearly highest in the
PHPL certification period.
Small- and large-scale forest losses of each concession are summarized in Figure 49 and Table 36 to
Table 39 in Anne III. For a comparison between the different certification states of a single concession
and among the 18 concessions, the annual forest loss values expressed as a percentage of a concessions’
2000 forest cover are to be used. Not all concessions showed large-scale forest loss.
Of the seven concessions that obtained a legality certificate, five concessions showed a higher mean
annual small-scale forest loss in the certification period than in the reference period (Figure 49).
Of the 13 concessions with PHPL certificates, 10 concessions showed a higher mean annual small-scale
forest loss in the certification than in the reference period.
Of the seven concessions that obtained a legality certificate, five concessions showed a higher large-
scale forest loss than in the reference period.
Of the 13 concessions that had a PHPL certificate, 11 concessions showed, although partly only very
slightly, a higher mean annual large-scale forest loss than in the reference period.

Chapter 5: Results
113
Fig
ure
48
:
Dis
trib
uti
on
of
smal
l- a
nd
lar
ge-
scal
e an
nu
al f
ore
st l
oss
ex
pre
ssed
as
a p
erce
nta
ge
of
a co
nce
ssio
ns’
20
00
fo
rest
co
ver
of
the
18 c
on
cess
ion
s u
nd
er
inv
esti
gat
ion
by
cer
tifi
cati
on
sta
tus;
no
n =
wit
ho
ut
cert
ific
atio
n ;
LK
= w
ith
leg
alit
y c
erti
fica
tio
n;
PH
PL
= w
ith
PH
PL
cert
ific
atio
n.
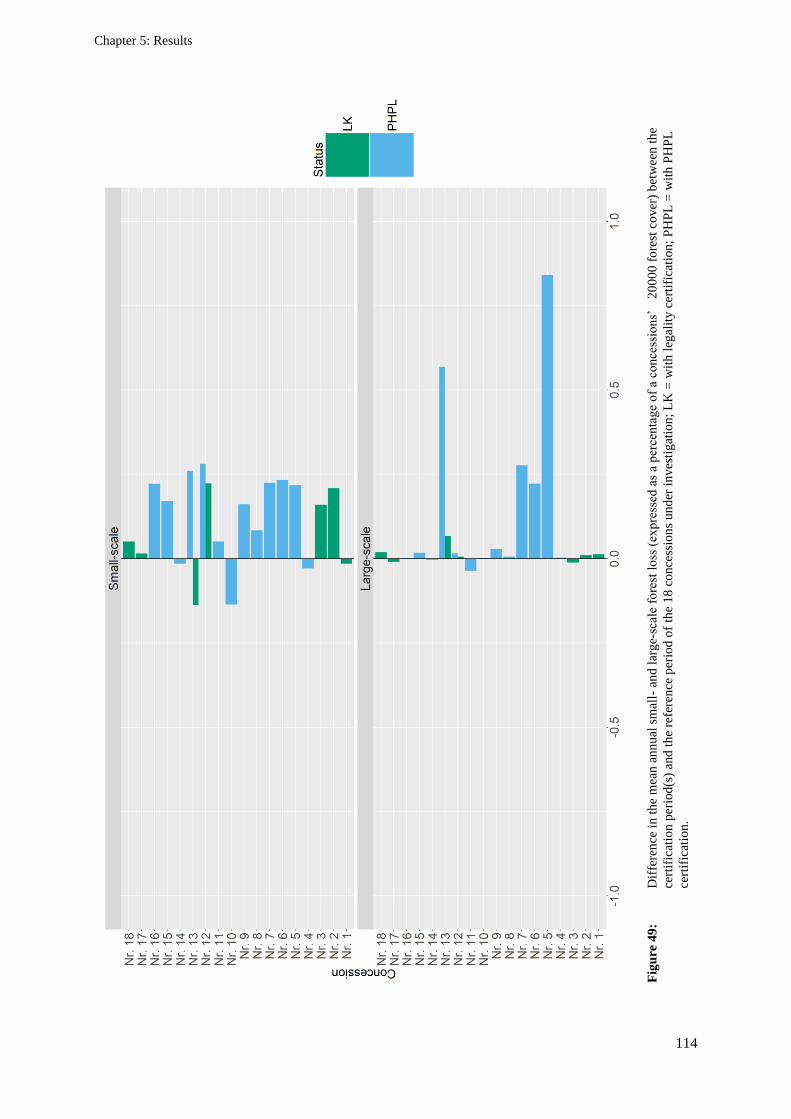
Chapter 5: Results
114
Fig
ure
49
:
Dif
fere
nce
in
th
e m
ean
an
nu
al s
mal
l- a
nd
lar
ge-
scal
e fo
rest
lo
ss (
exp
ress
ed a
s a
per
cen
tag
e o
f a
con
cess
ion
s’ 2
00
00
fo
rest
co
ver
) b
etw
een
th
e
cert
ific
atio
n p
eri
od
(s)
and
th
e re
fere
nce
per
iod o
f th
e 1
8 c
once
ssio
ns
un
der
in
ves
tig
atio
n;
LK
= w
ith
leg
alit
y c
erti
fica
tion
; P
HP
L =
wit
h P
HP
L
cert
ific
atio
n.

Chapter 5: Results
115
5.5 Driving forces of and hindrances to the subnational REDD+ process
In the following driving forces of and hindrances to the subnational REDD+ process in East Kalimantan
and the Berau District are presented to answer research question ‘What are the current driving forces of
and hindrances to the subnational REDD+ implementation?’.
Each of the identified factor was related to the ’institutional setting’ or the ‘REDD+ policy arena’81.
Findings are summarized in Table 29 using a modified framework of Korhonen-Kurki et al. (2014).
Many of the identified driving forces and hindrances were interlinked. By choosing the presented
structure, the speciality of each aspect could be highlighted.
In a first step the hindrances, meaning factors or conditions that hampered the subnational REDD+
process in the focus area, are outlined. Subsequently, those factors that drove the REDD+ process,
meaning factors or conditions that enabled and fostered the process, are presented.
5.5.1 Hindrances to the subnational REDD+ process
5.5.1.1 Hindrances related to the institutional setting
Three main hindrances that relate to the institutional setting in which the REDD+ process in the focus
area was placed were identified through the content analysis of REDD+ interview transcripts and key
documents. These were: ‘national contradicting policies and strategies’, a ‘lack of a land use assessment’
and a ‘lack of capacity’. The first two factors specifically originated on the national level. The following
describes the factors in more detail.
National contradicting policies and strategies
One of the challenges to achieving REDD+ objectives were the competing national land use strategies
that support and foster the exploitation of East Kalimantan’s natural resources. An example is the
economic development strategy that is laid down in the “Masterplan for Acceleration and Expansion of
Indonesia Economic Development” (MP3EI) (Coordinating Ministry for Economic Affairs, Republic
of Indonesia [RoI], 2011). Following this masterplan, Indonesia’s development is concentrated on six
‘economic corridors’. One of those is Kalimantan. The Kalimantan economic corridor is based on
industries such as steel, bauxite, palm oil, coal, oil and gas, and timber. East Kalimantan plays an
important role within this economic corridor as it harbours one of the highest coal reserves in Indonesia.
To foster the development of these land-based industries, the national government plans the creation of
appropriate incentives. An example are declarations to reduce spatial conflicts between coal mining and
forestry.
Plans like this run contrary to those national policies and strategies that support a sustainable and low-
emission development.
Lack of a land use assessment
A lack of clear information on land use rights was another aspect that hampered the achievement of
REDD+ objectives in the focus area. The analysis of interview transcripts and key documents revealed
that weak tenure, specifically the uncertainty over forest boundaries, contradicting cadastral maps and
overlapping land claims, were aspects that drove deforestation in the focus area. In the Berau District,
there consequently prevailed unresolved conflicts between formal and customary law and many
overlapping industrial land use permits existed.
Another related problem was that regulations that stipulate who could theoretically take part under
REDD+ (e.g. MoF Regulation No. P.36/Menhut-II/2009 or MoF Regulation No. P.36/Menhut-II/2009)
could hardly be implemented due to a missing clarity over land and carbon rights.
81 See chapter 4.5.1.3 for definitions.

Chapter 5: Results
116
Lack of capacity
The analysis, moreover, revealed that there existed capacity gaps related to financial, human and time
resources that hampered the effective implementation of national and subnational REDD+ policies in
the focus area. Although East Kalimantan can be regarded as relatively well equipped, capacity
constraints could still be observed on the provincial governmental, district, village and field level as
described in the following.
Funding
The underfinancing of the forestry sector was one recurring aspect during the interviews and respondents
uniformly complained about the limited available budget. For example, available state funding was
perceived as so low by respondents that FMUs were hardly able to work in the field.
The REDD+ process has also suffered from limited state budget. In the focus area most of the available
funding for REDD+ related issues came from international donors. They took over the role of filling
financial gaps that the government was not able to fill. Limited financial support to REDD+ from the
state budget was mainly explained by the absence of climate change issues in regional development
plans that provide the legal basis for funding. Other explanations were the limited support from the
parliament and from other sectors, and different economic priorities of those.
A REDD+ output that represented this challenge was the district REDD+ working group that suffered
from the absence of funding for two years by the time of interview conduction in 2017. Formally, it
should have been funded by the state.
Despite the financial gaps, respondents also pointed to a poor allocation of financial resources and saw
the distribution and allocation of money and corruption as a closely related problem.
Human resources
A lack of human resources for local governmental officers, FMU staff, and staff to operate SIS REDD+,
together with poor human capacities in the newly established REDD+ institutions, for example,
expressed through a limited ability among REDD+ stakeholders to negotiate with the local government,
were other restrictions mentioned on the working level in East Kalimantan and there especially in the
Berau District.
A national leader of an international organization explained that situation as follows:
“[…] we [the organization] have been working now for 15 years in the Ministry, so
basically training or some sort of support has been now such a density, that we would say
the capacities on the management level in the Ministry [on the national level] are quite
good, they are professional. The problem is then, you go on the working level, that again
there are so many people, levels below that have not received any training, or basically
educational levels are so low that implementing or delegating it’s an issue. […] “I think
the donor should realize that Jakarta is not Indonesia, and that these capacities and
management or coordination capacities of the governance on province or district level,
this is maybe 5 or 10 years behind. So, what you see here is Jakarta and Jakarta is a bubble.
If you go down on province level and if you go down even on district level, these are
different worlds and you cannot expect the same, let’s say, education, the same priorities,
the same brilliance like a decision-maker in Jakarta from a person on the district level.”
His view was supported by findings on the village level in Berau.
Among the practical challenges on the working level in Berau raised by respondents entrusted with the
implementation of REDD+ activities were cultural differences between NGO and community members
and their different languages. Mainstreaming the idea of REDD+ was, moreover, perceived as a
difficulty despite the fact that this was a prerequisite for establishing a local commitment among
villagers. In this context, especially the deeply rooted livelihoods and life strategies, many of them
unsustainable, constituted a barrier to overcome.

Chapter 5: Results
117
Interviews also revealed that the REDD+ process on the local level in a certain jurisdiction was often
driven by one single person, so called “local champion”, that was influential in that area at a given time.
While this could result in important progress, respondents highlighted the risk of the absence of a
‘network of influential people’, especially when this one local champion would leave at a given point
and with him/her the whole progress of the last years.
Time resources
“Time” was a perennial problem mentioned among local and international organizations, especially in
relation to the (short) project durations, as for example expressed by the following statement of an officer
of an government-government organization that works on all three administrative levels:
“[…] So, you have 1.5 years of let's say deadlock, if you’re a normal project of 2-3 years,
what to do? What to do? I mean, we have the advantage, and I mean, that is also maybe
for your BMEL recommendations: forget this short-term project! It does not work!”
5.5.1.2 Hindrances related to policy arena
Several hindrances related to the policy arena in which REDD+ developed were identified for the focus
area. All of those were somehow related and influenced by each other. Figure 50 summarizes the
identified factors and their interplay.
Figure 50: Interplay of identified hindrances related to the policy arena of the subnational REDD+ process
in the focus area
The central issue for the limited success in achieving the envisaged emission reduction targets in both
East Kalimantan and Berau were the limited governmental ownership and support in the REDD+
readiness process. This was especially apparent on the district level in Berau. A number of factors were
identified that could explain this limited governmental support, among those the ‘limited understanding
of climate change related issues among governmental members’ and the little autonomy from sectors
that drive deforestation.
The little ownership and support in the REDD+ process in turn could explain the absence of important
government tasks in relation to the REDD+ readiness process, among those the little guidance,
coordination and monitoring. It could also explain the missing integration of REDD+ related strategies
into regional development plans and its missing institutionalization to decision-makers until 2016. These
aspects ultimately influence decisions over issues of land use planning and budget allocation, aspects
that were not dealt with in favour of REDD+. A related risk of the missing integration and
institutionalization was the dependence of the REDD+ readiness process on single political leaders and
“local champions” that – once they resigned – jeopardized the long-term sustainability of the REDD+
process.
The single factors are in more detailed explained in the following.

Chapter 5: Results
118
Lack of governmental ownership and support
It was a common perception among interviewees that the limited progress of the BFCP on the district
level was a result of the little governmental support. While the main ownership on REDD+ in the focus
area, especially in Berau, lied among CSOs, the ownership from governmental actors and institutions
was perceived “as just too little” to implement the strategic plan of the REDD+ program in Berau
successfully. As a consequence, programs and activities officially supporting the BFCP were carried out
individually following the objectives and interests of the individual organization rather than working
towards a common BFCP strategy.
Although, governmental officials were initially represented in all newly established REDD+ institutions,
respondents repeatedly mentioned that the political level had not sufficiently been involved in the BFCP
process. This was also expressed by the following statement of a member of the provincial REDD+
working group:
“I mean the sense of belonging of the local government related to the strategic plan [the
BFCP strategic plan] seems too weak. I mean, we feel that it is just for tasks of the working
group or of that of the TNC. But it's not part of the product of the local government. That's
why the support of the local government was, according to our opinion, very weak, or too
limited in order to be able to implement whatever is mentioned in the strategic plans
successfully.”
Stakeholders in this context reported that among the government and CSOs, the BFCP was frequently
referred to as a “TNC-thing” – something that was also observed during the interviews. Respondents,
for example, said, “this is TNC’s program”. And in fact, study observations indicated that much of the
information surrounding the BFCP lied among a few bigger organisations, especially TNC. There, it
was concentrated among a few key persons that were highly important to drive the REDD+ process
while respondents of other international organizations stated that they have never even read the BFCP
strategy.
On the provincial level, especially the missing involvement of the parliament that hold decision making
authority over financial matters, was mentioned a key obstacle to the REDD+ readiness process. The
little ownership and support from the government on REDD+ in the focus area, was, therefore, also
expressed by the available budget. In both East Kalimantan and Berau, budget was mainly from
international donors but not from the state.
In the following, factors that can explain this little governmental ownership on REDD+ are outlined. In
a next step, the consequences of this limited governmental support are closer described.
Lack of autonomy from sectors that drive forest loss and different interests
Many interviewees stated that land use permit issuance in favour of land use sectors such as the timber
and oil palm plantation business, constituted a major threat to forests and, therefore, to the achievements
of REDD+’s objectives.
It was for example widely perceived that political campaigns on the district level during periods of
election were financially supported from such land use businesses. This low level of autonomy of district
political leaders from the business sector was reflected by the following statement of a government
official:
“The main, the major threat in East Kalimantan are coming from the deforestation, this is
the biggest problem for us all […]. And this deforestation, this is in our observation, this
is related to politics. It's from the general election […]. The candidates for the head of the
district try to absorb […], try to involve the investor [business sector] into getting [to get]
the financial matters […]. In compensation, the investor will get some land use permits to
manage a certain area of the forest […] whether in mining or in many cases issue big
plantation, oil palm.”

Chapter 5: Results
119
The respondent referred to deals with oil and mining companies that were made to financially support
the election campaign of district candidates while the business in turn received land use permits.
The pursuit of other strategies such as the exploitation of East Kalimantan’s resources or the
infrastructure development, were enabled and driven through national strategies that conflicted with the
idea of REDD+.
Poor understanding among and communication with government and non-forestry sector
The limited understanding of REDD+ and climate change related issues among stakeholders from the
government and private sector both in the forestry and non-forestry sector was identified as another
challenge to implement REDD+.
Some interviewees on the provincial level perceived the lack of involvement of the parliament, that is
in charge of legislative and financial decision making, and their related limited understanding as one of
the major weaknesses of the subnational REDD+ process in the focus area as the following statement
shows:
“The weakness point is the understanding of so many stakeholders, especially who are
already involved in the decision making, for instance like the legislative. I mean the
parliament, the local parliament. I’d say most of the members of the parliament they don't
really know about the REDD+ and also [not] about the climate change issues. But actually,
they have the power in order to decide for instance the financial support.
The limited involvement of the parliament was among other things explained by the communication and
information flows that were rather built on personal relationships and networks by respondents. In
contrast, mainstreaming the idea of REDD+ and climate change to those actors that were not directly
involved in such aspects but hold decision making authority, was cited as a major problem:
“This [the lack of ownership of the government] is a kind of also, if I can say, our mistake
in the civil society […]. You try to avoid difficult people. So, you are working mainly with
somebody who are easy to approach, [you are] comfortable with. But maybe they are not
really influential, or maybe after several years they are going somewhere, and then you
find out: ok, maybe at the time, you feel like you have succeeded at doing everything or
achieved a lot. But it’s only him who is working on that. So, when he’s moving somewhere
else then you start from zero”
In Berau, internal discrepancies between governmental officers and key players of the BFCP were
mentioned as related challenges.
A lack of understanding about REDD+ and climate change among villagers was also very prominently
reported from those interviewees involved on the community level, and for the non-forestry sector.
Lack of legal basis and authority
A related problem of the limited involvement of the parliament, was the fact that the newly established
REDD+ institutions such as the DDPI on the provincial level, were established as ad-hoc bodies outside
the traditional government structures. Their responsibilities should later be taken over by the government
organizations. As an ad-hoc institution, they had only little legitimacy to act and decide, for example,
on budget or permit allocation issues.
Interviewees consequently raised concerns about the ability of the DDPI to coordinate other ministries
and to translate REDD+ related strategies into the different provincial services, for example, the forestry
service. They perceived that communication was rather built on personal relationships than on legal
authority between those institutions.
Similar concerns were raised by interviewees for the Berau REDD+ working group that was also
established as an ad-hoc institution. As such it had neither been provided with an authority to take
decisions nor to actually coordinate.

Chapter 5: Results
120
Lack of translating national policies to lower levels
A challenge to implement REDD+ related policies from the national level was also perceived to be the
poor mainstreaming of national policies to lower levels among interviewees and in key documents.
Respondents pointed towards a lack of guidance, technical support and capacity on the field level and
towards a lack of concrete concepts for actions to effectively implement REDD+ readiness elements.
One interviewee working for an international organization described the situation as follows:
“[…] we have a number of documents on action plan for REDD, but you see, there is a
problem between the document, there is still a gap between the document to the real-life
implementation. And that still take some time. For example, the director of DDPI is always
talking about how FMU will reduce emissions. Of course, theoretically, we can explain it
but how much and when? That’s the question.”
Interviewees further reported a lack of execution of decisions that had been made in REDD+ working
group meetings. The fact that government officials in East Kalimantan participated in such meetings did
not automatically mean that they would translate the decisions to their ministries.
The implementation gaps could also be explained by the vastness and heterogeneity of the country and
a lack of capacity among stakeholders as explained earlier.
Together with the poor understanding of, communication with and involvement of important
stakeholders from the government and the lack of autonomy from sectors that support BAU, the poor
translation and mainstreaming of national policies to the local level can explain the limited governmental
ownership and support in the REDD+ readiness process in the focus area. The limited governmental
supported in turn resulted in a number of gaps within the REDD+ readiness process. Those are described
in the following.
Lack of integration and institutionalization of REDD+
The lack of integration and institutionalization of REDD+ related activities into regional development
plans was a central aspect raised that hampered the development around REDD+ on the subnational
level. Such integration into regional plans provides the legal basis for budget allocation and is necessary
to secure the sustainability of strategies beyond the term of office of governors.
However, by the time of study conduction, the REDD+ process primarily depended on the willingness
of the governor or district head. The fear of a ‘changing commitment’ to REDD+ under a new
governor/district head was, therefore, a key risk expressed by interviewees.
It was already mentioned that the local REDD+ process in the focus area, especially in Berau, was
influenced by individual people or “local champion”. Without the institutionalization and integration of
REDD+ related issues into development plans, the resignation of such local champions was perceived a
risk that could jeopardizes the future process as was the frequent rotation of people working in political
and institutional leadership. This was explained by one member of an international organization working
on all levels:
[…] Like in Berau for example, there is one head of DINAS [forestry office] at the time, he
was very supportive, but right now he’s not there anymore. So, what can you do? You have
to start from zero. So, this is a problem with what they call the ‘local champion’. So, then
we find a local champion and we do a lot of things in the time but it’s only a local champion.
And after that, nothing happens.
Similar drawbacks have been described in relation to the rotation of FMU heads.
Findings also revealed that the BFCP strategic plan had not been institutionalized among decision
makers and had not been integrated into the Berau District Medium-Term Development Plan of 2011-
2015. Consequently, there existed a lack of state budget allocation for the implementation of the BFCP.

Chapter 5: Results
121
Coordination
“In fact, the main weakness is that we [in East Kalimantan] don’t have a systematic
approach of the whole, there is a lack of coordination, this is a very weakness in addition
to the lack of good governance.”
The issue of coordination was a key challenge identified by interviewees and from the document analysis
ranging from the coordination between single ministries over the coordination of organisations on the
field level to related strategy and action plans. The poor inter-ministerial coordination and
communication was, for example, expressed by a member of a government-governmental organisation:
“Today we discuss MRV and we have the Ministry of Forestry coming. We discuss from
the forestry perspective. The day after, there is a project of [the] World Bank coming with
the same idea, so we attend the meeting. And on Wednesday we have the BAPPENAS, the
National Planning Agency, talking about greenhouse gas emissions monitoring at the
larger level, we come again to the same meeting. But they never talk to each other […]”
In East Kalimantan and Berau, there was further a lack of coordination among the organisations formally
participating under the REDD+ program and a lack of alignment of their activities to the provincial
and/or district REDD+ strategies and ER targets observed.
By the time of study conduction, East Kalimantan harboured several funding programs (TFCA, MCIA,
FCPF) but there was no single umbrella institution or forum that would coordinate those different
programs, organizations and activities. Although this was by mandate the role of the DDPI, several
stakeholders confirmed that this task has not sufficiently been carried out. The same situation was found
on the district level where the local government, through the district REDD+ working group and the
steering committee, should have coordinated the REDD+ process. But instead, actors and donors came
to Berau with their own programs and concepts rather than with concrete plans of how to serve the
specific objectives of the provincial and district action plans. By the time of study conduction, there
were, for example, 28 NGOs, mostly local, working in nearly 70 villages in Berau. Most of them were
financed by TFCA and MCIA but there was no central institution taking over the responsibility of
coordinating the different NGOs. Apparently, TNC hesitated to take over this role of coordination and
saw the BFCP-responsibility with the government but the government, as well as other organizations
and funding schemes, did not feel responsible for it either and showed little ownership on the district
REDD+ process. The district REDD+ working group could also not take over this role, because of a
lack of authority to coordinate the NGOs and because of struggles with restricted funding. This situation
was summarized as follows:
“[…] the program of TFCA is something like running by themselves, there’s not really
connection with the idea on how to achieve efficiency and the goal of the BFCP, because
the Pokja [REDD+ working group in Berau] is very weak […]. In the beginning of Pokja,
they’re trying to bring what we called the Forum of NGOs or something […]. Twice a year
there is a meeting on how to coordinate and communicate with the programs […] but now,
until 2015, there’s not at all of the coordination meeting.”
This specific case of the BFCP demonstrates how the lack of oversight and coordination could easily
lead to questions of who is actually doing what.
Interviewees, moreover, raised their concern about the multitude of strategy and action plans that existed
in East Kalimantan in relation to climate change. Respondents pointed to the need of one provincial key
reference to which every district could refer in this context.
Monitoring
Discussions with staffs working for different organizations, revealed that there was no central
monitoring from the provincial or district government gathering all REDD+ activities and achievements.
All of the domestic and international organizations had their own monitoring schemes imposed by their

Chapter 5: Results
122
donors. This absence of period monitoring and evaluation resulted in a lack of information on REDD+
related activities, resources spend, achievements and their gaps on the program/project level.
5.5.2 Driving forces of subnational REDD+ process
A number of factors that enabled and drove the REDD+ process and its current achievements were
identified for the focus area. As for the hindrances, they could be either related to the institutional setting
or to the REDD+ policy arena.
Among the driving factors that characterized the institutional setting were East Kalimantan’s and
Berau’s geographical settings, their vast intact forest resources, the existing capacity and network of
civil society, academia and the private forestry sector, and the long history of conservation activities and
its related established trust in (non-)governmental organisations, see Figure 51. The factors categorized
to the REDD+ policy arena comprised the establishment and consultation of new coalitions and actors,
political commitment and the availability and prospect of new funding sources. There were, however,
important differences in the extent to which these factors were in effect between the provincial and
district level as highlighted under each of the next paragraphs.
Figure 51: Interplay of identified driving forces of the subnational REDD+ process in the focus
area; CS = civil society.
5.5.2.1 Driving forces related to institutional setting
Interviews and key documents suggested that the following factors and conditions favoured the REDD+
process in the focus area and formed an advantage over other districts.
Local setting of focus area: forest cover and deforestation drivers
Because of their remaining high forest cover, East Kalimantan and especially the Berau District provided
a high potential to conserve forest resources under a REDD+ program.
This high forest cover and the fact that Berau’s forests historically experienced exploitation mainly due
to selective logging, made the district a suitable jurisdiction to test REDD+ (Pokja REDD Berau, 2009b).
The drivers of forest destruction had only recently changed from selective logging towards the
conversion of logged over forests to oil palm and timber plantations. It was expected that these new
trends in forest conversion would threaten Berau’s forest resources dramatically in the future without
further interventions. The potential of emission conservation was consequently high.

Chapter 5: Results
123
Local setting of focus area: geographical & economical setting
East Kalimantan and especially the Berau District have a geographical and economic advantage over
other districts/regions. Berau’s location provides the districts with a relatively good accessibility by
plane, land and see. The access to the international market and the high number of active (exporting)
forest concessions consequently played an important role in piloting timber management activities under
the REDD+ program.
Economically, East Kalimantan and Berau are relatively well-equipped. Especially the development of
the coal mining industry has brought the province and the District Berau important development which
was expressed by the following statement:
“Berau is through coal industry and to the access to the market, much much more
developed, much much more advanced.... and professional... you have lots of oil palm there
coming in, mining and Malinau [another district] is just sleepy”
Already initiated conservation activities & established trust
In East Kalimantan and there especially in the Berau District, international and local organizations had
been present since the 90s. Local NGOs mostly focused on conversation and community development
aspects while bigger international organisations worked with forest businesses and on nationally
introduced instruments such as forest certification schemes. This interplay of local and international
organizations enabled a wide range of support to various stakeholder groups.
Trust in those organizations that had been working in the region for decades from the government and
civil society was an important advantage identified as the following statements from an officer working
for an international organisation shows:
“You need first of all the trust building time. For us, to be frank with you, we’re starting
now to get really really productive because they trust us. They know us, “yeah yeah [name
of organization] you’re here since long time”, I had discussions with DINAS Kehutanan
Provinci in West Kalimantan, they said, "we don’t want any other NGO. You do that! We
know you, that’s ok. [Others], they come and go, they have one workshop then they’re
gone, we have no idea what they’re doing. We don’t want them anymore.”
Some of the interviewees had constantly worked with the government since more than two decades.
Trust was also an important issue raised by stakeholders that worked with communities in Berau. They
uniformly stated that one of the most important aspects of the implementation of their REDD+ related
activities was to gain trust from the villagers. They all explained that their facilitators and staff had lived
within the communities and took part in their daily lives. Those organisations that already gained trust
and were now supporting the BFCP, therefore, had an advantage over new ones.
Existing network of CSO, academia & private sector
The REDD+ process in East Kalimantan was placed in a special setting that was shaped through the
Forestry Faculty in Samarinda and the broad network of stakeholders from civil society, academia,
international and domestic organizations, consultants and the private sector. This informal network was
highlighted as one major strength of the REDD+ process in East Kalimantan.
There were several key players that had been present in the province for decades and that had played a
critical role in facilitating the REDD+ process. Those key persons, many of them teaching at the
University in Samarinda, had extensive working experience in the area and had been involved in the
discursive process influencing the policy process for decades. They constantly maintained networks and
forwarded new ideas such as the establishment of the Master Plan on Climate Change that aimed to
integrate the various existing strategies and action plans on climate change issues and the establishment
of the REDD+ working group. They were, moreover, present in both, the provincial REDD+ working
group and the DDPI.

Chapter 5: Results
124
While the resignation of key persons or “champions” was frequently mentioned to be a risk on lower
levels that could jeopardize the whole REDD+ readiness process, following study observations, such a
capacity network facilitated the process substantially in East Kalimantan. In contrast, on the district
level, interviews showed that this ‘network of key players’ with good relations to the governmental level
was not as strong (compare also 5.5.1.1).
In East Kalimantan CSOs were frequently involved in and were pushing the REDD+ process and helped
the government to develop strategy and action plans (e.g. LCGS, SRAP, Master Plan etc.). International
organizations such as TNC or the GIZ have led the early REDD+ policy process with new ideas and
concepts.
Study observations, moreover, showed that the multi-level nature of those international organizations
allowed a frequent communication and information flow between their administrative levels.
Insights into the background of interviewees that were gained through the interviews, moreover,
revealed that there existed several overlaps in working experience, education and organizations that
could explain the good personal relationships and informal network that was observed on the subnational
level. The fact that interviewees on the provincial and district level commonly referred to other
stakeholders as “friends” underlined this particularity.
Despite this informal network that highly facilitated the communication, cooperation and progress on
the provincial level, there remained a lack of cooperation outside this network. Interviewees stated that
more complicated negotiations were often avoided. This involved the risk of not reaching other
influential people82.
Existing capacity & resources
Strongly related to this ‘informal network’, was the existence of experiences, know-how and financial
resources and capacity on which the REDD+ process in East Kalimantan could build. This basic
readiness could explain the relatively fast drafting of REDD+ elements (e.g. strategy and action plans)
and the presence of REDD+ pilot projects and donors (as e.g. the FCPF Carbon Fund ER project), as
the following statement of a member of an international organisation shows:
“We were looking for concrete areas where there is perceived emission reduction
potentials, where we had a good understanding of the situation on the ground based on our
previous engagement and Berau was basically lobbied as well from our colleagues from
[Name of organization], who had a big program there. “
Other officers of international organizations explained that there was a tendency of short-term projects
to come to Berau in the need to show results after only a few years.
The Forestry Faculty in Samarinda was observed to be key in building this capacity network already
mentioned earlier. Several of the staff members working for international and national organizations in
East Kalimantan, had been trained at this faculty and most of the policy documents released for East
Kalimantan had been highly facilitated by its members. Those members forwarded ideas and
recommendations thereby influencing the provincial REDD+ policy processes.
For decades, there had, moreover, existed PhD exchange programs and cooperation with European
universities. Many of the interviewed stakeholders and REDD+ key players on the subnational level in
the focus area had received their PhD oversees at universities in Germany or the Netherlands.
Interviewees consequently stated that it was not the technical know-how that restricted the REDD+
process on the provincial level but rather aspects such as the coordination among ministries and
institutions and the little political commitment and interest of certain stakeholders.
However, there was a clear decrease in capacity observed on the district level in Berau.
82 See also aspect on ‘poor understanding among and communication with government and non-forestry sector’ under 5.5.1.2.

Chapter 5: Results
125
5.5.2.2 Driving forces related to policy arena
New coalitions and actors
The analysis of interview transcripts and key policy documents showed that there existed
transformational coalitions in East Kalimantan that drove the policy discourse around REDD+. Closely
related to those were the introduction of new independent institutions like the provincial REDD+
working group and the DDPI early on in the REDD+ process in East Kalimantan. Both institutions
provided a space for a broad range of stakeholder groups to engage in policies away from BAU. A
central requirement for this was a certain access to the governmental level.
As such, the REDD+ working group in East Kalimantan involved several (non-)governmental
organizations, the private sector, the academia and community representatives.
The DDPI involved members from the government and academia, but interviewees confirmed that CSO
had always been involved in negotiations and were fully supportive towards the DDPI.
Placing the DDPI outside the traditional government structures followed the aim to coordinate the
planning and implementation of the low-carbon development in East Kalimantan as an umbrella
institution.
The provincial REDD+ working group and the DPPI have facilitated communication progress. With
their support, funding partnerships such as the recent FCPF Carbon Fund were made possible.
The BFCP also initially involved members from the government, academia, the private sector and civil
society. However, in contrast to the provincial level, the ability to influence decision-making on the
governmental level, of actors supporting a policy change away from BAU was too marginal.
Political commitment
Support towards a low carbon development from the provincial political leaders was raised as one of
the most important factors in the recent REDD+ process by interview respondents and in key documents.
Actions like East Kalimantan’s pledge to make the province a “green province”, the stipulation of
provincial emission reduction targets, the establishment of the provincial REDD+ working group and
the DDPI and the release of a provincial forest moratorium on the issuance of new land use licenses
demonstrated this commitment from the governor at that time. With such actions, the governor of East
Kalimantan followed REDD+ actions at the national level. Besides the governor, also other actors from
the government such as the head of the forestry service of East Kalimantan had been perceived as being
very supportive towards the REDD+ process in by the time of study conduction.
Despite this support from certain government members in East Kalimantan, the REDD+ process on the
provincial, and especially on the district level, was still largely driven by non-governmental actors. The
study author observed a situation where international organizations were main drivers of the REDD+
policy process83. The process, therefore, relied mainly on private relationships between and the ‘informal
network’ of actors.
On the district level, there was a clear imbalance of local ownership on the jurisdictional REDD+ project
of CSOs and the local government.
Availability of new funding and capacity
The presence of the many domestic and international organisations and funding schemes related to the
conservation of East Kalimantan’s natural resources and biodiversity for decades, attracted also new
REDD+ donors to East Kalimantan. The promise of those new funding deals in turn prompted important
progress within the REDD+ policy arena.
As the first result-based payment-deal, the promise of conditional payments under the FCPF Carbon
Fund likely acted as a motivation to attract the ER program to East Kalimantan. Considering the state
budget restrictions the Indonesian forestry sector was facing at the time of study conduction, the Carbon
Fund was a promising opportunity for East Kalimantan (and Berau – one of the planned focus areas) to
83 See also chapter 5.5.1.2.

Chapter 5: Results
126
fill financial gaps in ongoing policy reforms. For example one current strategy outlined in the FCPF ER-
PIN (RoI, 2016) and ER-PD (Republic of Indonesia, 2018) was to strengthen management capacity
within the State Forest Area through FMU development.
Following interview transcripts and the document analysis, the negotiations and preparations for the
FCPF ER program had in turn prompted better coordination of the REDD+ progress in East Kalimantan.
As one interviewee explained, activities and strategies in relation to climate change in East Kalimantan
had been highly scattered in the past. This was, for example, shown by the number of existing strategic
documents and by the number of organizations. The integration of those scattered strategies and
activities into one program with the aim of achieving one ER target, was thus perceived as an important
step to identify current achievements, challenges and gaps.
Another challenge that had frequently been raised, was the lack of concrete action of existing strategy
and action plans. Following respondents, through the preparation of the Carbon Fund, discussions and
decisions about real actions and measurable ER targets were finally prompted.
On the district level the funding from TFCA, MCAI, TNC and the World Bank also enabled multiple
REDD+-related activities and supported various ongoing government strategies to improve forest
governance (e.g. the FMU reform). However, there were no conditional (performance-based) funding
deals observed in the district. Activities were scattered and therefore, not aligned to reinforce each other.

Chapter 5: Results
127
Table 29: Operationalization of enabling conditions to establish a REDD+ environment. Adapted and
modified to the subnational context in East Kalimantan and Berau from
Korhonen-Kurki et al. (2014), Brockhaus et al. (2016) and Korhonen-Kurki et al. (2018).
Conditions in Berau and East Kalimantan based on interviews and key document analysis.
Factor East Kalimantan Berau District
Condition in (pre-existing) institutional setting
Pressure from
shortage of
forest resources
High deforestation rate
High risk of forest conversion
Remaining high forest cover
High risk of forest conversion
Remaining high forest cover
Key features of
effective forest
legislation,
policy and
governance
Tenure and rights are in many respects
unclear and contested
There are unresolved contradictions
between formal and customary law
There are no adequate laws and policies
Tenure and rights are in many respects
unclear and contested
There are unresolved contradictions
between formal and customary law
There are no adequate laws and policies
Contradicting
strategies
There exist policies that hinder a change
away from BAU, for example, policies that
foster exploitation of natural resources
There exist policies that hinder a change
away from BAU, for example, policies that
foster exploitation of natural resources
Already
initiated policy
change
Anti-deforestation programs
Presence of conservation projects since
decades
Trust in actors that drove this change (e.g.
CSO) from affected stakeholders
(governmental level, communities) have
been gained
Anti-deforestation programs
Presence of conservation projects since
decades
Trust in actors that drove this change (e.g.
CSO) from affected stakeholders
(governmental level, communities) have
been gained
Capacity
The presence of the Forest and broad
network of CSO fosters REDD+ uptake
The effective implementation of national
policy reforms is hampered by limited
resources.
Underfinancing of the forestry sector
There remain capacity gaps on the
government level in terms of REDD+.
Low capacity for example in institutions,
working groups, among organizations is
observed (e.g. REDD+ working group not
operational)
There remain capacity gaps on the
government level in terms of REDD+.
Conditions in policy arena
Ownership
Pro-REDD+ statements & actions by
governor.
National research and NGO actors engage
in policy discourse.
Engagement of national political
institutions in REDD+ policy formulation
(decrees, subnational forest moratorium)
Policy formulation is mainly led by foreign
actors.
Donor agendas dominate process.
No budget allocation to REDD+.
Pro-REDD+ statements & actions by
district head only initially.
National (N)GOs present but they could
not influence policy.
Pro-REDD+ statements by
international actors dominate policy
discourse.
Policy formulation is mainly led by
international organizations.
Donor agendas dominate process.
No budget allocation to REDD+.

Chapter 5: Results
128
Table 29 (continued)
Inclusiveness of
the policy
process
Key stakeholders, including civil society,
private sector, are consulted during the
REDD+ process.
Limited knowledge about REDD+ at the
local level, private sector and among
parliament.
Key stakeholders, including civil society,
private sector, are consulted during the
REDD+ process.
Limited knowledge about REDD+ at the
local level, private sector and among
parliament.
Trans-
formational
coalitions
Existence of coalition building among
actors supporting REDD+ policies (e.g.
umbrella organization, regular meetings,
joint statements, personal relations), for
example, DDPI.
There are drivers of change (policy actors
that lead discourse in pro-REDD+
direction) both inside and outside
government institutions: but mainly from
academia, CSO.
Pro-REDD+ policy actors have good
access to political decision makers (e.g.
invited to expert hearings, members in
advisory councils).
Coalitions of drivers of change are too
marginal to influence policy making and
are not visible in the political discourse on
REDD+.
Pro-REDD+ policy actors had no good
access to political decision makers (e.g.
invited to expert hearings, members in
advisory councils); changed recently
through TNC assistant.
Promise of
results-based
funding for
REDD+
Recent FCPF fund.
Traditional funding agreements.
No result-based funding schemes
Traditional funding agreements.
Multilevel
REDD+
characteristics
Coordination and monitoring related to
REDD+ projects remains poor.
Information flows remain restricted to
personal relationships among stakeholders.
Poor understanding of REDD+ related
issues among many stakeholders,
especially from parliament, private sector
and village level.
Coordination and monitoring related to
REDD+ projects remains poor.
Information flows remain restricted to
personal relationships among stakeholders.
Poor understanding of REDD+ related
issues among many stakeholders,
especially from parliament, private sector
and village level.
Autonomy from
other sectors
Low autonomy of state actors from
business interests that drive deforestation
and degradation (e.g. issuance of land use
permits in times of elections).
Low autonomy of state actors from
business interests that drive deforestation
and degradation (e.g. issuance of land use
permits in times of elections).
Translating
national policies
to lower levels
National policies are poorly mainstreamed
to lower levels. There exist poor guidance,
technical support and capacity on the field
level and concrete concepts for actions to
effectively implement REDD+ elements
designed on the national level.
National policies are poorly mainstreamed
to lower levels. There exist poor guidance,
technical support and capacity on the field
level and concrete concepts for actions to
effectively implement REDD+ elements
designed on the national level.
Legal authority
of new
instruments
New institutions lack legal authority, for
example, to coordinate other ministries and
make decisions.
New institutions lack legal authority, for
example, to coordinate other ministries and
make decisions.
Institutionaliza-
tion &
integration of
REDD+
Low institutionalization and integration of
REDD+ in regional development plans in
the past. Integration on the way.
Frequent rotation of people working on the
local level and in political leadership
Low institutionalization and integration of
REDD+ in regional development plans in
the past.
Frequent rotation of people working on the
local level and in political leadership
(exacerbated through law 23/2014).
Activities to
address drivers
of deforestation
REDD+ activities do not address the major
drivers of deforestation
REDD+ activities do not address the major
drivers of deforestation.

Chapter 6: Discussion
129
6 Discussion
The discussion of the results is structured along the five research questions that were formulated to
analyse the subnational implementation of SFM through REDD+ and FLEGT-VPA processes in East
Kalimantan and the Berau District:
1. What are the current REDD+ achievements and limitations relevant to SFM on the subnational
level?
1.1 Do subnational REDD+ activities contribute to forest loss reduction on the
jurisdictional level?
2. What are the current FLEGT-VPA-related achievements and limitations relevant to SFM on the
subnational level?
2.1 Do national forest certification schemes under a FLEGT-VPA contribute to forest
loss reduction on the concession level?
3. What are the current driving forces of and hindrances to the subnational REDD+
implementation?
Research questions 1.1 and 2.1 were addressed through the analysis of remote sensing data. The
remaining questions were addressed through an analysis of REDD+ and FLEGT-VPA interview
transcripts and evaluation of project and policy documents.
Results of each research question are discussed in chapter 6.2 to chapter 6.6 in terms of their meaning,
expectancy and vis-à-vis existing research – some of which were already introduced in the state-of-the-
art chapter 2. Chapter 6.7 outlines limitations to the study. The discussion starts with a summary of the
key findings.
6.1 Key findings
Several key messages and lessons for forest-based approaches that shape global forest governance can
be drawn from the analysis of the REDD+ and FLEGT-VPA processes in the context of SFM on the
subnational level.
Subnational level is as relevant as the national level
The analysis of the processes of REDD+ and FLEGT-VPA in the focus area show that their objectives
in terms of SFM can only be achieved when they are also initiated at the subnational governmental level
and when they engage the specific subnational sectors driving deforestation and forest degradation. This
involves increasing ownership in the sustainable management of natural resources and improving the
associated human and financial capacities among relevant stakeholders. Disregarding the lower
governmental levels will render national policies unsuccessful.
Most forest loss in the ‘non-forest’ land class
This study demonstrates that most of the forest loss between 2001 and 2016 in both jurisdictions in the
focus area occurred on land officially classified as non-forest land (APL), followed by the permanent
production and limited production forest class. A reason for this lies in the Indonesian land classification
system that does not necessarily coincide with the actual forest cover of the forest or ‘non-forest’
classes. APL land is destined for other land uses than forest management and forested land within APL
can legally be converted.
Most forest loss within industrial land use permit boundaries
More than half of Berau’s forest loss between 2001 and 2016 occurred within industrial land use permit
boundaries (natural forest concession, timber plantation, mining or oil palm plantation permits). Forest
loss in oil palm plantation permit boundaries alone accounted for 52% of Berau’s total forest loss during
that time. Results also suggest a recent expansion of timber plantations.

Chapter 6: Discussion
130
6.1.1 REDD+
REDD+ contributes towards the SFM elements
The study shows that REDD+ has a large potential to contribute to SFM in the focus area. Study
observations reveal that REDD+ benefits are, however, rather non-monetary in nature. On the provincial
level they relate, in particular, to providing enabling conditions for SFM and to the gathering and
creation of new land use data which improved the understanding of deforestation and forest degradation
drivers. On the project scale in Berau, achievements relate to building capacity on the management and
village level. However, REDD+ was not able to achieve its initial goal of reducing deforestation and
thereby emissions in the focus area. Progress, moreover, generally decreased from provincial to district
level.
Non-carbon benefits remain on a pilot stage
Many REDD+ related achievements in the focus area were small-scale in nature and remained on a pilot
stage without a clear impact on the jurisdictional level. Such achievements related to the rehabilitation
of land, the trial of RIL-Carbon, the strengthening and establishment of protected areas and the
negotiation of community forest management rights. Lessons and experiences drawn from these
activities need to be upscaled.
Limitations of REDD+ to address drivers of forest loss
Triangulating the different study elements reveals that the major sources of forest loss remained
unaddressed until 2016 under the REDD+ program in Berau. While forest loss largely occurred outside
the forest estate, results demonstrate that REDD+ activities had concentrated on the forest concession
and community level. The measures applied to improve forest management, that is, the support of forest
concessions in obtaining national and voluntary certifications, also did not result in a reduction of forest
loss within forest concession permit boundaries.
REDD+ process of influencing spatial planning very slow
During the investigation period the BFCP was not able to influence forest and land use policy in a way
that would reduce forest loss in the focus area. Findings show that major achievements in this context
could only recently been made, among them the assessment of Berau’s regional development and spatial
plan and the integration of the BFCP strategies into Berau’s midterm development plan (2016-2021).
REDD+ provides additional resources for ongoing forest reform
Findings suggest that by supporting the implementation of the Indonesian TLAS and its related PHPL
certification on the management level, by fostering the adoption of RIL(-Carbon) and by supporting
FMUs on the ground, REDD+ contributes towards ongoing forestry reform in the focus area. In doing
so, REDD+ fills resource gaps that would otherwise not be filled by institutions formally in charge, one
of those, for example, being the VPA.
Ongoing forestry reform relies on external donors
Because REDD+ provides additional resources for the ongoing forestry reform, many related measures
rely on external donor schemes and international organizations like TNC and the GIZ. This dependence
on external donors and organizations makes the future progress very insecure.
Subnational REDD+ implementation dominated by civil society
This study showed that international organizations and academics are main drivers of the REDD+ policy
process in the focus area while important coordination and monitoring tasks by the government are not
fulfilled. The University of Samarinda played an important role in this process. It has shaped an informal
network that is frequently involved in the REDD+ readiness process, especially on the provincial level.
Limited governmental support and ownership as a barrier to REDD+/SFM
A key gap in the focus area – especially in Berau – was the limited ownership, support and involvement
of governmental members (beyond the political leaders). Explanations for this were a poor
understanding and interest in REDD+ related issues, other nationally driven priority strategies and a

Chapter 6: Discussion
131
poor translation of REDD+ related policies from the national to the local level. The limited governmental
support resulted in a lack of coordination and monitoring through the government and in a gap between
envisaged REDD+ activities and the actual activities carried out on the ground.
Where the gaps between REDD+ and SFM exist
The literature review for this study84 showed that REDD+ has thematic overlaps with every SFM
element.
In the focus area, key measures of REDD+ were the establishment of REDD+ institutions and the
conduction of activities on the community and forest concession level to improve forest management.
Study findings suggest, however, that these applied measures were not sufficient and/or adequate to
achieve REDD+’s full potential to conserve forest resources on the jurisdictional and management level.
Reasons for this are the poor human and financial capacity and the lack of legal authority over other
ministries of the established institutions that were consequently not able to influence the subnational
policy process away from BAU practices that drive forest loss. Activities in communities and forest
concessions did, moreover, not address the major drivers of forest loss in those areas.
Findings show that REDD+ not only needs the support of the national government but, and this is in
contrast to FLEGT, also the support of subnational governments. To achieve REDD+’s full potential
will require equipping newly established institution with more resources (human and financial wise).
Stakeholders supporting and shaping the REDD+ readiness process, moreover, need to focus on the
involvement of the parliament and private (non-) forestry sector. Challenges that need to be overcome
in this context are the poor understanding of REDD+ and related issues among relevant stakeholders,
national strategies that drive the exploitation of East Kalimantan’s natural resources, capacity gaps and
the poor involvement of governmental level and the (non-) forestry sector.
6.1.2 FLEGT
FLEGT contributes and contradicts to SFM
FLEGT shows several overlaps with SFM. Central achievements were the increased transparency in
forest production and the implementation of the TLAS to track timber production destined for the export.
Because of several gaps in terms of SFM within the existing Indonesian legal forestry framework, that
is reinforced through the SVLK, the Indonesian VPA-TLAS does not contribute towards the
conservation of forests but – given its legal compliance – tolerates its conversion.
FLEGT-VPA reinforces traditional unsustainable practices
The ability of FLEGT to reinforce SFM, depends on a country’s legal SFM framework and the
importance, i.e. the amount, of conversion timber.
In Indonesia, the FLEGT-VPA builds on a partly long-standing forestry regulatory framework that is
too weak in terms of SFM. A major issue relates to the tolerance of the unsustainable harvesting system
and ‘conversion timber’ (timber from legal forest conversion areas for other land uses). ‘Conversion
timber’ and timber from forest plantations that might have been established at the expense of natural
forests, are legalized under the SVLK. This implies that timber defined as ‘legal’ under the FLEGT-
VPA might not originate from a sustainably managed forest. The PHPL shows additional weaknesses
in that it does not require a certified timber plantation to demonstrate that it had not been established
following the conversion of natural forests.
SVLK falls short on several aspects of SFM
Given that a TLAS does not necessarily include other certification schemes, like the PHPL in the
Indonesian case, through its sole focus on legality, many issues of SFM remain unaddressed under a
TLAS. In the case of Indonesia, this comprises aspects of forest biodiversity, soil and water protection
and economic, social and cultural issues.
VPA-TLAS unable to address drivers of forest loss within forest concession boundaries
VPA-TLAS in the focus area does not address the major drivers of deforestation neither within nor
outside forest concession permit boundaries in the focus area. While the major drivers of deforestation
84 See state-of-the-art chapter 2.

Chapter 6: Discussion
132
lied outside the forestry sector and are as such not addressed by the VPA, the analysis shows that the
mandatory certification schemes were also not able to influence the occurrence of forest loss within the
forestry concession level during the investigation period. Results indicate that most of the forest loss
within concessions can be attributed to mining or the conversion of forests to oil palm plantations.
The application of the certification schemes under the VPA as single measures to reduce forest loss
within natural concession boundaries is, therefore, not sufficient.
The PHPL scheme adopted under the VPA tolerates large-scale forest loss
In Indonesia, the legal framework of the SVLK comprises the PHPL scheme. In the focus area, large-
scale forest loss occurred in forest concession boundaries that were PHPL certified. Although this loss
was not associated with forest management activities – as frequently occurred in other (overlapping)
land use permit boundaries – it was apparently tolerated by it.
Limitations to address illegal timber
Several of the sources of illegal logging are not addressed by the Indonesian TLAS because the
certification scheme is not implemented on the domestic market, that has about the size of the export
market. Timber destined for the domestic market, like that associated with the unplanned forest
conversion for estate crop plantations, with land claims, and with timber destined for subsistence use
remains unseen by the SVLK as long as it does not enter the export timber supply chain.
Knowledge gap on the impacts of VPA-related certification schemes
There remains a knowledge gap for the impacts of VPA certification scheme, the SVLK, on its main
objective of reducing illegal logging and related trade. There also exists a knowledge gap on the impacts
of the PHPL certification scheme on forest degradation, forest loss, the multiple functions of forests and
on socio-economic aspects.
Where the gaps between FLEGT and SFM exist
Gaps between FLEGT-VPA and the holistic concept of SFM resulted from the national VPA design,
that is, its limited thematic overlap with SFM, a lack of policy measures to follow up on stipulated
objectives and the ineffectiveness of policy measures that were implemented to achieve their objectives.
First, through its sole focus on legality, some SFM aspects remain unaddressed by the Indonesian TLAS
and are only – if at all – indirectly addressed through the PHPL scheme.
Second, many of the stipulated policy objectives of the EU FLEGT Action plan and the Indonesian
VPA, like those related to a clarity of land tenure, the implementation of the TLAS on the domestic
market and the support of SFM, lacked a clear follow up of policy measures to achieve those targets.
Third, policy measures that were defined to follow up on the objectives of the Indonesian VPA,
contradicted with certain SFM elements. This was, for example, the case with the SVLK that was
implemented as a measure to reduce illegal timber but tolerated forest conversion.
6.1.3 Joint lessons of REDD+ and FLEGT for SFM
REDD+ supports the implementation of third-party certification schemes
A common activity under REDD+ to improve forest management in the focus area, was to support the
implementation of FSC and VPA-related certification schemes. With this, REDD+ provides additional
resources for the VPA implementation.
However, by applying these certification schemes as a measure to improve forest management, REDD+
also relies on their effectiveness and credibility to do so. Results demonstrate that concerns exist about
the SVLK in terms of its sustainability and that there remain knowledge gaps on the impacts of the
Indonesian TLAS and PHPL.

Chapter 6: Discussion
133
SFM requires broader governments reforms
Study findings suggest that neither FLEGT-VPA through its certification approach nor REDD+ pilot
projects are able to resolve land use conflicts on the site level. Land use conflicts in the focus area
remained even when concessions obtained VPA-related certifications or when villages were supported
under REDD+.
This suggests that clarifying tenure rights, as well as other aspects of poor governance, are aspects that
exceed the capabilities of single forest concessions and forest-based approaches. Those aspects require
broader governance reforms that break power traditions.
FLEGT and REDD+ with different strengths and weaknesses in terms of SFM
Study findings of FLEGT-VPA and REDD+ processes in the focus area reveal that forest-based
approaches have different strengths and weaknesses in terms of SFM and, therefore, provide very
different potentials to foster its implementation on the ground, specifically the conservation of forest
resources. Stakeholders need to be aware of these different potentials and gaps in terms of SFM but also
about the threats to forests that prevail in a specific region. Only in this way, policy measures of FbAs
can be modified and aligned towards the need of an area, and FbAs unfold their full potential for SFM.
In Indonesia, FLEGT tolerates unsustainable forest practices and does not address the major drivers of
deforestation. While its narrow focus on legality is its weakness, it is at the same time its strength.
Regarding the many obstacles to the REDD+ readiness approach, it is likely that exactly this narrow
focus and strictly regulated ‘certification-like approach’ imposed to the private sector, accounted for its
implementation success.
In contrast, study findings show that REDD+ requires the engagement of the subnational government.
Through its much wider focus, it demands addressing cross-sectoral issues and issues of poor
governance. This holds the potential to address the main drivers of deforestation. REDD+, therefore,
does not show such weaknesses in terms of SFM. This is on the one hand its strength but at the same
time its weakness because gaining wider governmental support on every level is a difficult and long-
lasting process which is much less likely to be achieved in a timely manner.
6.2 Subnational REDD+ achievements and limitations relevant to SFM
The REDD+ achievements and their limitations from the subnational level are discussed under the four
ITTO objectives (Table 11). The four objectives are 1) Providing the enabling conditions for SFM,
2) Ensuring forest ecosystem health and vitality, 3) Maintaining the multiple functions of forests to
deliver products and environmental services and 4) Integrating social, cultural and economic aspects to
implement SFM. The aspect of ‘forest area and carbon stocks’ (ITTO criteria 2) is discussed under 6.3
based on the results of the remote sensing analysis.
REDD+-driven achievements in the focus area were identified for each of the seven SFM elements.
Most of the achievements could be classified as ‘outputs’ while only few ‘outcomes’, that is, observable
behavioural, institutional and societal changes that take place over 3 to 10 years of an intervention’s
output, were found. No contradictions towards SFM were found. This suggests that consulted
stakeholders are generally positive towards the REDD+ implementation in the study area. However, it
is recognized that other studies have raised potential risks, for example, in terms of the exclusion of
minorities within communities from REDD+ benefits and in terms of the risk that REDD+ could
intensify already existing hierarchal structures within communities (Boer, 2017; Howson, 2017).
6.2.1 Objective 1: Providing the enabling conditions for SFM
Most of the identified REDD+ achievements in the focus area related to the enabling conditions for
SFM, which is in line with the results of the desk review in chapter 2.1, and most of these to the entire
jurisdiction. While some findings relevant for this ITTO objective are supported by findings from other
studies in other regions, in the focus area there were also REDD+ achievements observed that had not
been envisaged by scholars. Others had been expected or been observed on the national level but not so
on the subnational level in the focus area.

Chapter 6: Discussion
134
Generally, REDD+ accomplishments in terms of forest governance in the focus area lacked behind those
reported for the national level where REDD+ showed more far-reaching impacts. A similar conclusion
was made by Ekawati et al. (2019) who investigated REDD+ implementation based on investigations in
three provinces in Indonesia.
On the national level, existing research showed that REDD+ promoted better coordination amongst
government ministries, greater transparency, and increased stakeholder participation (Mulyani &
Jepson, 2017). Even though results of this study suggest that REDD+ contributed to some extent to
ongoing forest policy reform and transparency on the provincial level in East Kalimantan, process was
generally very slow and also much less on the district level.
Study findings also do not suggest that REDD+ outputs promoted observable changes in reducing
deforestation and thereby emissions until 2016. There were also no signs of a notable influence on the
resolution of land use conflicts yet. This suggests that an altered economic, regulatory and governance
framework away from BAU practices to fully achieve REDD+’s potential remains to be achieved
(Angelsen et al., 2012).
An important output in this context on the district level was, however, the recent assessment of Berau’s
regional development and spatial plan and the integration of the BFCP strategies into Berau’s midterm
development plan (RPJMD 2016-2021) in 2016. The FCPF ER Program of East Kalimantan is now,
moreover, fully integrated into the provincial development planning processes (RoI, 2019). These recent
developments on the district and provincial level give reasonable optimism that REDD+ can gain more
far-reaching effects related to land-use planning, forest governance and forest loss reduction in the near
future.
However, to do so, the established institutional framework of REDD+ in the focus area needs to be fully
operationalized and translated to the management level where capacity building is needed. Otherwise
REDD+ will not be able to achieve its full potential in terms of providing enabling conditions for SFM
and reducing forest loss. Science should accompany this process in the focus area and identify important
lessons from those jurisdictional pilot programs.
The generation of high-quality data on provincial and district forest resources, carbon sinks and land use
cover (changes) was one REDD+ achievement that had also been suggested by authors like Tegegne et
al. (2018) that based their analysis on global REDD+ policy documents. Such land use change
assessments within and outside the forestry sector provide the basis to address all threats to forests in
Indonesia, where the official forest/non-forest land classification does not necessarily coincide with the
forest cover on the ground.
Results, moreover, suggest that the REDD+ program in the Berau District contributed to an increase of
forest area under voluntary and mandatory compliance schemes, among them the Indonesian TLAS.
None of the consulted authors in the desk review for the state-of-the-art chapter of this study (Cosslett,
2013; Neupane et al., 2019; Tegegne et al., 2018) had suggested such a contribution. This is likely
because all of their analysis or perceptions were based on REDD+’s global design or related policy
documents where no specific reference to legality or forest compliance schemes is made. In the focus
area, the support of forest concessionaires in obtaining forest certifications was one common measure
to improve forest management. In doing so, REDD+ generates additional resources to implement the
commitments made under the FLEGT-VPA. With this, REDD+ fills capacity gaps that forest
concessionaires face.
Capacity building measures provided to the government and those on the management level was
consequently a major contribution of REDD+ in the focus areas. However, despite the many outputs in
relation to building institutional capacity and capacity on the management level, results also reveal that
most of these institutions (e.g. FMUs) still lack financial and human resources and that a sharp decrease
exists towards the district and village level. Those findings from the project level in Berau are supported
by Arts et al. (2019), Ekawati et al. (2019) and Duchelle, Seymour et al. (2018). Results suggest that to
address such capacity constraints on the subnational level requires broader long-term efforts and reforms

Chapter 6: Discussion
135
in the educational sector that no forest-based approach can fill alone. Nevertheless, program planners
should be aware of these capacity gaps, consider them and support their closure.
6.2.2 Objective 2: Ensuring forest ecosystem health and vitality
Authors like Cosslett (2013) and Tegegne et al. (2018) had assumed that REDD+ would generate
significant co-benefits for forest health and vitality through reduced deforestation and forest degradation
and the restauration of forests. Similarly, according to Neupane et al. (2019) stakeholders perceived a
strong contribution of the REDD+ process in Indonesia towards the threats to forests that are caused
directly by humans.
Because there were no signs of a reduction in forest loss on the jurisdictional scale in the focus area, the
above assumption cannot be supported by study results at the current point. Moreover, although the
rehabilitation and restauration of forests were also envisaged REDD+ activities in the focus area, the
few documentations that were available, suggest that achievements were rather small-scale in nature and
restricted to the village level without a clear outcome on the provincial level yet.
That achievements were limited to individual villages, forest concessions or institutions was also
observed for those related to the ITTO criteria under the ITTO objectives 3 and 4, among those the RIL-
Carbon trials in single concessions and first achievements in terms of strengthening and establishing
protected areas. These achievements would now require a substantial upscaling. This aspect is not again
repeated under each respective ITTO objective.
Despite these restrictions, results show that REDD+ contributed substantially towards the identification
and quantification of threats to forests and towards raising awareness and understanding on related issues
in the focus area. This identification and quantification of threats to forests – above all the direct and
underlying drivers of deforestation and forest degradation – is a key condition to successfully reverse
forest loss.
6.2.3 Objective 3: Maintaining the multiple functions of forests to deliver
products and environmental services
Findings of Cosslett (2013) and Neupane et al. (2019) suggested that REDD+ could help to improve
forest management through the implementation of FSC standards and RIL.
Investigations in Berau show that a common activity of organizations supporting the jurisdictional
REDD+ program is indeed the technical support of those entrusted with the management of forests to
improve forest management. This involved the trial of RIL-Carbon in single concessions, supporting the
operationalization of the FMU and the support of natural forest concessions to comply with the standards
of mandatory and voluntary certification schemes, namely the PHPL, legality and FSC schemes. In a
review of the BFCP in Berau that was recently published, it was accordingly stated that through the
certification of natural logging concessions under the SVLK and FSC schemes, “more than a half million
hectares of production forest concessions in Berau have demonstrated improved forest management”
(Hovani et al., 2018, p. 30).
The FCPF ER Program will continue to foster the implementation of these mandatory certification
schemes to improve forest management in the upcoming years (RoI, 2019). However, as the analysis of
the FLEGT-VPA-related certification schemes in this study revealed, those schemes show gaps in terms
of SFM and are currently not able to reduce forest loss on the concession level in the Berau District.
Results hence suggest that identified gaps need to be addressed first, before the implementation of such
schemes are extended to yield the intended target.
Through the provision of additional resources for the implementation of VPA-related certification
schemes, REDD+ also contributed towards the issue of forest product traceability systems. This
contribution had been ruled out by authors like Tegegne et al. (2018) although study results from the
ground showed otherwise.
Duchelle, Simonet et al. (2018) and Ekawati et al. (2019) reported a scarcity of non-carbon outcomes in
REDD+ literature. Findings of this study reveal that REDD+ could help in creating enabling conditions
for the preservation of ecosystems and biodiversity in forest areas. Related activities included the
monitoring of endangered species and community survey trainings. Such activities are of special

Chapter 6: Discussion
136
importance amidst concerns that only those biodiverse forests could be protected under a REDD+
scheme that are at the same time carbon rich (Paoli et al., 2010). The double tracked aim of TFCA
Kalimantan to reduce emissions from deforestation and forest degradation while at the same time
supporting the implementation of biodiversity conservation is, therefore, an approach of conserving the
exceptional biodiversity in Kalimantan independent of the carbon stock.
Statements on REDD+’s contribution towards forest biological diversity could also be derived from the
remote sensing analysis when using forest loss as a proxy for biodiversity. As forest loss showed an
increasing trend on both the provincial and district scale, there were no broader biodiversity benefits
observed in the study area.
Despite the mentioned results, the author of this study shares the above perception of a scarcity of non-
carbon outcomes in REDD+ literature that was also observed for forest functions in relation to water
and soil protection.
6.2.4 Objective 4: Integrating social, cultural and economic aspects to
implement SFM
Cosslett (2013) assumed from their analysis of REDD+ documents that REDD+ will have important
impacts on the socio-economic functions of forests. Tegegne et al. (2018) based those impacts on the
Cancun Safeguards, specifically on Safeguard 385 and 486. The study findings from the ground confirm
the theoretical assumptions made by Cosslett (2013), and suggest that REDD+ can already prepare and
deliver socio-economic outputs also before a SIS is in place. However, findings also demonstrate that
despite the single outputs, their outcomes in terms of socio-economic benefits are yet to be understood.
In the focus area, REDD+ strengthened and increased the support to villages and communities. It was
estimated that 78 villages, or 73% of the total 107 villages in the Berau District, received support from
NGOs in 2017. Those NGOs supported villagers and communities in the production of non-timber forest
products and related businesses, trained them in subsistence farming, helped them to map village
boundaries and assisted them in the process of obtaining forest management rights.
The community empowerment approach (SIGAP), that was initiated and piloted under the BFCP, was
in 2018, moreover, officially adopted by the Berau government as a district-wide approach (Hovani et
al., 2018). Potentially, it will also be adopted by the provincial government in East Kalimantan (idb.).
Given that these achievements actually lead to improved livelihoods and tenure security, this recent
upscaling together with the small-scale achievements in terms of village forest management rights
suggest that REDD+ can support more promising socio-economic outcomes in the future.
However, findings also reveal that it is still poorly understood in what way those multiple activities
actually improved local livelihoods and increased income – as do the effects on small-scale deforestation
associated with community forest conversion. This is supported by findings from Hovani et al. (2018).
In their recent review of the BFCP, they acknowledged the lack of monitoring socio-economic impacts
on the project and district level. Given that interventions related to sustainable community land use
management had still been in their early stages and just being upscaled when the study was undertaken,
their overall impact in terms of reduced deforestation and increased income was presumably still modest
on the district and provincial scale. This would be in line with findings of Lawlor et al. (2013) that
reviewed REDD+ projects certified by the Climate, Community, and Biodiversity Alliance standard
across 22 countries. They found that REDD+ benefits related to jobs, income and education were modest
while benefits in terms of tenure security and empowerment were more significant.
To raise understanding of the socio-economic benefits of REDD+ activities in the focus area and beyond
requires that future efforts monitor related outcomes and impacts by the time they can be expected. A
relevant aspect in this context is in what way REDD+ enhances socio-economic benefits to local
populations instead of just “avoiding to harm them” (Lawlor et al., 2013). Barbier and Tesfaw (2012)
85 Respect for the knowledge and rights of indigenous peoples and members of local communities, by taking into account
relevant international obligations, national circumstances and laws, and noting that the United Nations General Assembly
has adopted the United Nations Declaration on the Rights of Indigenous People. 86 The full and effective participation of relevant stakeholders, in particular indigenous peoples and local communities, in the
actions referred to in paragraphs 70 and 72 of this decision….

Chapter 6: Discussion
137
argue in this context that REDD+ may reduce poverty, where REDD+ efforts enhance tenure security –
one of the essential requirements of SFM.
A good understanding of the complex tenure system is also a prerequisite to knowing who can and
should participate and be rewarded in REDD+.
However, in the focus area, a recurring issue for REDD+ was exactly this frequent occurrence of land
tenure conflicts. Conflicts occurred among communities and between those and license holders
(forestry, mining, oil palm).
Although in Indonesian, REDD+ can theoretically be implemented in customary and village forests, in
practice the persisting unclarity over forest boundaries and rights makes the implementation difficult.
Forest Watch Indonesia estimated that there were 7 million hectare of overlapping forest concessions
and 2,585 tenure conflicts in the period of 1990-2010 (Purba et al., 2014). A study published in 2015 by
Rights and Resources Initiative, moreover, reported that only about 0.19% of Indonesia’s country area
was designated for indigenous people and local communities and 0% of the country was owned by them
while most land was administered by the government. Clarifying such claims was envisaged as part of
the national One Map Initiative (OMI) where the developed map of forest concessions should be
overlaid with a map of tenure claims from communities, but progress was slow (Astuti & McGregor,
2016). Despite the fact that the base map that was created during the OMI is now accessible online, only
around 30% of the administrative borders at the regency level were clearly defined by the national
government (Shahab, 2016).
These facts place special importance on efficient and fair mechanisms to resolve these problems. Against
this background, current activities related to village forestry rights and participatory village boundary
mapping carried out on the village level in Berau by REDD+ proponents are of highest importance. By
the time of study conduction, consulted stakeholders, however, claimed that land use conflicts remained
to persist in some cases even when organisations had already intervened.
Land right uncertainty was also a central component in the findings of Sills et al. (2014) that presented
early lessons of REDD+ projects in several countries including the BFCP in Berau. They found that
some communities in Berau cleared forests either to get compensation fees from potential investors or
as a proof of land ownership (proof of activity). They, moreover, estimated that households managed on
average 2 ha of land for agricultural purposes, mostly slash and burn, at any given time. These findings
of Sills et al. (2014) support that progress in terms of clarifying land rights was rather slow during the
last years.
Clarifying those rights in a timely manner remains, therefore, important not only to prevent the risk of
excluding the poor population from REDD+ benefits because of a lack of formal land rights (Loft et al.,
2016) but also to avoid deforestation and forest degradation associated with such unclarity over land
(Hajjar, 2015).
Cosslett (2013) also highlighted the issue of ‘opportunity costs’ that may limit REDD+’ potential socio-
economic impacts. Further, REDD+ may also reduce available land for agricultural expansion thereby
limiting income sources for communities actively engaged in this management.
In Indonesia this is especially related to community palm oil plantations that are a common, lucrative
short-term source of income. Although this study did not examine the aspect of ‘opportunity costs’ in
more detail, the issue and limitations to REDD+ in this context were recurring aspects during the
interviews.
6.3 Contribution of REDD+ to forest loss reduction
A special emphasis of this study focused on the potential contribution of REDD+ towards a reduction
in forest loss (refers to ITTO criterion: extent and conditions of forests). It was specifically asked, if
subnational REDD+ activities contributed to forest loss reduction on the jurisdictional level. A reduction
in forest loss would ultimately lead towards a reduction in emissions from the forestry sector.
While existing studies such as Gaveau et al. (2018) provide valuable lessons on the forest loss dynamics
in East Kalimantan, they were not primarily undertaken to measure the effectiveness of REDD+ related

Chapter 6: Discussion
138
activities on a reduction in forest loss. Literature had accordingly acknowledged that there were too few
evaluations in the context of carbon outcomes of REDD+ initiatives (Duchelle, Simonet et al., 2018).
By putting REDD+ achievements in the broader context of forest loss dynamics in the focus area, this
study contributes towards a so far under investigated area.
Results of the satellite image analysis do not suggest a contribution of REDD+ activities towards a
reduction in forest loss, neither on the provincial nor on the district level in East Kalimantan and Berau
during the investigation period. Total and mean annual forest loss in East Kalimantan during the
‘REDD+ period’ (2009-2016) tripled in comparison to the ‘non-REDD+ period’ (2001-2008) (Table
19). In Berau, annual forest loss exceeded that of the previous years from 2011 on with the same peaks
in 2012, 2014 and 2016 as had been observed on the provincial level. This suggests that Berau’s forest
loss profile influenced that of East Kalimantan noticeably.
Results also do not suggest an effect of REDD+ on a reduction in forest loss in single land use classes
and permit types. In all land use classes total forest loss doubled to tripled from the non-REDD+ to the
REDD+ period. In Berau, total forest loss almost doubled and annual forest loss more than doubled in
all land use classes from the ‘non-REDD+’ to the ‘REDD+ period’ (Table 20). Total forest loss in all
land use permit boundaries under investigation (HA, HTI, oil palm & mining), moreover, roughly
doubled and mean annual forest loss more than doubled from the ‘non-REDD+’ to the ‘REDD+ period’
(Table 21).
This analysis only considers the net forest loss on the provincial and district scale. On a smaller scale
there could have thus been a net forest loss reduction achieved. And in fact, the document analysis
demonstrates that on the village level, small forest areas (each about 5,000 ha) could be conserved under
the TFCA Kalimantan program but amidst the total district and provincial values, this numbers appears
very low.
The analysis in Berau and East Kalimantan thus shows that the REDD+ readiness process was not able
to influence policy in a way that would have prevented or reduced emissions from deforestation since
REDD+ was introduced there until the year 2016. Reasons for this are manifold.
Forest cover in East Kalimantan and Berau
In 2000, the basis year of the analysis in this study, 51% of East Kalimantan’s and 82% of Berau’s land
area were still forested. In both jurisdictions, forest cover was highest in the limited production forest
land use classes (HPT). This is not surprising given that this land use class is formally under forest
estate. Remarkable was, however, the forest cover in the same year in the ‘non-forest’ area land use
class (APL) in both jurisdictions that nearly resembled that of the permanent production forest class
(HP) (Table 16 and Table 17).
In total in 2000, ~24% of the APL class, that were 1.01 million ha, were still covered with forest in East
Kalimantan and even 64%, that were 384,018 ha, in Berau. Forest cover in the APL corresponded to
16% and 22% of the total forest cover in East Kalimantan and Berau, respectively, in that year. Adding
to this, the forest cover within the convertible production forest class87 (HPK), an area of
1.06 million ha – that corresponds to 17% of East Kalimantan’s forest cover – and 410,898 ha – that
corresponds to 23% of Berau’s forest cover – potentially could have been legally converted to other land
uses in 2000. The basis for this is given in Indonesian law, namely in Government Regulation 10/2010
(GoI, 2010), under which forested areas in the HPK class can be released to ‘non-forest area’ (APL) that
is generally destined for other land uses than forestry. Conversion of forested areas are possible here.
Most of the non-forest area in Berau will be allocated for oil palm activities (SEA Taskforce of Berau
District, 2016).
Upscaling these estimations to the country-level by using recent numbers of the Ministry of Environment
and Forestry and Republic of Indonesia (2018) (Table 2), a forest area of 14.4 million ha88 could legally
be converted to other land uses in Indonesia in the future. Given legal compliance, the resulting forest
loss can be regarded as planned and legal.
87 Formally under forest estate but destined for the release to non-forest land for other land-uses than forestry. 88 Calculation based on the assumption that HPK area was 12.8 million ha and that 49.1% of it was forested, and that 12% or
8.1 million ha of the ‘Non-forest area’ (APL) was forested in 2017.

Chapter 6: Discussion
139
These forest cover results for East Kalimantan, Berau and whole Indonesia reflect the particularity of
the Indonesian land classification system, namely that the administrative land use-classes do not match
the realities on the ground. This means that formally defined forest estates do not necessarily contain
forest cover and areas formally classified as non-forest land can actually harbor trees.
Forest loss on the jurisdictional level
The additional analysis of forest loss development in this study then demonstrated the risk that the just
introduced Indonesian forest/non-forest classification involves, namely that the non-forest area could
become a major driver of forest loss. Study results show that in both East Kalimantan and Berau the
APL class alone accounted for more than 60% of the total forest loss between 2001 and 2016.
These results have far-reaching implications for forest-based approaches like REDD+ and FLEGT that
aim to contribute towards the conservation of forests in the focus area. The forest cover estimations of
2000 and the forest loss estimations between 2001 and 2016, emphasise the need to improve the spatial
land use planning in both jurisdictions and align the land classification of forest and non-forest land to
the actual realities on the ground.
Indonesian law, namely Government Regulation 10/2010 (GoI, 2010), provides the legal basis for such
a process where land-swap89 is a legal option to change land function and classification between forested
land in APL and non-forested land under forest estate. But such processes require political will and good
governance.
Forest loss patterns for East Kalimantan identified in the current study corresponded to those of the
study of Gaveau et al. (2018). They analyzed forest loss dynamics between 2001 and 2017 in Borneo
and showed that annual forest loss showed an increasing trend with a maximum in Indonesian Borneo
in 2016 followed by a sharp decline in 2017 (Gaveau et al., 2018). The peak in 2016 was explained by
forest fires that occurred throughout Kalimantan in that year (Gaveau et al., 2018).
Annual forest loss patterns presented by Hovani et al. (2018) for Berau between 2001 and 2016,
moreover, corresponded to annual forest loss dynamics in this study. Actual forest loss numbers in this
study were, however, lower than those reported by Hovani et al. (2018) which may be due to different
forest base maps used.
Forest loss in land use permits
Results showed that to reduce forest loss in the focus area requires involving the private sectors. This is
because between 2001 and 2016 more than half of the forest loss in Berau occurred within industrial
concession boundaries. About 52% of Berau’s total forest loss during that time occurred within oil palm
concession boundaries, ~ 22% in natural production forest concession boundaries (HA), ~18% in mining
concession boundaries and ~11% in permanent production forest concession boundaries (HTI). Results,
moreover, suggest a recent expansion of timber plantations (Figure 32). These results coincide with the
fact that in both jurisdictions, more than 95% occurred within the APL, HP and HPT land classes.
Gaveau et al. (2018) showed in their study in Indonesian Borneo that the variation in annual expansion
of industrial plantations (timber and oil palm) positively correlated with the variation in annual forest
loss. Considering that more than 60% of East Kalimantan’s and Berau’s forest loss between 2001 and
2016 occurred within the non-forest land (APL) – that is where oil palm plantations are legally
established – and that, half of Berau’s forest loss occurred within oil palm permit boundaries, forest loss
results of this study also suggest a positive correlation with the expansion of oil palm plantations.
Gaveau et al. (2018) explained the peaks in industrial plantation expansion in 2009 and 2012 in
Indonesian Borneo with the price of crude palm oil that peaked in 2008 and 2011 which might also
explain the peak in 2012 observed in this study (Figure 34).
89 Swap of forest area: a change in permanent production forest and/or limited production forest into non-forest area
accompanied by incorporating substitute land from non-forest area into forest area (Government of Indonesia, 2010)

Chapter 6: Discussion
140
Findings of this study are also supported by trends given in the FCPF Emission Reduction Program
Document (ER-PD) (Republic of Indonesia, 2018). There, more than 51% of the reported forest loss
from 2006 to 2016 in East Kalimantan was associated with the expansion of oil palm, 14% with timber
plantations, 10% with mining and 8% with overlogging and poor concession management. Despite those
similar trends, actual numbers of recent forest loss are hardly comparable between the ER-PD and this
study because of different forest definitions and base maps. The forest cover maps given in the ER-PD
show that large parts in the center of East Kalimantan were apparently handled as still being forested.
Those had been handled as being already deforested in 2000 by Gaveau et al. (2016) and were thus not
considered in the forest cover and forest loss estimations in this thesis. Logically, resulting forest loss
estimations in this study were much lower than those reported in the ER-PD. This difference between
MoEF data and data from other independent studies like that of Margono et al. (2014), that Gaveau et
al. (2016) used, was also highlighted by Wegscheider et al. (2018) and Margono et al. (2016).
Findings of this study are also supported by studies of Abood et al. (2015) and the World Resource
Institute (WRI)90 in Indonesia. In their studies, about half of the forest loss in Indonesia between 2000
and 2015 occurred within industrial concessions and half outside these boundaries. In the study of WRI,
oil palm and timber fibre plantations were the largest contributors to forest loss, each contributing to
about 1.5 million ha. Both studies, moreover, suggest that small-scale openings likely constituted an
important deforestation driver outside concession boundaries. The study of the WRI also argued that
much of this deforestation likely stemmed from licensed concession holders that extended their
management beyond the legal permit boundaries which are aspects that could also be considered in the
focus area.
While the mentioned studies had not particularly analysed REDD+ impacts on forest loss, an internal
evaluation commissioned by TNC (Internal evaluation report (Noor, 2016)) was among the few ones
that existed for Berau by the time of study conduction to the authors knowledge that did so. The report
concluded that there was an increase of deforestation/emissions by 34% to 198% in the period 2011-
2014 (under REDD+) compared to the period 2000-2010 (before REDD+) (Internal evaluation report
(Noor, 2016)). Seventy percent of that increase in deforestation/emissions was attributed to the
conversion of natural forests for oil palm plantations and 22% to the conversion for timber plantations
(idb.). Calculations of this study can thus be regarded as rather conservative.
One explanation for this drastic expansion during the BFCP phase given by Hovani et al. (2018) was
that a significant share of this forest loss was associated with oil palm plantation that had already been
approved before the start of the BFCP.
Overlapping land use permits
Another issue related to the forest loss in industrial concession boundaries is that of overlapping land
use permits. The map in Figure 33 shows that there are areas in Berau where oil palm and mining land
use permits overlapped. From the current analysis it is, therefore, impossible to identify, which land use
activity provoked the forest loss in the first place.
Overlapping land use permits were also observed between natural forest concession (HA) and mining
permit boundaries in the centre of Berau. Those overlapping areas show large-scale forest loss. Forest
loss in those areas was considered for each forest loss calculation in each of those permit types.
These overlaps suggest that large areas of deforestation within HA-boundaries were not due to forest
management activities, but rather due to land use changes associated with mining or oil palm activities.
This aspect will be taken up again under 6.5.
All these results have further implications for forest-based approaches that aim to reduce deforestation
in the focus area. Besides the required better spatial planning process introduced earlier, reducing forest
loss in the focus area requires, in particular, involving the oil palm, forestry and mining sectors. As land
use permits are already assigned and might not be revoked as easily engaging respective industries that
90 World Resource Institute: https://www.wri.org/blog/2017/07/drivers-deforestation-indonesia-inside-and-outside-
concessions-areas (accessed on 22.03.2019)

Chapter 6: Discussion
141
already hold land use licenses in better land use management will be necessary. For all sectors, this
involves dispensing with forest conversion, which will also require improving related management
standards like that of the PHPL and legality certification schemes that so far tolerate forest conversion.
All this will require far-reaching land use reforms. However, such reforms and processes are long-lasting
processes – as had been observed in the case of Berau – and might go beyond the capability of single
approaches like REDD+ or FLEGT.
Regardless of the time needed for such reforms, the REDD+ readiness process in the study area showed
that REDD+ can support the application of stricter voluntary SFM certification schemes, like FSC, and
support and drive broader land use reforms.
Promising future progress
The interview transcript and document analysis showed that REDD+ has recently made some important
achievements that have the potential to affect forest loss in the near future. Among those are the
integration of REDD+ strategies into regional development plans and the evaluation of Beraus’s spatial
plan. And in fact, according to Gaveau et al. (2018) forest loss in East Kalimantan declined sharply in
2017. They named the national peat conversion moratorium from 2016, fewer fires in 2017 and reduced
use of fire in land management following awareness campaigns and enforcement as potential reasons
for this recent slowdown.
The slowdown of the expansion of industrial plantations since 2012 in their study were explained by the
national forest moratorium on new plantations in 2011, improved legal context for community-based
land claims, lower crude palm oil prices, relocation to other areas, attention from NGOs, pressure from
consumer nations and increased government oversight.
6.4 Subnational FLEGT-VPA-related achievements and limitations
relevant to SFM
To investigate how FLEGT-VPA contributes towards the implementation of SFM on the ground, it was
specifically asked, ‘What are the current FLEGT-VPA-related achievements and limitations relevant to
SFM on the subnational level?’. In accordance with the discussion of the achievements of REDD+,
results of the analysis of FLEGT-VPA interview transcripts and policy, evaluation and implementation
reports are discussed along the four ITTO objectives presented in Table 11. Results from the remote
sensing analysis, that primarily relates to ITTO criteria 2: extent and condition of forests classified under
ITTO objective 1, are separately discussed under 6.5.
In line with the REDD+ achievements, also the FLEGT-related achievements relevant for East
Kalimantan could mostly be classified as outputs while only few outcomes were observed. This is likely
due to the fact that the VPA was only recently, in 2016, fully implemented. As such outcomes (and
impacts) could not widely be expected to be observed by the time of study conduction. However, it also
has to be noted that the identification of potential outcomes and related limitations was hampered by a
lack of available data on VPA’s core issues, namely illegal logging and related trade, and by a lack of
monitoring of the effects of the Indonesian TLAS on the multiple functions of forests. The findings of
this study contribute in this regard towards a better understanding of such issues but also urge the need
for additional research in this context.
The analysis suggests outputs relevant for the focus area to each of the seven ITTO criteria. There were,
however, quantitative and qualitative differences in terms of their dimension and scope and also
important differences between the contribution of the SVLK and PHPL schemes.
Regarding only the achievements of the SVLK (Table 22), shows that the Indonesian TLAS could
contribute towards several aspects of ITTO criteria 1, 2, 3, 4 and 7. But given its focus on legality, it fell
short on criterion 5: Forest Biodiversity and criterion 6: Soil and water protection. It also missed
important aspects under criterion 7: Economic social and cultural aspects.

Chapter 6: Discussion
142
Through the adoption of the PHPL scheme into the legal framework of the SVLK, the Indonesian TLAS
indirectly contributed towards several other of the ITTO criteria. However, there remain knowledge
gaps on the effects of the PHPL scheme on forest degradation, forest loss and ecological, socio-
economic and environmental aspects. This made it difficult to estimate the field level impacts of related
indicators of the PHPL scheme. The few available documentations and the interviews suggest that the
PHPL scheme may be too weak to deliver benefits under the related criteria. It also shows that the
knowledge gaps on the PHPL schemes are not a matter of distributing the lessons, but that they result
from a lack of assessments.
6.4.1 Objective 1: Providing the enabling conditions for SFM
Most of the achievements relevant for the focus area were found for the criteria ‘enabling conditions for
sustainable forest management’ whereas the key accomplishments, the implementation and
strengthening of the SVLK and PHPL schemes, were related to ‘forest area in compliance schemes’
(ITTO criterion 2) and ‘forest product tracking system’ (ITTO criterion 4).
The legality of timber production is one important step towards sustainability in the forestry sector. The
VPA, therefore, had a major impact on SFM and forest governance on all administrative levels in the
focus area and positively contributed towards ongoing forest reform. Related outcomes were an
enhanced transparency and information availability on forest production and related timber flows and
an increased capacity to audit the certification processes. Despite these outcomes, study results suggest
that the VPA was not able to push for broader governance reforms related to tenurial clarity or improve
forest management. Outcomes on the subnational level in the focus area apparently, moreover, remained
behind those on the national level. Such issues will be discussed in more detail in the following and
under ITTO objective 3 in 6.4.3.
Given the nationwide roll-out of the SVLK and PHPL, the mentioned outcomes should be more or less
the same for all provinces and districts in Indonesia – provided that they are actually implemented. There
are, however, important differences between the achievements on the national and local level suggested.
On the national level in many countries, VPAs have also resulted in an increased stakeholder
participation and capacity of the private sector and the Independent Monitoring (Jonsson et al., 2015;
Overdevest & Zeitlin, 2018; TEREA et al., 2016). Such outcomes could not be observed on the
subnational level in the focus area.
Increased stakeholder participation in national forest governance was, for example, a key achievement
reported for the VPA process in Indonesia (Overdevest & Zeitlin, 2018; TEREA et al., 2016).
Participation of civil society on the national level was made possible through new multi-stakeholder
platforms such as the Joint Implementation Committee, technical working groups and the Independent
Monitoring (idb.). Apart from the fact that those multi-stakeholder platforms established on the national
level may have also involved organisations actively engaged on the local level, there were no signs that
the VPA process led to an increased participation of civil society within the provincial and district
governments.
On the provincial level, the only respective institution that could have theoretically had an influence was
the provincial Independent Monitoring focal point. However, visits and interviews conducted by the
current study confirmed that the Independent Monitoring focal point could not be regarded operational
by the time of study conduction. The conduction of its monitoring tasks was nearly impossible given its
limited resources. It was also hard to imagine that the focal point would have had the capability to
communicate with, let alone influence, the provincial government. Lesniewska and McDermott (2014,
p. 20) also concluded in their assessment, that CSOs were indeed centrally involved, but that they did
not represent “civil society’ in its entirety”.
Results suggest that future efforts under the VPA process should now focus on the subnational level and
extend the achievements of the national level to the lower levels.
Results also demonstrate that there remain substantial capacity and resource gaps on the subnational
level to fully implement all elements of the VPA and that the operationalisation of the VPA’s core
elements relies on the technical and financial support of external sources.

Chapter 6: Discussion
143
One such example is that of the Independent Monitoring already mentioned above. Based on the briefing
notes on FLEGT that were published by the European Commission (EC, 2007), national governments
should ensure that resources for the Independent Monitoring are available. In Indonesia, the Independent
Monitoring was in the past mainly funded by external donors such as the MFP, but study observations
show that the resources were not sufficient to implement the vast monitoring tasks.
Another example is the missing support of the private sector. Based on study observations there was
neither financial nor technical support from the government or VPA process provided to the forestry
sector that carries the financial burden related to the implementation of the SVLK and PHPL
certifications on the management level.
As already discussed in 6.2.1, such technical support was provided under the REDD+ programs in the
focus area and by The Borneo Initiative61 (TBI). The TBI has created a dual certification model for both
SVLK and FSC to reduce the burden of concessionaires. The support of those initiatives and programs,
was likely a factor that drove the adoption of the certification schemes in Berau. Consequently, both
VPA-related certification schemes were operational by the time of study conduction in the focus area
and all active concessions certified by at least one of them. This leads to the question of how the
certification schemes are taken up in areas that do not receive such external support. Chances are that
the adoption of the schemes require much more time and that concessions face multiple challenges
which could ultimately lead to a poorer implementation of the standards when no further technical and
financial support is provided.
The VPA’s main achievement in this regard was thus to strengthen the legal basis for the certification
standards and their enforcement, rather than their uptake and implementation on the management level
which was strengthened through other programs.
The VPA – through the SVLK regulations – sets the legal framework to fight illegal logging on the
management level in Indonesia. Results of the document and interview analysis suggest that through its
promotion and enforcement, the SVLK has led to an increased awareness on the issues of illegal logging
and poor governance and to a decline in illegally harvested and processed timber destined for the export.
These perceptions are in line with those of Indonesian stakeholders consulted in the study of Neupane
et al. (2019).
With this, the VPA contributed directly towards combating of one of the major threats to Indonesia’s
and East Kalimantan’s forests because it was estimated that illegal logging in Indonesia accounted for
at least 40% of Indonesia’s wood supply leading to annual tax losses of around US$ 2 billion in 2006
(Luttrell et al., 2011).
However, illegal logging is only one of several drivers of forest loss, among which are drivers that have
a much more devasting impact on East Kalimantan’s forest resources like those associated with mining,
oil palm and timber plantations. Under 6.3 it was already discussed that in East Kalimantan and Berau
the non-forest land class accounted for more than 60% of the total forest loss between 2001 and 2016.
Results also showed that most of the forest loss within natural forest concession boundaries (HA
permit)91 was associated with large-scale forest loss (permanent forest conversion), some of which could
be associated with overlapping oil palm and mining permits.
Through its sole focus on timber legality, the VPA does not address these major deforestation drivers of
East Kalimantan’s forests. The VPA’s potential to contribute to sustaining forest resources in the focus
area – a fundamental requirement for the implementation of SFM – is, therefore, limited, something that
had also been hypothesized by Lesniewska and McDermott (2014) for Indonesia. By the time of study
conduction, there were no studies available to confirm this assumption. Results of the forest loss analysis
on the concession and jurisdictional level in East Kalimantan and Berau in this study are, therefore,
valuable.
Considering then that more than half of the forest loss in Berau between 2001 and 2016 occurred within
land-use concession permit boundaries, the resulting forest loss could be regarded as planned and legal.
Because most of this loss was further most likely linked to the establishment of oil palm plantations and
mining activities, clear cuts were the prevailing land-use activity here. Given its full legal compliance
91 See also discussion in 6.5

Chapter 6: Discussion
144
with laws, the resulting timber could legally be processed under legality standard four of the SVLK and
traded under FLEGT.
This shows that timber defined as legal under the FLEGT-VPA might not originate from sustainably
managed forests. Associated concerns in this context had also been raised by authors like Lesniewska
and McDermott (2014).
Results revealed that another related concern refers to the reporting of such conversion timber that enters
the EU market. Official numbers were available on the ‘sources of timber consumption of primary
industries’ in the RPBBI database including numbers on timber consumed from conversion areas, but it
remained unknown how much of this timber was processed and destined for the European market
(probably also due to difficulties related to timber products from mixed sources).
The issue of conversion timber shows that the Indonesian VPA supports and legalizes unsustainable
practices rather than that it provides strategies to combat the underlying drivers of that forest loss. The
issue of legal and sustainable timber should thus be of high concern for the interventions (policies,
frameworks, institutions) related to sustainable management of forests in Indonesia.
The content analysis of key documents and interviews, moreover, reveals that there are discrepancies
between what the SVLK is, namely a legality licensing system, and as what it is often promoted. The
newest annual progress report on the Implementation of the IDN-EU FLEGT-VPA (Indonesia & EU,
2017) that was published in 2017 for example still stipulated that: “The objective [of the SVLK] was to
combat illegal logging and ensure the sustainability of Indonesia’s forests by promoting legal trade of
timber (Indonesia & EU, 2017, p. 6).”
The study shows that the SVLK is often promoted as an incentive for sustainability. As a certification
scheme that is mandatory for concession holders that want (to continue) to export their wood, the SVLK
cannot be seen as an incentive to SFM nor legality, but rather as a necessary requirement to be able to
further export.
Clarifying these differences would be an important step towards sustainability.
6.4.2 Objective 2: Ensuring forest ecosystem health and vitality
The above-mentioned remaining gaps and concerns lead to the question in what way the Indonesian
VPA is able to achieve its ultimate objective of reducing illegal timber and related trade. Answering this
question remains difficult. While results of the document and interview transcript analysis point towards
a reduction in illegal logging associated with timber destined for the export market, results also show
that more evidence is needed to make these conclusions.
An important issue in this context are the sources of illegal logging that are covered by a VPA. In
Indonesia, drivers of forest loss are classified into planned and unplanned drivers (Table 4). While
planned deforestation and forest degradation are usually legal, that is, they comply with Indonesian law,
and timber that originates from these forest losses is, as such, tolerated by the SVLK, unplanned forest
loss is not. Unplanned drivers are, for example, unplanned forest conversion for estate crop plantations
(e.g., oil palm), land claims that lead to the conversion of forest areas and land-management activities
conducted for the subsistence use.
Timber that originates from these harvesting or conversion activities falls out of the scope of the current
SVLK as long as it does not enter the export supply chain. This is because, based on study findings, the
Indonesian TLAS has not been implemented on the domestic market by the time of study conduction,
despite objectives to do so. The Indonesian TLAS is, therefore, practically only able to detect timber
that was illegally harvested within concession boundaries and destined for the export market (harvesting
outside/beyond annual allowable cut) and timber that is illegally processed by exporting industries.
This discussion gains on relevance by contrasting the actual amount of timber produced for the domestic
and international markets. Jonsson et al. (2015) and Lesniewska and McDermott (2014) both cite that
over 80% of Indonesian timber production was for domestic use and that a significant amount of this
was produced by small-scale operators. In line with this, Anti Forest-Mafia Coalition and Forest Trends
(2015) suggested that large companies accounted for less than 37% of timber used in Indonesia, leaving
most of the consumed wood to small and medium-scale operators.

Chapter 6: Discussion
145
These numbers and aspects show the significant limitations of the current VPA in terms of reducing
illegal logging in countries like Indonesia where local demand for legally harvested wood does not exist.
Despite these theoretic discussions, further evaluations and detailed case studies on how successful
VPAs are in achieving their ultimate goals are needed. This study has made a first attempt to evaluate
the effects of VPA-related certification schemes on forest loss reduction. Results are discussed in detail
under 6.5.
6.4.3 Objective 3: Maintaining the multiple functions of forests to deliver
products and environmental services
Results show that the FLEGT-VPA contributes to the assessment of timber resources (inventories),
forest management planning, and the implementation of a log tracking system. Given that both
certification schemes appeared to be operational in the focus area, and that no hints of objections were
found in interviews or reviewed documents, this study assumes a positive contribution towards those
aspects relevant for SFM.
Apart from these contributions, Tegegne et al. (2018), based on global FLEGT policy documents, and
consulted stakeholders by Neupane et al. (2019) had assumed that FLEGT could contribute towards
more sustainable logging practices, for example, RIL, and timber harvesting arrangements in natural
production forests. Based on study results, these assumptions cannot be supported.
First, in Indonesia, sustainable logging practices like RIL are not a requirement under the TLAS itself,
but under the PHPL scheme that forest concessionaires have to comply with no later than three years
after obtaining a legality certificate. This means, if not integrated into the broader legal forestry
framework of a country, the VPA does not necessarily address this issue. The same holds true for
biodiversity conservation on the concession level, aspects related to soil and water protection and socio-
economic issues. All are not explicitly dealt with under the Indonesian TLAS. In turn, the limited
literature available on the PHPL scheme suggests that in comparison to global voluntary SFM
certification schemes, the RIL requirements of the PHPL scheme remain weak (Maryudi et al., 2017;
Ruslandi et al., 2014).
Second, the interview transcript and document analysis of FLEGT evaluation and implementation
reports suggests that on the management level, Indonesian FLEGT-VPA showed strong limitations to
SFM in regards of silvicultural operations. The Indonesian FLEGT-VPA, through the integration of the
PHPL scheme, builds on and thereby reinforces existing and partly long-standing practices of forest
management that were known to be unsustainable. A major concern relates to the adoption of the
Indonesian harvesting system, the TPTI, through the PHPL and the already mentioned legalization of
conversion timber under the SVLK. Similar problems were reported by C. P. Hansen et al. (2018) in
Ghana where the TLAS upheld management rules that had long been outdated. Related concerns had
already been raised by Lesniewska and McDermott (2014) in 2014 before the VPA between Indonesia
and the EU was fully implemented, which was in 2016.
Tegegne et al. (2018) also assumed that through better forest law enforcement, the conduction of
environmental and social impact assessments related to harvesting operations could be ensured. Results
showed that the Indonesian TLAS indeed requires EIA from forest concession permit holders to verify
compliance with environmental and social aspects related to timber harvesting. Literature, however,
suggests that associated requirements are rather weak, and that documentation alone is not always
sufficient proof of implementation. Gokkon (2018) and Spitz and Husin (2009) reported, for example,
that the quality of EIA documents was often the outcome of a cut-and-paste practice. It has also been
stated that the EIA monitoring capacity at any governmental level were inadequate (Gokkon, 2018).
These aspects show that relying on and not further questioning the existing legal forestry framework of
a country, will not necessarily support SFM on the ground. Although these aspects had already been
acknowledged early on in the EU FLEGT process, no such forestry reforms have been promoted by the
VPA process in Indonesia.

Chapter 6: Discussion
146
The EU Action Plan states, for example, that only where a legal forestry framework of a country is not
based on the principles of SFM, the EU should encourage a review of this legal framework (EC, 2003).
Later it had been acknowledged that law enforcement could only promote sustainability if existing
legislation in a country reflected the three pillars of SFM (social, economic and ecological) (Federal
Ministry for Economic Cooperation and Development [BMZ], 2007). However, more than ten years
later, exactly these issues are still of major concern in VPA implementing countries. Based on study
findings, the legal framework should also be interrogated for its effectiveness in terms of SFM for those
countries that, on paper, confess towards SFM.
6.4.4 Objective 4: Integrating social, cultural and economic aspects to
implement SFM
As a central requirement of SFM, the clarity over land tenure, local access to forest resources and the
recognition of local forestry rights, are also a central aspect under FLEGT. In the European Council
conclusion on FLEGT it is accordingly stated that VPAs should “strengthen land tenure and access
rights especially for marginalized, rural communities and indigenous peoples” (The Council of the
European Union, 2003, p. 1). The VPA between the EU and Indonesia, moreover, acknowledged that to
reinforce monitoring and evaluation of the functioning of the SVLK, information on land and forest
allocation needs to be ensured (EU, 2014).
Authors like Tegegne et al. (2018), that built their analysis on global policy documents like those above-
mentioned ones, accordingly concluded that FLEGT could help to clarify and strengthen tenure rights
of private forest operators and local and indigenous communities. In countries like Indonesia, this would
imply that the FLEGT-VPA process must promote governance and forest reforms. Study results from
the subnational level in the Berau District did not support this assumption.
First of all, for Indonesia, there were important differences between the SVLK and PHPL schemes in
terms of their requirements for tenurial clarity, resolution of conflicts over land and access to forest
resources. Although the PHPL scheme is integrated into the SVLK and its standards thus required to be
implemented by forest permit holders no later than three years after the obtainment of the legality
certificate, it is important to notice that only those standards that relate to the legality of the timber
product (those of the SVLK scheme) are relevant for entering the EU market. All remaining standards
under the PHPL scheme, like those related to social, production and environmental aspects, are not
further required for legality (and also not accepted as a proof of improved forest management).
Regarding only the SVLK standards for natural production forests, it appears that the legality scheme
does not provide for any standards related to tenurial clarity, resolution of land use conflicts or
recognition of customary rights. The only requirement in this context is proof of the ‘legal status of the
area and right to utilize’ while social and environmental aspects are only indirectly dealt with through
the requirement to possess an EIA that has frequently been criticized in Indonesia92.
The process of legal permit allocation and whether a permit is adequately issued (in the case of timber
plantations for example on degraded land), remains, therefore, untouched under the SVLK (and the
PHPL).
There are even less requirements in this context93 for forested areas in the ‘non-forest class’ and
convertible production forest class that can be subject to clear-cutting for other land uses under legality
standard four94.
When taking also into consideration the PHPL standards for state production forest, additional indicators
related to customary rights and the implementation of conflict resolution mechanisms among them
indicators over the tenurial clarity and Free, Prior and Informed Consent (FPIC) exist. Despite their
formal adoption into the PHPL, study results suggest that their implementation is rather weak.
First, the review of the PHPL certification standards reveals that the PHPL scheme classifies its verifiers
into dominant (higher weight) and co-dominant verifier (lower weight). The verifier that relates to
tenurial clarity (verifier 1.1.3.) is a co-dominant verifier despite the fact that this is one central aspect of
92 See discussion under 6.4.3 93 See chapter 5.3.7.2 94 See Table 6 for legality standards of the SVLK

Chapter 6: Discussion
147
sustainability. This means that concession holders can get certified even when they score poorly on this
verifier. In relation to FPIC, Maryudi et al. (2017) moreover showed that auditors used EIA documents
to verify FPIC.
Second, for the focus area in Berau, study results show that forest concessions were certified for legality
and SFM (under the PHPL scheme) even when conflicts over land resources existed. Similar concerns
were raised by Maryudi et al. (2017) and Lesniewska and McDermott (2014) for Indonesia and by C. P.
Hansen et al. (2018) for Ghana.
These results indicate that the current Indonesian VPA-TLAS, through its related standards, does not
contribute towards clarifying land tenure and access to forest resources. Ruslandi et al. (2014) argued in
this context that it was beyond the capacity of forest concessionaires to solve such problems that actually
demand governmental solutions. A national led land use assessment is, therefore, highly needed before
the standards of voluntary and mandatory certifications can be fulfilled on the ground.
Given the need of the Indonesian VPA, and FLEGT’s broader objective of clarity over land tenure and
forest access, one could still claim that the FLEGT-VPA process has not promoted such governance
reforms (C. P. Hansen et al., 2018; Lesniewska & McDermott, 2014). In Indonesia a recent measure to
bring clarity over forest land use and allocation was the enaction of the OMI process that, according to
authors like Mulyani and Jepson (2017), was prompted through REDD+.
Due to the fact that there was only very limited information available on the effects of the VPA
certification schemes on aspects related to equitable sharing of benefits, conflict resolution mechanisms
and labour rights in production forests, this study cannot draw conclusions on such outcomes. This
highlights the importance of future research in this area.
6.5 Contribution of FLEGT-VPA to forest loss reduction
This study specifically asked whether the national forest certification schemes of the Indonesian
FLEGT-VPA contributed to forest loss reduction on the concession level.
Study results suggest that the mandatory certification schemes, namely the SVLK and the PHPL, were
not able to reduce the occurrence of forest loss on the concession level, neither the occurrence of loss
associated with forest management activities (small-scale loss), nor that associated with the conversion
of forests (large-scale loss).
The following discusses the study’s major findings in terms of their meaning, expectancy, and position
vis-à-vis existing research. Due to a lack of similar studies, the comparison with other literature was
difficult.
Forest loss in natural forest concession permits
This study found that annual forest loss within the HA area in Berau spanned by the 18 concessions
under investigations tended to increase between 2001 to 2016 (Figure 39). This trend was also visible
when separating forest loss into small- and large-scale forest loss (Figure 41) and in many single
concessions (Figure 40).
Fifty-eight percent of the total forest loss (39,160 ha) observed between 2001 and 2016 in the entire area
covered by the 18 considered concessions, was classified as loss associated with the conversion of
forests (large-scale loss), the remaining 42% was associated with forest management activities (small-
scale loss).
Relating these results to those from the REDD+ forest loss analysis showed that the total forest loss
within the HA investigation area accounted for 20% of Berau’s total forest loss in the same period.
Forest loss associated with forest conversion accounted for 11.5% and loss associated with forest
management activities for 8.4% of Berau’s total forest loss.
By regarding the single forest loss values of each concession (Table 31), it becomes clear that
concession no. 5, with a total forest loss of 23,749.44 ha, is an outlier. This one concession accounted

Chapter 6: Discussion
148
for more than half, namely 61%, of the total forest loss that occurred between 2001 and 2016 within the
regarded HA-area in Berau. The separation into small- and large-scale forest loss reveals that most of
this loss was classified as large-scale forest loss and thus associated with conversion activities.
These results support the assumptions made earlier under 6.3 that showed that overlapping land use
permits existed for the same area in the center of Berau, which, moreover, showed large areas of forest
loss. These overlaps already suggested that the forest loss in the forest concession permit boundaries
was likely not due to forest management activities, but rather related to the overlapping land use permits
of the oil palm and mining sectors.
Regarding closer the occurrence of large-scale forest loss in Figure 38 and Figure 33, however, also
shows that there remain some losses that are not covered by any non-forest permit. It, therefore, remains
unclear what activity provoked this loss in those areas.
Generally, large-scale loss accounted for the biggest share of total forest loss between 2001 and 2016 in
the HA area in Berau while annual small-scale forest loss was mostly higher than annual large-scale
loss (compare 5.4.1). The ratio of annual loss is not surprising as the main intervention within natural
forest concession permit boundaries should be harvesting operations.
The contrasting ratios of annual and total losses can be explained by the fact that total large-scale forest
loss from 2001 to 2016 was mainly composed by the loss in that single concession mentioned above. In
the remaining HA-area (without this concession), total small-scale forest loss from 2001 to 2016 would
in contrast be higher than total large-scale forest loss in the same period.
These results show that large-scale activities (associated with forest conversion from the non-forestry
sector) in only one single concession, can have devastating impacts on the total forest loss-profile of an
entire HA area in a district and even skew the profile owing to the much larger area that is lost in
comparison to forest management activities.
Taking the results of the overlapping land use permits into consideration, these findings show how
difficult it is to identify the actual land use activities behind the forest loss and in turn to estimate the
tree loss of forest management activities alone in countries like Indonesia where overlapping land claims
are very common.
The use of remoting sensing data like the one in this study reaches its limits here. Ground-checking
would be thus required.
Certification effects on forest loss in natural forest concessions
Results suggest that forest loss observed during the certification periods was higher than that observed
in the reference period (without certification). Annual forest loss in the PHPL period was clearly higher
than that in the reference and legality certification periods and annual loss in the legality period slightly
higher than in the reference period (Figure 44).
The same trend was observed when separating forest loss into small- and large-scale loss (Figure 47)
whereas annual small-scale loss was in each period higher than large-scale loss.
Most of the concessions under investigation further showed an increase in the mean annual forest loss
in their certification compared to their reference period(s) (Figure 46). The same trend was apparent for
the small-scale forest loss of a concession (Figure 48).
An explanation for the higher losses during the certification periods than during the reference period
could be a general increasing trend of forest loss within HA-boundaries that could be associated with
other aspects than the certification, for example, higher timber prices, from 2010 on. Given that the
certification schemes became only mandatory in 2009, concessions started to adopt them consequently
exactly when forest loss would have increased due to those other reasons. In fact, as demonstrates the
remote sensing analysis on the district level, there was a general increasing forest loss trend within HA,
HTI and mining permit boundaries (Figure 31, Figure 32 and Figure 35).
However, annual forest loss of concessions without a certification was relatively stable from 2010 on,
while values for concessions with a certification, especially with PHPL certificates, were remarkably
higher in the period from 2010 on (Figure 45).

Chapter 6: Discussion
149
A similar trend was observed when separating forest loss into small- and large-scale forest loss (Figure
48). However, since the aim of this study was not to identify causal factors, no statement can be made
about the causality between the certifications and the higher forest loss.
Certification effects on forest loss associated with harvesting activities and forest conversion in
natural forest concessions
Above it was already outlined that many of the trends of the forest loss in the regarded HA-area also
occurred when separating small- from large-scale forest loss.
In summary, findings suggest that annual forest losses associated with both, forest management
activities and the permanent conversion of forests, during the certification periods were higher than
during the reference period (without certification), whereby annual loss was always highest in the PHPL
certification period (Figure 47, Figure 48, Figure 49). That means that between 2001 and 2016 in HA
concessions in Berau, there was yearly more loss due to forest management activities and to forests
conversion observed when concessions were certified.
It was also already shown that large- and small-scale forest loss in individual concessions occurred
generally more from 2010/11 on (Figure 41). Despite this trend, findings show that annual small- and
large-scale losses in concessions without a certification did not increase remarkably from 2010 on, but
remained relatively stable over the entire investigation period (Figure 41). In the PHPL certified
concessions, however, especially forest loss associated with the conversion of forests (large-scale loss),
but also with that of forest management activities (small-scale loss), was clearly elevated in comparison
to that of concessions in the reference period (Figure 48).
The analysis further demonstrates that in the PHPL period, total loss associated with the conversion of
forests was higher than that associated with forest management activities. (This was not the case for the
non- and the legality certification periods and also not for the annual forest losses of each period where
results for the small-scale losses were higher compared to the large-scale loss (Table 26 and Figure 47).
The above results lead to the following considerations: first, while certifications were not expected to
have an effect on forest loss associated with forest conversion, it could have been assumed that they
would affect forest loss that was associated with forest management activities. This is, because there are
standards under the certification schemes that directly relate to the management of forests, such as the
PHPL standard for the implementation of RIL, the standard for the implementation of a silvicultural
system that ensures forest regeneration and the standard to possess a management plan. Tritsch et al.
(2019), that used high resolution maps of forest-cover changes to analyze the impacts of forest
management plans on deforestation in the Congo Basin, for example found that between 2000 and 2010,
deforestation in concessions with an forest management plan was 74% lower compared to others.
That this study found no evidence that the forest certifications had a positive effect on small-scale forest
loss can have different explanations. One would be that the certification schemes might not have
provoked significant improvements in forest management, that is, that changes have been minor or rather
in relation to non-environmental factors, something that was also argued in relation to FSC certifications
by Blackman et al. (2015). This would be logical for the legality certification that primarily deals with
the aspect of legalizing the wood product chain rather than with aspects of forest management. Under
6.4.3 it had already been argued that the standards, or rather the implementation of the PHPL standards,
were in many regards too poor to foster SFM, for example, in regards to implementing RIL, the
Indonesian harvesting system and the EIA. These aspects could explain the limited effects of the
certification schemes on a reduction in small-scale forest loss associated with forest management
activities.
Another explanation would be that the certification schemes did indeed provoke some changes, but
rather in relation to forest degradation while this study focused on forest loss. Tritsch et al. (2019),
moreover, showed in their study that reduced deforestation in concessions with a forest management
plan was also associated with a better regulation of access to and monitoring of concessions that limited
illegal activities. Such aspects had not been studied in this study but may, together with forest losses
that were provoked by other land-use activities than the concessions’ forest management, play an
important role when they are absent.

Chapter 6: Discussion
150
Second, while no effects on large-scale loss were assumed from the VPA-related certifications, one
could have asked in what way they tolerated forest conversion. Interesting in this context are the results
of large-scale losses in PHPL certified concessions.
Considering that annual forest loss associated with the conversion of forests (large-scale loss) was higher
for PHPL certified concessions than for non-certified concessions (Figure 47), and that large-scale loss
largely appeared within PHPL certified concessions but not so in legality-certified or non-certified
concessions (Figure 48), the PHPL certification scheme appears to tolerate losses associated with the
conversion of forests inside forest concession boundaries. Even if those losses were not associated with
a concessions’ forest management and might have occurred under a (different) valid land use license
(aspect of overlapping land use permits) and, therefore, have fallen out of the concession parts that were
in the scope of the PHPL, these findings nevertheless show that large-scale losses did occur in PHPL
certified concessions.
From these findings, it can be concluded that, first, PHPL certifications fail to address forest conversion
and second, that they even seem to tolerate it. To draw clearer conclusions would (have) require(d) to
ground-check forest loss within concessions that showed losses due to forest conversion within
concession boundaries.
Third, relating these findings to the discussion of the aspect of ‘timber from legal forest conversion’ in
6.4.2, demonstrates the following. No matter the primary land use activity behind this large-scale forest
loss in PHPL certified (and also legality certified) concessions, as long as this large-scale forest loss
occurs under a valid license (as it probably did, at least partly, given the overlapping land use permits)
and complied with all other requirements laid out under the SVLK legality standard four95 that relates
to timber from conversion areas, this timber could legally be processed and exported to the EU under
the Indonesian TLAS. Because FLEGT solely focuses on legality, it thus tolerates wood that originates
from areas that resulted from such legal land use change.
Results support that VPAs have limited potential to address the major drivers of deforestation within
and outside natural forest concession boundaries.
The hypothesis that FLEGT, through improved legality, which is often a precursor of wider forest loss,
could reduce forest loss on the concession level cannot be supported by the study results.
To reduce large-scale deforestation successfully within those HA concessions would thus, first, require
clarifying the overlapping land claims and second, replacing the establishment of mining sites or oil
palm plantations to non-forested sites. In other words, it would require better land use planning.
This conclusion from the concession level coincides with the conclusions made for the district and
provincial level in 6.3, namely that FbAs aiming to help halt deforestation in the focus area need to
engage in the subnational spatial planning process, influence forest governance on the subnational level,
and involve the private sector in better land use management including the forestry, oil palm and mining
industry. Based on the study results, FLEGT had not provided any successful measures to do so on the
subnational level in the focus area.
6.6 Driving forces of and hindrances to subnational REDD+
Above the REDD+ and FLEGT achievements in terms of SFM on the subnational level were discussed.
In this chapter the findings to the research question ‘What are the current driving forces of and
hindrances to the subnational REDD+ implementation?’ are discussed in terms of their meaning and
their implications for turning identified challenges into potentials. Many of the identified forces and
conditions can explain the (limitations to the) identified achievements of REDD+ (and partly also of
FLEGT-VPA).
The interview transcript and key document analysis shows that the REDD+ process in East Kalimantan
(including the Berau District) is characterized by a complex interplay of factors that drive and those that
95 Standard for the timber utilization rights within non-forest zones on state-owned lands

Chapter 6: Discussion
151
hamper the subnational process. Many of the identified factors influence each other and act in parallel,
for this reason it is hard to regard them independently from each other.
Comparing the factors that can explain the achievements and limitations on the subnational level with
those reported by Korhonen-Kurki et al. (2018) for the national level in Indonesia, shows that many of
the forces on the national level were equally present on the provincial level. Among those is the initial
ownership of REDD+ from provincial and district political leaders, the already initiated policy change
and the existence of transformational coalitions on the provincial level. On the district level, however,
many of those were not as strong or entirely absent. Examples are that existing coalitions did not have
sufficient access to the decision-making level and that established REDD+ institutions were not
operational by the time of study conduction on the district level.
There were also a number of aspects identified that played an important role in the REDD+ readiness
process on the subnational level in the focus area that had not been highlighted for the national process
by the above-mentioned authors, among those ‘the informal network of stakeholders’ and the
‘translation of policies to lower levels’.
Results of the interviews and document review suggest that, despite the initial ownership of
governmental leaders, REDD+’s further success was hampered by a lack of a wider governmental
ownership and support and especially by the low involvement of parliament members. The poor
governmental support resulted in gaps related to coordination and monitoring tasks, integrating and
institutionalizing REDD+ into regional development and spatial plans and in addressing the major
drivers of deforestation and forest degradation. Astuti and McGregor (2015a) and Luttrell et al. (2014)
argued that any policy reform, including REDD+, necessarily needed the parliamentary and public
support in order to be successful on the field level, which is in line with the conclusions in this study.
Study findings related to the identified hindrances are largely supported by other studies, for example
by those of Ekawati et al. (2019) that carried out research on policies affecting the implementation of
REDD+ in Indonesia in the provinces of Papua, Riau and Central Kalimantan, and of Austin et al. (2014)
that presented challenges to the national forest moratorium at the local level. Austin et al. (2014)
interviewed local government officials responsible for land or forest management and found that the
effectiveness of the national forest moratorium was hampered by a poor understanding of the local scope
of the moratorium (e.g. understanding of the exact locations of the moratorium areas), a clear mandate
and lack of funding for monitoring. This resulted from the fact that the central government had only
provided very limited technical guidance and that it remained unclear who should have been responsible
for the monitoring. Those aspects were in line with findings from this study, for example, in terms of
translating national REDD+ policies to lower levels and the low capacity at the local level.
Ekawati et al. (2019) concluded in their study that subnational governments would now need assistance,
capacity building and financial support to overcome barriers. Based on their observations in Indonesian
provinces, they suggested, moreover, that local governments have to allocate funding to build REDD+
elements and institutions instead of purely relying on international partner institutions (Ekawati et al.,
2019). The same conclusions can be made for the focus area in this study.
Considering the rather limited success in achieving the BFCP’s objectives in Berau suggests that one of
the failures of the REDD+ project was the setting of unrealistic and too ambitious objectives within a
period of only five years. This becomes especially apparent when considering that the success would
have required involving the non-forestry sector and engaging the governmental level, for example, in
better land-use planning. This would have required breaking long standing traditions and power
relations. That the expectations of the BFCP were unrealistic, was also acknowledged by BFCP project
proponents (Hovani et al., 2018). However, despite these lessons from past failures, the new ER Program
is again expected to achieve (gross) emission reductions of 86.3 million tCO2e within a period of only
five years (2020-2024) (RoI, 2019). “Close to half of this is expected to come from reduced deforestation
within areas allocated to estate crops” (RoI, 2019, p. 3). Such plans require the involvement of the
agriculture sector. While this is a reasonable strategy and coincides with the recommendations of this
study, the given time frame of, again, only four years can be seen critically. That is because findings of

Chapter 6: Discussion
152
this study showed that the inclusion of the non-forestry sector within the first six years proofed to be
difficult on the provincial and district level.
From the above-mentioned hindrances, as well as from the findings of the other research questions of
this study, the following lessons can be drawn. A central requirement for the success of REDD+ in the
focus area will be inevitably to overcome the barriers to a wider political support beyond the political
leader. Involving and improving the understanding of subnational government stakeholders that hold
decision-making power is thereby fundamental.
Findings moreover show that it will be important to institutionalize and integrate REDD+ strategies and
measures into regional development and spatial plans. Otherwise REDD+ will keep suffering from a
lack of state budget, continue to rely on donor agencies and their agendas, and consequently remain an
unstable process that could be eliminated after the next election.
There is a need for stronger coordination and guidance to align the activities to REDD+ related strategies
and ER targets and a need to strengthen REDD+ related institutions in the focus area.
Engaging the private sector in more sustainable practices, especially those actors from the industrial
sectors that rely on the conversion of forests and influence policy on the subnational level – which is
related to the low autonomy of the governmental level from other sectors that drive deforestation – will
be necessary. Both issues will require more guidance and support from the national level.
Not all of the factors that restricted the REDD+ readiness process in the focus area can, however, be
equally addressed. In particular hindrances that relate to the institutional setting, but also factors like the
‘lack of autonomy from other sectors’, are aspects that likely require broader changes. The reason for
this is that these aspects often relate to political traditions and regimes, that is, “the set of procedures
determining the distribution of power” (Luttrell et al., 2014, p. 68), that are less likely to be turned into
opportunities in a timely manner. Similarly, capacity gaps at the very local level will likely not change
rapidly given the vastness of the Indonesian country.
For any intervention on the local level in Indonesia, it is, therefore, necessary to take into account the
capacity gap between the national and subnational level, but also the potential gap among provinces and
districts. In regions where no infrastructure of conservation projects, organisations and human and
financial capacity pre-exists, REDD+ short-term projects are less likely to achieve results in a timely
manner. This is because the development of enabling conditions will take several years and, therefore,
likely exceed the actual project timeframe. Building on the long-term presence of technical facilitators
to establish trust and increase the understanding of local processes instead of rushing short-term projects
might, therefore, be an option.
Besides those factors that hampered the subnational REDD+ process, a number of factors that drove the
process in the focus area were identified. Among those were very region-specific aspects like the
geographical and economical setting of East Kalimantan and Berau.
Remarkable was the already existing human capital and human resources established through the
University of Samarinda, the related existing informal network of civil society, academia and the private
sector and the already initiated conservation activities in the focus area on both levels. These aspects
highly influenced and drove the REDD+ readiness process in the focus area. These observations are
supported by findings of Anderson (2016) that studied new forms of environmental governance in East
Kalimantan, and concluded that the forestry faculty in Samarinda had played a critical role in forming a
strong civil society. This indicates that cooperation between institutions, schools, (international)
universities and organisations and the formation and extension of new and existing networks are
promising measures to foster the implementation of SFM through forest-based approaches.
However, results in this study also reveal that a civil society-driven process alone is insufficient in
achieving REDD+ objectives.
Based on study results, the formation of new coalitions and actors, the commitment to REDD+ by
political leaders and the promise of new funding and resources to implement provincial strategies can
also help to accelerate the REDD+ process on the subnational level.

Chapter 6: Discussion
153
However, Korhonen-Kurki et al. (2018) also concluded from their comparative study of several
countries (including Indonesia) that one aspect would likely not be sufficient to drive policy change.
Regarding the interplay of the driving forces in the focus area, this will likely also hold true for East
Kalimantan and Berau.
This study has made a first attempt to identify forces that drove and hindered the REDD+ process on
the subnational level. However, lessons from other subnational jurisdictions would now be desirable to
identify common factors that drive policy processes of forest-based approaches on the subnational level.
6.7 The methodological approach and its limitations
In this study a methodological framework was developed and tested to investigate the implementation
of SFM through recent forest-based approaches (FbAs) on the subnational level. The framework
included the triangulation of the following methods and data sources:
- REDD+ and FLEGT-VPA related evaluation, policy and project documents
- Semi-structured in-depth interviews with REDD+ and FLEGT stakeholders
- Field observations involving informal discussions with stakeholders and key informants, natural
forest concession and FMU visits and a plywood company guided tour
- Remote sensing data
- Content analysis
- Forest loss analysis on various levels and in different land use classes and permits
The triangulation approach aimed at cancelling out the weakness of each individual method and data
source and validate their findings. For the analysis of the different data sources, different analytical
frameworks were chosen and applied. For the identification of the achievements of REDD+ and FLEGT-
VPA relevant for SFM, the SFM criteria framework by ITTO (ITTO, 2016) was applied. For the analysis
of the driving forces and hindrances of REDD+, an evaluative framework had been developed based on
a literature review of factors that drove and hampered the national REDD+ process.
It could be shown that the analytical frameworks were valid to investigate the study objectives. It was
shown that the triangulation of different methods and data sources could supplement each other and help
to better understand the contribution of FbAs towards SFM. This was especially apparent for the aspect
of ‘sustaining forest resources’ where the findings of the forest loss analysis complemented findings of
the document and interview analysis.
The ITTO analytical framework proved useful for structuring the REDD+ and FLEGT-VPA
achievements and targeting the various elements of SFM. The adoption of the driving forces and
hindrances derived from research on the national level, moreover, demonstrated that these were largely
adequate for the subnational level. Based on the study findings, the framework could, however, be
modified for the subnational level in the focus area. To draw reliable conclusions for such a modification
would now require an extension to and comparison with other provinces.
One data source for the analysis of REDD+ and FLEGT-VPA achievements were semi-structured in-
depth interviews. It was decided to use broad interview questions. Interviews, therefore, referred to
REDD+ and FLEGT-VPA achievements and their challenges in general. Questions were, where
necessary, specified during the interview process. Reported achievements and other relevant aspects
were then later translated to the context of SFM by the study’s author. This was in line with the objective
to capture respondents’ perceptions on the major accomplishments of REDD+ and FLEGT-VPA, but
might have implied that respondents ‘only’ thought of the main aspects of REDD+ and FLEGT-VPA,
namely reducing emissions from deforestation’ and ‘illegal logging’, rather than of its co-benefits. One
reason for the limited findings and clarity about certain outcomes in relation to some SFM elements, for
example those related to biodiversity and the soil and water function, might have thus been that it was
not specifically asked for. To ensure that no aspects were missed, the interviews were supplemented by
document and remote sensing data analysis.

Chapter 6: Discussion
154
Apart from those limitations that refer to the conceptualization of the study, there exit limitations in
terms of the generalization of the results. The more local the research scale, the more influential are
local factors and the more decreases the transferability of findings to other areas and regions. Research
in this study was carried out on the subnational level with a focus on the Province of East Kalimantan
and the Berau District. Results are, therefore, based on the local conditions of the focus area. Translating
and comparing the results can, therefore, only be done with caution and by taking into account the
different conditions of other regions.
For example, on the concession level the outstanding forest loss in one single forest concession screwed
the total forest loss of the concession area covered by the 18 concessions under investigation.
To derive more general conclusions, all methodological approaches, that is, the forest loss analysis and
document and interview analysis need to be extended/increased to other provinces and districts and
preferably also to other REDD+ programs and projects in and FLEGT-VPAs with other countries.
The forest area definition has a significant impact on the forest cover base map which potentially
explains differences in findings of other studies. This was already discussed under 6.3. It could, however,
be shown that the forest loss trends observed in this study are very similar to other studies that had
undertaken similar analysis in the focus area.
In this study the contribution of REDD+ and FLEGT-VPA processes in the focus area was assessed
based on the outputs and outcomes that were achieved under both processes. Impacts are only to be
expected after 10 years or more and could, therefore, not be studied. Some recent but very promising
developments, for example, the evaluation of Berau’s spatial plan whose outcomes might have only
been visible after the data collection was undertaken, could, therefore, not be included.
Apart from these issues there are also limitations specific to the single methods. To investigate the
effects of REDD+ and FLEGT-VPA processes on a reduction in forest loss, this study analyzed forest
loss dynamics in the jurisdictions of East Kalimantan province and the Berau District and in forest
concessions in Berau. Special attention was given to different land use classes and permits in Berau.
Based on the argumentation of Blackman et al. (2015), the analysis on the concession level faces the
following limitations. First, this study analysed the forest loss within the HA area in Berau but was not
able to test for the certification schemes’ effects on forest degradation. Second, the analysis was carried
out on the concession level and not on the harvest stand level. As such it was not possible to directly
make statements about the effects of the certifications on the harvesting zones.
There were, moreover, limitations in terms of the drivers of forest loss. Statements about the drivers of
forest loss in this study were drawn from the current/latest land use class and permit for the area in which
the forest loss occurred. It is, however, acknowledged that the driver that provoked the forest loss in the
first place could have been different from the current land use permit in cases where there existed an
earlier land use permit for the same area. Similarly, overlapping land use permits made it difficult to
make statements about the actual drivers of forest loss. In such cases, ground-checking would be
required.
These results show that in countries with frequent overlapping land use permits and land use claims, the
use of remote sensing data has its limits when not supplemented with other data sources.
This study used the best available data to investigate the impact of FLEGT-related certifications on
forest loss. However, the analysis was impeded by a lack of data on necessary variables. First, there was
not one single database that provided comprehensive information on the date concessions in Berau
obtained their first certification. For this reason, information on certifications were among others
obtained from audit company websites and the certifications they provided there. Depending on the audit
company, issued certificates varied widely in regards of the information they displayed. Some only
showed the current certification date, others the date the first certification was obtained. In individual
cases, information on the certification history was, therefore, missing and other sources, like concession
lists, needed to be consulted. This process was very time consuming and might involve inaccuracies in
cases those lists were not reliable.

Chapter 6: Discussion
155
For matters of transparency, FLEGT-VPA-related certificates should display the certification history
and provide uniform information.
Second, the BPKH wilayah IV Samarinda concession spatial data set only provided information about
the current concession permit although in some cases this permit was a renewal of a former permit.
Unfortunately, the study’s author had no access to a comprehensive concession lists that contained
information on the history of forest permits. As most of the permits were already issued before (or in)
2001 when the study period began, most calculations were not affected by this. For those concessions
with a permit obtained after 2001, the study’s author cross-checked other concession lists to determine
if the recent permit was only a renewal. Because of the multiple data sources, some inaccuracies might
have been introduced related to the reliability of these sources. However, only four recent concession
permits were issued after 2001. Trends and results should, therefore, not have been affected
substantially.
Through the use of in-depth interviews and a document analysis, this study gathered existing knowledge
to investigate how REDD+ and FLEGT-VPA contributed towards SFM in the focus area.
In-depth interviews can provide detailed information on a program or process, but they are usually very
time consuming. For reasons of time resources, interviews were limited in their number and restricted
to some stakeholder groups. The governmental level was underrepresented in this study, especially in
the FLEGT interviews.
Findings from interviews are generally drawn from the subjective experience, knowledge and perception
of the interviewee and the person who analyzes them. To minimize potential perception bias, validation
steps were undertaken. They are described and discussed in chapter 4.5.2. They likewise apply to the
use of grey literature.

Chapter 7: Conclusion
156
7 Conclusion
Forest-based approaches (FbAs) like REDD+ and FLEGT aim to foster the implementation of SFM.
This study offers important new insights into the debate on how REDD+ and FLEGT-VPAs interlink
with the holistic concept of SFM on the ground.
Results show that REDD+ and FLEGT have different strengths and weaknesses in terms of SFM on the
subnational level. While FLEGT-VPA showed stronger limitations and even contradicted with the
concept of SFM, REDD+ showed initial achievements in terms of influencing subnational forest
governance, but its implementation on the subnational level faced several barriers.
The following implications to fostering SFM on the subnational level through FbAs like REDD+ and
FLEGT-VPAs can be drawn from the results.
Results showed that achieving SFM related agreements through FbAs on the national level is only the
first step towards their achievement on the ground. In practice, their implementation requires the
consideration of regional circumstances, especially the region-specific drivers of forest loss. Unless
these sources are addressed, no FbA will be able to ensure sustainable forest management.
In the focus area, this means that forest losses associated with the non-forestry and plantation sectors
– especially in those areas for which land use permits are already approved – need to be addressed by
involving respective actors. Improving the regional spatial planning process, matching the official forest
and non-forest land-use classification to the actual forest cover and clarifying overlapping land use
permits will be, moreover, important. Indonesian law provides the basis for such an improvement where
the swap of forested and non-forested land is possible.
Because these issues of land-use governance cannot be achieved on a village scale, jurisdictional
approaches appear generally better suited for approaches like REDD+ (projects) under similar
conditions.
Policymakers and practitioners must acknowledge these issues and address the remaining gaps. One
way to do so, is the integration of related strategies into regional development plans. Key to the success
of these processes will be the engagement with subnational governments in order to gain their support
and ownership in FbAs like REDD+ and equipping relevant institutions with more resources. Identifying
and using existing networks and supporting their extension can, moreover, be an opportunity for FbAs
aiming to promote SFM. Against this background, it will be important to strengthen local universities
and research centres to increase the pool of potential “champions”. Similarly, expanded cooperation
between national and international universities, the technical and financial support of local institutions
and working groups as well as the support in developing networks among stakeholders (academia,
organizations, private sectors, government) is recommended.
Findings specific to REDD+ imply that REDD+ has the potential to push (ongoing) policy reforms on
the subnational level that are integral for SFM, but that such processes require time and resources.
Upscaling activities that have been successful on a pilot stage and securing financial resources for this
will now be important aspects to be addressed by policymakers.
Study findings specific to FLEGT-VPA demonstrated that FLEGT-VPA’s ability to conserve tropical
forests is – due to its sole focus on timber legality – limited and that VPAs can even reinforce
unsustainable – sometimes longstanding – practices when they do not consider the existing legal forestry
framework of a country. Policymakers therefore need to acknowledge that, to ensure sustainability and
contribute to forest loss reduction in natural forest concession boundaries, also requires questioning the
practices enforced through VPAs in terms of their sustainability. In the case of Indonesia, study results
indicate that the TLAS and its related PHPL standards need to be revised in order to guarantee that legal
timber also complies with sustainability, even though this will ultimately reduce national sovereignty.
Policymakers also need to consider the need for greater transparency regarding the amount of traded
timber that stems from forest conversion under a VPA. This would ultimately bring more clarity into
the amount of legal but unsustainable timber traded to the European market.
Beyond that, it will be crucial to re-consider the actual potential of VPAs – and their legal timber
verification systems – to reduce illegal logging in a timber producing country. Results revealed that
large market segments, namely the domestic market, fall out of the scope of the Indonesian TLAS

Chapter 7: Conclusion
157
despite commitments to implement the TLAS there. This severely limits the VPA’s overall potential to
reduce illegal logging.
This study moreover demonstrated that the stipulated objectives of the EU FLEGT Action Plan and the
Indonesian VPA lacked a clear follow up of policy measures. Examples related to the clarity of land
tenure and the mentioned implementation of the TLAS on the domestic market. To achieve those and
related objectives of forest governance on the subnational level, new policy measures under the VPA
are required. Those may among other things involve stronger certification standards and the allocation
of resources aimed to improve land use governance on the subnational level.
Given these inferences, FLEGT may contribute more effectively towards SFM in countries where SFM
is anchored in and enforced through national law, where (legal) forest conversion is not a major concern
to forests and where the domestic timber market is not as relevant. In other words, in countries that are
less urgently in need of systems to address illegal logging.
To better understand the limitations and potentials of forest-based approaches like REDD+ and FLEGT
in terms of SFM, future research should focus more on the subnational and management level.
Specifically, research should focus on the outcomes and impacts of VPA-related certification schemes
in terms of their main objectives of improving forest management and reducing illegal logging and
related trade. More information is also needed on the effects of REDD+ on local socio-economic
benefits. Supplementing the use of satellite data with ground checking may be applied as a method to
analyze the occurrence of forest loss where land use permits overlap.
The above-mentioned implications and gaps need to be acknowledged and addressed so that approaches
like REDD+ and FLEGT can meet their potential in terms of SFM and benefit from and supplement
each other. Study findings imply, however, that broader governance reforms to promoting sustainability
are needed, because the individual approaches currently in place lack the capacity to resolve the many
identified gaps on their own. Furthermore, the fostering of processes and value chains that do not rely
on the exploitation of natural resources could prove highly advantageous.

References
158
References
Abood, S. A., Lee, J. S. H., Burivalova, Z., Garcia-Ulloa, J., & Koh, L. P. (2015). Relative
Contributions of the Logging, Fiber, Oil Palm, and Mining Industries to Forest Loss in Indonesia.
Conservation Letters, 8(1), 58–67. https://doi.org/10.1111/conl.12103
Anderson, Z. R. (2016). Assembling the ‘Field’: Conducting Research in Indonesia’s Emerging Green
Economy. ASEAS – Austrian Journal of South-East Asian Studies, 9(1), 172–180.
https://doi.org/10.14764/10.ASEAS-2016.1-11
Anderson, Z. R., Kusters, K., McCarthy, J., & Obidzinski, K. (2016). Green growth rhetoric versus
reality: Insights from Indonesia. Global Environmental Change, 38, 30–40.
https://doi.org/10.1016/j.gloenvcha.2016.02.008
Angelsen, A., Brockhaus, M., Sunderlin, W. D., & Verchot, L. (2012). Analysing REDD+: Challenges
and choices. Center for International Forestry Research. https://doi.org/10.17528/cifor/003805
Angelsen, A., Martius, C., Sy, V. de, Duchelle, A. E., Larson, A. M., & Pham, T. T. (Eds.). (2018).
Transforming REDD+: Lessons and new directions. Center for International Forestry Research
(CIFOR).
Anti Forest-Mafia Coalition. (2014). SVLK Flawed: An independent evaluation of Indonesia's Timber
Legality Certification System. Anti Forest-Mafia Coalition. http://www.eyesontheforest.or.id
Anti Forest-Mafia Coalition, & Forest Trends. (2015). Indonesia's Legal Timber Supply Gap and
Implications for Expansion of Milling Capacity: A Review of the Road Map for the Revitalization of
the Forest Industry, Phase 1.
Arts, B., Ingram, V., & Brockhaus, M. (2019). The Performance of REDD+: From Global Governance
to Local Practices. Forests, 10(10), 837. https://doi.org/10.3390/f10100837
Astuti, R., & McGregor, A. (2015a). Governing carbon, transforming forest politics: A case study of
Indonesia's REDD+ Task Force. Asia Pacific Viewpoint, 56(1), 21–36.
https://doi.org/10.1111/apv.12087
Astuti, R., & McGregor, A. (2015b). Responding to the green economy: How REDD+ and the One Map
Initiative are transforming forest governance in Indonesia. Third World Quarterly, 36(12), 2273–
2293. https://doi.org/10.1080/01436597.2015.1082422
Astuti, R., & McGregor, A. (2016). Indigenous land claims or green grabs? Inclusions and exclusions
within forest carbon politics in Indonesia. The Journal of Peasant Studies, 44(2), 445–466.
https://doi.org/10.1080/03066150.2016.1197908
Austin, K., Alisjahbana, A., Darusman, T., Boediono, R., Budianto, B., Purba, C., Indrarto, G.,
Pohnan, E., Putraditama, A., & Stolle, F. (2014). Indonesia's Forest Moratorium: Impacts and Next
Steps (Working Paper). Washington, DC. www.wri.org https://doi.org/10.13140/RG.2.1.1711.3365
Barbier, E. B., & Tesfaw, A. T. (2012). Can REDD+ Save the Forest? The Role of Payments and
Tenure. Forests, 3(4), 881–895. https://doi.org/10.3390/f3040881
Bartley, T. (2014). Transnational governance and the re-centered state: Sustainability or legality?
Regulation & Governance, 8(1), 93–109. https://doi.org/10.1111/rego.12051
Bastos Lima, M. G., Kissinger, G., Visseren-Hamakers, I. J., Braña-Varela, J., & Gupta, A. (2017). The
Sustainable Development Goals and REDD+: Assessing institutional interactions and the pursuit of
synergies. International Environmental Agreements: Politics, Law and Economics, 17(4), 589–606.
https://doi.org/10.1007/s10784-017-9366-9
Berau REDD+ Working Group. (2011). BERAU Forest Carbon Program 2011-2015: Berau Forest for
the world. Berau, Indonesia.

References
159
Blackman, A., Goff, L. T., & Rivera-Planter, M. (2015). Does Eco-Certification Stem Tropical
Deforestation? Forest Stewardship Council Certification in Mexico. SSRN Electronic Journal.
Advance online publication. https://doi.org/10.2139/ssrn.2646605
Boer, H. (2017). Welfare environmentality and REDD+ incentives in Indonesia. Journal of
Environmental Policy & Planning, 1–15. https://doi.org/10.1080/1523908X.2017.1292872
Bos, A. B., Duchelle, A. E., Angelsen, A., Avitabile, V., Sy, V. de, Herold, M., Joseph, S., Sassi, C. de,
Sills, E., Sunderlin, W. D., & Wunder, S. (2017). Comparing methods for assessing the effectiveness
of subnational REDD+ initiatives. Environmental Research Letters, 12(7), 74007.
https://doi.org/10.1088/1748-9326/aa7032
Boyce, C., & Neale, P. (2006). Conducting in-depth interviews: A guide for designing and conducting
in-depth interviews for evaluation inputs. Pathfinder International Tool Series Monitoring and
Evaluation: Vol. 2. Pathfinder International.
Brockhaus, M., Korhonen-Kurki, K., Sehring, J., Di Gregorio, M., Assembe-Mvondo, S., Babon, A.,
Bekele, M., Gebara, M. F., Khatri, D. B., Kambire, H., Kengoum, F., Kweka, D., Menton, M.,
Moeliono, M., Paudel, N. S., Pham, T. T., Resosudarmo, I. A. P., Sitoe, A., Wunder, S., & Zida, M.
(2016). REDD+, transformational change and the promise of performance-based payments: A
qualitative comparative analysis. Climate Policy, 17(6), 708–730.
https://doi.org/10.1080/14693062.2016.1169392
Bupati Berau. (2009). Keputusan Bupati Berau No. 716 Tahun 2009 tentang Pembentukan Kelompok
Kerja Reducing Emission from deforestation and degradation (Pokja REDD) di Kabupaten Berau:
Regent Decision Berau on the Formation of Working Group (Pokja REDD) in Berau District).
Tanjung Redep.
Casson, A., Muliastra, Y. I., & Obidzinski, K. (2014). Large-scale plantations, bioenergy developments
and land use change in Indonesia. Center for International Forestry Research (CIFOR).
https://doi.org/10.17528/cifor/005434
Casson, A., Muliastra, Y. I., & Obidzinski, K. (2015). Land-based investment and green development
in Indonesia: Lessons from Berau district, East Kalimantan. Center for International Forestry
Research (CIFOR). https://doi.org/10.17528/cifor/005538
CDM International Inc., & Hatfield Consultants Partnership. (2014). Berau District Rapid District
Readiness Assessment (RDRA) for participation in MCA-Indonesia's green prosperity project.
Coordinating Ministry for Economic Affairs, Republic of Indonesia. (2011). Masterplan: Acceleration
and Expansion of Indonesia Economic Development 2011-2015. Jakarta, Indonesia.
Cosslett, C. E. (2013). Understanding the potential impacts of REDD+ on the financing and
achievement of sustainable forest management: A report prepared for the Secretariat of the United
Nations Forum on Forests (UNFFS).
https://pdfs.semanticscholar.org/d19e/8f402c09dea25fb1ae3b1f8f46a69472c6c8.pdf?_ga=2.22959
2668.1766449238.1548251397-39967072.1548251397 (Environment Strategies International,
LLC).
The Council of the European Union. (2003). Council Conclusion: Forest Law Enforcement, Governance
and Trade (FLEGT) (2003/C 268/01).
Cowling, P., DeValue, K., & Rosenbaum, K. (2014). Assessing Forest Governance: A Practical Guide
to Data Collection, Analysis, and Use. Washington DC. PROFOR; FAO.
Creswell, J. W. (2007). Qualitative Inquiry & Research Design: Choosing Among Five Approaches.
Second Edition (2nd ed.). SAGE Publications, Inc.
Director General of Sustainable Production Forest Management. (2016). Peraturan Direktur Jenderal
Pengelolaan Hutan Produksi Lestari Nomor: P.14/PHPL/Set/4/2016 (Regulation of the Director
General of Sustainable Production Forest Management Number: P.14/PHPL/Set/4/2016): Standar

References
160
dan Pedoman Pelaksanaan Penilaian Kinerja Pengelolaan Hutan Produksi Lestari (PHPL) dan
Verifikasi Legalitas Kayu (VLK) (Standards and Guidelines for Implementing Performance
Assessment of Management of Sustainable Production Forest (PHPL) and Verification of Wood
Legality (VLK)). Jakarta, Indonesia.
DNPI, & Government of East Kalimantan. (2010). East Kalimantan Environmentally Sustainable
Development Strategy: Draft.
Duchelle, A. E., Seymour, F., Brockhaus, M., Angelsen, A., Larson, A., Moeliono, M., Wong, G.,
Pham, T. T., & Martius, C. (2018). REDD+: Lessons from national and subnational implementation
(Working Paper). Washington DC. World Resources Institute.
Duchelle, A. E., Simonet, G., Sunderlin, W. D., & Wunder, S. (2018). What is REDD+ achieving on
the ground? Current Opinion in Environmental Sustainability, 32, 134–140.
https://doi.org/10.1016/j.cosust.2018.07.001
Eikermann, A. (2015). The Options for an International Regulation of Forests. In A. Eikermann (Ed.),
Forests in International Law: Is There Really a Need for an International Forest Convention? (1st
ed., pp. 135–181). Springer International Publishing.
Ekadinata, A., Rahmanulloh, A., Pambudhi, F., Ibrahin, I., van Noordwijk, M., Sofiyuddin, M.,
Sardjono, M. A., Dewi, S., Budidarsono, S., & Said, Z. (2010). Carbon Emissions from Land Use,
Land Use Change and Forestry (LULUCF) in Berau District East Kalimantan, Indonesia. Bogor,
Indonesia. World Agroforestry Centre (ICRAF).
Ekawati, S., Subarudi, Budiningsih, K., Sari, G. K., & Muttaqin, M. Z. (2019). Policies affecting the
implementation of REDD+ in Indonesia (cases in Papua, Riau and Central Kalimantan). Forest
Policy and Economics, 108, 101939. https://doi.org/10.1016/j.forpol.2019.05.025
ESRI. (2019). ArcGIS for Desktop (Version 10.4.1. 5686) [Computer software]. esri.com
European Commission. (2003). Forest Law Enforcement, Governance and Trade (FLEGT): Proposal
for an EU Action Plan. Brussels.
European Commission. (2007). FLEGT Briefing Notes: Guidelines for Independent Monitoring
(Briefing Note No. 7).
European Commission. (2015). Commission Decision (EU) 2015/1158: on the position to be taken by
the Commission, on behalf of the European Union, in the Joint Implementation Committee set up by
the Voluntary Partnership Agreement between the European Union and the Republic of Indonesia
on Forest Law Enforcement, Governance and Trade in timber products into the European Union as
regards the amendments to the Annexes I, II, and V of the Voluntary Partnership Agreement between
the European Union and the Republic of Indonesia. Brussels. European Commission.
European Parliament, & The Council of the European Union. (2010). Regulation (EU) No 995/2010:
laying down the obligations of operators who place timber and timber products on the market.
Strasbourg.
European Union. (2014). Voluntary Partnership Agreement between the European Union and the
Republic of Indonesia on forest law enforcement, governance and trade in timber products into the
European Union. Brussels.
Faggin, J. M., & Behagel, J. H. (2017). Translating Sustainable Forest Management from the global to
the domestic sphere: The case of Brazil. Forest Policy and Economics, 85, 22–31.
https://doi.org/10.1016/j.forpol.2017.08.012
Fauna & Flora International. (2017). Community Forests for Climate, People, and Wildlife Hutan Desa
Durian Rambun, Jambi (Plan Vivo Project Design Document).
Federal Ministry for Economic Cooperation and Development. (2007). FLEGT: Combating illegal
logging as a contribution towards sustainable development (Topics No. 180). Bonn, Germany.

References
161
Fishbein, G., & Lee, D. (2015). Early Lessons from Jurisdictional REDD+ and Low Emissions
Development Programs. Arlington, USA.
Food and Agriculture Organization. (2005). State Of The World's Forests 2005. Rome, Italy. FAO.
http://www.fao.org/forestry/site/sofo/en
Food and Agriculture Organization. (2010). Global Forst Resources Assessment 2010: Main Report
(Forestry Paper No. 163). Rome, Italy. FAO.
Food and Agriculture Organization. (2015). Global Forest Resources Assessment 2015: Desk Reference.
Rome, Italy. FAO.
Food and Agriculture Organization. (2020). Global Forest Resources Assessment 2020: Key findings.
Rome, Italy. https://doi.org/10.4060/ca8753en
Forest Stewardship Council. (2015). FSC International Standard: FSC Principles and Criteria for forest
stewardship. Bonn, Germany. FSC. https://doi.org/10.4337/9781781000625.00010
Gardner, T. A., Ferreira, J., Barlow, J., Lees, A. C., Parry, L., Vieira, I. C. G., Berenguer, E.,
Abramovay, R., Aleixo, A., Andretti, C., Aragão, L. E. O. C., Araújo, I., Ávila, W. S. de,
Bardgett, R. D., Batistella, M., Begotti, R. A., Beldini, T., Blas, D. E. de, Braga, R. F., . . .
Zuanon, J. (2013). A social and ecological assessment of tropical land uses at multiple scales: The
Sustainable Amazon Network. Philosophical Transactions of the Royal Society of London.
Biological Sciences, 368, 20120166. https://doi.org/10.1098/rstb.2012.0166
Gaveau, D. L. A., Locatelli, B., Salim, M. A., Yaen, H., Pacheco, P., & Sheil, D. (2018). Rise and fall
of forest loss and industrial plantations in Borneo (2000-2017). Conservation Letters, 44, e12622.
https://doi.org/10.1111/conl.12622
Gaveau, D. L. A., Salim, M. A., & Arjasakusuma, S. (2016). Deforestation and industrial plantations
development in Borneo (No. 2.1). Center for International Forestry Research (CIFOR).
https://data.cifor.org/dataset.xhtml?persistentId=doi:10.17528/CIFOR/DATA.00049
Giessen, L. (2013). Reviewing the main characteristics of the international forest regime complex and
partial explanations for its fragmentation. International Forestry Review, 15(1), 60–70.
https://doi.org/10.1505/146554813805927192
Giessen, L., & Buttoud, G. (2014). Defining and assessing forest governance. Forest Policy and
Economics, 49, 1–3. https://doi.org/10.1016/j.forpol.2014.11.009
Gokkon, B. (2018). Indonesia to strengthen environmental impact assessments through process review.
Mongabay. https://news.mongabay.com/2018/01/indonesia-to-strengthen-environmental-impact-
assessments-through-process-review/
Government of East Kalimantan. (2010). Kaltim Hijau (Green East Kalimantan declaration).
Samarinda, Indonesia.
Government of East Kalimantan. (2012). Strategi dan Rencana Aksi Provinsi (SRAP) implementasi
REDD+ Kaltim (Provincial Strategy and Action Plan (SRAP) implementation of REDD+ East
Kalimantan). Samarinda, Indonesia.
Government of East Kalimantan. (2014). Regulation of the Governor of Kalimantan Timur No. 39 Year
2014: Rencana Aksi Daerah Penurunan Emisi Gas Rumah Kaca Provinsi Kalimantan Timur
(Regional action plan for reduction of greenhouse gas emission in East Kalimantan Province).
Samarinda, Indonesia.
Government of Indonesia. (2010). Government Regulation No. 10/2010: The procedure of altering the
appropriation and function of forest areas (Business News 7929/3-12-2010).
https://www.ecolex.org/details/legislation/government-regulation-no-102010-on-the-procedure-of-
altering-the-appropriation-and-function-of-forest-areas-lex-faoc097651/
Government of Indonesia. (2014). Emission Redcutions Program Idea Note (ER-PIN): Indonesia
District Level REDD+ ER Program. Forest Carbon Partnership Facility (FCPF) Carbon Fund.

References
162
Government of the Kingdom of Norway, & Republic of Indonesia. (2010). Letter of Intent between the
Government of the Kingdom of Norway and the Government of the Republic of Indonesia:
Cooperation on reducing greenhouse gas emisssions from deforestation and forest degradation.
Oslo, Norway.
Hajjar, R. (2015). Advancing small-scale forestry under FLEGT and REDD in Ghana. Forest Policy
and Economics, 58, 12–20. https://doi.org/10.1016/j.forpol.2014.09.014
Handayani, A. P. (2010). Oil Palm, Biodiversity and Indonesian Law: Part 1: Legal Review. Bogor,
Indonesia. Wildlife Conservation Society.
Hansen, C. P., Rutt, R., & Acheampong, E. (2018). ‘Experimental’ or business as usual? Implementing
the European Union Forest Law Enforcement, Governance and Trade (FLEGT) Voluntary
Partnership Agreement in Ghana. Forest Policy and Economics, 96, 75–82.
https://doi.org/10.1016/j.forpol.2018.08.012
Hansen, M. C., Potapov, P. V., Moore, R., Hancher, M., Turubanova, S., Tyukavina, A., Thau, D.,
Stehman, S. V., Goetz, S. J., Loveland, T. R., Kommareddy, A., Egorov, A., Chini, L.,
Justice, C. O., & Townshend, J. R. G. (2013). High-resolution global maps of 21st-century forest
cover change. Science, 342(6160), 850–853. https://doi.org/10.1126/science.1244693
Hentschel, G., & Fripp, E. (2013). V-Legal/FLEGT shipment test: Lessons learned from the EU visits
(Economicy Climate Environment). European Forest Institute (EFI).
Hovani, L. (unkown). Berau Forest Carbon Program (BFCP): Presentation.
Hovani, L., Varns, T., Hartanto, H., Rahman, S., Makinuddin, N., & Cortez, R. (2018). Jurisdictional
Approaches to Sustainable Landscapes: Berau and East Kalimantan, Indonesia. Arlington, USA.
The Nature Conservancy (TNC).
Howson, P. (2017). Intimate exclusions from the REDD+ forests of Sungai Lamandau, Indonesia.
Conservation and Society, 15(2), 125. https://doi.org/10.4103/0972-4923.204071
Indonesia, & European Union. (2015). Annual Report May 2014 - April 2015: Implementing the
Indonesia - EU FLEGT Voluntary Partnership Agreement.
Indonesia, & European Union (2017). Annual report May 2015 - Dec 2016: Implementation of the
Indonesia-EU FLEGT Voluntary Partnership Agreement.
Indonesian REDD+ Task Force. (2012). REDD+ National Strategy. Jakarta, Indonesia.
Inoue, M., Kawai, M., Imang, N., Terauchi, D., Pambudhi, F., & Sardjono, M. A. (2013). Implications
of local peoples' preferences in terms of income source and land use for Indonesia's national REDD-
plus policy: Evidence in East Kalimantan, Indonesia. International Journal of Environment and
Sustainable Development (IJESD), 12(3), 244. https://doi.org/10.1504/IJESD.2013.054951
International Tropical Timber Organization. (2016). Criteria and indicators for the sustainable
management of tropical forests. (ITTO Policy development series No. 21). Yokohama, Japan.
International Tropical Timber Organization (ITTO).
Jonsson, R., Giurca, A., Masiero, E. P., Pettenella, D., Prestemon, J., & Winkel, G. (2015). Assessment
of the EU Timber Regulation and FLEGT Action Plan. From Science to Policy 1. European Forest
Institute.
Kawai, M., Scheyvens, H., Samejima, H., Fujisaki, T., & Setyarso, A. (2017). Indonesia REDD+
Readiness: State of play - March 2017. Japan. Institute for Global Environmental Strategies (IGES).
https://pub.iges.or.jp/enja/system/files/publication_documents/pub/researchreport/6007/Indonesia%
20REDD%2B%20Readiness.pdf
Kohlbacher, F. (2016). The Use of Qualitative Content Analysis in Case Study Research. Forum:
Qualitative Social Research, 7(1), pp. 1-30.
Korhonen-Kurki, K., Brockhaus, M., Muharrom, E., Juhola, S., Moeliono, M., Maharani, C., &
Dwisatrio, B. (2017). Analyzing REDD+ as an experiment of transformative climate governance:

References
163
Insights from Indonesia. Environmental Science and Policy, 73, 61–70.
https://doi.org/10.1016/j.envsci.2017.03.014
Korhonen-Kurki, K., Brockhaus, M., Sehring, J., Di Gregorio, M., Assembe-Mvondo, S., Babon, A.,
Bekele, M., Benn, V., Gebara, M. F., Kambire, H. W., Kengoum, F., Maharani, C., Menton, M.,
Moeliono, M., Ochieng, R., Paudel, N. S., Pham, T. T., Dkamela, G. P., & Sitoe, A. (2018). What
drives policy change for REDD+? A qualitative comparative analysis of the interplay between
institutional and policy arena factors. Climate Policy, 73(10), 1–14.
https://doi.org/10.1080/14693062.2018.1507897
Korhonen-Kurki, K., Sehring, J., Brockhaus, M., & Di Gregorio, M. (2014). Enabling factors for
establishing REDD+ in a context of weak governance. Climate Policy, 14(2), 167–186.
https://doi.org/10.1080/14693062.2014.852022
Lawlor, K., Madeira, E., Blockhus, J., & Ganz, D. (2013). Community Participation and Benefits in
REDD+: A Review of Initial Outcomes and Lessons. Forests, 4(2), 296–318.
https://doi.org/10.3390/f4020296
Lesniewska, F., & McDermott, C. L. (2014). FLEGT VPAs: Laying a pathway to sustainability via
legality lessons from Ghana and Indonesia. Forest Policy and Economics, 48, 16–23.
https://doi.org/10.1016/j.forpol.2014.01.005
Loft, L., Pham, T. T., Wong, G. Y., Brockhaus, M., Le, D. N., Tjajadi, J. S., & Luttrell, C. (2016). Risks
to REDD+: Potential pitfalls for policy design and implementation. Environmental Conservation, 1–
12.
Luttrell, C., Obidzinski, K., Brockhaus, M., Muharrom, E., Petkova, E., Wardell, A., & Halperin, J.
(2011). Lessons for REDD+ from measures to control illegal logging in Indonesia (Working Paper
No. 74). Jakarta and Bogor, Indonesia. United Nations Office on Drugs and Crime; Center for
International Forestry Research (CIFOR). https://doi.org/10.17528/cifor/003505
Luttrell, C., Resosudarmo, I. A. P., Muharrom, E., Brockhaus, M., & Seymour, F. (2014). The political
context of REDD+ in Indonesia: Constituencies for change. Environmental Science and Policy, 35,
67–75. https://doi.org/10.1016/j.envsci.2012.10.001
Margono, B. A., Potapov, P. V., Turubanova, S., Stolle, F., & Hansen, M. C. (2014). Primary forest
cover loss in Indonesia over 2000–2012. Nature Climate Change, 4(8), 730–735.
https://doi.org/10.1038/nclimate2277
Margono, B. A., Turubanova, S., Zhuravleva, I., Potapov, P. V., Tyukavina, A., Baccini, A.,
Goetz, S. J., & Hansen, M. C. (2012). Mapping and monitoring deforestation and forest degradation
in Sumatra (Indonesia) using Landsat time series data sets from 1990 to 2010. Environmental
Research Letters, 7(3), 34010. https://doi.org/10.1088/1748-9326/7/3/034010
Margono, B. A., Usman, A. B., & Sugardiman, B. and R. A. (2016). Indonesia's Forest Resource
Monitoring. Indonesian Journal of Geography, 48(1), 7–20.
Marquardt, D. (2015). Forclime, CSO, NGO & stakeholder Directory 2015: Berau District. GIZ.
Maryudi, A., Kurniawan, H., Siswoko, B. D., Andayani, W., & Murdawa, B. (2017). What do forest
audits say? The Indonesian mandatory forest certification. International Forestry Review, 19(2),
170–179.
McDermott, C. L. (2014). REDDuced: From sustainability to legality to units of carbon—The search
for common interests in international forest governance. Environmental Science and Policy, 35, 12–
19. https://doi.org/10.1016/j.envsci.2012.08.012
Meridian, A., Minangsari, M., Hasyim, Z., Valentinus, A., Sari, N. A., Sutiah, U., & Kosar, M. (2014).
SVLK in the eyes of the monitoring: Independent Monitoring and a Review of the Implementation of
the Timber Legality Verification System, 2011-2013. Indonesia Independent Forestry Monitoring
Network (JPIK).

References
164
Meridian, A., Valentinus, A., Ferdyan, D. T., Minangsari, M., Kosar, M., Sari, N. A., & Hasyim, Z.
(2018). SVLK : A Process toward Accountable Governance: Monitoring by the Independent Forest
Monitoring Network (JPIK), 2014-2017. Indonesia Independent Forestry Monitoring Network
(JPIK).
Milbank, C., Coomes, D., & Vira, B. (2018). Assessing the Progress of REDD+ Projects towards the
Sustainable Development Goals. Forests, 9(10), 589. https://doi.org/10.3390/f9100589
Ministry of Environment and Forestry, & Republic of Indonesia. (2018). The State of Indonesia's
Forests 2018. Jakarta, Indonesia.
Ministry of Forestry (2009). Forest Carbon Partnership Facility (FCPF) R-Plan: May 2009.
Multi-Stakeholder Forestry Program. (2014a). Multistakeholder Forestry Programme 3. Jakarta,
Indonesia. MFP.
Multi-Stakeholder Forestry Program. (2014b). Project Completion Review: Multi-Stakeholder Forestry
Program 2 (MFP2) Transition. MFP.
Multi-Stakeholder Forestry Program. (2017). Annual Report. Multistakeholder Forestry Programme 3:
August 2015 - December 2016. Jakarta, Indonesia. MFP.
Mulyani, M., & Jepson, P. (2017). Does the ‘One Map Initiative’ Represent a New Path for Forest
Mapping in Indonesia? Assessing the Contribution of the REDD+ Initiative in Effecting Forest
Governance Reform. Forests, 8(1), 14. https://doi.org/10.3390/f8010014
Murdiyarso, D., Dewi, S., Lawrence, D., & Seymour, F. (2011). Indonesia's forest moratorium: A
stepping stone to better forest governance? (Working Paper No. 76). Bogor Barat, Indonesia. Center
for International Forestry Research (CIFOR). https://doi.org/10.17528/cifor/003561
Myers, R., Sanders, A. J., Larson, A., Prasti, H., & Ravikumar, A. (2016). Analyzing multilevel
governance in Indonesia: Lessons for REDD+ from the study of landuse change in Central and West
Kalimantan (Working Paper No. 202). Bogor Barat, Indonesia.
https://doi.org/10.17528/cifor/006058
National Development Planning Agency. (2011). Guideline for Implementing Green House Gas
Emission Reduction Action Plan: Translated English Version. Republic of Indonesia.
Neupane, P. R., Wiati, C. B., Angi, E. M., Köhl, M., Butarbutar, T., Reonaldus, & Gauli, A. (2019).
How REDD+ and FLEGT-VPA processes are contributing towards SFM in Indonesia - the
specialists' viewpoint. International Forestry Review, 21(4), 460–485.
Noor, F. (2016). Evaluasi Dampak Program Karbon Hutan Berau (PKBH) (Impact evaluation Berau
Forest Carbon Program (BFCP)).
Organisation for Economic Cooperation and Development. (2014). Measuring and managing results in
development co-operation: A review of challenges and practices among DAC members and
observers. Paric, France. OECD.
Overdevest, C., & Zeitlin, J. (2018). Experimentalism in transnational forest governance: Implementing
European Union Forest Law Enforcement, Governance and Trade (FLEGT) Voluntary Partnership
Agreements in Indonesia and Ghana. Regulation and Governance, 12(1), 64–87.
https://doi.org/10.1111/rego.12180
P3SEKPI. (2017). REDD+ Readiness Self-Assessment for Indonesia submitted to the Forest Carbon
Partnership Facility (FCPF). Bogor, Indonesia. Center for Research and Development on Social,
Economy, Policy and Climate Change (P3SEKPI), Forestry Research, Development, and Innovation
Agency, Ministry of Environment and Forestry (FORDIA, MoEF), Republic of Indonesia.
Paoli, G. D., Gillespie, P., Wells, P. L., Hovani, L., Sileuw, A. E., & Franklin, N. (2013). Oil Palm in
Indonesia: Governance, Decision Making and Implications for Sustainable Development. Jakarta,
Indonesia. The Nature Conservancy (TNC).

References
165
Paoli, G. D., Wells, P. L., Meijaard, E., Struebig, M. J., Marshall, A. J., Obidzinski, K., Tan, A.,
Rafiastanto, A., Yaap, B., Ferry Slik, J., Morel, A., Perumal, B., Wielaard, N., Husson, S., &
D'Arcy, L. (2010). Biodiversity Conservation in the REDD. Carbon Balance and Management, 5, 7.
https://doi.org/10.1186/1750-0680-5-7
Pokja REDD Berau. (2009a). Pokja REDD Updates (REDD+ Working Group Updates): June 2009
(Pokja REDD Updates No. 2).
Pokja REDD Berau. (2009b). Pokja REDD Updates (REDD+ Working Group Updates): May 2009
(Pokja REDD Updates No. 1).
Purba, C., Nanggara, S., Ratriyono, M., Apriani, I., Rosalina, L., Sari, N. A., & Meridian, A. (2014).
Potret Keasaan Hutan Indonesia: Periode 2009 - 2013. Forest Watch Indonesia.
Republic of Indonesia (2014). FCPF Carbon Fund: Emission Reduction Program Idea Note (ER-PIN).
Republic of Indonesia. (2016). Emission Reduction Program Idea Note (ERPIN): Towards a Greener
and Developed East Kalimantan: A provincial emission reduction program in Indonesia. Forest
Carbon Partnership Facility (FCPF) Carbon Fund.
Republic of Indonesia. (2018). FCPF Emission Reduction Program Document (ER-PD): East
Kalimantan Jurisdictional Emission Reductions Program, Indonesia. Forest Carbon Partnership
Facility (FCPF) Carbon Fund.
Republic of Indonesia. (May 2019). Emission Reductions Program Document (ER-PD): East
Kalimantan Jurisdictional Emission Reductions Program, Indonesia. Forest Carbon Partnership
Facility (FCPF) Carbon Fund.
Rimbawanto, A. (2006). Silviculture Systems of Indonesia's Dipterocarps Forest Management: A lesson
learned. Technical Report ITTO Project PD 41/00 Rev. 3 (F,M), 2006.
Rodríguez Fernández-Blanco, C., Burns, S. L., & Giessen, L. (2019). Mapping the fragmentation of the
international forest regime complex: Institutional elements, conflicts and synergies. International
Environmental Agreements: Politics, Law and Economics, 19(2), 187–205.
https://doi.org/10.1007/s10784-019-09434-x
Roessing Neto, E. (2015). REDD+ as a Tool of Global Forest Governance. The International Spectator,
50(1), 60–73. https://doi.org/10.1080/03932729.2015.983700
Romero, C., Putz, F. E., Sills, E., Guariguata, M. R., Maryudi, A., & Ruslandi. (2015). The context of
natural forest management and FSC certification in Indonesia (Occasional Paper No. 126). Bogor
Barat, Indonesia. Center for International Forestry Research (CIFOR).
https://doi.org/10.17528/cifor/005653
RStudio Team. (2019). RStudio: Integrated Development for R (Version 1.0.153) [Computer software].
RStudio, Inc. Boston, MA. rstudio.com
Ruslandi, Klassen, A., Romero, C., & Putz, F. E. (2014). Forest Steward Council certification of natural
forest management in Indonesia: Required improvements, costs, incentives, and barriers. In P. Katila,
G. Galloway, W. de Jong, P. Pacheco, & G. Mery (Eds.), IUFRO World Series: Vol. 32. Forests
under pressure: Local responses to global issues (pp. 255–273).
SEA Taskforce of Berau District. (2016). Strategic Environmental Assessment of Berau District’s
RPJMD 2016-2021.
Secco, L., Da Re, R., Pettenella, D., & Gatto, P. (2014). Why and how to measure forest governance at
local level: A set of indicators. Forest Policy and Economics, 49, 57–71.
https://doi.org/10.1016/j.forpol.2013.07.006
Shahab, N. (2016). Indonesia: One Map Policy: first edition (Open Government Partnership).
Sills, E. O., Atmadja, S., Sassi, C. de, Duchelle, A. E., Kweka, D., Resosudarmo, I. A. P., &
Sunderlin, W. D. (Eds.). (2014). REDD+ on the ground: A case book of subnational initiatives

References
166
across the globe. Center for International Forestry Research (CIFOR).
https://doi.org/10.17528/cifor/005202
Singer, B., & Giessen, L. (2017). Towards a donut regime? Domestic actors, climatization, and the
hollowing-out of the international forests regime in the Anthropocene. Forest Policy and Economics,
79, 69–79. https://doi.org/10.1016/j.forpol.2016.11.006
Sist, P., Nolan, T., Bertault, J.‑G., & Dykstra, D. (1998). Harvesting intensity versus sustainability in
Indonesia. Forest Ecology and Management, 108(3), 251–260. https://doi.org/10.1016/S0378-
1127(98)00228-X
Spitz, K., & Husin, Y. (2009). The AMDAL Process and the Equator Principles: Common themes and
apparent differences (Mining Indonesia 2009 Conference: Unlocking Mineral Potential). Jakarta,
Indonesia.
Sucofindo. (2018). First Annual Overview of the TLAS Operationality in Indonesia: Implementation
Report. Periodic Evaluation FLEGT VPA - Indonesia European Union. Jakarta, Indonesia.
Suparno, R., & Nurbaiti, A. (Eds.). (2018). Toward just and sustainable forestry in Indonesia: Lessons
learned from MFP3 experience in supporting the MoEF (2014-2018). The Jakarta Post Publishing.
Sutton, J., & Austin, Z. (2015). Qualitative Research: Data collection, Analysis and Management.
CJHP, 68(3).
Suwarno, A., & Hein, L. (2015). Governance, Decentralisation and Deforestation: The Case of Central
Kalimantan Province, Indonesia. Journal of International Agriculture, 54(1), 77–100.
Tegegne, Y. T., Cramm, M., & Brusselen, J. van (2018). Sustainable Forest Management, FLEGT, and
REDD+: Exploring Interlinkages to Strengthen Forest Policy Coherence. Sustainability, 10(12),
4841. https://doi.org/10.3390/su10124841
TEREA, S-FOR-S, & Topperspective. (2016). Evaluation of the EU FLEGT Action Plan (Forest Law
Enforcement Governance and Trade) 2004-2014: Final Report Volume 1 (Main Report).
TFCA Kalimantan (2015). FOKUS PROGRAM TFCA KALIMANTAN DI KABUPATEN BERAU
(PKHB) DALAM RANGKA PENDANAAN HIBAH SIKLUS 3, 2015: Program of TFCA
Kalimantan Cycle 3 in Berau.
TFCA Kalimantan. (2016). Laporan Tahunan 2015 (Annual Report 2015): TFCA Kalimantan. Jakarta,
Indonesia. Indonesian Biodiversity Conservation Trust Fund (KEHATI).
TFCA Kalimantan. (2017). Laporan Tahunan 2016 (Annual Report 2016). Jakarta, Indonesia.
Indonesian Biodiversity Conservation Trust Fund (KEHATI).
TFCA Kalimantan. (2018). Laporan Tahunan 2017 (Annual Report 2017). Indonesian Biodiversity
Conservation Trust Fund (KEHATI).
Tritsch, I., Le Velly, G., Mertens, B., Meyfroydt, P., Sannier, C., Makak, J.‑S., & Houngbedji, K.
(2019). Do Forest-Management Plans and FSC Certification reduce Deforestation in the Congo
Basin? (AFD Research Papers Series No. 104). Paric, France. French Development Agency (AFD).
Tropek, R., Sedláček, O., Beck, J., Keil, P., Musilová, Z., Símová, I., & Storch, D. (2014). Comment on
"High-resolution global maps of 21st-century forest cover change". Science, 344(6187), 981.
https://doi.org/10.1126/science.1248753
United Nations. (1992). Non-legally binding authoritative statement on principles for a global
consensus on the management, conservation and sustainable development of all types of forests. Rio
de Janeiro, Brazi.
United Nations. (2007). Resolution adopted by the General Assembly on 17 December 2007: 62/98.
Non-legally binding instrument on all types of forests.
United Nations Environment Programme. (2017). REDD+ Academy Learning Journal: Understanding
REDD+ and the UNFCCC. United Nations Environment Programme.

References
167
VERBI Software. (2019). MAXQDA Plus 12 (Version 12.3.6) [Computer software]. VERBI Software.
Berlin, Germany. maxqda.com
Wegscheider, S., Purwanto, J., Margono, B. A., Nugroho, S., Budiharto, B., Buchholz, G., &
Sudirman, R. A. (2018). Current achievements to reduce deforestation in Kalimantan. Indonesian
Journal of Geography, 50(2), 109–120. https://doi.org/10.22146/ijg.23680
Wells, P. L., & Paoli, G. D. (2011). An Analysis of Presidential Instruction No. 10, 2011: Moratorium
on Granting of New Licenses and Improvement of Natural Primary Forest and Peatland
Governance. Bogor, Indonesia. Daemeter Consulting.
Wilkie, M. L., Holmgren, P., & Castañeda, F. (2003). Sustainable Forest Management and the
Ecosystem Approach: Two concepts, one goal (Working Paper FM 25). Rome, Italy. FAO.
Yasman, I. (1998). Improving Silvicultural techniques for sustainable forest management in Indonesia:
The International Ministry of Forestry-Tropenbos-Kalimantan Project, Indonesia. Research in
Tropical Forests: Its Challenges for the Future.
Youn, Y.‑C., Choi, J., Jong, W. de, Liu, J., Park, M. S., Camacho, L. D., Tachibana, S.,
Huudung, N. D., Bhojvaid, P. P., Damayanti, E. K., Wanneng, P., & Othman, M. S. (2017).
Conditions of forest transition in Asian countries. Forest Policy and Economics, 76, 14–24.
https://doi.org/10.1016/j.forpol.2016.07.005

Annex I: List of interviewees
168
Annex I: List of interviewees
Table 30: List of consulted interviewees.
Approach Institution/
Organisation
Role of
interviewee
Initials of
interviewee
Stakeholder
group
Type of
interview
REDD+ University of
Wageningen Researcher R. R.
Academia/
research Structured
REDD+ CIFOR Research Officer C. M. Academia/
research Structured
REDD+/
Tenure
Working Group on
Forest Land Tenure Executive Director E. W.
Multistakeholder
forum Structured
REDD+ FORDA Researcher R. S. Academia/
research Structured
REDD+ DDPI
Head of the Center
for social forestry
studies; DDPI
MRV section head
F. P. Government
institution Structured
REDD+
University
Mulawarman;
DDPI;
Vice Rector of
Academic Affairs;
Head of REDD+
section of DDPI
M. A. S.
Academia/
research
Multistakholder
forum
Structured
REDD+ Independent
Consultant BFCP Evaluator F. Structured
REDD+ GIZ
(ForClime TC)
Advisor for SFM
and REDD+ T. B. CSO Structured
REDD+ TNC
Improved Forest
Management
Manager
B. W. CSO Structured
REDD+ GIZ
(ForClime TC)
District coordinator
Berau S. S. CSO Structured
REDD+ TNC Forest Management
Unit Specialist F. K. CSO Structured
REDD+ Operasi Wallecea
Terpadu (TFCA) local NGO S. CSO Structured
REDD+ Payo Payo (TFCA) local NGO A. CSO Structured
REDD+ GFA
(ForClime FC)
District Facilitator
Berau A. H. CSO Structured
REDD+ TNC
Green Growth
Compact Program
Leader at TNC;
Director at PT
Tropisindo
A. S. CSO Structured
REDD+ GIZ
(ForClime TC)
Program Director
Forest and Climate
Change Program
(FORCLIME)
Indonesia
G. B. CSO Structured

Annex I: List of interviewees
169
Table 30 (continued)
FLEGT Lembaga Ekolabel
Indonesia
System Develop
Manager H. W. CSO Structured
FLEGT Lembaga Ekolabel
Indonesia Executive Director H. CSO Structured
FLEGT CIFOR Scientist A. D. Academia/
research Structured
FLEGT FORDA Researcher F. Academia/
research Structured
FLEGT Trustindo SVLK Audits Several Private sector Structured
FLEGT Pad Indonesia
(JPIK) Monitor A. CSO Structured
FLEGT Nupani (JPIK) Monitor I. H. CSO Structured
FLEGT Trustindo
Director of
Trustindo; SVLK
Audit
I. K. Private sector Structured
FLEGT Forest Watch
Indonesia (JPIK) Monitor K. CSO Structured
FLEGT FORDA Senior Scientist S. A. Academia/
research Structured
FLEGT DDPI; Independent
Consultant
Head of Green
economic growth
section of DDPI;
Concessionaire
supervisor
S. S.
Multistakeholder
forum; Private
sector
Structured
FLEGT PT Karya Lestari Concessionaire T. S. Private sector Structured
FLEGT PT Wanabhakti Concessionaire S. Private sector Structured
FLEGT PT Amindo Wana
Persada Concessionaire A. Private sector Structured
REDD+/
Tenure FMU Berau Barat
Section Head of
Forest Protection,
Conservation of
Natural Resources
and Ecosystems &
community
empowerment of
FMU Berau Barat;
former staff of
REDD+ WG Berau
and ex-head of
forestry service
H. Government
institution Unstructured
REDD+ Yakobi (TFCA) local NGO G. CSO Unstructured
REDD+ (former) Menapak local NGO CSO Unstructured
REDD+ REDD+ Working
Group Berau
REDD+ Working
Group Berau M.
Multistakeholder
forum Unstructured
FLEGT Independent
Consultant
Scientist;
Consultant K. O. Individuals Unstructured
FLEGT HTI concession M. Private sector Unstructured
REDD+ TNC
Manager of TNC;
FSC & RIL-C
officer & other staff
S. & R. and
others CSO Unstructured

Annex I: List of interviewees
170
Table 30 (continued)
FMU FMU Berau Barat former FMU staff
meeting
A. and
others
Government
institution Unstructured
FMU FMU Berau Barat former Head of
FMU A.
Government
institution Unstructured
REDD+ TNC Model village Head of villlage n.n CSO Unstructured
REDD+
Global Green
Growth Institute
(GGGI)
GGGI officer;
former secretariat
of provincial
REDD+ Working
group
D. C. Government
institution Unstructured
REDD+
Regional Council of
Climate Change
(DDPI)
Manager of DDPI D. R. Government
institution Unstructured
FLEGT
Provincial Forestry
Office East
Kalimantan
Departement of
Forest Product
industry under
Provincial forestry
service
S. & I. I. Government
institution Unstructured
Provincial Forestry
Office East
Kalimantan
Head of Provincial
Forestry Service W. W. H.
Government
institution Unstructured
FLEGT
Provincial Forestry
Office East
Kalimantan
Head section of the
forest management;
Provincial Forestry
Service
M. Government
institution Unstructured
FLEGT Concessionaire
Association (APHI) Chair of the APHI D. Private sector Unstructured
FLEGT Sumalindo Group
(Plywood company)
Deputy Head of
Logging Division U. R. J. Private sector Unstructured
REDD+
University
Mulawarman;
DDPI; Independent
Consultant
Vice Rector of
Academic Affairs;
BFCP Evaluator;
Head of REDD+
section of DDPI
M. A. S.
Academia/
research;
Multistakholder
forum
Unstructured
REDD+ GIZ
(ForClime TC)
Advisor for SFM
and REDD+ T. B. CSO Unstructured
REDD+ GIZ (GE-LAMA) Staff L. C. CSO Unstructured
REDD+ GIZ
(ForClime TC)
District coordinator
Berau S. S. CSO Unstructured
REDD+/
FLEGT TNC
Improved Forest
Management
Manager
B. W. CSO Unstructured

Annex II: Interview guidelines
171
Annex II: Interview guidelines
REDD+ interview guideline
Introduction
- Introduction of interviewer (and interview assistant)
- Introduction to the study background
- Outline of the aim of the interview
- Explanation of the process of the interview
Topics to discuss with interviewee
- Interviewees background (experience with REDD+)
- Familiarity with the concept of SFM
- The major threats to the sustainable management of forests in East Kalimantan/Berau
- Familiarity with the concept of REDD+
- For implementing interviewees: main objectives and activities of his/her organization in
relation to the BFCP
- The major achievements of REDD+ in East Kalimantan/Berau
- Threats to SFM discussed earlier that can be addressed through REDD+ related activities in
East Kalimantan/Berau
- Expected/observed risks to SFM from the current implementation of REDD+ in East
Kalimantan/Berau
- For implementing interviewees: REDD+ activities that are the most challenging (& why)
- The major challenges to implement REDD+ in East Kalimantan/Berau
- For implementing interviewees: alignment of the activities of the institution/organization the
interviewee is working for to the BFCP strategy
- Coordination of REDD+ activities on the provincial/district level
- For implementing interviewees: Monitoring and evaluation of the activities of the
institution/organization the interviewee is working for
- Transfer and distribution of REDD+ related results and lessons learnt
- The role of the DDPI/REDD+ Working group(s)
- Concluding question: major strength of, weakness/limitations of, opportunities of and
threats to the current REDD+ process in East Kalimantan

Annex II: Interview guidelines
172
FLEGT interview guidelines
Introduction
- Introduction of interviewer (and interview assistant)
- Introduction to the study background
- Outline of the aim of the interview
- Explanation of the process of the interview
Topics to discuss with the interviewee
- Interviewees background (experience with FLEGT-VPA/SVLK)
- Familiarity o with the concept of SFM
- The major threats to the sustainable management of forests in East Kalimantan/Berau
- Familiarity with FLEGT, VPA and its objectives
- Contribution/impact of the VPA/SVLK towards SFM
- Threats to SFM discussed earlier that can be addressed through FLEGT-VPA/the SVLK
- The impact of the SVLK in terms of reducing illegal logging
- Expected risks to the legality and sustainable management of forests from the current
implementation of the Indonesian TLAS and/or the VPA
- Aspect of forest conversion (conversion timber) under SVLK
- The major challenges to implement the VPA-SVLK
- The role of the Independent Monitoring and its effectiveness
- Concluding question: the major strength of, weakness/limitations of, opportunities of and
threats to the SVLK
Topics to discuss with forest concessionaires
- Interviewees background
- Familiarity with FLEGT and the VPA
- Familiarity with the difference between the objectives of the SVLK and the PHPL
- Expected and observed benefits to the interviewee’s business from the SVLK certification
- Potential disadvantages attached to the legality certifications for the interviewee’s concession
(what kind?)
- Potential negative effects on other forestry actors from the legality certification (What kind?)
- Does the interviewee have communities within his concession?
- Did his concession have/had land use conflicts with communities? What conflicts? Let
him/her explain
- Potential gaps in the SVLK scheme that would threaten the legality of timber exported to the
EU
- The role of the independent monitoring

Annex III: Forest loss in forest concessions in Berau
173
Annex III: Forest loss in forest concessions in Berau
Ta
ble
31
:
Fo
rest
lo
ss i
n c
on
cess
ion
s in
Ber
au f
rom
bas
elin
e y
ear
to 2
016
. C
N =
co
nce
ssio
n n
um
ber
; n y
ear
per
mit
= n
um
ber
of
yea
rs w
ith
co
nce
ssio
n p
erm
it;
%-v
alu
es =
fo
rest
lo
ss e
xp
ress
ed a
s p
erce
nta
ge
of
a con
cess
ion
s’ 2
00
0 f
ore
st c
ov
er; v
alu
es f
or
com
par
iso
n a
mo
ng c
on
cess
ion
s =
an
nu
al (
yr)
fo
rest
loss
[%
].
N y
ear
per
mit
16
16
16
16
11
16
16
16
16
16
16
9
8
16
16
12
16
16
Med
yr
loss
[%
]
0.1
2
0.0
4
0.0
8
0.0
1
1.2
5
0.1
6
0.0
8
0.0
2
0.0
7
0.0
8
0.3
2
0.2
2
0.1
6
0.1
6
0.0
4
0.1
4
0.0
7
0.1
5
0.0
9
Med
yr
loss
[h
a]
45
.18
19
.35
17
.95
0.6
3
1,6
13.0
5
10
1.4
3
57
.28
6.1
7
32
.53
7.1
1
17
1.9
1
49
.5
39
.33
18
.86
25
.06
54
.77
29
.16
13
.68
Mea
n y
r lo
ss a
nd
ra
ng
e
[%]
0.1
3 (
0.0
3-0
.38
)
0.0
7 (
0-0
.29)
0.1
(0
.02
-0.2
4)
0.0
8 (
0-0
.54)
1.6
7 (
0.5
9-3
.49
)
0.2
6 (
0.0
2-0
.87
)
0.2
4 (
0.0
3-1
)
0.1
(0
-0.5
6)
0.1
(0
.01
-0.3
6)
0.1
3 (
0-0
.41)
0.3
4 (
0.0
8-0
.59
)
0.1
9 (
0-0
.39)
0.2
8 (
0-1
.05)
0.1
9 (
0-0
.64)
0.0
8 (
0-0
.36)
0.1
6 (
0.0
2-0
.44
)
0.1
3 (
0.0
1-0
.42
)
0.1
6 (
0-0
.47)
0.2
2 (
0-3
.49)
Mea
n y
r lo
ss a
nd
ra
ng
e
[ha
]
49
.79 (
11
.61
-145
.54)
32
.07 (
2.0
7-1
31
.14
)
24
.33 (
3.7
8-5
9.2
2)
5.2
8 (
0-3
6.3
6)
2,1
59.0
4 (
758
.01
-
45
05
.94
) 1
70
.08
(1
4.2
2-5
65
.76
)
16
6.2
3 (
22
.86
-67
7.0
1)
24
.28 (
0.8
1-1
31
.23
)
45
.77 (
4.8
6-1
68
.22
)
11
.37 (
0.1
8-3
5.0
1)
18
2.0
5 (
45
.18
-31
7.4
4)
42
.34 (
0.8
1-8
7.2
1)
68
.31 (
0.6
3-2
57
.23
)
22
.39 (
0.3
6-7
6.5
9)
54
.16 (
1.0
8-2
34
.82
)
64
.28 (
8.4
6-1
74
.61
)
55
.01 (
2.9
7-1
77
.58
)
14
.2 (
0.3
6-4
2.0
3)
To
tal
loss
[%
]
2.1
1.1
3
1.6
3
1.2
4
18
.4
4.2
1
3.9
1.6
5
1.5
7
2.1
2
5.4
5
1.7
1
2.2
3
3.0
1
1.3
4
1.9
5
2.0
7
2.5
1
To
tal
loss
[h
a]
79
6.6
9
51
3.1
38
9.2
5
84
.42
23
,749
.44
2,7
21.3
3
2,6
59.6
8
38
8.4
5
73
2.2
5
18
1.8
9
2,9
12.7
9
38
1.0
6
54
6.4
9
35
8.2
86
6.5
5
77
1.4
88
0.1
4
22
7.1
6
39
,160
.29
CN
1
2
3
4
5
6
7
8
9
10
11
12
13
14
15
16
17
18

Annex III: Forest loss in forest concessions in Berau
174
Ta
ble
32
:
Sm
all-
scal
e fo
rest
lo
ss i
n c
on
cess
ion
s in
Ber
au f
rom
bas
elin
e y
ear
to 2
01
6. C
N =
co
nce
ssio
n n
um
ber
; n
yea
r p
erm
it =
num
ber
of
yea
rs w
ith
co
nce
ssio
n p
erm
it;
%-v
alu
es =
fo
rest
lo
ss e
xp
ress
ed a
s p
erce
nta
ge o
f a
con
cess
ion
s’ 2
00
0 f
ore
st c
ov
er;
val
ues
fo
r co
mp
aris
on
am
on
g c
on
cess
ion
s =
an
nu
al (
yr)
fore
st l
oss
[%
].
N y
ear
per
mit
16
16
16
16
11
16
16
16
16
16
16
9
8
16
16
12
16
16
Med
yr
loss
[%
]
0.1
0
0.0
4
0.0
8
0.0
1
0.3
6
0.1
5
0.0
6
0.0
2
0.0
6
0.0
8
0.2
0
0.2
1
0.0
7
0.1
6
0.0
4
0.1
1
0.0
7
0.0
6
0.0
8
Med
yr
loss
[h
a]
36
.36
19
.08
17
.91
0.5
8
46
7.3
9
10
0.2
2
42
.8
5.9
4
31
.05
7.1
1
10
7.0
6
46
.98
16
.52
18
.86
24
.26
42
.34
29
.16
5.8
9
Mea
n y
r lo
ss a
nd
ra
ng
e [%
]
0.1
1 (
0.0
3-0
.35
)
0.0
7 (
0-0
.28)
0.0
9 (
0.0
2-0
.24
)
0.0
8 (
0-0
.54)
0.3
6 (
0.1
4-0
.72
)
0.1
7 (
0.0
1-0
.43
)
0.1
4 (
0.0
2-0
.44
)
0.1
(0
-0.5
4)
0.0
9 (
0.0
1-0
.3)
0.1
3 (
0-0
.41)
0.2
1 (
0.0
6-0
.43
)
0.1
8 (
0-0
.37)
0.1
5 (
0-0
.46)
0.1
9 (
0-0
.64)
0.0
7 (
0-0
.32)
0.1
3 (
0.0
1-0
.41
)
0.1
2 (
0.0
1-0
.38
)
0.1
2 (
0-0
.45)
0.1
3 (
0-0
.72)
Mea
n y
r lo
ss a
nd
ra
ng
e [h
a]
42
.32 (
11
.61
-131
.32)
31
.07 (
2.0
7-1
29
.25
)
21
.68 (
3.7
8-5
9.2
2)
5.1
7 (
0-3
6.3
6)
46
5.9
3 (
18
0.0
1-9
27
.94
)
11
2.7
2 (
6.9
3-2
77
.3)
97
.15 (
14
.76
-295
.03)
22
.85 (
0.8
1-1
27
.36
)
43
.02 (
4.8
6-1
40
.32
)
11
.24 (
0.1
8-3
4.9
2)
11
3.8
4 (
30
.78
-23
2.1
2)
40
.48 (
0.8
1-8
2.0
8)
35
.88 (
0.5
4-1
13
.13
)
22
.1 (
0.3
6-7
6.5
9)
48
.62 (
1.0
8-2
07
.82
)
52
.66 (
5.1
3-1
61
.74
)
51
.27 (
2.9
7-1
61
.74
)
11
.41 (
0.3
6-4
0.6
8)
To
tal
loss
[%
]
1.7
8
1.0
8
1.4
4
1.2
2
3.9
7
2.7
6
2.2
9
1.5
5
1.4
7
2.1
1
3.4
2
1.6
3
1.1
7
2.9
8
1.1
9
1.6
0
1.9
3
2.0
0
To
tal
loss
[h
a]
67
7.0
8
49
7.1
7
34
6.8
6
82
.8
5,1
25.2
6
1,8
03.5
7
1,5
54.3
5
36
5.5
9
68
8.3
3
17
9.9
1
18
21
.4
36
4.3
2
28
7.0
1
35
3.6
1
77
7.9
63
1.9
82
0.2
9
18
2.5
2
16
,559
.87
CN
1
2
3
4
5
6
7
8
9
10
11
12
13
14
15
16
17
18

Annex III: Forest loss in forest concessions in Berau
175
Ta
ble
33
:
Lar
ge-
scal
e fo
rest
lo
ss i
n c
once
ssio
ns
in B
erau
fro
m b
asel
ine
yea
r to
20
16
. C
N =
co
nce
ssio
n n
um
ber
; n y
ear
per
mit
= n
um
ber
of
yea
rs w
ith
co
nce
ssio
n
per
mit
; %
-val
ues
= f
ore
st l
oss
ex
pre
ssed
as
per
cen
tag
e of
a co
nce
ssio
ns’
fo
rest
co
ver
in
2
000
; v
alu
es f
or
com
par
iso
n a
mo
ng
co
nce
ssio
ns
= a
nnu
al (
yr)
fore
st l
oss
[%
].
N y
ear
per
mit
16
16
16
16
11
16
16
16
16
16
16
9
8
16
16
12
16
16
Med
yr
loss
[%
]
0.0
166
2.0
0E
-04
0
0
1.1
092
0.0
088
0.0
181
0.0
016
1.0
0E
-04
0
0.1
101
0.0
081
0.0
368
0
0.0
046
0.0
212
0
0
0.0
034
Med
yr
loss
[h
a]
6.3
0
0.0
9
0
0
1,4
33.0
4
5.7
2
12
.29
0.3
6
0.0
5
0
58
.95
1.8
0
9
0
3.0
2
8.4
2
0
0
Mea
n y
r lo
ss a
nd
ra
ng
e [%
]
0.0
197
(0
-0.0
542
)
0.0
022
(0
-0.0
181
)
0.0
109
(0
-0.1
335
)
0.0
015
(0
-0.0
227
)
1.3
105
(0
.389
6-2
.900
6)
0.0
885
(0
-0.5
440
)
0.1
019
(0
.001
2-0
.563
5)
0.0
061
(0
-0.0
334
)
0.0
059
(0
-0.0
597
)
0.0
014
(0
-0.0
126
)
0.1
274
(0
.018
0-0
.294
5)
0.0
084
(0
-0.0
232
)
0.1
326
(0
-0.5
889
)
0.0
024
(0
-0.0
226
)
0.0
086
(0
-0.0
419
)
0.0
293
(0
.003
4-0
.090
6)
0.0
087
(0
-0.0
823
)
0.0
309
(0
-0.1
076
)
0.0
9 (
0-2
.9)
Mea
n y
r lo
ss a
nd
ra
ng
e [h
a]
7.4
8 (
0-2
0.5
2)
1.0
0 (
0-8
.28)
2.6
5 (
0-3
2.4
9)
0.1
0 (
0-1
.53)
1,6
93.1
1 (
503
.3-3
,74
7.5
7)
57
.36 (
0-3
52.5
4)
69
.08 (
0.8
1-3
81
.98
)
1.4
3 (
0-7
.83)
2.7
5 (
0-2
7.9
)
0.1
2 (
0-1
.08)
68
.21 (
9.6
3-1
57
.69
)
1.8
6 (
0-5
.13)
32
.44 (
0-1
44.1
)
0.2
9 (
0-2
.70)
5.5
4 (
0-2
7.0
0)
11
.62 (
1.3
5-3
6.0
0)
3.7
4 (
0-3
5.1
9)
2.7
9 (
0-9
.72)
To
tal
loss
[%
]
0.3
2
0.0
3
0.1
7
0.0
2
14
.42
1.4
2
1.6
3
0.1
0
0.0
9
0.0
2
2.0
4
0.0
8
1.0
6
0.0
4
0.1
4
0.3
5
0.1
4
0.4
9
To
tal
loss
[h
a]
11
9.6
1
15
.93
42
.39
1.6
2
18
,624
.19
91
7.7
6
1,1
05.3
5
22
.86
43
.92
1.9
8
1,0
91.3
6
16
.74
25
9.4
8
4.5
9
88
.65
13
9.5
59
.85
44
.64
22
,600
.42
CN
1
2
3
4
5
6
7
8
9
10
11
12
13
14
15
16
17
18

Annex III: Forest loss in forest concessions in Berau
176
Ta
ble
34
:
To
tal
fore
st l
oss
res
ult
s o
f ea
ch c
on
cess
ion
by
cer
tifi
cati
on s
tatu
s. C
N =
co
nce
ssio
n n
um
ber
; R
ef =
per
iod
wit
ho
ut
cert
ific
atio
n (
refe
ren
ce);
LK
= p
erio
d w
ith
le
gal
ity
cer
tifi
cati
on
; P
HP
L =
per
iod
wit
h P
HP
L c
erti
fica
tio
n;
Ʃ l
oss
= t
ota
l fo
rest
lo
ss f
rom
bas
elin
e y
ear
to 2
016
; Y
= l
eng
th o
f re
fere
nce
or
cert
ific
atio
n p
erio
d
in
yea
rs;
%-v
alu
es =
fore
st l
oss
ex
pre
ssed
as
per
cen
tag
e o
f a
con
cess
ion
s’ 2
00
0 f
ore
st c
ov
er..
PH
PL
Y
- - - 7
7
6
4
4
3
4
4
4
1
4
4
3 - - 5
5
PH
PL
Ʃ l
oss
[%
]
- - -
0.4
4
14
.4
3.2
7
2.4
9
0.6
8
0.7
6
0.1
3
1.4
1
1.2
1
1.0
5
0.7
0
0.9
0
0.9
9
- -
PH
PL
Ʃ l
oss
[h
a]
- - -
30
.15
18
,591
.15
2,1
22.8
2
1,6
84.6
9
16
0.7
5
35
4.7
9
11
.70
75
4.5
0
26
8.5
6
25
7.2
3
83
.52
58
2.8
7
39
3.1
3
- -
25
,295
.86
LK
Y
4
2
1 - - - - - - - - 2
5 - - - 4
2
20
LK
Ʃ l
oss
[%
]
0.5
2
0.5
2
0.2
4
- - - - - - - -
0.4
8
0.7
4
- - -
0.5
3
0.4
4
LK
Ʃ l
oss
[h
a]
19
6.1
1
23
7.8
8
59
.22
- - - - - - - -
10
5.6
6
18
1.8
0
- - -
23
0.9
5
39
.15
1,0
50.7
7
Ref
Y
12
14
15
9
4
10
12
12
13
12
12
3
2
12
12
9
12
14
18
9
Ref
Ʃ l
oss
[%
]
1.5
8
0.6
1
1.3
9
0.8
0
4.0
0
0.9
4
1.4
1
0.9
7
0.8
1
1.9
9
4.0
4
0.0
2
0.4
4
2.3
1
0.4
4
0.9
6
1.5
4
2.0
7
Ref
Ʃ l
oss
[h
a]
60
0.5
8
27
5.2
2
33
0.0
3
54
.27
5,1
58.2
9
59
8.5
1
97
4.9
9
22
7.7
0
37
7.4
6
17
0.1
9
2,1
58.2
9
6.8
4
10
7.4
6
27
4.6
8
28
3.6
8
37
8.2
7
64
9.1
9
18
8.0
1
12
,813
.66
CN
1
2
3
4
5
6
7
8
9
10
11
12
13
14
15
16
17
18

Annex III: Forest loss in forest concessions in Berau
177
Ta
ble
35
:
Av
erag
e an
nu
al fo
rest
lo
ss v
alu
es o
f ea
ch co
nce
ssio
n.
CN
=
co
nce
ssio
n n
um
ber
; R
efer
ence
=
w
ith
ou
t ce
rtif
icat
ion
; L
K =
w
ith
le
gal
ity
ce
rtif
icat
ion
;
PH
PL
= w
ith
PH
PL
cer
tifi
cati
on
; X̄
= m
ean a
nnu
al f
ore
st l
oss
fro
m b
asel
ine
yea
r to
201
6;
Y =
len
gth
of
refe
ren
ce o
r ce
rtif
icat
ion
per
iod
in
yea
rs;
%-v
alu
es =
fore
st l
oss
ex
pre
ssed
as
per
centa
ge
of
a co
nce
ssio
ns’
20
00
fo
rest
co
ver
.
PH
PL
per
iod
Y 7
7
6
4
4
3
4
4
Med
[%]
- - -
0.0
1
2.1
4
0.4
8
0.5
65
0.0
45
0.2
4
0.0
2
0.3
5
Med
[ha
]
- - -
0.8
1
2,7
61.7
6
31
3.2
5
38
0.4
5
11
.03
11
0.1
6
1.4
4
18
5.8
1
X̄ &
ran
ge
[%]
- - -
0.0
6
(0-0
.23
)
2.0
6
(0.9
6-3
.49
)
0.5
5
(0.4
-0.8
7)
0.6
2
(0.3
6-1
.00
)
0.1
7
(0.0
3-0
.56
)
0.2
5
(0.1
6-0
.36
)
0.0
3
(0-0
.1)
0.3
5
(0.1
3-0
.58
)
X̄ &
ra
ng
e [h
a]
- - -
4.3
1
(0-1
5.7
5)
2,6
55.8
8
(1,2
34
.58
-4,5
05.9
4)
35
3.8
0
(262
.18
-56
5.7
6)
42
1.1
7
(246
.79
-67
7.0
1)
40
.19
(7.4
7-1
31
.23
)
11
8.2
6
(76
.41
-168
.22
)
2.9
3
(0.2
7-8
.55
)
18
8.6
2
(69
.75
-313
.12
)
LK
per
iod
Y
4
2
1 - - - - - - - -
Med
[%]
0.1
5
0.2
6
0.2
4
- - - - - - - -
Med
[ha
]
53
.73
11
8.9
4
59
.22
- - - - - - - -
X̄ &
ra
ng
e
[%]
0.1
3
(0.0
8-0
.15
)
0.2
6
(0.2
3-0
.29
)
0.2
4
(0.2
4-0
.24
)
- - - - - - - -
X̄ &
ra
ng
e
[ha
]
49
.03
(30
.42
-58
.23
)
18
.94
(106
.74
-13
1.1
4)
59
.22
(5
9.2
2-5
9.2
2)
- - - - - - - -
Ref
eren
ce p
erio
d
Y
12
14
15
9
4
10
12
12
13
12
12
Med
[%]
0.1
1
0.0
4
0.0
7
0.0
1
1.0
8
0.0
85
0.0
6
0.0
2
0.0
6
0.0
9
0.3
1
Med
[ha
]
42
.80
18
.00
15
.93
0.5
4
1,3
93.6
2
52
.97
43
.47
4.9
5
26
.19
7.5
6
16
4.0
8
X̄ &
ra
ng
e
[%]
0.1
3
(0.0
3-0
.38
)
0.0
4
(0-0
.10
)
0.0
9
(0.0
2-0
.22
)
0.0
9
(0-0
.54
)
1.0
0
(0.5
9-1
.25
)
0.0
9
(0.0
2-0
.2)
0.1
2
(0.0
3-0
.52
)
0.0
8
(0-0
.45
)
0.0
6
(0.0
1-0
.15
)
0.1
7
(0-0
.41
)
0.3
4
(0.0
8-0
.59
)
X̄ &
ra
ng
e
[ha
]
50
.05
(11
.61
-145
.54
)
19
.66
(2.0
7-4
3.7
4)
22
.00
(3.7
8-5
2.7
4)
6.0
3
(0-3
6.3
6)
1,2
89.5
7
(758
.01
-1,6
13.0
5)
59
.85
(14
.22
-127
.54
)
81
.25
(22
.86
-353
.53
)
18
.98
(0.8
1-1
04
.58
)
29
.04
(4.8
6-9
.75
)
14
.18
(0.1
8-3
5.0
1)
17
9.8
6
(45
.18
-317
.44
)
CN
1
2
3
4
5
6
7
8
9
10
11

Annex III: Forest loss in forest concessions in Berau
178
Ta
ble
35
(co
nti
nu
ed)
4
1
4
4
3 - -
0.3
0
1.0
5
0.0
3
0.2
5
0.3
0
- -
0.3
4
65
.92
25
7.2
3
3.2
9
16
0.2
1
11
8.1
7
- -
0.3
0
(0.2
2-0
.39
)
1.0
5
(1.0
5-1
.05
)
0.1
8
(0-0
.64
)
0.2
3
(0.0
4-0
.36
)
0.3
3
(0.2
5-0
.44
)
- -
0.5
2
(0-3
.49
)
67
.14
(49
.50
-87
.21
)
25
7.2
3
(257
.23
-25
7.2
3)
20
.88
(0.3
6-7
6.5
9)
14
5.7
2
(27
.63
-234
.82
)
13
1.0
4
(100
.35
-17
4.6
1)
- -
2
5 - - - 4
2
0.2
4
0.1
1
- - -
0.1
0
0.2
2
0.1
6
52
.83
26
.10
- - -
42
.39
19
.57
0.2
4
(0.1
8-0
.30
)
0.1
5
(0-0
.36
)
- - -
0.1
3
(0.0
3-0
.31
)
0.2
2
(0.0
9-0
.35
)
0.1
7
(0-0
.36
)
52
.83
(3
8.8
8-6
6.7
8)
36
.36
(0
.63
-87.3
0)
- - -
57
.74
(1
2.5
1-1
33
.66
)
19
.57
(7
.92
-31.2
3)
3
2
12
12
9
12
14
0
0.2
2
0.1
9
0.0
4
0.0
9
0.0
7
0.1
5
0.0
7
0.9
0
53
.73
22
.68
22
.01
35
.55
29
.16
13
.68
0.0
1
(0-0
.02
)
0.2
2
(0-0
.44
)
0.1
9
(0.0
1-0
.56
)
0.0
4
(0-0
.09
)
0.1
1
(0.0
2-0
.24
)
0.1
3
(0.0
1-0
.42
)
0.1
5
(0-0
.47
)
0.1
4
(0-1
.25
)
2.2
8
(0.8
1-5
.13
)
53
.73
(0.9
9-1
06
.47
)
22
.89
(0.9
0-6
6.3
3)
23
.64
(1.0
8-5
9.6
7)
42
.03
(8.4
6-9
4.4
1)
54
.10
(2.9
7-1
77
.58
)
13
.43
(0.3
6-4
2.0
3)
12
13
14
15
16
17
18

Annex III: Forest loss in forest concessions in Berau
179
Ta
ble
36
:
To
tal
smal
l-sc
ale
fore
st l
oss
res
ult
s o
f ea
ch c
on
cess
ion
by
cer
tifi
cati
on s
tatu
s. R
efer
ence
= w
ith
ou
t ce
rtif
icat
ion
; L
K =
wit
h l
egal
ity
cert
ific
atio
n;
PH
PL
= w
ith
PH
PL
cer
tifi
cati
on
; Ʃ
lo
ss =
to
tal
fore
st l
oss
fro
m b
asel
ine
yea
r to
20
16
; Y
= l
eng
th o
f re
fere
nce
or
cert
ific
atio
n
per
iod
in y
ears
; %
-val
ues
= f
ore
st l
oss
ex
pre
ssed
as
per
cen
tag
e o
f a
con
cess
ion
s’2
00
0 f
ore
st c
ov
er.
PH
PL
per
iod
Y
- - - 7
7
6
4
4
3
4
4
4
1
4
4
3 - - 55
Ʃ l
oss
[%
]
- - -
0.4
2
3.0
8
1.9
1
1.2
5
0.6
4
0.6
7
0.1
2
1.0
1
1.1
5
0.4
6
0.7
0
0.8
1
0.9
0
- -
Ʃ l
oss
[h
a]
- - -
28
.62
3,9
73.7
5
1,2
38.8
2
84
6.0
3
15
0.8
5
31
4.1
1
10
.62
53
9.1
3
25
4.5
2
11
3.1
3
83
.52
52
6.7
1
35
5.9
6
- -
8,4
35.7
7
LK
per
iod
Y
4
2
1 - - - - - - - - 2
5 - - - 4
2
20
Ʃ l
oss
[%
]
0.4
0
0.5
0
0.2
4
- - - - - - - -
0.4
6
0.3
1
- - -
0.5
3
0.3
4
Ʃ l
oss
[h
a]
15
1.4
7
22
7.7
1
59
.22
- - - - - - - -
10
2.9
6
76
.14
- - -
22
8.7
30
.51
87
6.7
1
Ref
eren
ce p
erio
d
Y
12
14
15
9
4
10
12
12
13
12
12
3
2
12
12
9
12
14
18
9
Ʃ l
oss
[%
]
1.3
8
0.5
8
1.2
0
0.8
0
0.8
9
0.8
5
1.0
4
0.9
1
0.8
0
1.9
9
2.4
1
0.0
2
0.4
0
2.2
8
0.3
8
0.7
0
1.4
0
1.6
6
Ʃ l
oss
[h
a]
52
5.6
1
26
9.4
6
28
7.6
4
54
.18
1,1
51.5
1
56
4.7
5
70
8.3
2
21
4.7
4
37
4.2
2
16
9.2
9
1,2
82.2
7
6.8
4
97
.74
27
0.0
9
25
1.1
9
27
5.9
4
59
1.5
9
15
2.0
1
7,2
47.3
9
Co
nce
ssio
n n
o
1
2
3
4
5
6
7
8
9
10
11
12
13
14
15
16
17
18

Annex III: Forest loss in forest concessions in Berau
180
Ta
ble
37
: A
ver
age
annu
al s
mal
l-sc
ale
fore
st l
oss
val
ues
of
each
co
nce
ssio
n. C
N =
co
nce
ssio
n n
um
ber
; R
efer
ence
= w
ith
ou
t ce
rtif
icat
ion
; L
K =
wit
h l
egal
ity
cer
tifi
cati
on
;
PH
PL
=
w
ith
P
HP
L ce
rtif
icat
ion
; X̄
=
m
ean an
nu
al fo
rest
lo
ss fr
om
bas
elin
e y
ear
to 2
01
6;
Y =
le
ng
th o
f re
fere
nce
o
r ce
rtif
icat
ion p
erio
d in
y
ears
;
%-v
alu
es =
fo
rest
lo
ss e
xp
ress
ed a
s p
erce
nta
ge
of
a co
nce
ssio
ns’
20
00
fo
rest
co
ver
.
PH
PL
per
iod
Y
- - - 7
7
6
4
4
3
4
Med
[%]
- - -
0.0
1
0.3
9
0.3
4
0.3
4
0.0
4
0.2
3
0.0
2
Med
[ha
]
- - -
0.8
1
50
4.8
3
22
0.8
2
22
9.1
1
8.4
1
10
8.2
7
1.4
4
X̄ &
ra
ng
e
[%]
- - -
0.0
6
(0-0
.21
)
0.4
4
(0.2
1-0
.72
)
0.3
2
(0.1
9-0
.43
)
0.3
1
(0.1
4-0
.44
)
0.1
6
(0.0
3-0
.54
)
0.2
2
(0.1
4-0
.3)
0.0
3
(0-0
.09
)
X̄ &
ra
ng
e
[ha
]
- - -
4.0
9
(0-1
4.2
2)
56
7.6
8
(276
.49
-92
7.9
4)
20
6.4
7
(126
.19
-27
7.3
)
21
1.5
1
(92
.79
-295
.03
)
37
.71
(6.6
6-1
27
.36
)
10
4.7
0
(65
.52
-140
.32
)
2.6
5
(0.2
7-7
.47
)
LK
per
iod
Y
4
2
1 - - - - - - -
Med
[%]
0.1
0
0.2
5
0.2
4
- - - - - - -
Med
[ha
]
38
.43
11
3.8
5
59
.22
- - - - - - -
X̄ &
ra
ng
e
[%]
0.1
0
(0.0
8-0
.12
)
0.2
5
(0.2
2-0
.28
)
0.2
4
(0.2
4-0
.24
)
- - - - - - -
X̄ &
ra
ng
e
[ha
]
37
.87
(28
.98
-45
.63
)
11
3.8
5
(98
.46
-129
.25
)
59
.22
(59
.22
-59
.22
)
- - - - - - -
Ref
eren
ce p
erio
d
Y
12
14
15
9
4
10
12
12
13
12
Med
[%]
0.0
9
0.0
4
0.0
7
0.0
1
0.1
7
0.0
8
0.0
6
0.0
2
0.0
6
0.0
9
Med
[ha
]
35
.28
17
.91
15
.84
0.5
4
22
0.1
9
50
.72
38
.61
4.7
2
26
.10
7.5
6
X̄ &
ra
ng
e
[%]
0.1
2
(0.0
3-0
.35
)
0.0
4
(0-0
.09
)
0.0
8
(0.0
2-0
.20
)
0.0
9
(0-0
.54
)
0.2
2
(0.1
4-0
.41
)
0.0
9
(0.0
1-0
.18
)
0.0
9
(0.0
2-0
.26
)
0.0
8
(0-0
.41
)
0.0
6
(0.0
1-0
.15
)
0.1
7
(0-0
.41
)
X̄ &
ra
ng
e
[ha
]
43
.80
(11
.61
-131
.32
)
19
.25
(2.0
7-4
2.2
1)
19
.18
(3.7
8-4
7.9
7)
6.0
2
(0-3
6.3
6)
28
7.8
8
(180
.01
-53
1.1
1)
56
.48
(6.9
3-1
14
.66
)
59
.03
(14
.76
-174
.79
)
17
.89
(0.8
1-9
6.7
5)
28
.79
(4.8
6-6
9.6
6)
14
.11
(0.1
8-3
4.9
2)
CN
1
2
3
4
5
6
7
8
9
10

Annex III: Forest loss in forest concessions in Berau
181
Ta
ble
37
(co
nti
nu
ed)
4
4
4
1
4
4
3 - -
0.0
2
0.2
6
0.2
85
0.4
6
0.0
3
0.2
3
0.2
7
- -
1.4
4
13
4.3
8
62
.73
11
3.1
3
3.2
9
14
7.4
3
10
5.4
8
- -
0.0
3
(0-0
.09
)
0.2
5
(0.0
7-0
.43
)
0.2
9
(0.2
1-0
.37
)
0.4
6
(0.4
6-0
.46
)
0.1
8
(0-0
.64
)
0.2
0
(0.0
4-0
.32
)
0.3
(0
.22
-0.4
1)
- -
0.2
4
(0-0
.72
)
2.6
5
(0.2
7-7
.47
)
13
4.7
8
(38
.25
-232
.12
)
63
.63
(46
.98
-82
.08
)
11
3.1
3
(113
.13
-11
3.1
3)
20
.88
(0.3
6-7
6.5
9)
13
1.6
8
(24
.03
-207
.82
)
11
8.6
5
(88
.74
-161
.74
)
- -
- - 2
5 - - - 4
2
- -
0.2
3
0.0
3
- - -
0.1
0
0.1
7
- -
51
.48
6.9
3
- - -
41
.67
15
.26
- -
0.2
3
(0.1
7-0
.29
)
0.0
6
(0-0
.15
)
- - -
0.1
3
(0.0
3-0
.31
)
0.1
7
(0.0
7-0
.27
)
0.1
4
(0-0
.31
)
- -
51
.48
(37
.98
-64
.98
)
15
.23
(0.5
4-3
6.9
)
- - -
57
.17
(12
.51
-132
.85
)
15
.26
(6.2
1-2
4.3
)
12
12
3
2
12
12
9
12
14
0.0
9
0.2
0
0
0.2
0
0.1
8
0.0
3
0.0
6
0.0
7
0.0
55
7.5
6
10
4.4
4
0.9
0
48
.87
21
.33
18
.99
24
.93
29
.16
5.1
7
0.1
7
(0-0
.41
)
0.2
0
(0.0
6-0
.3)
0.0
1
(0-0
.02
)
0.2
0
(0-0
.4)
0.1
9
(0.0
1-0
.56
)
0.0
30
(0-0
.08
)
0.0
8
(0.0
1-0
.15
)
0.1
2
(0.0
1-0
.38
)
0.1
2
(0-0
.45
)
0.1
0
(0-0
.56
)
14
.11
(0.1
8-3
4.9
2)
10
6.8
6
(30
.78
-162
.37
)
2.2
8
(0.8
1-5
.13
)
48
.87
(0.9
9-9
6.7
5)
22
.51
(0.9
0-6
6.3
3)
20
.93
(1.0
8-5
4.8
1)
30
.66
(5.1
3-5
8.4
1)
49
.3
(2.9
7-1
61
.74
)
10
.86
(0.3
6-4
0.6
8)
10
11
12
13
14
15
16
17
18

Annex III: Forest loss in forest concessions in Berau
182
Ta
ble
38
:
To
tal
larg
e-sc
ale
fore
st l
oss
res
ult
s o
f ea
ch c
on
cess
ion
. R
efer
ence
= w
ith
ou
t ce
rtif
icat
ion
; L
K =
wit
h l
egal
ity
cer
tifi
cati
on
; P
HP
L =
wit
h P
HP
L
cert
ific
atio
n; Ʃ
lo
ss =
to
tal fo
rest
lo
ss f
rom
bas
elin
e y
ear
to 2
01
6; Y
= len
gth
of
refe
ren
ce o
r ce
rtif
icat
ion
per
iod
in
yea
rs; %
-val
ues
= f
ore
st lo
ss e
xp
ress
ed
as p
erce
nta
ge
of
a co
nce
ssio
ns’
20
00
fore
st c
ov
er.
PH
PL
per
iod
Y
- - - 7
7
6
4
4
3
4
4
4
1
4
4
3 - - 55
Ʃ l
oss
[%
]
- - -
0.0
23
11
.314
1.3
64
1.2
37
0.0
42
0.0
87
0.0
13
0.4
02
0.0
64
0.5
89
0
0.0
87
0.0
94
- -
Ʃ l
oss
[h
a]
- - -
1.5
3
14
,617
.41
88
4.0
1
83
8.6
7
9.9
0
40
.68
1.0
8
21
5.3
7
14
.04
14
4.1
0
0
56
.16
37
.17
- -
16
,860
.12
LK
per
iod
Y
4
2
1 - - - - - - - - 2
5 - - - 4
2
20
Ʃ l
oss
[%
]
0.1
18
0.0
22
0 - - - - - - - -
0.0
12
0.4
32
- - -
0.0
05
0.0
96
Ʃ l
oss
[h
a]
44
.64
10
.17
0 - - - - - - - -
2.7
0
10
5.6
6
- - -
2.2
5
8.6
4
17
4.0
6
Ref
eren
ce p
erio
d
Y
12
14
15
9
4
10
12
12
13
12
12
3
2
12
12
9
12
14
18
9
Ʃ l
oss
[%
]
0.1
98
0.0
13
0.1
74
0.0
01
3.1
01
0.0
52
0.3
93
0.0
55
0.0
07
0.0
11
1.6
40
0
0.0
40
0.0
38
0.0
50
0.2
58
0.1
35
0.3
98
Ʃ l
oss
[h
a]
74
.97
5.7
6
42
.39
0.0
9
4,0
06.7
8
33
.75
26
6.6
8
12
.96
3.2
4
0.9
0
87
5.9
9
0
9.7
2
4.5
9
32
.49
10
2.3
3
57
.60
36
.00
5,5
66.2
4
CN
1
2
3
4
5
6
7
8
9
10
11
12
13
14
15
16
17
18

Annex III: Forest loss in forest concessions in Berau
183
Ta
ble
39
: A
ver
age
ann
ual
lar
ge-
scal
e fo
rest
lo
ss v
alu
es o
f ea
ch c
on
cess
ion
. C
N =
co
nce
ssio
n n
um
ber
; R
efer
ence
= w
ith
ou
t ce
rtif
icat
ion
; L
K =
wit
h l
egal
ity
cer
tifi
cati
on
;
PH
PL
= w
ith
PH
PL
cer
tifi
cati
on
; X̄
= m
ean
an
nu
al f
ore
st l
oss
fro
m b
asel
ine
yea
r to
20
16
; Y
= l
eng
th o
f re
fere
nce
or
cert
ific
atio
n p
erio
d i
n y
ears
; %
-val
ues
=
fore
st l
oss
ex
pre
ssed
as
per
centa
ge
of
a co
nce
ssio
ns’
20
00
fo
rest
co
ver
.
PH
PL
per
iod
Y
- - - 7
7
6
4
4
3
4
Med
[%]
- - - 0
1.6
72
0.1
93
0.2
35
0.0
10
0.0
23
0
Med
[ha
]
- - - 0
2,1
60.5
4
12
5.0
2
15
9.1
3
2.3
4
10
.89
0
X̄ a
nd
ran
ge
[%]
- - -
0.0
03
(0-0
.02
3)
1.6
16
(0.6
89
-2.9
01
)
0.2
27
(0.0
82
-0.5
44
)
0.3
09
(0.2
04
-0.5
64
)
0.0
10
(0.0
03
-0.0
19
)
0.0
29
(0.0
04
-0.0
6)
0.0
03
(0-0
.01
3)
X̄ a
nd
ra
ng
e
[ha
]
- - -
0.2
2
(0-1
.53
)
2,0
88.2
0
(889
.60
-3,7
47.5
7)
14
7.3
4
(52
.92
-352
.54
)
20
9.6
7 (
138
.43
-
381
.98
)
2.4
8
(0.7
2-4
.50
)
13
.56
(1.8
9-2
7.9
0)
0.2
7
(0-1
.08
)
LK
per
iod
Y
4
2
1 - - - - - - -
Med
[%]
0.0
3
0.0
11
0 - - - - - - -
Med
[ha
]
11
.34
5.0
8
0 - - - - - - -
X̄ a
nd
ran
ge
[%]
0.0
30
(0.0
04
-0.0
54
)
0.0
11
(0.0
04
-0.0
18
)
0 - - - - - - -
X̄ a
nd
ran
ge
[ha
]
11
.16
(1.4
4-2
0.5
2)
5.0
8
(1.8
9-8
.28
)
0 - - - - - - -
Ref
eren
ce p
erio
d
Y
12
14
15
9
4
10
12
12
13
12
Med
[%]
0.0
17
0
0
0
0.8
01
0.0
02
0.0
11
0
0
0
Med
[ha
]
6.3
0
0
0
0
10
35
.22
1.6
2
7.6
1
0.0
9
0
0
X̄ a
nd
ran
ge
[%]
0.0
17
(0-0
.03
8)
9e-
04
(0-0
.00
4)
0.0
12
(0-0
.13
4)
1e-
04
(0-0
.00
1)
0.7
75
(0
.39
-1.1
09
)
0.0
05
(0
-0.0
2)
0.0
33
(0.0
01
-0.2
64
)
0.0
05
(0-0
.03
3)
5e-
04
(0-0
.00
5)
9e-
04
(0-0
.00
5)
X̄ a
nd
ran
ge
[ha
]
6.2
5
(0-1
4.2
2)
0.4
1
(0-2
.07
)
2.8
3
(0-3
2.4
9)
0.0
1
(0-0
.09
)
1,0
01.7
0
(503
.30
-14
33
.04
)
3.3
8
(0-1
2.8
7)
22
.22
(0.8
1-1
78
.75
)
1.0
8
(0-7
.83
)
0.2
5
(0-2
.43
)
0.0
8
(0-0
.45
)
CN
1
2
3
4
5
6
7
8
9
10

Annex III: Forest loss in forest concessions in Berau
184
Ta
ble
39
(co
nti
nu
ed)
4
4
1
4
4
3 - -
0.0
96
0.0
15
0.5
89
0
0.0
20
0.0
32
- -
51
.44
3.2
4
14
4.1
0
12
.78
12
.69
- -
0.1
00
(0.0
59
-0.1
51
)
0.0
16
(0.0
11
-0.0
23
)
0.5
89
(0.5
89
-0.5
89
)
0
0.0
22
(0.0
06
-0.0
42
)
0.0
31
(0.0
29
-0.0
32
)
- -
0.2
8
(0-2
.9)
53
.84
(31
.5-8
1)
3.5
1
(2.4
3-5
.13
)
14
4.1
(1
44
.1-1
44
.1)
0
14
.04
(3.6
-27
)
12
.39
(11
.61
-12
.87
)
- -
- 2
5 - - - 4
2
-
0.0
06
0.0
34
- - -
0.0
02
0.0
48
-
1.3
5
8.2
8
- - -
0.7
2
4.3
2
-
0.0
06
(0.0
04
-0.0
08
)
0.0
86
(0-0
.20
6)
- - -
0.0
01
(0-0
.00
2)
0.0
48
(0.0
19
-0.0
77
)
0.0
34
(0-0
.21
)
-
1.3
5
(0.9
0-1
.80
)
21
.13
(0-5
0.4
0)
- - -
0.5
6
(0-0
.81
)
4.3
2
(1.7
1-6
.93
)
12
3
2
12
12
9
12
14
0.1
13
0
0.0
2
0
0.0
03
0.0
15
0
0
60
.53
0
4.8
6
0
1.7
1
6.0
3
0
0
0.1
36
(0
.018
-0.2
94
)
0
0.0
20
(0-0
.04
)
0.0
03
(0
-0.0
23
)
0.0
04
(0
-0.0
17
)
0.0
28
9
(0.0
03
-0.0
91
)
0.0
11
(0
-0.0
82
)
0.0
29
(0-0
.10
8)
73
.00
(9.6
3-1
57
.69
)
0
4.8
6
(0-9
.72
)
0.3
8
(0-2
.70
)
2.7
1
(0-1
1.2
5)
11
.37
(1.3
5-3
6)
4.8
0
(0-3
5.1
9)
2.5
7
(0-9
.72
)
11
12
13
14
15
16
17
18

Declaration on oath
I hereby declare upon oath that I have written the present dissertation independently and have not used
further resources and aids than those stated.
Hamburg, Laura Prill