Current HCV Treatment Options in HIV Co-infected...
37
Current HCV Treatment Options in HIV Co-infected Patients Jürgen K. Rockstroh Department of Medicine I University Hospital Bonn Germany
Transcript of Current HCV Treatment Options in HIV Co-infected...

Current HCV Treatment Options in
HIV Co-infected Patients
Jürgen K. RockstrohDepartment of Medicine IUniversity Hospital Bonn
Germany

2
Conflict of interest
I have received honoraria for speaking at educational events or consulting from:
Abbott, Abbvie, Bionor, BMS, Boehringer, Gilead, Janssen, Merck, Novartis, Pfizer, Roche, Tibotec, Tobira and ViiV

Anti-HCV antibody prevalence in different EuroSIDA regions
• South: 28.8%• West: 20.1%• North: 17.3%• East Central: 34.0%• East: 57.7%• Argentina: 20.6%
Peters L et al., BMC Infect Dis. 2014;14 Suppl 6:S13

HCV co-infection in EuroSIDA
EuroSIDA: prospective, European study of 18,295 HIV-1–infected patients at 105 centres across Europe, Israel and Argentina
Prevalence of HCV seropositivity in EuroSIDA is 31% (4,044 patients), 74;2% of which were serum HCV RNA-positive
4Rockstroh J et al. J Hepatol 2013;59(2):213-220
Progression to liver-related death in HIV-positive population
Multivariate analysis adjusted for gender, exposure group, race, prior AIDS, region of Europe, CD4+ T-cell nadir, HCV treatment status at baseline, age, and baseline date. Starting cART, HBsAgstatus, diagnosis of a new AIDS-defining illness and CD4+ T-cell count were included as time-updated variables.
HCVAb, anti-HCV antibodies; PYFU, person years of follow-up; IRR, incidence rate ratio;
001/IHQ/14-09//1138h
HCVAb serostatus: Events (PYFU) IRR (95% CI; p value)Negative 43 (66,653) 1Positive 175 (26,494) 8.90 (5.60–14.14; p<0.0001)
HCV genotypeGT 1 55 (8122) 1GT 2 2 (554) 0.27 (0.07–1.13; p=0.073)GT 3 28 (4503) 0.99 (0.62–1.59; p=0.98)GT 4 9 (2188) 0.91 (0.44–1.89; p=0.80)
HCV-RNA viremiaHCVAb- 43 (66,653) 0.18 (0.10–0.32; p<0.0001)Ab+/RNA- 21 (4838) 1Ab+/RNA+ 86 (11,302) 2.11 (1.30–3.42; p=0.0025)Ab+/unknown 68 (10,354) 1.42 (0.86–2.35; p=0.17)
0.01 0.1 1 10 100
Adjusted incidence rate ratio (95% CI)

Ingiliz & Rockstroh, Current Opinion HIV 2015
HIV HCV
FibrosisCirrhosis
LPS
HIV
HCV
• Direct effect on stellate cells
• Immune dysregulation• Cytokine alteration• Hepatocyte apoptosis
• Higher HCV chronicity rate• Increased viral replication• Decreased HCV-specific immune
response
HAART
HCC

6
What is the optimal treatment strategy in HIV/HCV co-infected patients?
Treat HCV first?
Treat HIV first?
Treat HIV/HCV simultaneously?

7
EACS guidelines: when to startInitiation of ART
– ART is always recommended if CD4 count <350 cells/mm3
EACS treatment guidelines, Version 7.0 2013. Accessed November 2013. . Available at: http://www.europeanaidsclinicalsociety.org C, consider; D, defer; R, recommended
ConditionCurrent CD4+ lymphocyte
count350–500 >500
HBV requiring anti-HBV treatment R RHBV not requiring anti-HBV treatment R CHCV for which anti-HCV treatment is being considered or given R C
HCV for which anti-HCV treatment not feasible R C

8
Antiretroviral therapy reduces the rate of hepatic decompensationamong HIV- and hepatitis C virus-coinfected veterans
Objective: To evaluate 10,090 HIV/HCV-co-infected
males from the Veterans Aging CohortStudy Virtual Cohort, who had notinitiated ART at entry, for incidenthepatic decompensation between1996 and 2010
Results: Initiation of ART significantly reduced the rate of hepatic decompensation by
28–41% on average
Anderson JP, et al. Clin Infect Dis 2014; 58(5): 719–27.8
9
x 1.5
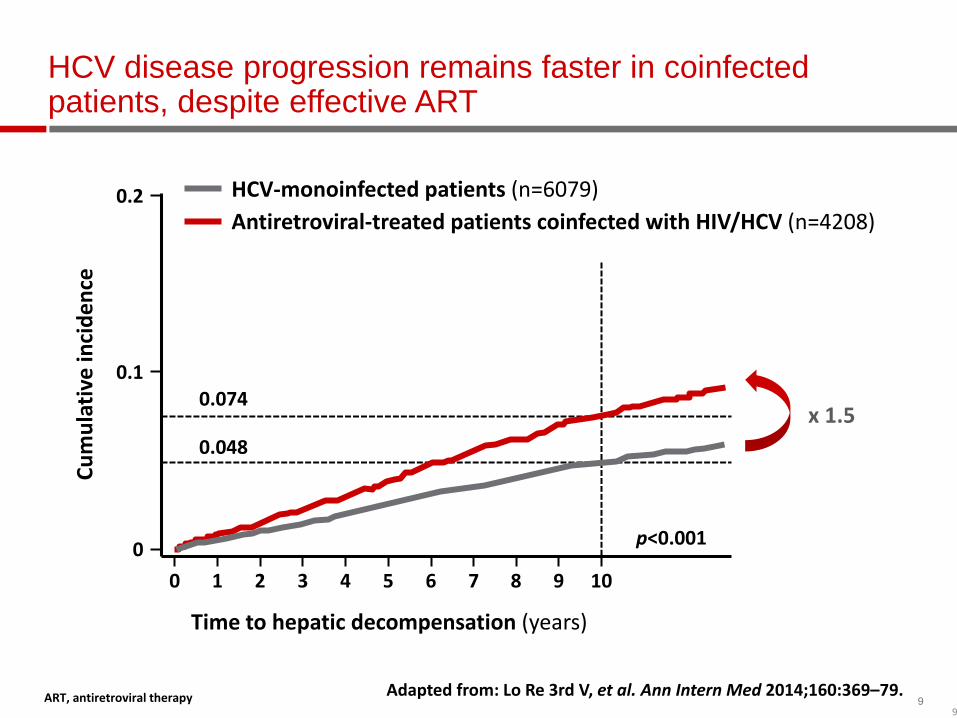
HCV disease progression remains faster in coinfected patients, despite effective ART
ART, antiretroviral therapy Adapted from: Lo Re 3rd V, et al. Ann Intern Med 2014;160:369–79.
HCV-monoinfected patients (n=6079)Antiretroviral-treated patients coinfected with HIV/HCV (n=4208)
0.074
0
0.1
0.2
0
Time to hepatic decompensation (years)
1 2 3 4 5 6 7 8 9 10
Cum
ulat
ive
inci
denc
e
0.048
p<0.001
9

10
HCV disease progression remains faster in coinfected patients, despite effective ART
If HIV RNA < 1000 copies/mL: +65% excess risk
If HIV RNA > 1000copies/mL: +82% excess risk
If CD4 < 200/mm2: +203% excess risk
If CD4 > 200/mm2: 56–63% excess risk
ART, antiretroviral therapy; HCV, hepatitis C virus; HIV, human immunodeficiency virus.Lo Re V 3rd. Ann Intern Med 2014.

11
EASL 2015 HCV recommendations and AASLD/IDSA/IAS-USA HCV recommendations
• Indications for HCV treatment in HIV/HCV co-infected patients are identical to those in HCV mono-infection (Recommendation A1)
• Same treatment regimens can be used in HIV/HCV patients as in patients without HIV infection, as the virological results of therapy are identical (Recommendation A1)
• Treatment should be prioritized regardless of the fibrosis stage in patients with HIV or HBV coinfection, (…) (Recommendation A1)
High Priority for Treatment Owing to High Risk for Complications HIV-1 coinfection (AASLD/IDSA) Rating: Class I, Level B
Journal of Hepatology DOI: (10.1016/j.jhep.2015.03.025) Copyright © 2015 European Association for the Study of the Liver

12
Treatment Options 2015
Ombitasvir/Paritaprevir/Ritonavir + Dasabuvir (± RBV)
Sofosbuvir + Simeprevir (± RBV)
Sofosbuvir + Daclatasvir (± RBV)
Ombitasvir/Paritaprevir/Ritonavir (± RBV)
PegIFNα + RBV + sofosbuvir
PegIFNα + RBV + simeprevir
Sofosbuvir + RBV
Sofosbuvir/Ledipasvir (± RBV)
IFN-free regimens
IFN-containing regimens
GT
1
1, 4
All
4
1, 4
2, 3
1, 4, 5, 6
All
(J-M Pawlotsky, ILC2015, Vienna, Austria, April 24, 2015. EASL Recommendations on Treatment of Hepatitis C 2015)

ARV Interaction Score CardSimeprevir Sofosbuvir Ledipasvir Daclatasvir AbbVie 3D
ATV/r No data ATV ↔ SOF ↔ No data DCV ↑* ATV ↔; ABT450 ↑
DRV/r SIM ↑; DRV ↔ SOF ↑; DRV ↔ No data DCV (↑) DRV ↓; 3D ↓
LPV/r No data No data No data DCV↔ LPV ↔; ABT450 ↑
TPV/r No data No data No data No data No data
EFV SIM ↓; EFV ↔ SOF ↔; EFV ↔ LDV ↓; EFV ↓ DCV ↓* No PK data**
RPV SIM ↔; RPV ↔ SOF ↔; RPV ↔ LDV ↔; RPV ↔ No data ABT450 ↑; RPV ↑
ETV No data No data No data No data No data
RAL SIM ↔; RAL ↔ SOF ↔; RAL ↔ LDV ↔; RAL ↔ No data 3D ↔; ↑ RAL
ELV/cobi No data No data No data No data No data
DLG No data No data No data No data No data
MVC No data No data No data No data No data
TDF SIM ↔; TDF ↔ SOF ↔; TDF ↔ LDV ↔; ↑TDF***
DCV ↔; TDF ↔ 3D ↔; TDF ↔
• Decrease DCV dose to 30mg QD, Increase DCV dose to 90mg QD, ** 3D + EFV led to premature study discontinuation due to toxicities***when TDF is administered with a boosted HIV-PI and LDV significantly higher TDF levels can be expected warranting closer renal monitoring
Personal communication Jennifer Kiser, University of Colorado, Denver, USA
14
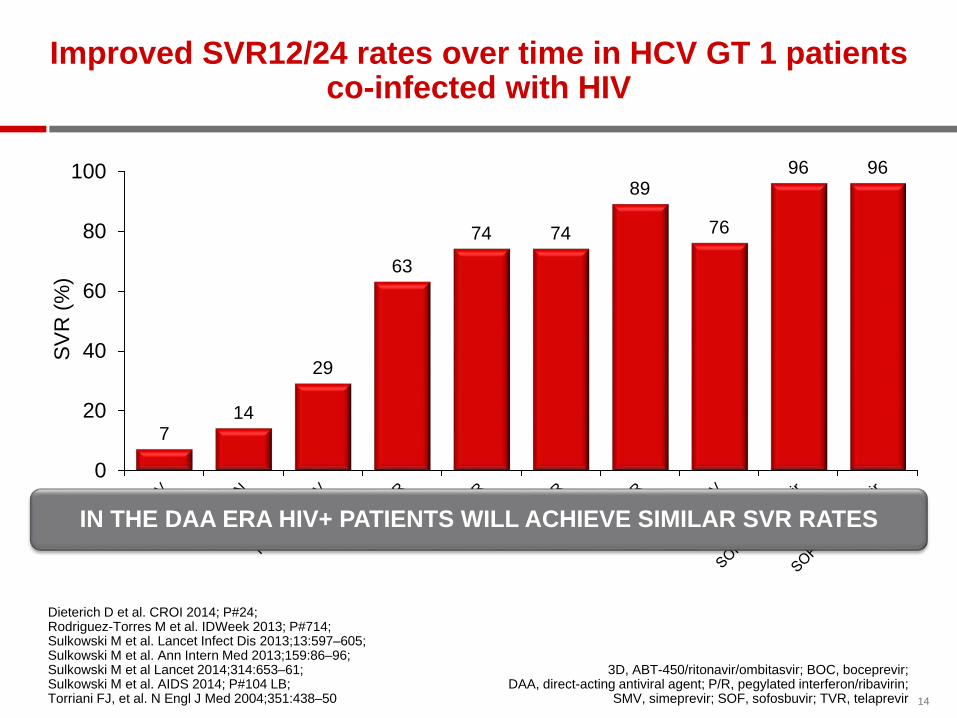
Improved SVR12/24 rates over time in HCV GT 1 patients co-infected with HIV
Dieterich D et al. CROI 2014; P#24; Rodriguez-Torres M et al. IDWeek 2013; P#714; Sulkowski M et al. Lancet Infect Dis 2013;13:597–605; Sulkowski M et al. Ann Intern Med 2013;159:86–96; Sulkowski M et al Lancet 2014;314:653–61; Sulkowski M et al. AIDS 2014; P#104 LB; Torriani FJ, et al. N Engl J Med 2004;351:438–50
3D, ABT-450/ritonavir/ombitasvir; BOC, boceprevir; DAA, direct-acting antiviral agent; P/R, pegylated interferon/ribavirin;
SMV, simeprevir; SOF, sofosbuvir; TVR, telaprevir
714
29
63
74 74
89
76
96 96
0
20
40
60
80
100
SVR
(%)
IN THE DAA ERA HIV+ PATIENTS WILL ACHIEVE SIMILAR SVR RATES
15
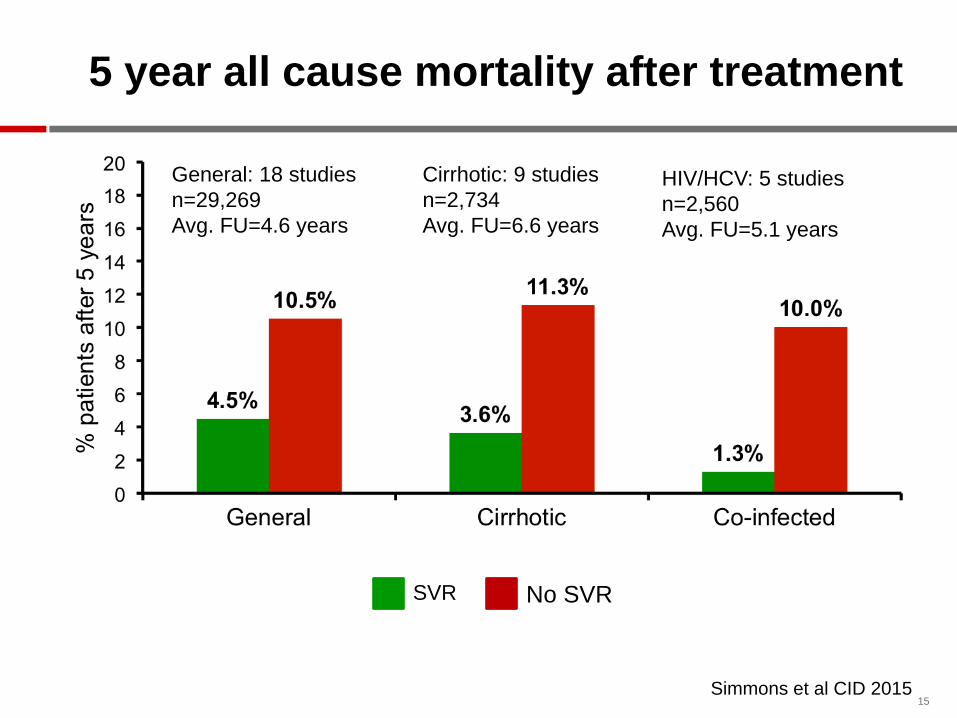
General: 18 studiesn=29,269Avg. FU=4.6 years
No SVRSVR
Cirrhotic: 9 studiesn=2,734Avg. FU=6.6 years
HIV/HCV: 5 studiesn=2,560Avg. FU=5.1 years
Simmons et al CID 2015
5 year all cause mortality after treatment

1616
SVR12 from VALENCE includes pooled analysis from all patients (treatment-naïve and –experienced) by genotype and duration of therapy*GT1 SVR24 of 75%; GT3 TE SVR24 of 88%
100
28/42
SVR1
2 (%
)
90 89
0
20
40
60
80
100
NEUTRINO1
HCV19102
HCV/HIV
GT 1 SOF + RBV + PegIFN
12 weeks
GT 1 SOF + RBV 24 weeks
6876*
0
20
40
60
80
100
SPARE3
HCVPHOTON-14
HCV/HIV
87/11417/25 95/112
85
PHOTON-26
HCV/HIV
GT 3SOF + RBV 24 weeks
8594*
0
20
40
60
80
100
VALENCE5
HCVPHOTON-14
HCV/HIV
16/17212/250
PHOTON-26
HCV/HIV
89
94/106
GT 2SOF + RBV 12 weeks
9388
0
20
40
60
80
VALENCE5
HCVPHOTON-14
HCV/HIV
68/73 23/26
88
22/25
PHOTON-26
HCV/HIV
262/292 17/19
Photon 1 & 2: SOF + RBV Comparison HCV monoinfection and HIV/HCV coinfection trials
1. Lawitz E, et al. APASL 2013. Singapore. Oral #LB-02. 2. Rodriguez-Torres M, et al. IDWeek 2013; San Francisco, CA. Poster 714. 3. Osinusi A, et al. JAMA. 2013;310(8):804-811. 4. Naggie S, et al. CROI 2014. Boston, MA. Oral #26. 5. Zeuzem S, et al. AASLD 2013. Washington, DC. #1085. 6. Molina JM, et al. IAS Melbourne Abstract MOAB0105LB
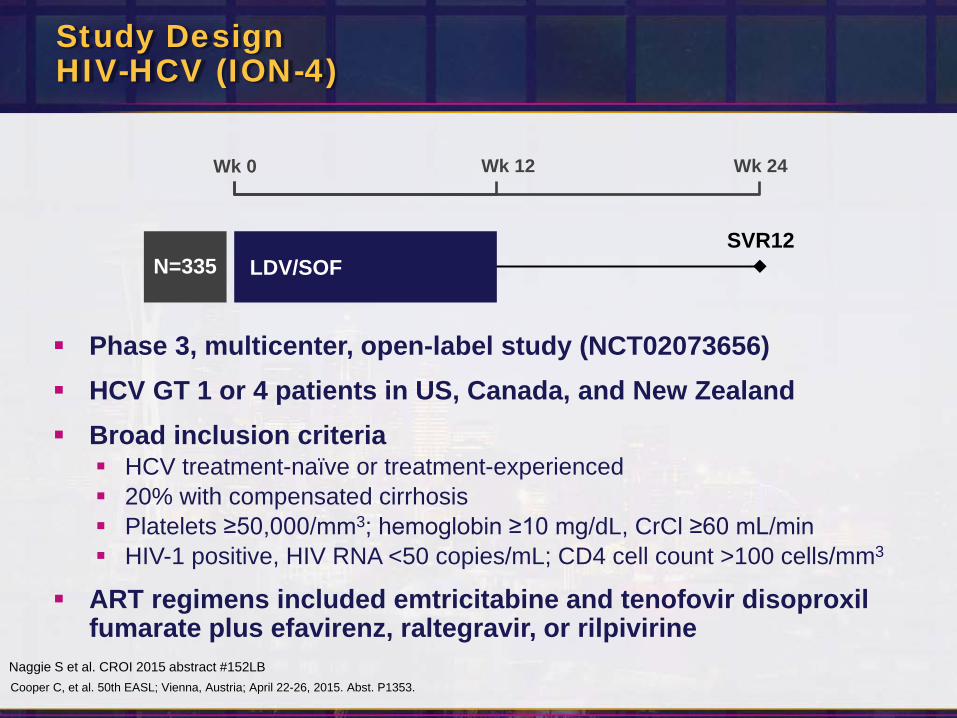
Study DesignHIV-HCV (ION-4)
Phase 3, multicenter, open-label study (NCT02073656) HCV GT 1 or 4 patients in US, Canada, and New Zealand Broad inclusion criteria HCV treatment-naïve or treatment-experienced 20% with compensated cirrhosis Platelets ≥50,000/mm3; hemoglobin ≥10 mg/dL, CrCl ≥60 mL/min HIV-1 positive, HIV RNA <50 copies/mL; CD4 cell count >100 cells/mm3
ART regimens included emtricitabine and tenofovir disoproxilfumarate plus efavirenz, raltegravir, or rilpivirine
Wk 0 Wk 12 Wk 24
SVR12LDV/SOFN=335
Naggie S et al. CROI 2015 abstract #152LBCooper C, et al. 50th EASL; Vienna, Austria; April 22-26, 2015. Abst. P1353.

Results: Demographics and Baseline CharacteristicsHIV-HCV (ION-4)
LDV/SOF 12 weeksN=335
Mean age, y (range) 52 (26-72)
Male, n (%) 276 (82)
Black, n (%) 115 (34)
Hispanic or Latino, n (%) 56 (17)
Mean BMI, kg/m2 (range) 27 (18-66)
IL28B CC, n (%) 81 (24)
GT 1 327 (98)
HCV treatment experienced, n (%) 185 (55)
Cirrhosis, n (%) 67 (20)
Mean HCV RNA, log10 IU/mL ± SD 6.7 ± 0.6
Median CD4 cell count, cells/µL (range) 628 (106-2069)
HIV ARV Regimen
Efavirenz + FTC + TDF 160 (48)
Raltegravir + FTC + TDF 146 (44)
Rilpivirine + FTC + TDF 29 (9)

Naïve vs Experienced Cirrhosis StatusOverall
96 95 97 96 94
0
20
40
60
80
100
LDV/SOF 12 Weeks
ExperiencedNaïve No Cirrhosis Cirrhosis
321/335 142/150 179/185 63/67258/268
SVR
12 (%
)Results: SVR12 by Prior Treatment Experience and Cirrhosis StatusHIV-HCV (ION-4)
Error bars represent 95% confidence intervals.

Results: SVR12 in SubgroupsHIV-HCV (ION-4)
LDV/SOF 12 Weeks, N=335Overall
Sex MaleFemale
Race BlackNon-Black
HCV Genotype1a1b4
Baseline HCV RNA (IU/mL) <800,000≥800,000
Baseline BMI (kg/m2) <30≥30
IL28BCCCTTT
Cirrhosis NoYes
Prior HCV Treatment NoYes
ARV RegimenEFV + FTC + TDFRAL + FTC + TDFRPV + FTC + TDF
Baseline CD4 (cells/μL) <350≥350
60 70 80 90 100SVR12, % (95% CI)
Statistically significantin multivariate analysis

Results: Safety SummaryHIV-HCV (ION-4)
*Serious AEs in >1 patient were hepatocellular carcinoma (n=2) and portal vein thrombosis (n=2) in patients with cirrhosis.†Confirmed IV drug user developed Staphylococcus aureus sepsis, endocarditis with associated embolic brain abscesses, and multi-organ system failure.
Patients, n (%)LDV/SOF 12 Weeks
N=335
Overall safety
AEs 257 (77)
Grade 3‒4 AE 14 (4)
Serious AE 8 (2)*
Treatment D/C due to AE 0
Death 1 (<1)†
Grade 3‒4 laboratory abnormality 36 (11)
♦ Stable CD4 counts through treatment and follow-up phase
♦ No patient had confirmed HIV virologic rebound
21

Results: Renal FunctionHIV-HCV (ION-4)
EFV+FTC+TDF (n=160)
RAL+FTC+TDF (n=146)
RPV+FTC+TDF (n=29)
LDV/SOF +
60708090
100110120130140150
Cre
atin
ine
Cle
aran
ce(m
L/m
in),
mea
n ±
SD
WeekBL 1 2 4 6 8 10 12 FU-4
♦ 4 patients (1%) had change in creatinine ≥ 0.4 mg/dL– 2 completed treatment with no ART change– 1 had dose reduction of TDF, 1 discontinued TDF
22

Data presented to 3 significant figures; N=23 (LDV/SOF + DRV/r + TVD; simultaneous administration)
Drug-Drug Interactions Between Anti-HCV Regimen Ledipasvir/Sofosbuvir and Antiretrovirals
German P, et al. 22nd CROI; Seattle, WA; February 23-26, 2015. Abst. 82.
Moderate (~ 30-60%)increases in TFV exposure with LDV/SOF added to Pl/r + TVD regimen versus Pl/r + TVD regimen alone
May be attributed to persistent inhibition of efflux drug transporters
TFV PK Parameter N=24
Mean (%CV)LDV/SOF + ATV/r + TVD LDV/SOF + DRV/r + TVD
Simultaneous Staggered Simultaneous StaggeredAUCtau (ng-h/mL) 5460 (27.7) 5740 (25.0) 5490 (31.2) 4260 (24.2)
Cmax (ng/mL) 530 (26.2) 559 (22.0) 523 (28.0) 410 (27.6)
Ctsu (ng/mL) 120 (30.5) 116 (27.1) 117 (30.6) 87.3 (25.0)
Effect of LDV/SOF on TFV PK
CtauCmaxAUCtau
SimultaneousAdministration
Staggered (12 hours)Administration
GM
R%
(90%
Cl)
AR
V+LD
V/SO
F vs
. AR
V
ATV/r+TVD DRV/r+TVD ATV/r+TVD DRV/r+TVD
300
200
143
100
70

24Wyles, AASLD 2014 #1939
HIV-HCV Coinfection study: TURQUOISE-I: 3 DAAs + RBV

ALLY-2: Study Design
DCV 30/60/90 mg +SOF 400 mg QD
24
DCV 30/60/90 mg +SOF 400 mg QD
12
NaiveRandomize 2:1
Experienced
DCV 30/60/90 mg + SOF 400 mg QD
Week 0 8
SVR12*
Primary endpoint: SVR12 in treatment-naive patients with GT 1 treated for 12 weeks
Standard DCV dose is 60 mg Dose-adjusted for concomitant ARV therapy: 30 mg with ritonavir-boosted
PIs, 90 mg with NNRTIs except RPV
Wyles D et al, CROI 2015 abstract # 151LB
* HCV RNA <LLOQ (TD or TND) at posttreatment Week 12, assessed using the Roche HCV COBAS TaqMan Test v2.0 (LLOQ 25 IU/mL).
52
50
101
N
Wyles D, et al. 50th EASL; Vienna, Austria; April 22-26, 2015. Abst. LP01.

ParameterNaive
12 WeekN = 101
Experienced12 WeekN = 52
Naive8 WeekN = 50
Age, median years (range) 52 (24–71) 57 (43–66) 50 (28–75)
Male, n (%) 92 (91) 43 (83) 42 (84)
Race, n (%)
White 66 (65) 31 (60) 28 (56)
Black 30 (30) 20 (38) 19 (38)
Other 5 (5) 1 (2) 3 (6)
HCV GT, n (%)
1a 71 (70) 33 (63) 35 (70)
1b 12 (12) 11 (21) 6 (12)
2 11 (11) 2 (4) 6 (12)
3 6 (6) 4 (8) 3 (6)
4 1 (1) 2 (4) 0
HCV RNA, mean log10 IU/mL (SD) 6.50 (0.76) 6.52 (0.79) 6.40 (0.71)
Cirrhosis, n (%)* 9 (9) 15 (29) 5 (10)
*Cirrhosis status determined by liver biopsy (METAVIR >F3), Fibroscan (>14.6 kPa), or Fibrotest >0.74 with APRI >2.
Demographic and HCV Disease Characteristics
26

HIV Disease Characteristics and Regimens
ParameterNaive
12 WeekN = 101
Experienced12 WeekN = 52
Naive8 WeekN = 50
HIV RNA < 50 copies/mL, n/N (%) 94/100 (94) 47/49 (96) 45/48 (94)
CD4 cells/mm3, median (range) 520 (122–1147) 636 (262–1470) 575 (157–1430)
Receiving HIV treatment, n (%) 100 (99) 51 (98) 48 (96)
PI regimens*
Darunavir/r 19 (19) 11 (21) 21 (42)
Atazanavir/r 19 (19) 12 (23) 5 (10)
Lopinavir/r 9 (9) 0 3 (6)
NNRTI regimens
Efavirenz 18 (18) 8 (16) 8 (16)
Nevirapine 5 (5) 3 (6) 1 (2)
Rilpivirine 5 (5) 1 (2) 1 (2)
Other regimens
Raltegravir 22 (22) 10 (20) 8 (16)
Dolutegravir 3 (3) 4 (8) 1 (2)
Nucleosides only 0 2 (4) 0
*DCV dose reduced to 30 mg/day with PI regimens; based on recent data, DCV 60mg/day is recommended when used with DRV/r or LPV/r regimens [Eley et al. HIVDART 2014; Poster 63]

ALLY-2: SVR12
0
20
40
60
80
100
Ast
itel
SVR
12, %
𝟖𝟖𝟖𝟖𝟖𝟖𝟖𝟖
𝟒𝟒𝟖𝟖𝟒𝟒𝟒𝟒
𝟖𝟖𝟑𝟑𝟒𝟒𝟑𝟑
12-WeekNaive
12-WeekExperienced
8-WeekNaive
0
20
40
60
80
100
𝟗𝟗𝟖𝟖𝟑𝟑𝟖𝟖𝟑𝟑
𝟓𝟓𝟑𝟑𝟓𝟓𝟓𝟓
𝟖𝟖𝟖𝟖𝟓𝟓𝟖𝟖
12-WeekNaive
12-WeekExperienced
8-WeekNaive
Relapse(n = 1)
Follow-up Wk 12 data missing (n = 1)Detectable at EOT (n = 1)
Relapse (n = 1)Relapse (n = 10)
Follow-up Wk 12 data missing (n = 2)
GT 1 (N = 168) All Patients (N = 203)
7696 98
7696 98
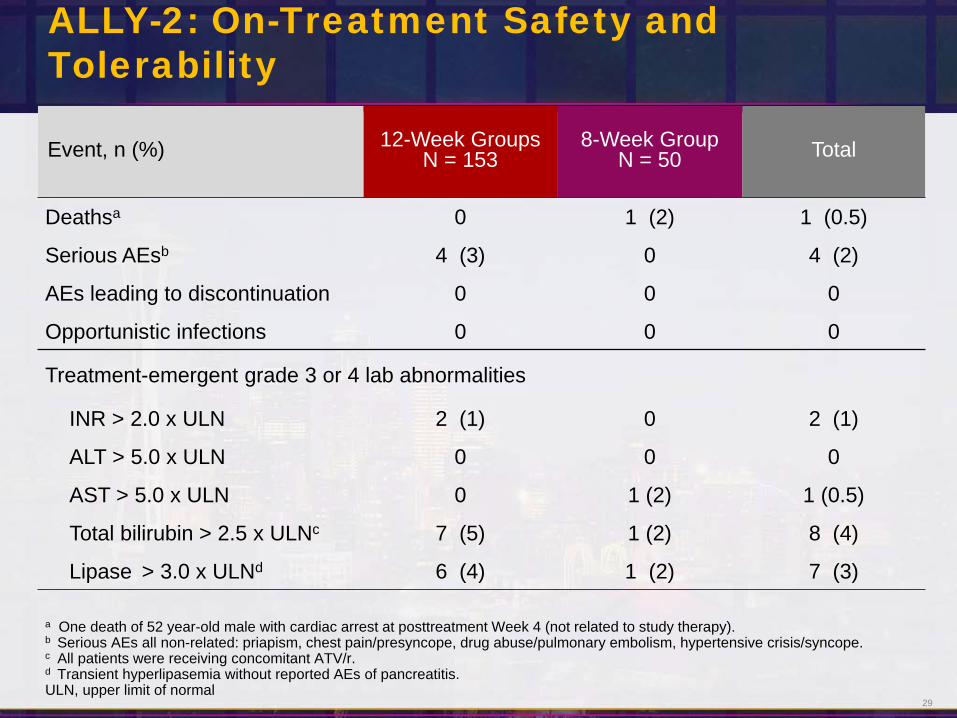
ALLY-2: On-Treatment Safety and Tolerability
Event, n (%) 12-Week GroupsN = 153
8-Week GroupN = 50 Total
Deathsa 0 1 (2) 1 (0.5)
Serious AEsb 4 (3) 0 4 (2)
AEs leading to discontinuation 0 0 0
Opportunistic infections 0 0 0
Treatment-emergent grade 3 or 4 lab abnormalities
INR > 2.0 x ULN 2 (1) 0 2 (1)
ALT > 5.0 x ULN 0 0 0
AST > 5.0 x ULN 0 1 (2) 1 (0.5)
Total bilirubin > 2.5 x ULNc 7 (5) 1 (2) 8 (4)
Lipase > 3.0 x ULNd 6 (4) 1 (2) 7 (3)
a One death of 52 year-old male with cardiac arrest at posttreatment Week 4 (not related to study therapy).b Serious AEs all non-related: priapism, chest pain/presyncope, drug abuse/pulmonary embolism, hypertensive crisis/syncope.c All patients were receiving concomitant ATV/r.d Transient hyperlipasemia without reported AEs of pancreatitis. ULN, upper limit of normal
29

Elbasvir(50 mg)
Grazoprevir(100 mg)
STUDY DESIGN: C-EDGE COINFECTION
An open-label, single-arm, multicenter study across Europe, USA, and Australia
Primary endpoint: SVR12 (HCV RNA <15 IU/mL*) Treatment-naive patients with HCV GT1, 4 or 6 infection with or
without cirrhosis Co-infected with HIV-1:
Naive to ART with CD4+ >500 cells/mm3 and HIV RNA <50,000 copies/mL On stable on ART† for ≥8 weeks and CD4+ >200 cells/mm3 and
undetectable HIV RNA
GZR 100 mg / EBR 50 mg
D1 TW4 TW8 TW12 FW4 FW8 FW12
n=218
*COBAS TaqMan v2.0 [LLoQ <15 IU/mL]† Stable antiretroviral therapy (ART) included tenofovir or abacavir, and either emtricitabine or lamivudine plus raltegravir, dolutegravir, or rilpivirine
Follow-up
Rockstroh J, et al. 50th EASL; Vienna, Austria; April 22-26, 2015. Abst. P0887.

Elbasvir(50 mg)
Grazoprevir(100 mg)STUDY DESIGN: C-EDGE COINFECTION
• An open-label, single-arm, multicenter study across Europe, USA, and Australia
• Primary endpoint: SVR12 (HCV RNA <15 IU/mL*)
• Treatment-naive patients with HCV GT1, 4 or 6 infection with or without cirrhosis
• Co-infected with HIV-1:– Naive to ART with CD4+ >500 cells/mm3 and HIV RNA <50,000 copies/mL – On stable on ART† for ≥8 weeks and CD4+ >200 cells/mm3 and undetectable HIV
RNA
GZR 100 mg / EBR 50 mg
D1 TW4 TW8 TW12 FW4 FW8 FW12
n=218
*COBAS TaqMan v2.0 [LLoQ <15 IU/mL]† Stable antiretroviral therapy (ART) included tenofovir or abacavir, and either emtricitabine or lamivudine plus raltegravir, dolutegravir, or rilpivirine
Follow-up

Elbasvir(50 mg)
Grazoprevir(100 mg)DEMOGRAPHICS: C-EDGE COINFECTION
All PatientsN = 218
Age, years mean (SD) 48.7 (8.9)Sex, n (%)
Male, 183 (83.9)Female 35 (16.1)
Race, n (%)White 167 (76.6)Black or African-American 38 (17.4)Asian 6 (2.8)Other 7 (3.2)
Ethnicity, n (%)Hispanic / Latino 14 (6.4)Not Hispanic / Latino 194 (89.0)Not reported 10 (4.6)
HCV genotype, n (%)1a 144 (66.1)1b/other 45 (20.7)4 28 (12.8)6 1 (0.5)
Baseline HCV RNA >800,000 IU/mL, n (%) 130 (59.6)Cirrhotic*, n (%) 35 (16.1)IL28B CC (%) , n (%) 77 (35.3)
*Of the 35 patients (16.1%) with cirrhosis, 27 were diagnosed by Fibroscan, 6 by biopsy, and 2 by Fibrotest and APRI.

Elbasvir(50 mg)
Grazoprevir(100 mg)DEMOGRAPHICS: C-EDGE CO-INFECTION
All PatientsN = 218
Antiretroviral therapy, n (%)Receiving ART with undetectable HIV RNA 211 (96.8)NaIve to ART 7 (3.2)
Baseline CD4 count (cells/µL)Mean (SD)Median (1st quartile – 3rd quartile)
613 (0.57)568 (424-766)
Antiretroviral therapy, backbone n (%)Abacavir-containing regimen 47 (21.6)Tenofovir-containing regimen 164 (75.2)
Antiretroviral therapy, third agent n (%)Raltegravir 113 (51.8)Dolutegravir 59 (27.1)Rilpivirine 38 (17.4)

Elbasvir(50 mg)
Grazoprevir(100 mg)
SVR12 – C-EDGE CO-INFECTIONFULL ANALYSIS SET
LTFU or discontinued unrelated to VF 4 3 1 0
Breakthrough 0 0 0 0Relapse 6 4 1 1Reinfection 1 1 0 0
Patie
nts,
%
All Patients
136/144
42/44
207/218*
94.4 95.595.0
GT1a GT1b GT4
96.4
27/28
0
25
50
75
100
*1 patient with GT6 infection and 1 patient with GT1 not-otherwise subtyped were also included; both patients achieved SVR12.GT = genotype; LTFU = long-term follow-up

Elbasvir(50 mg)
Grazoprevir(100 mg)
RESISTANCE ASSOCIATED VARIANTS: NS5AC-EDGE TN + C-EDGE CO-INFECTION
†The resistance analysis population includes all patients from the full analysis set who have sequencing data available and who either achieved SVR12 or met criteria for virologic failure
N = number of patients who achieved SVR12. m = number of patients with evaluable baseline sequencen = number of patients with or without a baseline RAV
RAV Status in Patients with
Baseline Sequence % (n/m)
SVR12 All Patients
% (N/n)
SVR12 NS5A RAVs
≤5-fold potency loss
SVR12 NS5A RAVs
>5-fold potency loss
Genotype 1a RAVS
Baseline NS5A RAVS 9.9 (29/294) 65.5 (19/29) 87.5 (14/16) 38.5 (5/13)
No baseline NS5A RAVs 90.1 (265/294) 98.1 (260/265) — — — —
Genotype 1b RAVS
Baseline NS5A RAVS 13.3 (23/173) 95.7 (22/23) 100 (1/1) 95.5 (21/22)
No baseline NS5A RAVs 86.7 (150/173) 99.3 (149/150) — — — —
Resistance analysis population†
Rockstroh J, et al. 50th EASL; Vienna, Austria; April 22-26, 2015. Abst. P0887.Zeuzem S, et al. 50th EASL; Vienna, Austria; April 22-26, 2015. Abst. G07.

36
Coinfected patients: treat-all or prioritize?
Zahnd C, CROI 2015, #150
Cost of HCV therapy influence the debate „right“ indication of treatment
mathematical model from the Swiss Cohort: 100% treatment-uptake, SVR 90%
Influence of timepoint of treatment on liver-related endpoints and infectious duration: 1 month or 1 year after diagnosis or at F2, F3, F4

37
Summary
In the DAA era, HIV/HCV-coinfected patients show the same high cure rates (over 90%) under IFN-free DAA combinations –therefore, guidelines no longer separate between mono- and co-infected patients
Indication for HCV therapy as well as DAA drug selection has become the same for all patients
The only special consideration in HIV/HCV-coinfected patients is the need to check for DDIs between HIV and HCV drugs
Considering the faster fibrosis progression and higher risk for hepatic decompensation in coinfected patients (even in the era of ART), the uptake of modern HCV therapy needs to be encouraged and HCV therapy should be discussed with all coinfected patients
ART, antiretroviral therapy; DAA, direct-acting antiviral; DDI, drug–drug interaction; HCV, hepatitis C virus; HIV, human immunodeficiency virus; IFN, interferon.