
Cummins Inc. Equity Valuation and...
100
Cummins Inc. Equity Valuation and Analysis Valued at April 1, 2007 John Michell: [email protected] Clay Snyder: [email protected] Brian Cannon: [email protected] Ali Zandi: [email protected] Alan Jones: [email protected]
Transcript of Cummins Inc. Equity Valuation and...

Cummins Inc. Equity Valuation and Analysis
Valued at April 1, 2007
John Michell: [email protected] Clay Snyder: [email protected]
Brian Cannon: [email protected] Ali Zandi: [email protected]
Alan Jones: [email protected]
- 2 -
Table of Contents:__________________
Executive Summary………………………………………..3 Company Overview………………………………………..8 Business & Industry Analysis……………………………10 Accounting Analysis…………………..…………………..20 Ratio Analysis………………………...……………………41 Forecast Financials………………..……………………….68 Valuation Analysis…………………………………………81 Recommandation………………………………………….93 Appendix …………………………………………………..94 References………………………..……………………….100

- 3 -
Investment Recommendation: Overvalued, Sell CMI – NYSE Revenue (2006) 11,362,000 Market Cap 9.60B Shares Outstanding 104.20M Dividend Yield 2.10% 3-month Avg Daily Trading Volume 2,338,760 Percent Institutional Ownership 53% Book Value Per Share 26.89 ROE 30.65% ROA 9.79% Cost of Capital RSquared Beta Ke Ke Estimation 11.89% 10-year .3247 1.48 11.89% Published Kd 7.13% WACC 9.37%
EPS Forecast-____________________ FYE 06 07 08 09 15.02 10.47 12.76 15.34 Ratio Comparison CMI CAT Trailing P/E 7.0 13.37 Forward P/E 10.23 12.89 P/B 2.3 6.31 P/Sales .62 1.03 P/EBITDA .053 .0124 Multiples Valuations_ CMI Trailing P/E $200.81 Forward P/E $183.04 P/B $397.59 P/Sales $241.28 P/EBITDA $17.07 Intrinsic Valuations Discounted Dividends $24.75 Free Cash Flows $85.95 Residual Income $123.33 Abnormal Earnings Growth $113.34

- 4 -
Executive Summary
Cummins Inc. is a national and global leader in the design, manufacturing, sales
and services of diesel engines in more than 160 countries. Founded in 1919,
Cummins Inc. has since evolved into four business segments: Engine, Power
generation, Components and Distribution. The majority of sales are produced
from the engine segment, whose largest customer is DaimlerChrysler. The main
competitors of Cummins Inc. are Detroit Diesel Corporation (privately owned),
Mack Trucks, Inc. (privately owned), and Caterpillar Inc. The threat of new
entrants into this industry is low due to the large capital investments involved in
the production process. The industry competes on a mix of brand image and
quality, as well as low cost of production.
The products of Cummins Inc. are under high threat of substitution. Essentially
customers are willing to switch producers of engines if the cost of the engine is
lower and/or is of higher quality and reliability. This is why Cummins Inc. must
provide quality merchandise at the lowest possible cost to keep or increase
market share. The diversified machinery industry is heavily concentrated allowing
some price control in the hands of the firms, but with little product
differentiation, firms must differ in cost and quality. Threat of substitution can
also come from non-diesel engines and alternative power sources. The industry
is heavily regulated for safety standards as well as environmental policies, which
can potentially hinder higher profits in certain situations.
The industry that Cummins Inc. competes in has little bargaining power over the
consumer. Their products are basically undifferentiated and have little switching
costs for the consumer. To combat this, the firm must attain a reputation as
being both reliable and reasonably priced in order to steal costumers from their
competitors as well as retain their current customers. Cummins Inc. has power
over their suppliers because most of their suppliers are in the natural resource

- 5 -
industry. With few buyers and many suppliers, Cummins Inc. can negotiate lower
prices with little resistance. Firms in the diversified machinery industry must
maintain a mixed strategy for a competitive advantage. It is important that the
firm research in productivity and cost cutting as well as innovation of new
technologies to improve the quality of their products. Cummins Inc. must also
explore and infiltrate new high growth economies to attain more growth, since
more mature markets are harder to gain market share in.
When evaluating Cummins’ key accounting policies, it is important to understand
their success factors. Cummins Inc. has several major accounting factors. One
factor is the high amount of assets that are needed to operate in this industry.
Management’s ability to accurately estimate depreciation expenses, provisions for
warranties and asset impairment have great influence over the financial picture
the firm appears to be in. Cummins Inc. is also involved in investing in
derivatives to hedge against rising input costs, and heavily invests in research
and development to improve efficiency and quality. Pension liabilities also take
careful consideration by management when estimating the obligations for future
periods.
Overall Cummins Inc. accounting policies appear to be more conservative in
nature, and the firm prepares its financial statements in accordance with GAAP
(generally accepted accounting policies). Management does disclose in-depth
every aspect of the firms operations, making the firm more transparent for
shareholders. By evaluating Cummins Inc.’ sales and expense ratios, we were
able to search for any ‘red flags’ found in the annual report. Through our
evaluation, we found no major ‘red flags’ that needed to be addressed.
Management has done considerably well in not over or understating any items
that give rise to suspicion of misstating financial information.

- 6 -
By examining ratios that examine Cummins’ liquidity, operating efficiency,
profitability and capital structure we were able to understand how the firm
compared to its competitors in the industry. Cummins Inc. liquidity and
productivity ratios imply improvement their ability to cover short-term debt, while
becoming more productive in generating sales over the five year period. The
profitability ratios illustrate a turn-around in strategy that took the firm from low
earnings and returns to rapid growth in profitability and shareholders’ equity.
These ratios tell us that management is focused and working hard to keep
improving the profitability of the company. When we analyzed the capital
structure ratios, we found that management had focused intensively on reducing
debt and focusing on financing growth with cash generated from operations. This
was very attractive to us because the company has taken on little more debt,
which could lead to higher profits and financial stability in an economic
downturn.
We also extended our analysis to four additional ratios that focus more on
specific asset turnovers and earnings associated with non-cash items. These
ratios also were favorable for Cummins Inc. and further instilled the impression
on us that management is achieving attractive productivity and implementing
good financial policy.
We forecasted Cummins’ financial statements ten years into the future using the
data received from the ratios and growth trends of forecast-able line items. We
believe earnings and productivity from assets to continue to impress investors.
Also we forecast sales and cash flows provided by operations to continue
increasing at an attainable growth rate in line with the industry and historical
averages.
We used several different valuation models to find out if Cummins’ stock is
undervalued, fair valued or overvalued. Not every model is reliable when applied

- 7 -
to different structured firms, so we went through each model in order to decide
which methods were accurate. The method of comparables was the least reliable
of the valuation models because of the extreme concentration of the industry,
which only consists of Caterpillar Inc. another problem when using Caterpillar’s
price multiples to compute Cummins’ share price, is the difference in capital
structures of the two firms. Cummins is heavily leveraged towards financing
through shareholders’ equity and retained earnings, where Caterpillar relies
almost completely on financing through debt, focusing less on earnings growth.
This method is much like comparing apples to oranges in out opinion, and is not
reliable for valuating this particular firm. For the remaining valuation models we
needed to compute the estimated cost of equity and the weighted average cost
of capital to plug into the models. The discounted dividends model does not
evaluate the financial policies of Cummins very well either. Cummins has
basically had flat growth in dividends over the past periods, which means that
dividends paid at the same rate in the future as they are presently are worth less
today (present value of dividends) dragging the value of the firm down to
unreasonable prices. The free cash flows and residual income models where
more accurate than the discounted dividends and method of comparables, but
still were not the most reliable method for valuating Cummins. The abnormal
growth earnings model came closest to our observed price per share of $144.99,
by using a lower cost of equity then our estimated cost of equity, of 9% and 0%
growth in perpetuity, which states that the price per share of Cummins should be
$202.71. When combining all the data we found from each valuation model, it is
our opinion that Cummins Inc. should be valued lower than the observed market
price of $144.99.

- 8 -
Company Overview
We have reshaped the Company into what we are
calling “The New Cummins” – a company that is less
cyclical, more diversified, more results-oriented and
committed to turning a greater share of its sales into
profits. (From the 2005 Annual Report)
Cummins Inc. boasts a long history since being founded in 1919. Cummins Inc.
is a national and global power leader through the design, manufacture, sales and
services of diesel engines. Their products can be accessed in more than 160
countries, ranging from Mexico to India, through 550 company-owned as well as
independent distribution facilities, and over 5,000 dealers. Cummins Inc. has
teamed up in numerous joint ventures to produce the distribution facilities that
allow them to keep and gain market share on a global scale.
Both domestic and global corporate headquarters are located in Columbus,
Indiana. The corporate structure of Cummins Inc. is constructed from four
business segments: Engine, Power Generation, Components, and Distribution.
The Components segment can be further dissected into four businesses:
Cummins Filtration, Cummins Turbo Technologies, Cummins Emission Solutions
and Cummins Fuel Systems. The Distribution segment network consists of 17
company-owned distributors coupled with 10 joint ventures, operating in 90
countries through 233 locations. The major products these four complementary
business segments produce consist of heavy-duty engines, for on and off-road
vehicles; the sole supplier of diesel engines for DaimlerChrysler in their Dodge
Ram pickups; power generators for use commercially or for consumer needs;
filtration and after-treatment supplies; industrial silencers; turbochargers;
engines and other related products for use in mining, oil and gas, agricultural,
marine and military operations.

- 9 -
Cummins Inc. is classified as a member of the diversified machinery industry, but
the main competitors the company fights for market share are spread out into
three different industries. These industries consist of: farm and construction
machinery, auto parts and trucks and other vehicles. Through these industries
Cummins Inc. competes against hundreds of domestic and foreign businesses,
but for analysis we break down the competitors to three main rivaling
companies: Detroit Diesel Corporation (privately owned), Mack Trucks, Inc.
(privately owned), and Caterpillar Inc. These companies offer the greatest
competition to Cummins Inc. while also being similar in size and operations.
Cummins Inc. is a large-cap corporation with a market capitalization of 7.28
billion and growing. Recently the corporation recorded sales of $11.36 billion for
2006, which blew away analysts estimates for the second year in a row. Sales
have doubled since reporting $5.68 billion five years previous in 2001. For the
same 5 year period, earnings can be slated at a growth rate of almost 71%, only
beating the industry growth by 1%, but out pacing the S&P 500 by more than
61%. Total assets recorded on the balance sheet of 2001, are $4.34 billion and
in 2006 (in accordance with the 10-k) total to $7.47 billion, that is an increase in
total asset value of $3.13 billion or 72% in a five year period. That gives us a
picture of the growth and size of Cummins Inc. In February of 2002, the stock
was trading at $41.58 and presently, February 1, 2007, the stock closed at
$136.72, that is just under a 229% return if you held the security during this
period.
Cummins Inc. is well diversified within its sector and industry. We can
understand the size and performance of Cummins Inc. through the financial
information published in previous years. The next step in the analysis process is
to dissect the industry and competitors of Cummins Inc. to get a good
understanding of their performance against similar companies and the
competitive environment of the industry.

- 10 -
Classifying The Industry
In order to understand Cummins Inc., we must first classify the industry in which
Cummins Inc. operates, so that we may have a context in which to compare.
We will first classify the industry, determine how firms create competitive
positions in this industry, and then we will look at Cummins Inc. corporate
strategy to determine how well they are implementing this strategy to achieve
competitive advantage.
Classifying the industry allows us to understand the degree of competition that
our firm must compete in. We will use Porter’s Five Competitive Forces in order
to classify the industry. First we will look at the rivalry among existing firms in
the industry by taking a look at such things as industry growth, concentration,
switching costs, and barriers to exit in the industry. We will then consider the
threat of new entrants into the industry by discussing scale economies, the first
mover advantage, as well as legal barriers in the industry. We will examine the
threat of substitute products and look at the relative price and performance, and
buyers’ willingness to switch to other products.
We can then look at the bargaining power of both the buyers and suppliers in
the industry and try to understand how these relationships affect the firms in the
industry by looking at the switching costs, and the number and volume of both
suppliers and buyers.

- 11 -
Industry Structure and Profitability
Industry: Diversified Machinery
Rivalry Among Existing Firms
We need to examine the competition among firms already established in the
industry. This is an important first step, as it allows us to determine the degree
to which firms compete; you can have one or the other extreme. In industries in
which competition is aggressive, prices are often pushed towards cost. In
industries in which competition is less aggressive, firms do not compete on price,

- 12 -
but rather on non-price items such as differentiation. The intensity of rivalry is
influenced by such factors as industry growth, concentration, product
differentiation, switching costs, and technology. Each of these factors will be
discussed.
The Diversified Machinery Industry is an established industry and because of
this, taking market share from competitors is the only way to grow. This is a
very concentrated industry with only a few large, well established companies.
Caterpillar Inc. (CAT), Detroit Diesel Corporation (privately held), and Mack
Trucks Inc. (privately held) are the major players in the industry. Because of this
concentration, the firms in the industry are able to control, to some extent,
pricing levels. Product differentiation is for the most part, negligible, and
therefore firms must compete on other factors. Because of this, firms must
attract, and keep customers on the basis of price.
Diesel Engine Sales
0
2
4
6
8
10
12
14
16
18
2001 2002 2003 2004 2005
Years
Sales in Billions of Dollars
CatCummins

- 13 -
Another key factor that plays into the rivalry among existing firms is the low cost
of switching amongst products. Because of the undifferentiated nature of the
products produced in the industry, customers will ‘switch’ from one firm to
another on the basis of cost.
With the high degree of governmental regulation in the industry, firms must also
keep up with the Environmental Protection Agency standards. This increases the
level of competition in the industry, because firms are constantly trying to
improve upon current technology in order to meet these ever increasing
standards.
The diversified machinery industry is a well established industry with a high
concentration of firms, an undifferentiated product, and a low degree of
switching costs. In light of this, we believe that the competition among existing
firms is high.
Threats of New Entrants
While existing firms pose a large threat the competitors in an industry, we can
not overlook new firms vying for market share in the industry. New firms trying
to enter into the industry must overcome several barriers to entry. The height of
these barriers dictates the ease to which firms can enter into the industry. Some
significant barriers to entry include: economies of scale, first mover advantage,
and legal barriers.
Inventory, Property Plant and Equipment make up almost 40% of Cummins Inc.
total assets of $6.89 billion. With such large economies of scale, new entrants
find it hard to enter the industry without a significant disadvantage. A company
would have to invest several billions of dollars in order to design a number of
- 14 -
different types of engines and manufacturing techniques to effectively compete
with the already established companies in the industry.
Another major hurdle is brand image or name recognition, which gives rise to the
first mover advantage. Firms in the industry have already established
themselves as companies that provide a quality dependable product. In the
diesel engine and power generation business, having a reputation for reliability is
the main feature that can attract new customers. This is not something that
occurs overnight, but rather is built through years of quality products, services,
and relationships.
There are many restrictions set forth by the Environmental Protection Agency
(EPA) that require strict adherence. Adherence to these standards set by the
EPA calls for intensive costs brought on by research and development. Because
firms must spend such large amounts on research and development without
seeing immediate benefits, firms entering into the industry will find it hard to
compete.
Due to the height of the barriers to entry such as economies of scale, first mover
advantage, and other legal restrictions, we believe that the threat of new
entrants is low.
Threat of Substitute Products
We cannot limit our analysis to the confines of one industry. We must take into
account the threat of products that could be used as a substitute for the
products made by the firms in the industry. The threat of substitute products
depends largely upon customers’ willingness to substitute other products

- 15 -
The threat of substitute products is a dangerous one. In the engine segment,
firms in the industry who produce a diesel engine for light-truck applications
have to compete, not only against companies that produce diesel engine, but
other companies outside the industry that produce non-diesel engines for the
same application in the light-truck. Also, as gas prices continue to soar, the
demand for alternative fuel sources are rising. With companies developing
engines that take advantage of these alternative fuels, the threat to the diesel
engine manufacturing industry is compounded.
With companies producing gasoline engines as well as companies trying to take
advantage of alternative fuel sources, we believe that the threat of substitute
products is relatively high.
Bargaining Power of Buyers
The bargaining power of buyers is a key force in determining the level of
competition in the industry. We must consider two key factors in relation to the
bargaining power of buyers: the buyers’ sensitivity to price, and the buyers’
power over the bargaining process.
Diversified machinery manufacturers tend to compete on price and reputation.
Firms in the industry must compete on both, relying heavily on reputation as well
as pay attention to high price sensitivity giving rise to the high bargaining power
of buyers. Because engines are undifferentiated and carry with them few
switching costs, buyers are more price sensitive. To combat this, firms have
tried to develop a reputation for high performance and quality. Engines, power
generators, and high end components tend to represent a high portion of buyers’
final cost which leads to buyers actively in search of the low cost alternatives.

- 16 -
Also, buyers have relatively higher bargaining power compared to firms. While
there are many buyers, there are many suppliers as well. Since each buyer
tends to buy high volumes, the cost of not doing business is higher for firms in
the industry than to the buyer. Other major factors include the high number of
alternatives along with the low switching costs. Many buyers manufacture
similar products which leaves the door open for reverse engineering by buyers.
With buyers’ sensitivity to price high as well as their overall bargaining power, we
consider the bargaining power of buyers as a high threat.
Bargaining Power of Suppliers
To stay competitive, diversified machinery manufacturers need to be able to
negotiate lower prices with their suppliers. Cummins Inc, with 2006 sales of
$9.92 billion in their engine segment, competes with companies like Caterpillar
who had 2006 sales in the engine segment of $11.08 billion. With the large
volume of sales, this allows companies in the industry to have a strong
bargaining power over their suppliers.
Furthermore, a main supply purchased by firms in the industry, metals, is a
commodity so many substitutes are available and the switching costs are low.
For finished components required for their projects, firms have developed
strategic alliances with a number of companies internationally which help to
maintain lower costs. Due to their relative size, firms in the industry can
negotiate for the lowest price possible allowing firms to keep prices as low as
possible and maintain current relationships thus attracting new buyers.
Due to the large amount of sales that firms in this industry create, we contend
that the bargaining power of suppliers is low.

- 17 -
Strategies for Creating a Competitive Advantage
A firm’s profitability is dictated not only by the industry that it competes in, but
also by the way in which it positions itself in their respective industry. There are
two basic ways in which we can classify a firm’s competitive strategy: cost
leadership and differentiation.
Cost leadership involves supplying the same products or services at a lower cost.
Employing a cost leadership strategy involves focusing on economies of scale
and scope and efficient production. Cummins deploys a range of strategies in
which to control costs by beginning with implementing the six sigma approach to
manufacturing to cut out unnecessary processes which will improve overall ability
to control quality management and reduce defective products form being created
thus cutting costs and further benefiting both the company and the end
consumer. After the introduction of this strategy in the beginning of 2000,
Cummins has saved 2 percent from its bottom line and is now expanding this
strategy to how it works with it suppliers as well. Cummins also takes cost
leadership approach to how it develops new technologies by partnering with
companies in China and India and sharing development costs with strategic
partners, also Cummins relies on making computer models of what could be the
next product instead of making several prototypes to save R&D costs. (Data
collected from Cummins 2005 annual report)
Differentiation is focused on supplying a unique product or service at a cost
lower than the price premium customers will pay. Cummins differentiates their
products by focusing on superior product quality, variety with different engine
sizes, and also customer service. They invest heavily in brand image and
research and development, with control systems focused on creativity and
innovations.

- 18 -
Firms in the Diversified Machinery industry must employ a mixed strategy in
order to achieve a competitive advantage. Leaders in the industry must employ
a low-cost strategy while maintaining product quality. Firms in the industry
achieve lower costs through economies of scale and scope. The emphasis on
quality derives from government regulations and market demand for increased
product efficiency and duration.
Investment in brand image and the growing constraints of the Environmental
Protection Agency are causing companies to invest heavily in research and
development. This is an industry that relies heavily on trust. While buyers
concentrate on price, a positive brand image known for quality products
supplemented with superior customer service is also required.
Competitive Advantage Analysis
Cummins Inc. holds a strong competitive advantage in the industry of diversified
machinery despite competing against companies, such as Caterpillar, with a
significantly larger market share. As a global leader in the production and
marketing of large diesel engines, the company is well equipped to flourish
through cost-leadership and quality in a highly concentrated environment.
Despite this concentration, Cummins Inc. understands that customers are very
price-sensitive and demand higher product quality, both focal points of the
company’s operations. Cummins Inc. strives to maintain a cost-leadership role by
continuously searching for lower input costs from less expensive international
markets. Company growth is becoming increasingly dependent on Cummins Inc.
ability to meet government standards and regulations before the competition,
especially in its engine line. Cummins Inc. anticipates high future growth by
expanding the types of products offered to current customers and focusing on
growth in related markets, domestically and internationally.

- 19 -
Cummins has the potential to attract a lot more business in an increasingly global
economy by further expanding their established international presence. Almost
51% of the company’s consolidated net sales stem from operations abroad.
Cummins has a significant presence in India and China, two of the world’s fastest
growing economies. A future increase in market share is a likely result of their
presence abroad. Growth potential is significantly larger for Cummins abroad.
By incorporating Six Sigma in manufacturing, product design, and procedures
with customers, suppliers, and distributors, Cummins has significantly reduced
costs and improved quality in these areas of the business. The effort to attain
perfection through Six Sigma pays dividends through improved customer
relationships and product quality. The continuous and successful implementation
of Six Sigma is major competitive advantage. However, this advantage will slowly
fade as Cummins forces competitors to adopt the strategy or lose market share.
Six Sigma currently plays a major role in minimizing defects throughout the
company’s business, but financial information concerning the quantitative impact
of Six Sigma is unavailable through public information.
This highly concentrated industry naturally forces companies to grow by seizing a
larger market share. Cummins Inc. has entered into long-term supply
agreements with key customers such as DaimlerChrysler, Volvo Trucks North
America, Inc., and Navistar International Corporation. This move not only
improves customer service relationships with buyers, it guarantees holding an
increased market share for several years.
DaimlerChrysler contributes twelve percent of Cummins Inc. net sales. Although
this a small percentage in some industries, losing their business can potentially
have an adverse effect on the company. This is magnified by the fact that
DaimlerChrysler and other engine customers outsource this portion of their
business to Cummins Inc.. These companies have the capabilities to produce

- 20 -
their own engines yet continue to outsource to Cummins Inc.. Although this
reveals the quality of product and low-cost of production for Cummins Inc., the
retention of these customers after the duration of the long-term contracts
appears questionable. Customer relations and price are key determinants in
ensuring continued business with these customers.
Accounting Analysis
The purpose behind the accounting analysis is to assess how well a firm’s
accounting captures the reality of the firm’s underlying business reality. In order
to determine the distortion in the accounting numbers, we must first identify
areas that lend themselves to flexibility, and determine the appropriateness of
the accounting policies and estimates used by the firm. The quality of
accounting is influenced by three factors: rigidity in accounting rules, the degree
of accuracy in management forecasts, and management’s selection of certain
accounting choices to achieve a particular end-result. Those account for any
discrepancies between the true underlying economic position of the company
and the state of the company according to management’s best estimates.
Identify Key Accounting Policies
Cummins Inc. employs many different accounting policies in order to provide
relevant information in their consolidated financial statements, and reveal the
company’s current and prospective economic reality. The company’s competitive
business strategy includes a mix of cost-leadership and differentiation. Both
elements in the mixed strategy heavily influence the key accounting policies that
Cummins Inc. Inc. selects. Both the industry and Cummins Inc. rely on
accounting policies that, depending on management’s selection between the
different policies, can significantly impact the financial statements. The key

- 21 -
accounting policies recognized by Cummins Inc. relate to Research and
Development (R&D), Goodwill, Warranty Provisions, and Inventory Management.
Under the provision of SFAS 2, Research and Development must be expensed in
the time period in which it occurs. The problem with firms that derive such a
benefit from heavy investment in Research and Development is that they are
unable to adequately explain the effect that it has on their financial statements.
One way that the benefit of Research and Development can be directly attributed
to future benefits is through greater access to international markets demanding
compliance with more stringent environmental standards. The development of
engines that comply with U.S. standards puts Cummins Inc. Inc. in position to be
a leader in foreign markets as they continue to grow. The importance of cost-
leadership can be seen in the amount spent on Research and Development in
order to produce a more efficient product. Research and development cost for
2005 accounted for $278 million, which is equivalent to 4.04% of total assets.
For the years 2003-2005 Research and Development costs accounted for an
average of about $240 million, which is equivalent to an overall average of 3.9%
of the total assets over the same time period. Access to these foreign markets
allowed sales to increase by 57.5% from net sales of 6.3 billion in 2003 to 9.9
billion in 2005.
Another major accounting policy deals with accounting for Goodwill. Under the
provisions of SFAS 142, “Goodwill and Other Intangible Assets,” the carrying
value of assets acquired is reviewed annually. Goodwill, which comprised of
$358 million dollars in 2005, could be significantly altered by changes in
estimates or economic conditions. Cummins Inc. Inc. emphasizes the importance
of their brand-image, a key success factor accumulated from mergers and
acquisitions. Goodwill is the “excess of the purchase price paid over the fair value
of net assets acquired in a business combination accounted for as a purchase,”
according to Cummins Inc. 10-K. While impairment is a more appropriate

- 22 -
accounting policy than amortization, this lends itself to accounting distortions due
to management’s evaluation of the fair value. However, because goodwill
comprises .032% of Cummins total revenues, a relatively small amount,
management discretion on fair value estimates will not materially impact the
company’s state of operations.
Warranty provisions are another key factor in accounting policies. Cummins Inc.
includes warranties on its products to improve the quality of its brand image.
Cummins Inc. Inc. charges estimated warranty costs to earnings at the time
products are delivered to the customer and estimates liabilities associated with
warranty cost using a historical experience of warranty programs. However,
warranty liability estimates can result in higher or lower expenses depending on
management estimates. Revenue is recognized on a straight-line basis over the
contract period. If warranty expense estimates are lower than the actual future
warranty claims, earnings are overstated. Overall during the period of 2002-
2005, Cummins Inc. was relatively consistent in provisions for warranties issued.
Provisions increased at a rate consistent with sales over the same time period.
Cummins Inc.’ estimation of warranty liabilities appears to be more conservative
because of their consistent overstatement of provisions for warranty liability.
Actual warranty payments as a percentage of provisions for warranties were
72.22% in 2004 and 80.27% in 2005. Because of the conservative reporting of
provisions for warranties, net income is understated.

- 23 -
Warranty Provisions in Relation to Actual Warranty Payments
050
100150200250300350400450
2003 2004 2005
Mill
ions
Provision forWarrantiesActual WarrantPayments
No period before 2003 is relevant as the provision from warranties and the actual
payments were not audited in 2002. Although management estimates for
warranty provisions have improved since 2003 (actual payments made up 49%
of provisions for 2003), it is evident that Cummins consistently overstates
warranty provisions.
Warranty Provisions as Realated to Net Sales (Using a Logarithmic Scale)
1
1000
1000000
2001 2002 2003
Year
$ in
Mill
ions Net Sales
WarrantyProvisions

- 24 -
Cummins Inc. does not distinguish raw materials from work-in-progress because
of the constant movement of resources from different locations. They also
recognize their inventories using either the lower of cost or the net realizable
value. Inventory management is a huge component of Cummins Inc. key
accounting policies. Choice of accounting policy for valuing inventory can have a
significant influence on the assets of the balance sheet. Cummins Inc. values
78% of its domestic inventory using FIFO and the remaining 22%, comprised
mostly of heavy-duty, high-horsepower engines and parts are valued using LIFO.
Cummins Inc. reported sales of $2.1 billion in their Heavy-Duty truck engine
segment, which accounted for approximately 22% of overall net sales. When
reporting cost of good sold, Cummins Inc. has chosen to use the LIFO method of
accounting for inventory in this heavy-Duty engine segment. By using the LIFO
method, cost of goods sold in the Heavy-Duty truck engine segment is
overstated in a rising price environment. Since this segment makes up almost
Components of Engine Segment (As % of Engine Sales)
32%
14%
17%
27%
10%
Heavy-DutyMedium-DutyLight-DutyIndustrialStationary-Power

- 25 -
22% of sales outstanding, this reduces income taxes payable significantly
through understating gross margin, and ultimately reducing net earnings.
Accounting Flexibility
Cummins Inc.’ management team has many different ways that it can account
for its key accounting policies. Managers in diversified machinery have a choice
of how to classify inventory. Cummins Inc. uses a combination of FIFO and LIFO,
although FIFO comprises for a majority (78%) of the inventory. If a situation
arises where management needs to increase their expenses and lower their tax
base, they could switch to using predominantly LIFO. However, this is a stringent
transition process that the I.R.S. would have to approve. Although FIFO is more
indicative of actual inventory levels, switching to LIFO would reduce the value
created from employing FIFO for tax purposes. Additionally, auditors would
question the switch and raise issues about the underlying motive for pursuing
FIFO, a more transparent inventory policy. Caterpillar uses an accounting
strategy that is almost the complete opposite of Cummins Inc. Caterpillar is
considerably larger than Cummins Inc. with total assets of $47 Billion compared
to that of Cummins Inc. with total assets of $6.9 Billion. Because Caterpillar is
such a large and well-established firm, we believe that they use LIFO in order to
reduce their tax base. Cummins Inc., a smaller company with more growth
potential, uses FIFO to boost earnings and portray as much economic growth as
possible. Cummins Inc. discloses the excess of FIFO over LIFO to be 69 million in
2005, and an average of 65 million for the period of 2003-2005. With gross
margin being overstated, we can assume that at an income tax rate of 35%,
Cummings is distorting income taxes payable by approximately 24 million. This
helps create value by reducing the taxes paid to the Internal Revenue Service.
Management is allowed to use LIFO for tax purposes and Cummins employs LIFO
to reduce taxable income and the associated income taxes payable.
- 26 -
Management has no accounting flexibility when recording Research and
Development in accordance with GAAP. R&D has to be expensed in the time
period it occurs and severely limits management’s ability to accurately convey its
true economic position. The rigidity of accounting standards for reporting R&D
restricts management flexibility in presenting a key success factor of the firm.
Current accounting standards allow significant management discretion in
estimating warranty liabilities. Warranty liability estimates can result in higher or
lower expenses depending on management estimates. Management can increase
warranty liability estimates to increase expenses and smooth earnings or
decrease estimates to reduce the perceived present and future liability
obligations, increasing net income and improving the appearance of the capital
structure.
Cummins Inc., over many years of acquisitions, has increased its focus on brand-
image. This is reflected in its $358 million in goodwill. SFAS no. 142 grants the
company the option to check for goodwill impairment annually. Management’s
estimate on the fair value of goodwill determines whether or not goodwill is
considered impaired. For the period of 2003-2005, Cummins Inc.’ management
has decided not to impair goodwill stating that the individual business segments’
fair value of has exceeded their book value, and therefore in management’s
opinion does not require impairment.
Post-retirement benefits and pension plans make-up a significant portion of
company liabilities and could potentially affect Cummins Inc. ability to achieve
their goal of cost-leadership. Cummins Inc. has a defined benefit plan for hourly
employees and a cash basis formula for salaried employees. The defined benefit
plan creates a greater liability for the company as it states the expected future
outflow of cash to be distributed to employees when they draw down from the
account. Management estimates on the growth of these defined benefit plans
- 27 -
can result in the plan being over or under-funded. The pension plan has 64.7%
invested in equity securities, making the fund more susceptible to systematic
risk. Management could reduce their pension obligations by switching to a
defined contribution plan, making it difficult to under-fund the plan unless it is
drawn down on by the company. However, existing plans cannot be altered
unless Cummins becomes bankrupt. Cummins must respect its current
obligations and instead alter the benefit program for new employees and future
hires. Postretirement benefit plans by Cummins Inc. provide a variety of health
care and life insurance benefits to eligible employees.
Evaluation of Actual Accounting Strategy
All publicly traded companies in the U.S. are required to file the appropriate
financial statements with the Securities and Exchange Commission (SEC). These
financial statements must comply with the Generally Accepted Accounting
Procedures (GAAP) which have been set by the Federal Accounting Standards
Board (FASB). In order to determine how well Cummins Inc. does in reporting
standards, we can look at how they handled a material accounting mistake.
On August 4th, 2003 Cummins Inc. restated its financials for the years 2000-
2002, due to an error in reconciling accounts receivables in two manufacturing
locations, in Fridley Minnesota, and Darlington, United Kingdom. These two
manufacturing locations combined accounted for 15-20% of total revenues. Due
to the material impact of the mistake, Cummins Inc. was required to restate its
financials. In January of 2003, Cummins Inc. notified the SEC that they had
identified a potentially material accounting error. After disclosing the error to the
SEC, Cummins Inc. took the following steps: (From the SECURITIES EXCHANGE ACT OF
1934 Release No. 53236 / February 7, 2006 ACCOUNTING & AUDITING ENFORCEMENT Release
No. 2370 / February 7, 2006 ADMINISTRATIVE PROCEEDING File No. 3-12173)

- 28 -
“(1) it sent trained accounting personnel from the corporate office and the
company’s outside auditor to Fridley to investigate the accounts payable
accounts reconciliation issues and resolve them; (2) it retained special counsel to
conduct an internal investigation; (3) it issued a press release announcing the
potential adjustment; and (4) it fired the accounting personnel responsible for
the delinquent account reconciliations in question.“
The effect of the adjustments was as follows:
Cummins Inc. Restatement 2002
(Millions)
2001
(Millions)
2000
(Millions)
Pre-2000
(Millions)
Previously reported net earnings $72 $(102) $8
Restatement adjustments (after tax) $10 $(1) $6 ($37)
Restated net earnings $82 $(103) $14
As a percentage of restated earnings 12% 1% 43%
According to the SEC report, Cummins Inc. was ordered to “cease and desist
from future violations of the books and records and reporting rules.” Also, it is of
note that the SEC “took into consideration the cooperation and remedial acts of
Cummins Inc. in determining the terms of the settlement.” While this was not
using accounting flexibility to cloud the financial statements, it is of note that
Cummins Inc. was pro-active in response to the accounting mistake which in turn
allowed them to fix the problem without drastic sanctions by the SEC.
Cummins Inc. accounting choice of valuing inventory using FIFO is an aggressive
approach when compared to its largest public competitor, Caterpillar. FIFO
reduces expenses and increases net income. This allows Cummins Inc. to show a
higher net income to support further growth in periods of higher costs. However,
because FIFO gives a more realistic portrayal of actual movements in most
- 29 -
inventories, it is a proper accounting choice for the company. Cummins Inc.
incorporation of LIFO for its heavy-duty engine line shows that it is not being
overly aggressive in its use of accounting flexibility to increase the bottom line.
The discount rate used for determining pension and other postretirement
benefits, at 5.75%, is, in our opinion a little low considering its credit rating is
just below investment grade. An increase in the discount rate will lower the
present value of pension obligations, indicating that the pension fund is well-
funded for the future. The total benefit obligations are currently under-funded by
$377 million, requiring the company to finance claims through retained earnings.
A continuation of this trend could have an adverse affect on Cummins Inc. ability
to be a cost leader or pay their debt obligations. Management’s current
assumption of the compensation increase rate (increase in the cost of living) is at
4%, a modest compensation increase rate considering inflation has historically
grown at around 3%, only leaving a 1% cushion for unexpected spikes in
inflation. Cummins accounting for pension obligations is slightly conservative by
selecting a low discount rate. A slight increase in this rate can materially change
the status of the pension fund from under-funded to profitable.
Evaluation of the Quality of Disclosure
To determine the extent of accounting distortions, we use sales and expense
diagnostic ratios, and compare the firm across a five-year period as well as
against the industry. Earnings management is the process of creating “honey
jar” reserves in good years to pad financial statements in bad years. By running
the firm through the various sales and expense diagnostic ratios, we will be able
to determine how forthcoming Cummins Inc. has been in their financial
statements.

- 30 -
Sales Diagnostic Ratios for Cummins Inc. Inc. are computed below.
Cummins Inc. Inc. 2001 2002 2003 2004 2005
Net Sales/ Cash from Sales 1.10 1.13 1.15 1.14 1.15
Net Sales/ Net Accounts Receivable 10.99 8.66 7.54 8.12 7.55
Net Sales/ Unearned Revenues N/A N/A N/A N/A N/A
Net Sales/ Warranty Liabilities 17.64 18.41 17.59 17.58 17.19
Net Sales/ Inventory 8.33 9.13 8.59 8.31 8.45
Overall, Cummins Inc. has done a good job with disclosure. This is evident by
the consistency of the ratios over the period from 2001-2005. The ratio of Net
Sales/ Cash from Sales tells us that Cummins Inc. is consistently doing a good
job with cash collections from sales. This is further shown in the Net Sales/ Net
accounts Receivable ratio. Warranty Liabilities are being properly accounted for,
and Cummins Inc. is doing a good job with inventory management. We can also
compare the ratios of Cummins Inc. to that of their major competitor Caterpillar.
We will go into a more in-depth discussion of the ratios below.
Caterpillar 2001 2002 2003 2004 2005
Net Sales/ Cash from Sales 1.16 1.18 1.24 1.36 1.28
Net Sales/ Net Accounts Receivable 7.34 6.57 5.22 3.80 4.52
Net Sales/ Unearned Revenues N/A N/A N/A N/A N/A
Net Sales/ Warranty Liabilities 29.18 26.91 33.73 36.10 38.69
Net Sales/ Inventory 6.50 6.75 6.91 6.06 6.51

- 31 -
We can also look at the expense manipulation diagnostic ratios
Cummins Inc. Inc. 2001 2002 2003 2004 2005
Asset Turnover (sales/assets) 1.32 1.21 1.23 1.30 1.44
Changes in CFFO/OI 1.85 0.85 -1.06 1.21 0.41
Changes in CFFO/NOA 1.78 0.11 -0.17 0.31 0.38
Total Accruals/Change in Sales .27 -1.08 -.6 -.12 -.14
Pension Expense/SG&A 0.03 0.03 0.07 0.09 0.09
Other Employment Expenses/ SG&A N/A N/A N/A N/A N/A
Again, Cummins Inc. is doing a good job with disclosure. Asset Turnover has
been relatively steady until 2005 when the Asset Turnover ratio increased by
0.14. This was the result in an almost 18% increase in sales from the year
2004-2005. The drastic change in CFFO/OI was probably due to a 40% increase
in operating income from 2004-2005. Pension expense/SG&A increased over the
five-year period. We also compared the ratios to the industry in order to have a
frame of reference in which to base our assumptions on.
Caterpillar 2001 2002 2003 2004 2005
Asset Turnover (sales/assets) 0.77 0.71 0.57 0.66 0.72
Changes in CFFO/OI 0.17 47.38 -22.73 1.60 6.46
Changes in CFFO/NOA -0.04 0.17 -2.04 0.24 1.81
Total Accruals/Change in Sales -0.65 4.21 33.33 26.60 15.49
Pension Expense/SG&A -0.07 -0.04 0.03 0.09 0.11
Other Employment Expenses/ SG&A N/A N/A N/A N/A N/A

- 32 -
In-Depth Quantitative Analysis
Net Sales/Cash From Sales
1.05
1.10
1.15
1.20
1.25
1.30
1.35
1.40
1.05
1.10
1.15
1.20
1.25
1.30
1.35
1.40
Cummins 1.10 1.13 1.15 1.14 1.15
Caterpillar 1.16 1.18 1.24 1.36 1.28
2001 2002 2003 2004 2005
The ratio between Net Sales and Cash from Sales for Cummins Inc. has been
steady, ranging from 1.1 to 1.15 for the years 2001-2005. Overall both
Caterpillar and Cummins Inc. had a ratio that was between 1 and 1.5 which tells
us that cash collection policies for the two companies were fairly comparable.
This ratio of a little greater than one tells us that cash collections from sales was
significant compared to net sales. In 2004, Caterpillar experienced a slight
increase in this ratio from 1.24 to 1.36, while Cummins Inc. remained steady
over the same time. This could be due a more relaxed accounts receivable
policy. Cummins Inc. is doing a better job collecting cash from sales than
Caterpillar, although by relatively insignificant amount.

- 33 -
Net Sales/ Net Accounts Receivable
0.00
1.00
2.00
3.00
4.00
5.00
6.00
7.00
8.00
9.00
10.00
11.00
12.00
Years
0.00
2.00
4.00
6.00
8.00
10.00
12.00
Cummins 10.99 8.66 7.54 8.12 7.55
Caterpillar 7.34 6.57 5.22 3.80 4.52
2001 2002 2003 2004 2005
The ratio of Net Sales to Net Accounts Receivable shows how well the company
is managing their accounts receivable. Both Cummins Inc. and Caterpillar are
doing a good job stating actual revenues. Cummins Inc. accounts receivables
are a smaller percentage of sales than that of Caterpillar, which indicates that
sales are supported by accounts receivable. Cummins Inc. should be aware that
although net sales drastically increased in 2004 and 2005 (33% and 18%
increase respectively), the ratio of Net Sales to Net Accounts Receivable did not
increase. When growth slows, Cummins Inc. will be well-positioned to get cash
quicker from Accounts Receivable. Although this ratio declines with an improving
economy, this ratio remains somewhat steady and supports the validity of the
company’s performance.

- 34 -
Net Sales/ Inventory
0.00
1.00
2.00
3.00
4.00
5.00
6.00
7.00
8.00
9.00
10.00
Cummins 8.33 9.13 8.59 8.31 8.45
Caterpillar 6.50 6.75 6.91 6.06 6.51
2001 2002 2003 2004 2005
The ratio of Net Sales to Inventory tells us that inventory and sales have
remained constant over the period of 2001-2005. Cummins Inc. is doing a better
job of managing their inventory. With the high cost to keep inventory on hand,
Cummins Inc. is showing their ability to forecast sales and keep a proper amount
of inventory on hand. In this industry, cost-leadership is a key success factor.
Cummins Inc. does not have the amount of money tied up in inventory that
Caterpillar does, which allows them to keep risk of an economic downturn at a
minimum. The steadiness of this ratio for both Cummins and Caterpillar indicate
that the industry is well-developed and mature. Inventory levels are on par with
sales throughout the entire period.
- 35 -
Net Sales/ Warranty Liabilities
0.00
5.00
10.00
15.00
20.00
25.00
30.00
35.00
40.00
45.00
Cummins 17.64 18.41 17.59 17.58 17.19
Caterpillar 29.18 26.91 33.73 36.10 38.69
2001 2002 2003 2004 2005
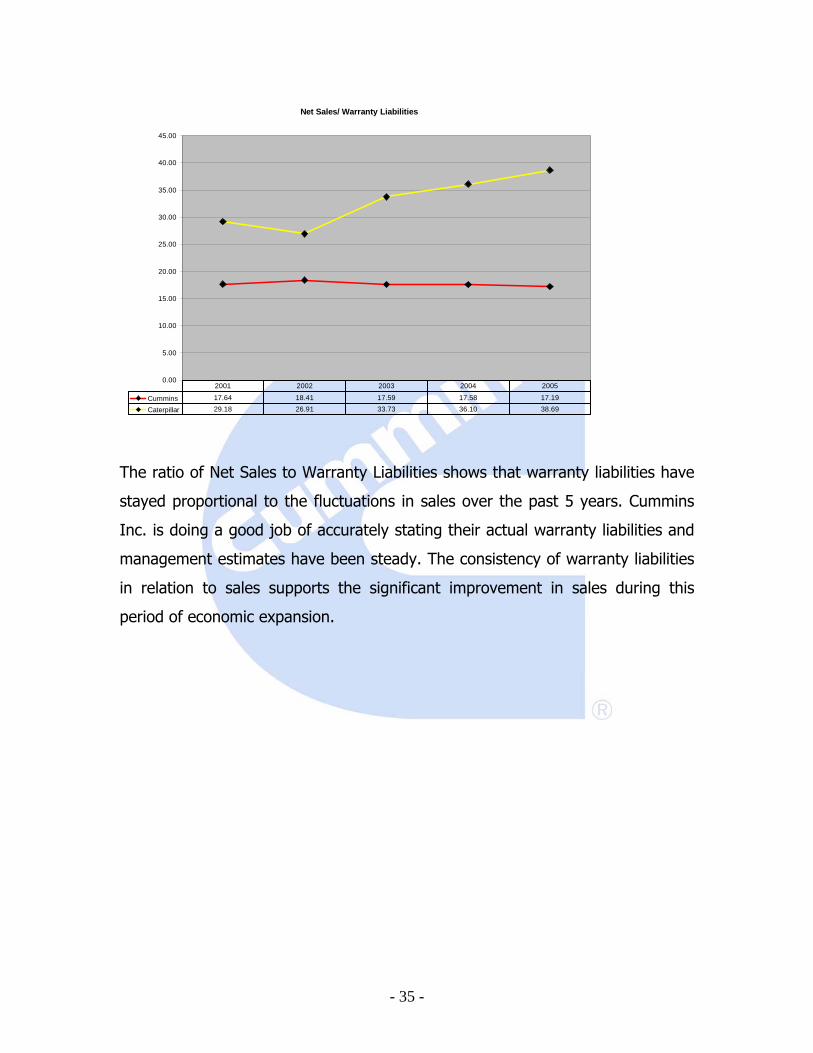
The ratio of Net Sales to Warranty Liabilities shows that warranty liabilities have
stayed proportional to the fluctuations in sales over the past 5 years. Cummins
Inc. is doing a good job of accurately stating their actual warranty liabilities and
management estimates have been steady. The consistency of warranty liabilities
in relation to sales supports the significant improvement in sales during this
period of economic expansion.

- 36 -
Asset Turnover (Sales/Assets)
0.00
0.20
0.40
0.60
0.80
1.00
1.20
1.40
1.60
Cummins 1.32 1.21 1.23 1.30 1.44
Caterpillar 0.77 0.71 0.57 0.66 0.72
2001 2002 2003 2004 2005
Asset turnover measures an entity’s capability to efficiently use assets to
accumulate sales. Cummins Inc. has had less fluctuation than Caterpillar and
more efficiently uses its assets to generate sales. Cummins Inc. asset turnover is
very high as it produced over $1.4 dollars in sales for every dollar of assets.
Caterpillar produced less than a dollar in sales for every dollar it holds as assets.
Cummins has a smaller asset base than Caterpillar, explaining why their sales are

- 37 -
lower than Caterpillars.
Changes in CFFO/OI
-10.00
-8.00
-6.00
-4.00
-2.00
0.00
2.00
4.00
6.00
8.00
10.00
-30.00
-20.00
-10.00
0.00
10.00
20.00
30.00
40.00
50.00
60.00
Cummins 1.85 0.85 -1.06 1.21 0.41
Caterpillar 0.17 47.38 -22.73 1.60 6.46
2001 2002 2003 2004 2005
Cummins Inc.’ cash flow is in line with operating income. The ratio fluctuates
around one over the period of 2001-2005. Overstating expense on the income
statement would cause the ratio to increase. Caterpillar has had some large
fluctuation possible due to an overstatement of expenses. In general, a lower
number represents cash flows from operations as opposed to investing. This
means that Cummins cash flows from operations can be clarified by its operating
income.

- 38 -
Changes in CFFO/NOA
-2.50
-2.00
-1.50
-1.00
-0.50
0.00
0.50
1.00
1.50
2.00
2.50
Cummins 1.78 0.11 -0.17 0.31 0.38
Caterpillar -0.04 0.17 -2.04 0.24 1.81
2001 2002 2003 2004 2005
The ratio of CFFO to NOA gives us the firm’s return from operating assets in
terms of cash flow from operations. Both companies showed a decrease in the
in the ratio during the year 2001-2003 but investment in operating assets picked
up after 2003. In 2003 and 2004 Caterpillar experienced negative cash flow
which explains the sharp increase in the ratio. Investing in operating assets to
produce increased cash flows from operations is not a strategy Cummins is
employing.

- 39 -
Pension Expense/SG&A
-0.10
-0.05
0.00
0.05
0.10
0.15
Cummins 0.03 0.03 0.07 0.09 0.09
Caterpillar -0.07 -0.04 0.03 0.09 0.11
2001 2002 2003 2004 2005
This ratio show how pension expenses compare to fixed costs and overhead over
the five year period. The diversified machinery industry is highly unionized,
making pension expenses a significant cost. The industry requires quality pension
plans to attract quality workers in the labor market. However, if pension cost
consisted of a major part of SG&A, companies can have trouble fulfilling its
pension obligations and reduce margins for each item sold. The increase in
pension expenses over SG&A can be attributed to a large number of baby-
boomers retiring. Caterpillar’s pension expenses have increased at an alarming
rate and could become less competitive as it has assumed large obligations.
Cummins Inc. pension expenses have increased to almost 10% of SG&A, but it
has increased at a much slower rate than Caterpillar. Cummins Inc. has done a
relatively better job of minimizing its pension obligations as a proportion of
SG&A. Pension assumptions are not very aggressive, especially concerning the
discount rate. An increase in the discount rate would significantly lower this ratio
for Cummins and truly convey its financial stability in managing long-term
obligations.

- 40 -
Identification of Potential “Red Flags”
To valuate any company properly you must go through all the accounting books
and identify any red flags that might be presented that would make a company
appear more valuable than it really is. Cummins Inc. overall, has sound
accounting methods and practices that deliver mostly a clear view of how the
company is currently standing and where it has potential for future growth. It
does, however, have a few minor sections of its financials that are worth looking
into. The first minor red flag has to do with their operational and capital leases
when Cummins Inc. attempts to state that some of the equipment used to make
the engines that are to be sold is stated as being an operational lease and not a
capital lease as it should be. This is usually done to hide some of the liabilities
from an outside entity and to appear more profitable to investors. The second
minor red flag that arose when analyzing the financial statements had to do with
Cummins Inc. pension program, which was drastically under funded by $653
million and in their statement only reports that the program is under funded by
only $310 million. These numbers might seem large, but when you compare
these numbers to Cummins Inc. total liabilities it comes only to about 7.2%.
Undo Accounting Distortions
As was stated in the red flags section, there are some minor distortions in the
liability side of the balance sheet that can be explained even though they are
minor when looking at the company as a whole. The most impacting distortion
has to do with the pension program and its understatement of its liabilities
towards that program. This program’s obligation was $3 billion in the fiscal year
2005 and had a fair value of around 2.3 at end of year which came out to being
$653 million under funded while in the 10k form it states that the benefit plan is
only under funded by $310 million. The remaining 343 million dollars was

- 41 -
transferred to different accounts to get it off of the liabilities and make it look like
they are meeting their commitment when it is actually not the case. The other
distortion in the financial statements has to do with their equipment that is being
stated as being rented to produce their product when in face should be moved
from an operating lease over to a capital lease and show that they actually owe
money to a bank for the loan payments of that equipment. While having these
two minor distortions, Cummins Inc. Inc. still has a very detailed annual report
and 10K that clearly defines the financial state of this company.
Ratio Analysis
Ratio analysis can provide insightful information about a firm by assessing how
different items of a firm’s financial statement relate to one another. A firm’s
liquidity, profitability, and capital structure can be revealed through aggregating
the results of similar ratios and interpreting the data. We will evaluate Cummins’
(C.M.I.) performance using trend analysis, a time-series comparison of company
performance over the past five years, and industry benchmarks, comparing
Cummins’ liquidity, profitability, and capital structure to that of Caterpillar’s.
Trend analysis can be indicative of Cummins’ past, present, and future
performance. Industry analysis, in the case of Cummins, consists of comparing
selected ratios to the firm’s only public competitor, Caterpillar.
We will employ a variety of ratios that thoroughly explain Cummins liquidity,
profitability, and capital structure. Liquidity ratios provide useful information on a
firm’s ability to maintain adequate cash and other current assets necessary to
meet its obligations in a timely manner. Poor liquidity ratios can spell financial
distress for Cummins in the near future. Too much relative debt can cause C.M.I.
to default on interest and principal payments, a solvency issue investors can
foresee through correct interpretation of the company’s liquidity ratios.

- 42 -
Profitability ratios can be broken down into four vital factors related to profits:
operating efficiency, asset productivity, the rate of return on assets, and the rate
of return on equity. These ratios utilize common size income statements to
explain important factors as a percentage of sales and measure how well the
company generates profit and revenue from equity and assets. The capital
structure of Cummins refers to the sources of financing, liabilities and
stockholder’s equity, used to buy assets. Capital structure ratios can be indicative
of the financing policies of Cummins management, their level of comfort with
leverage, and attitude toward business risk.
Trend and Cross-Sectional Analysis
Cummins liquidity, profitability, and capital structure can be accurately assessed
through trend and cross-sectional analysis. Trend analysis and cross-sectional
analysis are relative benchmarks comparing Cummins present performance to its
performance in the past and to the industry as a whole. A five-year trend
analysis is necessary to understand Cummins’ recent progression and provides
insight to the company’s direction. Cross-sectional analysis allows investors to
gauge Cummins performance to rest of the industry. Results from cross-sectional
and trend analysis are used to make educated forecasts from identified trends.
These two forms of financial analysis bring to light Cummins operating efficiency,
annual trends, and financial hierarchy in its industry.
Liquidity
A company’s ability to maintain a certain percentage of cash equivalent assets
that can be used to pay off its current liabilities is referred to a company’s
liquidity. In the past five years Cummins has become much more liquid which is
giving them the ability to pay off more of their current liabilities and to pay off
more of their long term obligations, this however has made their operation

- 43 -
efficiency ratios go down steadily over the previous years. This section will
analyze these five ratios current ratio and quick asset ratio to judge liquidity, and
to further understand the operating efficiency the inventory, receivables, and
working capital turnover ratios will be used and explained to produce a clear
understanding of Cummins liquidity.
Current Ratio
0.00
0.20
0.40
0.60
0.80
1.00
1.20
1.40
1.60
1.80
2.00
Cummins
Caterpillar
Cummins 1.49 1.53 1.49 1.77 1.87
Caterpillar 1.23 1.33 1.22 1.20 1.20
2002 2003 2004 2005 2006
The current ratio is calculated by dividing current assets by current liabilities. The
ratio measures the ability of the firm to pay its short-term obligations. Cummins
averaged a current ratio of 1.63 for the five year period from 2002 through 2006,
while the industry ratio averaged 1.24, for the same period. Both Cummins and
Caterpillar have sufficient means to cover their current obligations, but while
Cummins is increasing its ratio year over year by 12.24% from 2004 to 2006,
Caterpillar’s ratio has remained stagnant at around 1.2. We think that through
the cost cutting and efficiency programs that Cummins has applied, net earnings
have increased substantially affecting the retained income that is reinvested into

- 44 -
the company, and with low capital expenditures Cummins has been able to
increase the size and growth of their current assets.
Quick Ratio
0.00
0.20
0.40
0.60
0.80
1.00
1.20
Cummins
Caterpillar
Cummins 0.83 0.81 0.84 1.02 1.13
Caterpillar 0.83 0.92 0.82 0.80 0.81
2002 2003 2004 2005 2006
The quick ratio is calculated by adding cash, securities and receivables and then
dividing by the current liabilities. This ratio reveals the amount of liquid assets
the company has on hand to cover their short-term debt obligations. Cummins
averaged .92 and 8.29% growth in for their quick ratio for the five year period,
while Caterpillar averaged .82 and had flat growth for the same period. Cummins
is not outperforming the industry by much, but is growing at an average 8.29%
and will in our opinion be able to break away from the industry and set a new
standard. Much of this growth is attributed to the company’s ability to generate
and retain cash better than Caterpillar.

- 45 -
The Accounts Receivable Turnover
0.00
1.00
2.00
3.00
4.00
5.00
6.00
7.00
8.00
Cummins
Caterpillar
Cummins 7.27 6.78 7.27 6.97 6.43
Caterpillar 2.10 2.02 2.40 2.60 2.77
2002 2003 2004 2005 2006
The accounts receivable turnover is found by dividing sales by accounts
receivable. This ratio measures the firm’s ability to collect cash from previous
sales. Cummins had an average turnover of 6.94 which means that it is taking
them 52.56 days to collect on their receivables. One alarming fact is that the rate
at which Cummins collects has been increasing from 50.2 days outstanding in
2002, to 56.76 days in 2006. we are not pleased with managements
ineffectiveness to decrease the collection period. Caterpillar had an average
turnover of 2.38, meaning that their collection period for the five year period
averaged 153.45 days, while reaming relatively flat through the period. While
Cummins may be extending their collection period, they are obviously performing
above the industry average. We attribute the growth into developing economies
as one of the reasons that Cummins has let their turnover ratio slip. These
developing economies are growing at a high rate and have a harder time paying

- 46 -
their short-term debts. By lowering the collection period Cummins could have
more cash to reinvest back into the firm. It would be a bad decision by
management to let this trend continue.
Inventory Turnover
0.00
1.00
2.00
3.00
4.00
5.00
6.00
7.00
8.00
Cummins
Caterpillar
Cummins 7.50 7.06 6.65 6.59 6.29
Caterpillar 5.48 5.56 4.81 5.08 4.65
2002 2003 2004 2005 2006
The inventory turnover is computed by dividing cost of goods sold by inventories.
This ratio tells whether inventories are building up or declining. Cummins
experienced an average turnover of 6.94 or 52.56 days of inventory on hand,
while Caterpillar had an average ratio of 5.12 or 72.66 days in the period
between 2002 and 2006. Cummins is performing above the industry average but
has seen a higher increase in the inventory holding period with an average
increase by 7.28% as opposed to Caterpillar’s average increase of 4.51%. We
believe that this trend has been increasing at this alarming rate due to

- 47 -
management’s inability to accurately forecast sales, and this fault is hurting the
firm’s profitability.
Working Capital Turnover Ratio
0.00
2.00
4.00
6.00
8.00
10.00
12.00
Cummins
Caterpillar
Cummins 8.96 8.57 7.84 5.84 5.44
Caterpillar 7.44 5.46 8.55 9.43 10.81
2002 2003 2004 2005 2006
The working capital turnover is calculated by finding the working capital, which is
current assets less current liabilities and then dividing sales by that number.
Cummins averaged a turnover ratio of 7.33 for 2002 through 2006, compared to
Caterpillar’s average turnover of 8.34 for the same period. Cummins is above the
industry with higher working capital compared to sales, and is also decreasing
their turnover rate at 11.32%, compared to Caterpillar’s increasing turnover rate
of 13.73%. A decreasing turnover rate means that the firm is increasing current
assets more than current liabilities, and therefore is using retained earnings to
finance day to day assets and activities rather than using debt. Caterpillar is
using short-term debt to finance their day to day activities. We think that
Cummins’s trend in increasing working capital can continue to improve the
overall liquidity of the firm as well as the profitability in the next few years.

- 48 -
Profitability Analysis
Profitability analysis is composed of six ratios that measure Cummins efficiency in
generating a profit. These various ratios include gross profit margin, operating
expense, net profit margin, asset productivity, return on assets, and return on
equity. The first three are all measures operating efficiency, a factor of
profitability that attempts to reach a given level of sales with minimum
associated costs. The latter three measure the revenue or profit productivity of
resources utilized by Cummins. Profitability analysis provides insight to how
efficiently the company is employing resources and mitigating costs to produce a
profit.
Profitability Analysis for Cummins
2002 2003 2004 2005 2006
Gross Profit Margin 17.85% 17.84% 19.91% 22.04% 22.84
Operating Expense 15.48% 15.25% 13.46% 13.03% 12.93
Net Profit Margin 1.40% 0.79% 4.15% 5.55% 6.29%
Asset Productivity 1.21 1.23 1.29% 1.44 1.52
Return on Assets 1.70% 0.98% 5.36% 7.99% 9.58%
Return on Equity 8.79% 4.66% 21.75% 26.33% 23.40
Profitability Analysis for Caterpillar
2002 2003 2004 2005 2006
Gross profit margin 24.84% 25.56% 25.77% 26.92% 28.83%
Operating expense ratio 18.27% 18.14% 16.91% 16.50% 16.97%
Net profit margin 3.96% 4.83% 6.71% 7.85% 8.52%
Asset turnover 0.62 0.62 0.70 0.77 0.82
Return on assets 2.44% 3.01% 4.72% 6.06% 6.95%
Return on equity 14.58% 12.11% 27.25% 33.85% 51.57%

- 49 -
In summation, all measures of profitability have considerably increased and
improved in almost every consecutive year. This can be attributed to three
dominant factors: (1) management’s focus on creating investor value through
higher profits and lower expenses using programs such as Six Sigma and (2)
expanding into high growth related markets, such as South East Asia and the
Middle East and (3) a rising economic demand for the industry throughout the
entire five year period.
Gross Profit Margin
0.00%
5.00%
10.00%
15.00%
20.00%
25.00%
30.00%
35.00%
Cummins
Caterpillar
Cummins 17.85% 17.84% 19.91% 22.04% 22.84%
Caterpillar 24.84% 25.65% 25.77% 26.92% 28.83%
2002 2003 2004 2005 2006
The gross profit margin is the percentage of which revenues exceed the direct
costs associated with the revenue. This ratio is affected by the premium
Cummins’ charges, the industry structure and product offered, and the cost
efficiency of the firm’s production. Gross profit margins for the entire industry

- 50 -
have consistently improved over the past five years. Cummins has witnessed the
most year-to-year growth in the period from 2004 to 2006 as a result of the
company’s change in business strategy in 2003. While Caterpillar’s margins are
more favorable (28.84% in 2006 versus Cummins’s margin of 22.84%), Cummins
is improving its margin at faster rate of 7.16% on average, as compared to the
average of 5.78% that Caterpillar has been growing at over the previous three
years. With this higher growth rate, we believe that Cummins should be able to
catch up to Caterpillar’s higher gross profit margins, which we have designated
the industry average, because of the high concentration of the industry.
Although C.M.I.’s gross profit margin falls below the industry average for 2002-
2006, it is improving and is indicative of the company’s growth.
Operating Expense Ratio
0.00%
2.00%
4.00%
6.00%
8.00%
10.00%
12.00%
14.00%
16.00%
18.00%
20.00%
Cummins
Caterpillar
Cummins 15.48% 15.25% 13.46% 13.03% 12.93%
Caterpillar 18.27% 18.14% 16.91% 16.50% 16.97%
2002 2003 2004 2005 2006
- 51 -
The operating expense ratio compares selling, general, and administrative
expenses to sales, reflecting the efficiency of a firm’s operating structure.
Cummins efficiently utilizes operating expenses as a part of sales relative to
Caterpillar. Cummins has been effectively reducing their margin from 15.48% in
2002 to 12.93% in 2006, a 19% improvement for the entire period and an
average yearly reduction of 4.3%, compared to Caterpillar’s average reduction of
only 1.76%. It should also be noted that SG&A expenses only rose at a rate of
12.43% from 2004 to 2006, while net sales increased at a rate of 22% for the
same period. Cummins is an industry leader in controlling operating expenses,
operating 4% more efficiently than Caterpillar’s operating expense ratio of
16.97%. We believe this to be a great competitive advantage for Cummins as it
can generate more sales without a large increase in SG&A, producing wider,
more profitable margins than the industry standards.

- 52 -
Net Profit Margin
0.00%
1.00%
2.00%
3.00%
4.00%
5.00%
6.00%
7.00%
8.00%
9.00%
Cummins
Caterpillar
Cummins 1.40% 0.79% 4.15% 5.55% 6.29%
Caterpillar 3.96% 4.83% 6.71% 7.85% 8.52%
2002 2003 2004 2005 2006
Net profit margin is the percentage of net income to sales. Cummins has
obtained a net profit margin of 6.29% in 2006. In this low profit industry with a
high level of fixed costs, net profit margins in this range are expected. Compared
to its previous profit margins in the period of 2002 to 2003, Cummins has
significantly improved upon turning a profit. This is attributable to a restructuring
phase the business endured between 2003 and 2004 that focused on
productivity and cost control. The restructuring included the implementation of
the Six Sigma program, an increased push to grab a larger international market
share which in turn boosted sales through accessing related markets in
developing economies. Cummins went from profits of 1.4% and .79% in 2002,
2003 and jumped to 4.15%, 5.55% and 6.29% in 2004, 2005 and 2006.
Cummins net profit margin is almost 2% lower than the industry standard.
Caterpillar experienced an 8.52% net profit margin in 2006, but has only been

- 53 -
able to grow their earnings by an average of 12.72% in the last two years, while
Cummins has grown in the same period by an average of 23.6%. Even though
Cummins is currently underperforming compared to the industry, we believe that
the company is producing earnings at a reasonable level and will not have a
problem reaching the industry level because of their attractive earnings growth
rate.
Asset Productivity
0.00
0.20
0.40
0.60
0.80
1.00
1.20
1.40
1.60
Cummins
Caterpillar
Cummins 1.21 1.23 1.29 1.44 1.52
Caterpillar 0.62 0.62 0.70 0.77 0.82
2002 2003 2004 2005 2006
Asset productivity measures how efficiently resources are employed in
generating revenue. Asset productivity is derived by dividing sales by total
assets. Cummins asset productivity exceeds Caterpillar’s for the entire period.
This is a result of Caterpillar having trouble finding efficient ways to generate
sales from its enormous asset base. Simultaneously, Cummins was able to grow
sales without investing in new assets and instead, relied on improving previous

- 54 -
capital investments to increase capacity. Cummins has a relatively smaller asset
base although both own tremendous amounts of resources. Cummins asset
turnover averages 1.42 from 2004 to 2006, meaning that they are bringing in
$1.42 in sales for every dollar spent on assets, as opposed to Caterpillar’s
average of $0.76 in sales revenue for every dollar spent on assets in the same
period. Obviously Cummins is outperforming the industry average in this area,
but are they are only growing their turnover ratio by an average of 5.96%, while
Caterpillar is growing theirs at a rate of 7.39%. Cummins is very productive with
its assets, so it is becoming harder and harder to squeeze sales revenue out of
assets that are producing as close to capacity as possible. Although Caterpillar
has been growing its asset base in order to boost sales, they also have plenty of
room to improve turnover by focusing on productivity. This will in turn make it
easier to attain a higher growth rate. For this reason, we believe that Cummins’
asset turnover ratio growth will slow and level off, allowing the industry to
eventually catch up to Cummins’s productive standards. While the growth in
asset turnover for Cummins will most likely start to level off, we believe that the
company can continue to produce an attractive asset turnover ratio in the future
and stay an industry leader in productivity.

- 55 -
Return on Assets
0.00%
2.00%
4.00%
6.00%
8.00%
10.00%
12.00%
Cummins
Caterpillar
Cummins 1.70% 0.98% 5.36% 7.99% 9.58%
Caterpillar 2.44% 3.01% 4.72% 6.06% 6.95%
2002 2003 2004 2005 2006
Return on assets is a comprehensive measure of profitability that observes both
profits and resources utilized to generate profits. The rate of return is found by
dividing net income by assets. Alternatively, the rate of return on assets can be
found by multiplying the profit margin by asset turnover. As discussed above,
Cummins is the industry leader in productivity of assets. Cummins has
outperformed the industry’s average return on assets of 5.91%, with an average
of 7.64% over the last three years. Also they have been able to outgrow the
industry’s average return on asset growth rate by almost 13% for the same
period. This performance level is attributable to Cummins’ ability to control costs
through programs such as Six Sigma and its ability to control capital spending by
investing in already owned assets. Both boost capacity and productivity, two
areas that eventually enhance net income ROA. We believe that Cummins can
continue to grow ROA at such profitable levels because of their past performance
and new operating strategies.

- 56 -
Return on Equity
0.00%
10.00%
20.00%
30.00%
40.00%
50.00%
60.00%
Cummins
Caterpillar
Cummins 8.79% 4.66% 21.75% 26.33% 23.40%
Caterpillar 14.58% 12.11% 27.25% 33.85% 51.57%
2002 2003 2004 2005 2006
Return on equity (R.O.E.) reflects the profitability of the owner’s interest in total
assets. This rate of return measure is found by dividing net income by owner’s
equity. Return on equity is dependent on profit margins, asset turnover, and the
ratio of total debt to owner’s equity (a ratio discussed under Capital Structure
Ratios). Cummins has witnessed 18.4% growth in its R.O.E. since 2003.
Cummins R.O.E. peaked in 2005 at 26.33% and has since leveled off at 23.40%.
Although Cummins has significantly improved its R.O.E., Cummins shareholder’s
should be cognitive of the fact that Caterpillar experienced a 36.44% increase in
its R.O.E. from 2002-2005. This includes a 17.72% improvement in R.O.E. in
2006, a period in which Cummins return on equity experienced a slight decline.
This poses an interesting consideration for Cummins investors who might see
that as an indication that their ownership interest will not improve its profitability
in the future. However, Cummins decline in R.O.E. in 2006 stems mostly from
increasing total shareholder equity from 1,864 billion dollars in 2005 to 2,802
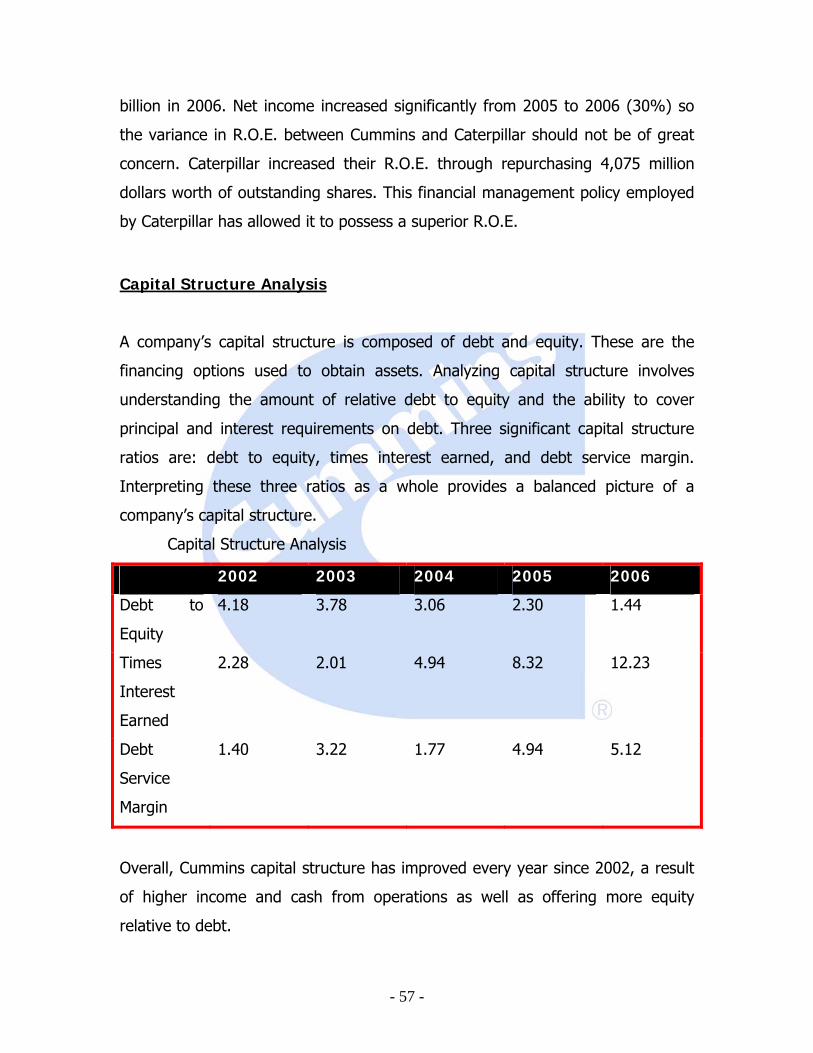
- 57 -
billion in 2006. Net income increased significantly from 2005 to 2006 (30%) so
the variance in R.O.E. between Cummins and Caterpillar should not be of great
concern. Caterpillar increased their R.O.E. through repurchasing 4,075 million
dollars worth of outstanding shares. This financial management policy employed
by Caterpillar has allowed it to possess a superior R.O.E.
Capital Structure Analysis
A company’s capital structure is composed of debt and equity. These are the
financing options used to obtain assets. Analyzing capital structure involves
understanding the amount of relative debt to equity and the ability to cover
principal and interest requirements on debt. Three significant capital structure
ratios are: debt to equity, times interest earned, and debt service margin.
Interpreting these three ratios as a whole provides a balanced picture of a
company’s capital structure.
Capital Structure Analysis
2002 2003 2004 2005 2006
Debt to
Equity
4.18 3.78 3.06 2.30 1.44
Times
Interest
Earned
2.28 2.01 4.94 8.32 12.23
Debt
Service
Margin
1.40 3.22 1.77 4.94 5.12
Overall, Cummins capital structure has improved every year since 2002, a result
of higher income and cash from operations as well as offering more equity
relative to debt.

- 58 -
Debt to Equity Ratio
0.00
1.00
2.00
3.00
4.00
5.00
6.00
7.00
Cummins
Caterpillar
Cummins 4.18 3.78 3.06 2.30 1.44
Caterpillar 4.98 5.00 4.77 4.58 6.42
2002 2003 2004 2005 2006
The debt to equity ratio measures the proportion of total debt relative to equity.
Debt to equity is found by dividing total liabilities by total owner’s equity. A firm’s
debt to equity ratio serves as a good indicator of a company’s credit risk.
Cummins has been decreasing their debt to equity ratio from 4.18 in 2002, to
1.44 in 2006. That is an average decline in debt leverage of 22.7% during the
five year period. Their credit risk also declined and Standard and Poor’s elevated
Cummins credit rating to investment grade with a stable outlook during 2005.
This reduced the company’s cost of debt. Management policies that improved
this ratio include significantly increasing equity financing during 2006 (discussed
under Return on Equity section above) and entering into long-term supply
contracts with suppliers, reducing credit risk and the cost of obtaining debt.

- 59 -
Cummins is well-positioned to repay its obligations in 2007 with a debt to equity
ratio of 1.44. This is important as the industry is anticipating a leveling out or
slight decline in sales for 2007. Caterpillar experienced a slight annual decline in
their debt to equity ratio from 2002 to 2005. In 2006, the company repurchased
4.075 billion dollars worth of outstanding stock, reducing its equity base and
increasing its debt to equity. This indicates that Caterpillar has substantial
leverage and a higher credit risk than Cummins. Caterpillar has increased its
leverage, possessing a 6.42 debt to equity ratio, without reducing its credit
rating. On the other hand, the cost of equity is more expensive than debt,
allowing Caterpillar to continue paying out lower dividends to investors. Cummins
is leading the industry in lower debt to equity through growing by retaining
earnings and acquiring as little debt as possible.
Times Interest Earned
0.00
2.00
4.00
6.00
8.00
10.00
12.00
14.00
16.00
18.00
20.00
Cummins
Caterpillar
Cummins 2.28 2.01 4.94 8.32 12.23
Caterpillar 4.98 7.09 13.03 16.28 19.04
2002 2003 2004 2005 2006
Times interest earned is a ratio that measures the ability of a firm’s income from
operations to cover interest charges. This ratio is found by adding back interest

- 60 -
and taxes to net income (NIBIT) and dividing it by interest expense. From 2002
to 2006, Cummins increased its times interest earned from 2.28 to 12.23, a
437% improvement. The jump can be attributed to a higher growth rate of
income from operations in proportion to interest expense. The high timers
interest earned ratio indicates that the company has substantially enhanced its
ability to pay interest expenses with cash on hand.
While Cummins has plenty of cash to cover interest expenses, Caterpillar has
even more. Caterpillar, an industry leader in this area, increased its times
interest earned ratio from 4.98 in 2002 to 19.04 in 2006. Both firms increased
this ratio at similar annual rates. However, Caterpillar is better positioned to
cover interest expenses with available cash from operations in the event of an
economic downturn. Under current economic conditions, both companies could
increase their dividend per share. However, if future economic conditions
worsen, Cummins would have to reduce its dividend per share before Caterpillar,
adversely affecting its stock price.

- 61 -
Debt Service Margin
-2.00
-1.00
0.00
1.00
2.00
3.00
4.00
5.00
6.00
Cummins
Caterpillar
Cummins 1.40 3.22 1.77 4.94 5.12
Caterpillar 0.60 0.69 -1.13 0.69 1.30
2002 2003 2004 2005 2006
The debt service margin illustrates the firm’s ability to cover current maturities in
debt with cash provided from operations. The ratio is found by dividing the cash
flows from operations by the current installments due in long-term debt.
Cummins has been increasing their ratio by 3.8% from 2005 to 2006, from 4.94
to 5.12. Caterpillar only attained ratios of .69 and 1.3, but has grown the ratio by
87.87% in the same period. While Cummins’ ratio is not growing as quickly as
the industry’s is, they are leading the industry in debt coverage. Caterpillar is
providing only $1.30 in cash flows from operations for every dollar in current
maturities of debt, while Cummins is providing $5.12 from operations for every
dollar in installments due. Clearly management is doing a good job of debt
control and expansion of cash flows from operations. We believe that Cummins
will continue to grow their debt service margin slowly but will be able to sustain
attractive levels of coverage, and lead the industry.

- 62 -
Extended Ratio Analysis
The extended ratio analysis goes beyond the basic 14 ratios used to evaluate a
firm’s performance. We decided to further evaluate Cummins using ratios that
focus on more specific items we deem important to the valuation of the
company, to get a better grasp on management’s performance.
Dividend Payout Ratio
0.00%
20.00%
40.00%
60.00%
80.00%
100.00%
120.00%
Cummins
Caterpillar
Cummins 60.98% 100.00% 15.14% 10.18% 9.23%
Caterpillar 0.18% 0.13% 0.04% 0.03% 0.03%
2002 2003 2004 2005 2006
The dividend payout ratio is found by dividing the amount of dividends paid by
net income. This ratio describes what percentage of net income is being paid to
shareholders. The payout ratio for Cummins has been considerably higher than
the industry average of .04% over the past three years, as compared to an
average of 11.52% in the same period. One reason that Caterpillar’s ratio has
remained basically flat and low since 2004 is that they have a more conservative

- 63 -
dividend policy and choose to retain most of their income in order to finance
further growth. Cummins has a more aggressive dividend policy and chooses to
pay out a higher percent of earnings to its shareholders. One reason for
Cummins’ higher payout rates is its tendency to issue common stock to finance
their asset growth as opposed to raising funds through debt. This falls in line
with management’s strategy of paying down previously owned debt and
maintaining a more reasonable debt to equity ratio. Paying out high yielding
dividends is attractive to investors, which in turn allows C.M.I. to easily raise
equity financing. It should also be noted that Cummins’s ratio has been declining
since 2004, but dividends paid per share of common stock have actually
increased. This is due to the fact that earnings growth is outpacing the declared
dividend growth rate. Therefore the percentage of net income used in paying out
cash dividends is declining.
Net Long-Term Asset Turnover Ratio
0.00
0.50
1.00
1.50
2.00
2.50
3.00
3.50
4.00
4.50
Cummins
Caterpillar
Cummins 2.05 2.10 2.59 3.34 3.82
Caterpillar 1.32 1.28 1.54 1.84 1.68
2002 2003 2004 2005 2006
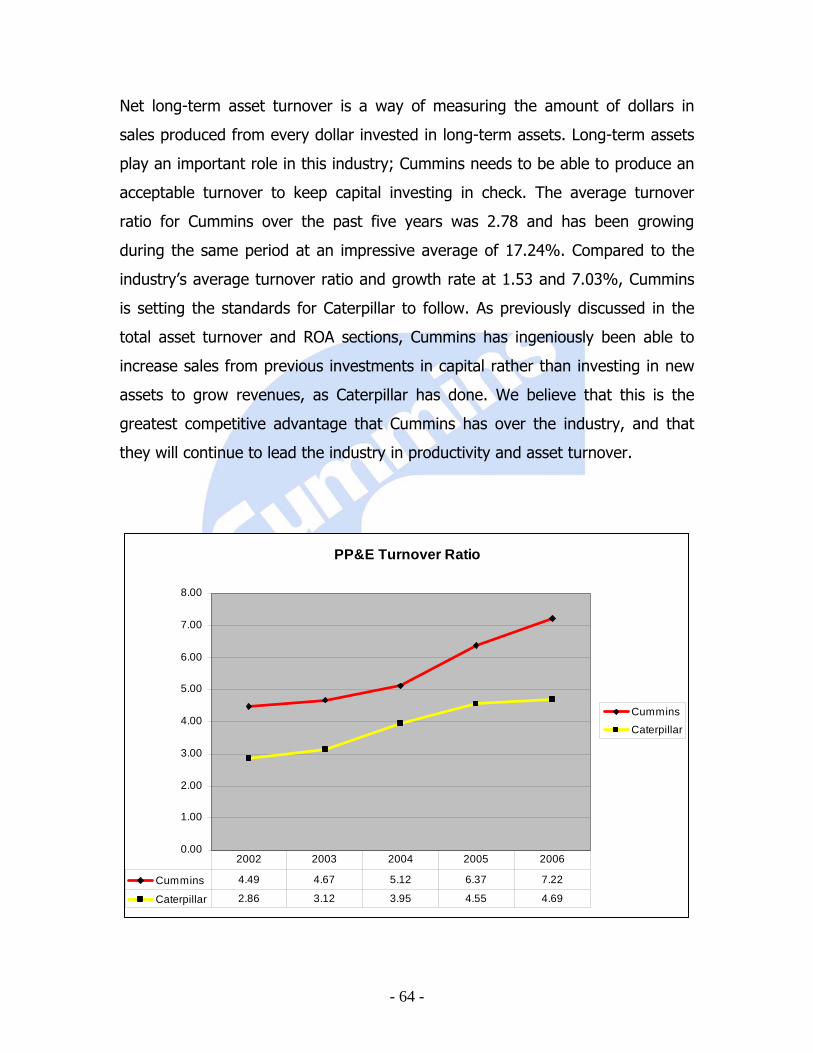
- 64 -
Net long-term asset turnover is a way of measuring the amount of dollars in
sales produced from every dollar invested in long-term assets. Long-term assets
play an important role in this industry; Cummins needs to be able to produce an
acceptable turnover to keep capital investing in check. The average turnover
ratio for Cummins over the past five years was 2.78 and has been growing
during the same period at an impressive average of 17.24%. Compared to the
industry’s average turnover ratio and growth rate at 1.53 and 7.03%, Cummins
is setting the standards for Caterpillar to follow. As previously discussed in the
total asset turnover and ROA sections, Cummins has ingeniously been able to
increase sales from previous investments in capital rather than investing in new
assets to grow revenues, as Caterpillar has done. We believe that this is the
greatest competitive advantage that Cummins has over the industry, and that
they will continue to lead the industry in productivity and asset turnover.
PP&E Turnover Ratio
0.00
1.00
2.00
3.00
4.00
5.00
6.00
7.00
8.00
Cummins
Caterpillar
Cummins 4.49 4.67 5.12 6.37 7.22
Caterpillar 2.86 3.12 3.95 4.55 4.69
2002 2003 2004 2005 2006

- 65 -
The PP&E turnover is a measurement of the dollars in sales produced for every
dollar invested in PP&E. This is simply a narrow look at the turnover that the
company is experiencing from the PP&E portion of the fixed assets. We believe
that this ratio is significant because it is highlighted by management in the 10-K.
C.M.I. plans to focus on expanding PP&E minimally and grow sales from these
specific fixed assets by investing in already existing PP&E. This should allow
Cummins to generate the products needed to supply new demand in newly
entered markets without a drastic increase in fixed costs. Cummins averages a
PP&E turnover ratio of 5.57, outperforming the industry average ratio of 3.83.
However, as was the case in the total asset turnover section, Cummins’ 12.9%
growth rate of the PP&E turnover is slightly lower than Caterpillar’s average
growth of 13.5%. We believe that if Cummins is to continue to expand sales they
will have a tough time growing their PP&E ratio much more than they already
have. Instead of investing in improving PP&E, C.M.I. may have to start investing
in new PP&E. Even though the growth rate of the ratio has slowed, we believe
that the average ratio of 5.57 is impressive and can be maintained and improved
upon by the company at a slower rate of ratio growth.

- 66 -
EBITDA Margin
0.00%
2.00%
4.00%
6.00%
8.00%
10.00%
12.00%
14.00%
16.00%
18.00%
Cummins
Caterpillar
Cummins 5.07% 4.99% 8.40% 11.02% 12.09%
Caterpillar 13.96% 14.35% 14.01% 14.95% 15.70%
2002 2003 2004 2005 2006
The EBITDA margin is a means of measuring profitability after compensating for
taxes, interest, depreciation and amortization. Over the period of 2004 to 2006,
Cummins has averaged a profitability margin of 10.51%, underperforming the
industry average of 15%. The industry has been growing the margin by an
average of 5.86%, while Cummins has been growing their margin at an average
of 20.44% per year since 2004. Cummins is underperforming the industry in
profit margins, but is outpacing the industry in its growth of profitability. While
Cummins is not yet at the desired level of earnings performance, we believe that
management has done a good job turning around and restructuring the
company. In our opinion, C.M.I. should attain or exceed the industry average
because of the rate at which profitability is growing.

- 67 -
SGR & IGR Analysis
IGR & SGR
0.00%
5.00%
10.00%
15.00%
20.00%
25.00%
IGR
SGR
IGR 0.66% 0.00% 4.55% 7.18% 8.69%
SGR 3.43% 0.00% 18.46% 23.65% 21.24%
2002 2003 2004 2005 2006
The sustainable growth rate (SGR) is the maximum rate of growth that a firm
can sustain without borrowing additional equity. The internal growth rate (IGR)
is the highest rate of growth that a firm can attain while keeping earnings and
financial policies the same. These ratios allow us to benchmark and asses
managements strategy for growing the firm. IGR is found by multiplying the ROA
by 1 less the dividend payout ratio, and SGR is found by multiplying the IGR by 1
plus the debt to equity ratio. These are Cummins’ ratios as follows.
SGR will always be either greater than or equal to IGR, and will increase or
decrease at the same rate. In the years 2002 and 2003, before the company
restructured, both ratios showed little ability for the firm to grow using the same
financial practices or without adding additional equity. There was a sharp

- 68 -
increase from 2003 to 2004, that illustrated a change in managements strategy
for growth. By looking back at the company’s previous five years of income
statements, we see that Cummins experienced an increase in net earnings of
600%, from 50 million in 2003, to 350 million in 2004, and continued to grow
earnings through 2006 at a new pace than in the previous periods. We believe
that the years prior to 2004 should be discounted when assessing growth,
because prior to 2004, Cummins was financially a different company than in the
later three years. By examining the ratios we believe that Cummins has potential
for attractive growth in the future by using the same financial policies during
2004 to 2006 and by keeping up the same rate of growth in earnings will reduce
the need to borrow additional equity to finance further growth.
Forecasting
We have evaluated the past trends and ratios of Cummins and the industry in
order to forecast the firm’s financial position and growth through 2016.
Since the fiscal year of 2000, Cummins has been working towards their strategy
to become a low cost provider and a participant in related high growth markets,
mainly in regards to developing countries. Between 2003 and 2004, there are
considerable differences in the five year growth trends concerning net earnings,
sales, and total assets to name some of the more forecast-able statement items.
This ‘blemish’ to the trend, gives us reason to discount the 2003 to 2004 period
as part of a restructuring time frame that will most likely not continue to produce
these abnormal increases on future financial statements. When including this
period of the company’s performance, the average of all five years data
constructs growth in some areas of the balance and income statements that is
not reasonably sustainable. For this reason, we have decided to use the period of

- 69 -
2005 to 2006 to forecast a more rational direction that we believe Cummins is
headed.
Total assets during the 2003 to 2004 period increased by more than 27%,
around 20% more than the growth attained over the 2005, 2006 period of
5.48% and 8.42%, that averages out to 6.95%. This more reasonable rate also
compares well with the asset growth rate of 5.97%, from 2002 to 2003. The
return on assets for the periods 2004, 2005 and 2006, are 5.36%, 8% and
9.58%, compared to returns of 1.4% and .79%, in the 2002, 2003 period. These
ratio results further strengthen our assumption that in the middle of the
observed period, from 2002 to 2006, Cummins changed their company’s
operations and strategies and are now operating at a drastically different level in
2005 and 2006 than in the previous years.
The 2004 statement of earnings also mirrors the changes made in 2003 and
2004. During this time frame earnings grew by 600%, an obviously irrational
number to include in our forecast of future earnings. Net sales jumped as well in
2004, increasing by 34% compared to an average growth rate of around 7% in
years prior to 2004, and then leveled off to an average of 16%, in 2005 and
2006.
We have found some explanations to validate our opinion that the 2003 to 2004
period was a restructuring phase of the company and should not be included in
the forecasting of future growth.
One of the company’s strategies in 2000, was to become a low cost leader in
their industry by implementing the ‘Six Sigma’ program. The sole purpose behind
the program is to make the company as a whole more productive and cost
effective allowing Cummins to earn more money on every dollar brought in by
sales. Six Sigma shows evidence that the strategy is working through an increase

- 70 -
in operating income of 234% and increases to net income of 600% in 2004,
while only stating an increase in net sales of 34% and an operating expense
ratio of 13.46%, and sales growth into 2005, 2006 averaging 16%, with a
declining operating expense ratio of 13.03% and 12.93%. One should also figure
in the high growth seen during this period in the capital industry, but the world
and domestic economic growth alone can not support this abnormal year of
2004. Increases of earnings at this level also can not be explained by mere cost
cutting programs even though Cummins has been effectively cutting operating
costs since 2003.
As previously mentioned, Cummins also planned to expand into related markets.
These related markets do not require drastic changes in the capital structure or
investments and demand existing products so that Cummins could utilize unused
capacity to supply these markets needs. Most of these new markets are located
in developing economies that have been experiencing high growth, such as
China and the Middle East. Through examining managements’ notes in the 2004
10-K report, we believe that the increase of total assets by 27% in 2004, is due
to a partnership that Cummins Captured in China with Dongfeng Auto, Inc. In
February of 2003, Cummins entered into an agreement with Dongfeng Auto and
attained a large market share as well as high growth in the booming Chinese and
Asian economies that explains the jump in sales in 2004 of 34% in sales and
increases in net income. Cummins had to contribute large amounts of capital to
this new partnership in order to supply the new related market. Between 2003
and 2004 this can be seen by examining the new issuance of common stock, for
financing the build up, as well as examining the increase of total assets by $1.4
billion, an increase of 27%. It is our belief that, after this large initial investment
in the Chinese market, management will not continue to grow assets at this
unsustainable rate, and will only continue to grow assets at a more reasonable
rate, as they did in 2005 and 2006 at 5.48% and 8.42%, in order to keep up
with these growing markets in developing economies. One fact that we are using

- 71 -
to support this assumption is that capital expenditures have not deviated by
enough to suggest that the company is still attempting to expand at this rate.
Over the period from 2002 to 2006 capital expenditures have not deviated much
from year to year and average approximately 29%. This steady trend in the
increase of capital spending supports management’s statement that they are
keeping capital expenditures in check by focusing not on acquiring new plants
and machinery to support growth, as Cummins did prior to the year 2000, but
instead improving already existing facilities to support more productivity while
teaming up with partners to help grow at a more sustainable cost to the
company.
Through the extensive restructuring and strategy re-evaluations that the
company experienced in 2003 and 2004, we believe it is best not to incorporate
this time period into our forecasting of the company’s heading. We believe that
Cummins finished the ‘overhauling’ of their business strategy and investment
structure, during the period of 2003, 2004 and has been implementing the new
company structure and operating through the years 2005 and 2006, at a pattern
that is likely to continue. Therefore, we will be deriving most of our opinions and
assumptions from the last two years data instead of all five years.
Statement of Earnings
In trying to forecast the financial information for Cummins, we determined that
the best point of departure was to determine the sales growth. We found the
average growth rate of sales to be about 16.05% for the years 2005-2006. The
Industry average was about 10% growth in sales (MSN Money). We decided
long term sales growth would be about the average of 10%. We do not believe
that Cummins will be able to sustain this high growth rate through 2016,
because sales are starting to catch up to the industry average and it will be
harder to sustain more than the industry rate of 10% as the benchmark becomes

- 72 -
larger and larger. The growth rate declined from 16.05% to 14.56% in 2005 and
2006, and we believe this trend in growth should continue to decline until
reaching the industry average. We continued to decline sales growth this decline
in sales growth each year by 1% until we reached the industry average of 10%.
With our forecast Cummins’ sales will reach approximately 20.02 billion in the
next five years, growing by 54.53% and 32.24 billion at a growth rate of almost
149% in ten years.
Through Cummins’ implementation of Six Sigma, they have been able to
decrease cost of goods sold as a proportion of sales by an average of 2% since
2003 when the program began to show improvements. In 2006 the decrease in
cost of goods sold began to taper off, so we continued that trend by decreasing
cost of goods sold by .05% each year for 5 years before leveling of at 74% of
sales. Caterpillar averaged a cost of goods sold as a percentage of sales of 72%
over the past two years, so our forecast was consistent with the industry
average.
We believe that Cummins has the ability to sustain operating expense at 13.7%
of sales. This was in part due to the fact that the Six Sigma program that they
implemented in 2000 included focusing on not only the manufacturing processes,
but the Selling General and Administrative related activates as well.
With the firms management focusing on productivity and cost control we believe
that earnings will sustain an average of 7.85% of sales through 2016.
With this assumption we forecast sales to more than double to 1.67 billion by
2011, and reach 2.7 billion in ten years, attaining a growth rate of 227%.

- 73 -
CUMMINS INC. AND CONSOLIDATED SUBSIDIARIES
CONSOLIDATED STATEMENTS OF EARNINGS(in millions, except per share earnings)
2002 2003 2004 2005 2006 2007 2008 2009 2010 2011 2012 2013 2014 2015 2016Net sales 5,853 6,296 8,438 9,918 11,362 12953 14637 16393 18196 20016 22017 24219 26641 29305 32236Cost of sales 4,808 5,173 6,758 7,732 8,767 9844 11051 12295 13556 14812 16293 17922 19714 21686 23854
107Gross margin 1,045 1,123 1,680 2,186 2,595 3109 3586 4098 4640 5204 5725 6297 6927 7619 8381
Operating expenses and income
Selling and administrative expenses 736 830 1,015 1,145 1,283 1,424
Research and engineering expenses 201 200 241 278 321 330 Investee equity, royalty and other income (22) (70) (120) (131) (140)
Other operating expenses (income) (9) 5 Total operating expenses and income 906 960 1,136 1,292 1,469 1,775 2,005 2,246 2,493 2,742 3,016 3,318 3,650 4,015 4,416Operating earnings 139 163 544 894 1,126 1,334 1,581 1,852 2,147 2,462 2,708 2,979 3,277 3,605 3,965Interest income (12) (24) (47)Interest expense 61 90 111 109 96 149 168 189 209 230 253 279 306 337 371Other expenses (income) (18) 8 11 (1)Earnings before income taxes and minority interest 78 91 437 798 1,078 1,185 1,412 1,664 1,938 2,232 2,455 2,700 2,970 3,268 3,594
Provision (benefit) for income taxes (20) 27 56 216 324 324 366 410 455 500 550 605 666 733 806Minority interest in earnings of consolidated subsidiaries 16 14 26 32 44 39 44 49 55 60 66 73 80 88 97Net earnings 82 50 350 550 715 822 1,003 1,205 1,428 1,671 1,838 2,022 2,225 2,447 2,692
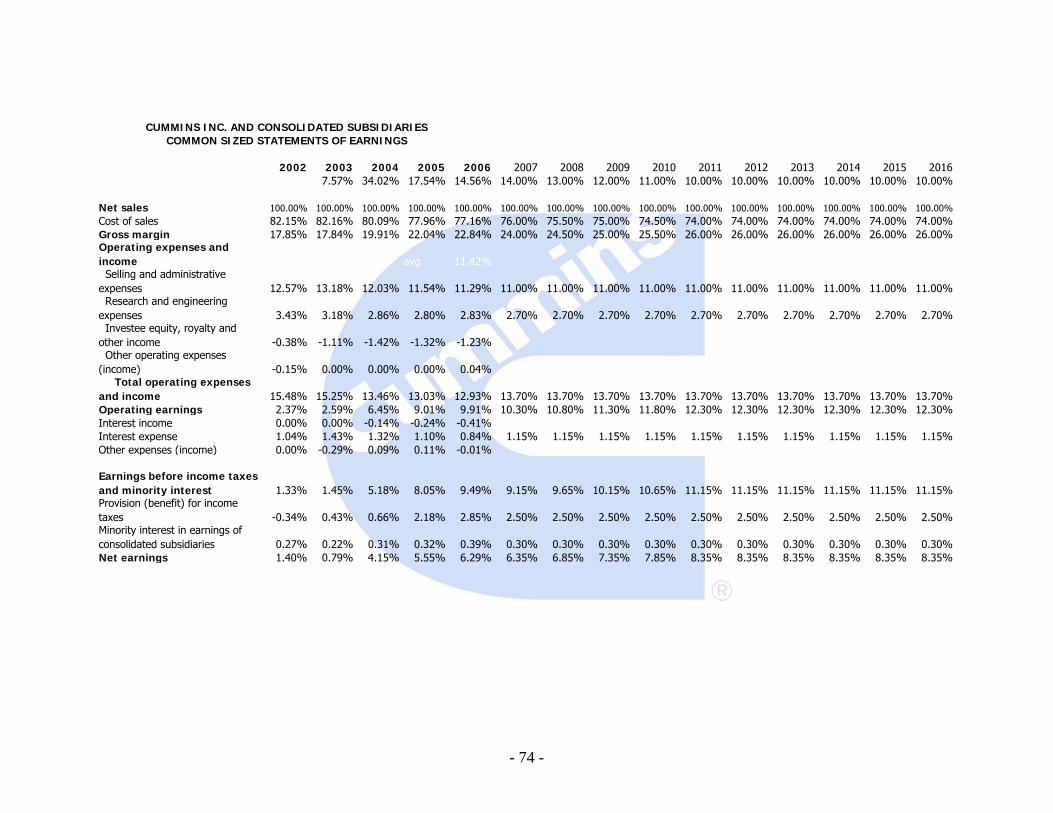
- 74 -
CUMMINS INC. AND CONSOLIDATED SUBSIDIARIESCOMMON SIZED STATEMENTS OF EARNINGS
2002 2003 2004 2005 2006 2007 2008 2009 2010 2011 2012 2013 2014 2015 20167.57% 34.02% 17.54% 14.56% 14.00% 13.00% 12.00% 11.00% 10.00% 10.00% 10.00% 10.00% 10.00% 10.00%
Net sales 100.00% 100.00% 100.00% 100.00% 100.00% 100.00% 100.00% 100.00% 100.00% 100.00% 100.00% 100.00% 100.00% 100.00% 100.00%Cost of sales 82.15% 82.16% 80.09% 77.96% 77.16% 76.00% 75.50% 75.00% 74.50% 74.00% 74.00% 74.00% 74.00% 74.00% 74.00%Gross margin 17.85% 17.84% 19.91% 22.04% 22.84% 24.00% 24.50% 25.00% 25.50% 26.00% 26.00% 26.00% 26.00% 26.00% 26.00%Operating expenses and income avg 11.42% Selling and administrative expenses 12.57% 13.18% 12.03% 11.54% 11.29% 11.00% 11.00% 11.00% 11.00% 11.00% 11.00% 11.00% 11.00% 11.00% 11.00% Research and engineering expenses 3.43% 3.18% 2.86% 2.80% 2.83% 2.70% 2.70% 2.70% 2.70% 2.70% 2.70% 2.70% 2.70% 2.70% 2.70% Investee equity, royalty and other income -0.38% -1.11% -1.42% -1.32% -1.23% Other operating expenses (income) -0.15% 0.00% 0.00% 0.00% 0.04% Total operating expenses and income 15.48% 15.25% 13.46% 13.03% 12.93% 13.70% 13.70% 13.70% 13.70% 13.70% 13.70% 13.70% 13.70% 13.70% 13.70%Operating earnings 2.37% 2.59% 6.45% 9.01% 9.91% 10.30% 10.80% 11.30% 11.80% 12.30% 12.30% 12.30% 12.30% 12.30% 12.30%Interest income 0.00% 0.00% -0.14% -0.24% -0.41%Interest expense 1.04% 1.43% 1.32% 1.10% 0.84% 1.15% 1.15% 1.15% 1.15% 1.15% 1.15% 1.15% 1.15% 1.15% 1.15%Other expenses (income) 0.00% -0.29% 0.09% 0.11% -0.01%
Earnings before income taxes and minority interest 1.33% 1.45% 5.18% 8.05% 9.49% 9.15% 9.65% 10.15% 10.65% 11.15% 11.15% 11.15% 11.15% 11.15% 11.15%Provision (benefit) for income taxes -0.34% 0.43% 0.66% 2.18% 2.85% 2.50% 2.50% 2.50% 2.50% 2.50% 2.50% 2.50% 2.50% 2.50% 2.50%Minority interest in earnings of consolidated subsidiaries 0.27% 0.22% 0.31% 0.32% 0.39% 0.30% 0.30% 0.30% 0.30% 0.30% 0.30% 0.30% 0.30% 0.30% 0.30%Net earnings 1.40% 0.79% 4.15% 5.55% 6.29% 6.35% 6.85% 7.35% 7.85% 8.35% 8.35% 8.35% 8.35% 8.35% 8.35%
- 75 -
Balance Sheet
By forecasting the balance sheet we can understand and predict how the firm is
going to structure its self through debt, equity and assets to produce the
forecasted sales and earnings. We decided that the most accurate way to
forecast assets was through the use of the total asset turnover ratio. As
discussed previously, management has been and is implementing programs
concerning asset productivity, as shown through our evaluation of the asset
turnover ratio. Cummins was not increasing Assets in order to increase sales
after their restructuring period ended in 2003, but instead produced more sales
from previous investments through Six Sigma programs. We think that Cummins
will be able to further improve their asset turnover ratio through 2016, by 5.68%
per year. After assuming this growth in productivity we believe assets will grow
to 9.97 billion in five years at a growth rate of 23.89%, and will grow assets in
ten years by 51.37% to 12.19 billion. To find Current Assets, as well as current
liabilities, we determined that after taking an average of the past two years as a
percentage of total assets that Cummins would sustain the current relationship
between Current Assets/liabilities and Total Assets. We forecasted total liabilities
to continue to decrease as the firm has already shown in the previous five years.
We think that this is possible because management is using less debt every year
and more cash to finance company growth. We forecast Cummins to decrease
total liabilities by .5% per year, through the ten year period, reducing the debt to
equity ratio by 16.4% in five years and 26.8% in ten years. We predicted
shareholders’ equity through our assumption that the firm will continue with
management’s strategy to finance growth through retained earnings, by taking
the difference in total liabilities and total assets. Growth in shareholders’ equity
will bring the firm to approximately 4.72 and 6.18 billion, in five and ten years.
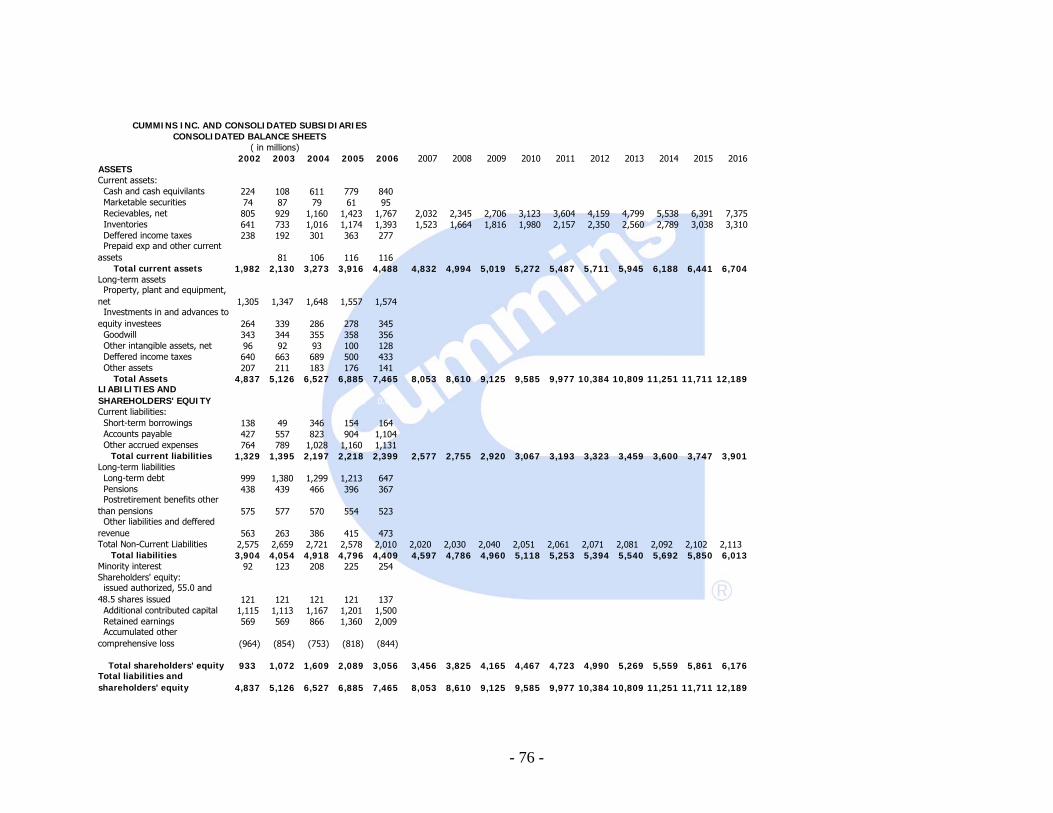
- 76 -
CUMMINS INC. AND CONSOLIDATED SUBSIDIARIESCONSOLIDATED BALANCE SHEETS
2002 2003 2004 2005 2006 2007 2008 2009 2010 2011 2012 2013 2014 2015 2016ASSETSCurrent assets: Cash and cash equivilants 224 108 611 779 840 Marketable securities 74 87 79 61 95 Recievables, net 805 929 1,160 1,423 1,767 2,032 2,345 2,706 3,123 3,604 4,159 4,799 5,538 6,391 7,375 Inventories 641 733 1,016 1,174 1,393 1,523 1,664 1,816 1,980 2,157 2,350 2,560 2,789 3,038 3,310 Deffered income taxes 238 192 301 363 277 Prepaid exp and other current assets 81 106 116 116 Total current assets 1,982 2,130 3,273 3,916 4,488 4,832 4,994 5,019 5,272 5,487 5,711 5,945 6,188 6,441 6,704Long-term assets Property, plant and equipment, net 1,305 1,347 1,648 1,557 1,574 Investments in and advances to equity investees 264 339 286 278 345 Goodwill 343 344 355 358 356 Other intangible assets, net 96 92 93 100 128 Deffered income taxes 640 663 689 500 433 Other assets 207 211 183 176 141 Total Assets 4,837 5,126 6,527 6,885 7,465 8,053 8,610 9,125 9,585 9,977 10,384 10,809 11,251 11,711 12,189LIABILITIES AND SHAREHOLDERS' EQUITY 6.95% 0.08Current liabilities: Short-term borrowings 138 49 346 154 164 Accounts payable 427 557 823 904 1,104 Other accrued expenses 764 789 1,028 1,160 1,131 Total current liabilities 1,329 1,395 2,197 2,218 2,399 2,577 2,755 2,920 3,067 3,193 3,323 3,459 3,600 3,747 3,901Long-term liabilities Long-term debt 999 1,380 1,299 1,213 647 Pensions 438 439 466 396 367 Postretirement benefits other than pensions 575 577 570 554 523 Other liabilities and deffered revenue 563 263 386 415 473Total Non-Current Liabilities 2,575 2,659 2,721 2,578 2,010 2,020 2,030 2,040 2,051 2,061 2,071 2,081 2,092 2,102 2,113 Total liabilities 3,904 4,054 4,918 4,796 4,409 4,597 4,786 4,960 5,118 5,253 5,394 5,540 5,692 5,850 6,013Minority interest 92 123 208 225 254Shareholders' equity: issued authorized, 55.0 and 48.5 shares issued 121 121 121 121 137 Additional contributed capital 1,115 1,113 1,167 1,201 1,500 Retained earnings 569 569 866 1,360 2,009 Accumulated other comprehensive loss (964) (854) (753) (818) (844)
Total shareholders' equity 933 1,072 1,609 2,089 3,056 3,456 3,825 4,165 4,467 4,723 4,990 5,269 5,559 5,861 6,176Total liabilities and shareholders' equity 4,837 5,126 6,527 6,885 7,465 8,053 8,610 9,125 9,585 9,977 10,384 10,809 11,251 11,711 12,189
( in millions)

- 77 -
CUMMINS INC. AND CONSOLIDATED SUBSIDIARIES
COMMON SIZED BALANCE SHEET2002 2003 2004 2005 2006 2007 2008 2009 2010 2011 2012 2013 2014 2015 2016
ASSETSCurrent assets: Cash and cash equivilants 4.63% 2.11% 9.36% 11.31% 11.25% Marketable securities 1.53% 1.70% 1.21% 0.89% 1.27% Recievables, net 16.64% 18.12% 17.77% 20.67% 23.67% 25.23% 27.23% 29.65% 32.58% 36.12% 40.05% 44.40% 49.23% 54.58% 60.51% Inventories 13.25% 14.30% 15.57% 17.05% 18.66% 18.91% 19.32% 19.90% 20.66% 21.62% 22.63% 23.68% 24.79% 25.94% 27.15% Deffered income taxes 4.92% 3.75% 4.61% 5.27% 3.71%
Prepaid expenses and other current assets 0.00% 1.58% 1.62% 1.68% 1.55% Total current assets 40.98% 41.55% 50.15% 56.88% 60.12% 60.00% 58.00% 55.00% 55.00% 55.00% 55.00% 55.00% 55.00% 55.00% 55.00%Long-term assets Property, plant and equipment, net 26.98% 26.28% 25.25% 22.61% 21.09% Investments in and advances to equity investees 5.46% 6.61% 4.38% 4.04% 4.62% Goodwill 7.09% 6.71% 5.44% 5.20% 4.77% Other intangible assets, net 1.98% 1.79% 1.42% 1.45% 1.71% Deffered income taxes 13.23% 12.93% 10.56% 7.26% 5.80% Other assets 4.28% 4.12% 2.80% 2.56% 1.89% Total Assets 100.00% 100.00% 100.00% 100.00% 100.00% 100.00% 100.00% 100.00% 100.00% 100.00% 100.00% 100.00% 100.00% 100.00% 100.00%LIABILITIES AND EQUITYCurrent liabilities: Short-term borrowings 2.85% 0.96% 5.30% 2.24% 2.20% Accounts payable 8.83% 10.87% 12.61% 13.13% 14.79% Other accrued expenses 15.79% 15.39% 15.75% 16.85% 15.15% Total current liabilities 27.48% 27.21% 33.66% 32.21% 32.14% 32.00% 32.00% 32.00% 32.00% 32.00% 32.00% 32.00% 32.00% 32.00% 32.00%Long-term liabilities Long-term debt 20.65% 26.92% 19.90% 17.62% 8.67% Pensions 9.06% 8.56% 7.14% 5.75% 4.92%
Postretirement benefits other than pensions 11.89% 11.26% 8.73% 8.05% 7.01% Other liabilities and deffered revenue 11.64% 5.13% 5.91% 6.03% 6.34% Total liabilities 80.71% 79.09% 75.35% 69.66% 59.06% 57.09% 55.58% 54.36% 53.39% 52.66% 51.94% 51.26% 50.59% 49.95% 49.33%Minority interest 1.90% 2.40% 3.19% 3.27% 3.40%Shareholders' equity: issued authorized, 55.0 and 48.5 shares issued 2.50% 2.36% 1.85% 1.76% 1.84% Additional contributed capital 23.05% 21.71% 17.88% 17.44% 20.09% Retained earnings 11.76% 11.10% 13.27% 19.75% 26.91% Accumulated other comprehensive loss -19.93% -16.66% -11.54% -11.88% -11.31% Total shareholders' equity 19.29% 20.91% 24.65% 30.34% 40.94% 42.91% 44.42% 45.64% 46.61% 47.34% 48.06% 48.74% 49.41% 50.05% 50.67%
Total liabilities and shareholders' equity 100.00% 100.00% 100.00% 100.00% 100.00% 100.00% 100.00% 100.00% 100.00% 100.00% 100.00% 100.00% 100.00% 100.00% 100.00%

- 78 -
Cash Flows Statement
In order to forecast the Statement of Cash Flows, we took the average growth
rate from 2005 to 2006, which came out to 17%, and increased the annual
growth rate until we reached 17% and then continued to grow at that level. One
reason we took an average instead tying the growth to sales or income, is that
we think that management will be able to improve on cash from operating
activities to outpace growth in sales. We were able to forecast a limited number
of items on the Statement of Cash Flows. The Pension Expense was forecasted
by taking an average of the growth rate for the previous two years, which was
16.12%. Due to the growth rate leveling of in years 2005-2006, we kept this
growth rate constant. Depreciation was forecasted by increasing the growth rate
by .5% due to limited growth in assets. Cash flows from investing activities was
forecasted by taking the average of the past two years and extending it at 17%,
plus an additional 4% per year to compensate for maintenance on already
existing PP&E.
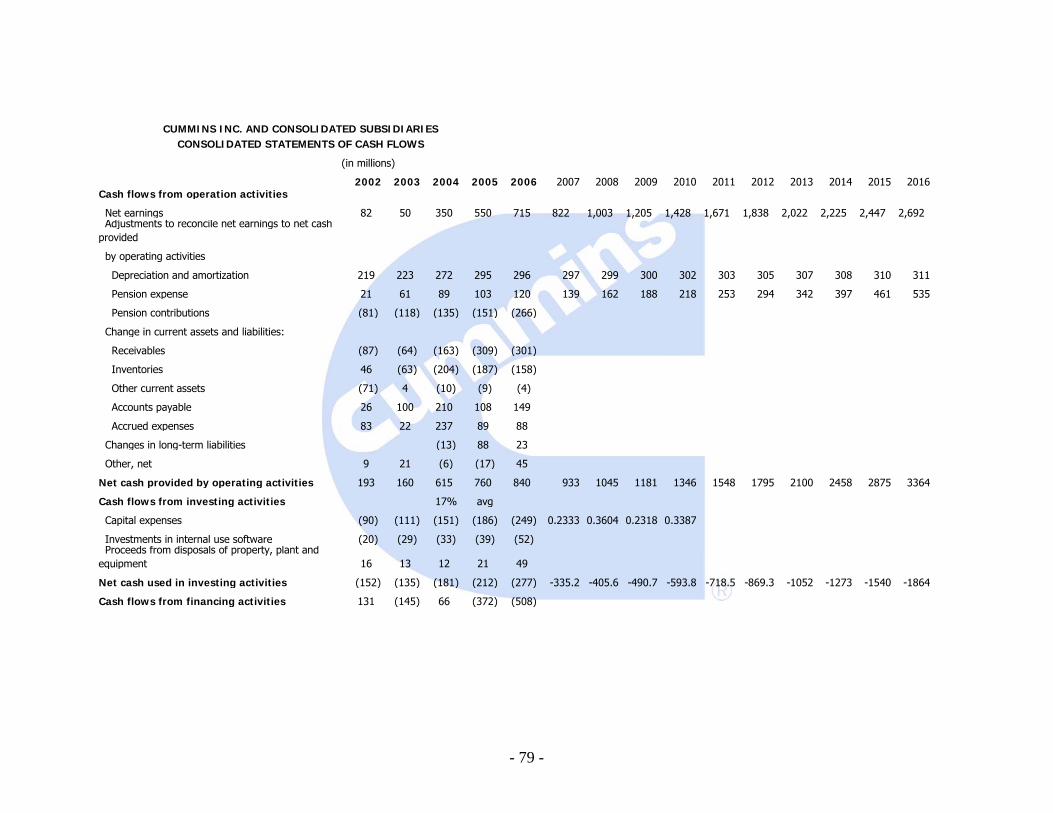
- 79 -
(in millions)
2002 2003 2004 2005 2006 2007 2008 2009 2010 2011 2012 2013 2014 2015 2016Cash flows from operation activities
Net earnings 82 50 350 550 715 822 1,003 1,205 1,428 1,671 1,838 2,022 2,225 2,447 2,692 Adjustments to reconcile net earnings to net cash provided
by operating activities
Depreciation and amortization 219 223 272 295 296 297 299 300 302 303 305 307 308 310 311
Pension expense 21 61 89 103 120 139 162 188 218 253 294 342 397 461 535
Pension contributions (81) (118) (135) (151) (266)
Change in current assets and liabilities:
Receivables (87) (64) (163) (309) (301)
Inventories 46 (63) (204) (187) (158)
Other current assets (71) 4 (10) (9) (4)
Accounts payable 26 100 210 108 149
Accrued expenses 83 22 237 89 88
Changes in long-term liabilities (13) 88 23
Other, net 9 21 (6) (17) 45
Net cash provided by operating activities 193 160 615 760 840 933 1045 1181 1346 1548 1795 2100 2458 2875 3364
Cash flows from investing activities 17% avg
Capital expenses (90) (111) (151) (186) (249) 0.2333 0.3604 0.2318 0.3387
Investments in internal use software (20) (29) (33) (39) (52) Proceeds from disposals of property, plant and equipment 16 13 12 21 49
Net cash used in investing activities (152) (135) (181) (212) (277) -335.2 -405.6 -490.7 -593.8 -718.5 -869.3 -1052 -1273 -1540 -1864
Cash flows from financing activities 131 (145) 66 (372) (508)
CUMMINS INC. AND CONSOLIDATED SUBSIDIARIESCONSOLIDATED STATEMENTS OF CASH FLOWS

- 80 -
2002 2003 2004 2005 2006 2007 2008 2009 2010 2011 2012 2013 2014 2015 2016Cash flows from operation Net earnings 100.0% 100.0% 100.0% 100.0% 100.0% 100.0% 100.0% 100.0% 100.0% 100.0% 100.0% 100.0% 100.0% 100.0% 100.0% Adjustments to reconcile net earnings to net cash provided by Depreciation and amortization 267.1% 446.0% 77.7% 53.6% 41.4% 36.2% 29.8% 24.9% 21.1% 18.2% 16.6% 15.2% 13.8% 12.7% 11.6% Pension expense 25.6% 122.0% 25.4% 18.7% 16.8% 17.0% 16.1% 15.6% 15.3% 15.2% 16.0% 16.9% 17.8% 18.8% 19.9% Pension contributions -98.8% -236.0% -38.6% -27.5% -37.2% Change in current assets and Receivables -106.1% -128.0% -46.6% -56.2% -42.1% Inventories 56.1% -126.0% -58.3% -34.0% -22.1% Other current assets -86.6% 8.0% -2.9% -1.6% -0.6% Accounts payable 31.7% 200.0% 60.0% 19.6% 20.8% Accrued expenses 101.2% 44.0% 67.7% 16.2% 12.3% Changes in long-term liabilities 0.0% 0.0% -3.7% 16.0% 3.2% Other, net 11.0% 42.0% -1.7% -3.1% 6.3%Net cash provided by operating activities 235.4% 319.8% 175.6% 138.2% 117.5% 113.5% 104.2% 98.0% 94.2% 92.6% 97.7% 103.9% 110.5% 117.5% 125.0%Cash flows from investing activitiesNet cash used in investing activities -185.4% -270.0% -51.7% -38.5% -38.7% -40.8% -40.4% -40.7% -41.6% -43.0% -47.3% -52.0% -57.2% -62.9% -69.2%Cash flows from financing activitiesNet cash (used in) provided by financing activities
CUMMINS INC. AND CONSOLIDATED SUBSIDIARIESCOMMON SIZED STATEMENTS OF CASH FLOWS

- 81 -
Valuation Analysis
There are a variety of ways to value a company’s stock price to determine if the
stock’s market price is valued fairly, undervalued, or overpriced. The valuation
models employed below are deemed particularly insightful if deviations are 15%
or more between the intrinsic value we derive and the market price of the stock.
These valuation models, combined with subjective topics addressed in prior
sections, provide a comprehensive base for determining a company’s accurate
valuation. The Method of Comparables is used to gauge a company’s
performance and profitability relative to the industry it competes in. This method
is primarily employed for initial valuations. More valuation models are necessary
to gain a well-rounded understanding of the company’s stock price due to the
difference in results from each valuation model.
The other valuation models we use to most accurately determine Cummins
intrinsic value is the weighted average cost of capital, weighted average cost of
debt, and weighted average cost of equity. These are inputs are discounted
using present, historical, and estimated data. The discounted dividend model,
residual income, abnormal earnings growth, long-run residual income perpetuity,
and free cash flow model utilizes the cost of equity and debt. Aggregating the
results of these numerous valuation models provides us with a deep
understanding of the state of the company and enhances the accuracy of
Cummins share price. All of these models are based off theory and deviations in
each model’s accuracy are overcome by comprehensively analyzing the data.
More consideration is given to models that best represent the company’s method
of operations, and coupled with the rest of the valuation models, should
reasonably indicate the intrinsic value of Cummins.

- 82 -
Method of Comparables Cummins Inc. Share
Price
Forward P/E 183.04
Trailing P/E 200.81
P/B 397.59
Price/Sales 241.28
PEG N/A
Price to EBITDA 17.07
Forward Price to Earnings (2007)
Forward P/E
PPS EPS P/E Industry average
CMI share price
CMI 145.21 14.2 10.23 183.04 CAT 67.03 5.2 12.89 12.89
To find the forward price to earnings, we found the industry average P/E and
then multiplied by the earnings per share to get the share price of Cummins. The
forward P/E of Cummins comes out to be 183.04, leading us to believe that the
firm’s stock is undervalued when compared to the observed price of 145.21. It is
difficult for us to put much trust in this model since the industry consists of only
Caterpillar and does not give us sufficient evidence of the firm’s actual value, but
rather is based upon what the market is willing to pay for the earnings per share
of the company. However, based upon this valuation Cummins is in good
position in its industry for the upcoming future.
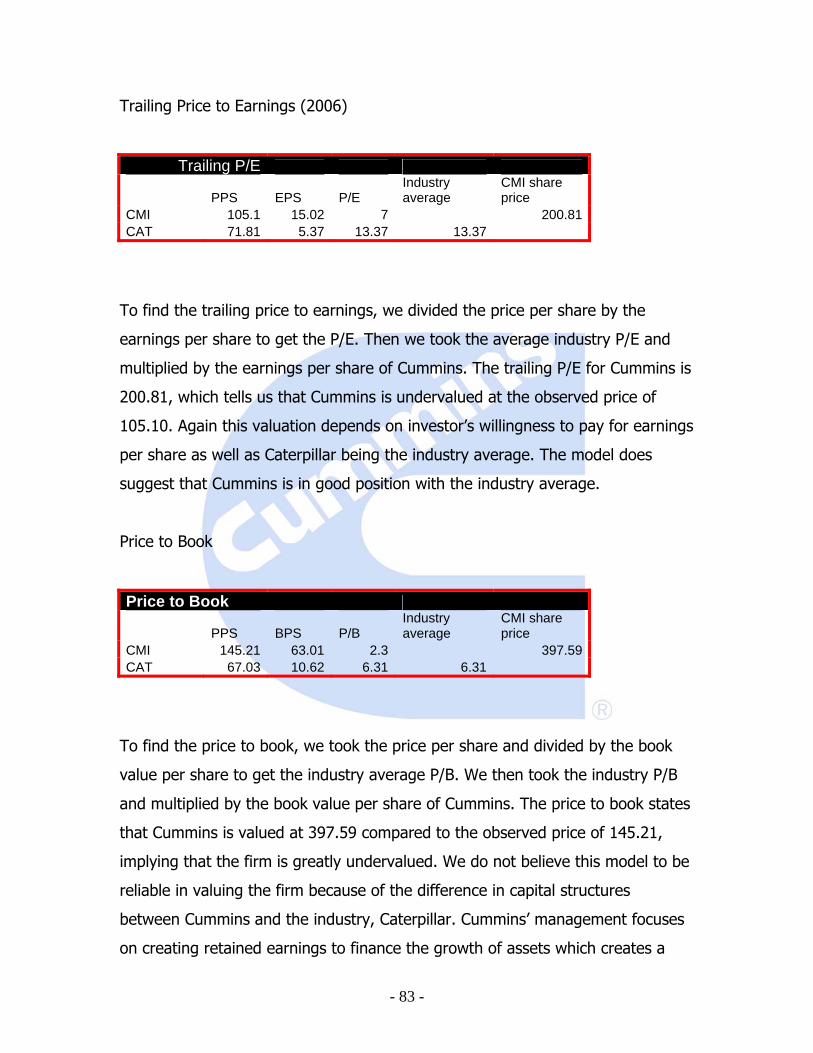
- 83 -
Trailing Price to Earnings (2006)
Trailing P/E
PPS EPS P/E Industry average
CMI share price
CMI 105.1 15.02 7 200.81 CAT 71.81 5.37 13.37 13.37
To find the trailing price to earnings, we divided the price per share by the
earnings per share to get the P/E. Then we took the average industry P/E and
multiplied by the earnings per share of Cummins. The trailing P/E for Cummins is
200.81, which tells us that Cummins is undervalued at the observed price of
105.10. Again this valuation depends on investor’s willingness to pay for earnings
per share as well as Caterpillar being the industry average. The model does
suggest that Cummins is in good position with the industry average.
Price to Book
Price to Book
PPS BPS P/B Industry average
CMI share price
CMI 145.21 63.01 2.3 397.59 CAT 67.03 10.62 6.31 6.31
To find the price to book, we took the price per share and divided by the book
value per share to get the industry average P/B. We then took the industry P/B
and multiplied by the book value per share of Cummins. The price to book states
that Cummins is valued at 397.59 compared to the observed price of 145.21,
implying that the firm is greatly undervalued. We do not believe this model to be
reliable in valuing the firm because of the difference in capital structures
between Cummins and the industry, Caterpillar. Cummins’ management focuses
on creating retained earnings to finance the growth of assets which creates a

- 84 -
higher book value, where Caterpillar’s management relies on financing with debt
which lowers book value. These two firms are complete opposites when looking
at the shareholders’ equity portion of the balance sheet. For this reason this
valuation model is like comparing apples to oranges, and we will be discounting
these outcomes.
Price to Sales
Price to Sales
PPS SPS P/S Industry average
CMI share price
CMI 145.21 234.26 0.62 241.28 CAT 67.03 64.87 1.03 1.03
To find the price to sales, we found the sales of the firm and divided by the
number of shares outstanding to get the Sales per share. Then we divided the
price per share by the sales per share to find the industry average P/S. Cummins’
share price computes to 241.28 as opposed to the observed price of 145.21,
again implying that the firm is undervalued. We will also be discounting this
model because Caterpillar has many more shares outstanding than Cummins. If
Caterpillar’s sales were divided by the number of shares Cummins has in
circulation then the sales per share of Caterpillar would be 853.60, and Cummins
would be underperforming the industry substantially.

- 85 -
Price Earnings Growth
Due to a negative earnings growth rates from both Caterpillar and Cummins,
PEG could not be calculated.
Price to EBITDA
Price to EBITDA
Calculated Multiples CMI share price
0.1053 0.0124 17.07 Formula data CMI CAT
PPS 145.21
67.03
EBITDA 1,379
5,414
The price to EBITDA valuation takes into account non-cash items. We found the
price to EBITDA by dividing the price per share by the EBITDA, which gave us a
multiple of the industry average. Then we multiplied the industry average by the
EBITDA for Cummins and got a share price of 17.07 that implies that Cummins is
severely overvalued at an observed price of 145.21. We believe that this model
does not evaluate Cummins well because of the heavily asset accumulation that
Cummins has.

- 86 -
Cost of Capital
In order to value a company, an appropriate cost of capital must be determined.
The cost of capital consists of three elements: the Weighted Average Cost of
Capital (WACC), the Cost of Debt, and the Cost of Equity.
Cost of Debt
To find the cost of debt, we examined all of the liabilities that are disclosed in
the notes of the annual 10-K report. We then took the weighted average of the
different obligations and their corresponding interest rates as a percentage of
total liabilities. By adding all of the rates together we calculated a 7.13% total
cost of debt.
Cost of Equity
In order to determine the Cost of Equity, we used the capital asset pricing model
(CAPM), where the Cost of Equity is the sum of the Risk Free Rate (Rf) plus the
Systematic Risk (β) multiplied by the Market Risk Premium (which is the Risk
Free Rate (Rf) subtracted from the Expected Return on the Market Index (E(rm).
Ke = Rf + β[E(rm)-Rf]
Cummins Inc. Cost of Equity
11.89% = 4.5% + 1.48 * 5%
To determine the Risk Free Rate, we used monthly percentage data from the 3
month T-Bill. This was used due to the high correlation between Cummins Inc.
monthly returns and the returns from the S&P 500. Beta was calculated by
running a regression between Cummins Inc. monthly returns and the monthly
returns from the S&P 500. The adjusted R square was 32.47% which is
comparatively a high percentage. A Market Risk Premium was determined by

- 87 -
taking the average of a historical percentage of 7% and current market studies
that show a lower Market Risk Premium of 3%. There is evidence that shows
that there has been a substantial decline in the Expected Market Risk Premium,
that the historical rate is not valid in the current market.
Weighted Average Cost of Capital (WACC)
The WACC is calculated by weighting the costs of debt and equity capital
according to their respective market values. Several variables are including the
WACC: the market value of debt (Vd), the market value of equity (Ve), the cost
of debt capital (Rd), the cost of equity capital (Ke), and the appropriate tax rate
(T). The WACC is then calculated by:
% Vd VeWACC= [Rd(1-T)] + (Ke)
Vd+Ve Vd+Ve
We used the book value of debt of 4409 (total liabilities), a market value of
equity of 7032 (the market value of shares multiplied by the number of
outstanding shares), and the appropriate tax rate of 35% (all numbers in
millions). The value of debt was taken from the most recent 10-k and the value
of equity we determined by analyzing current market conditions.
Cummins Inc. WACC
% 4409 70329.37%= [7.13%(1-35%)] + 11.89%
11441 11441

- 88 -
Credit Analysis 2002 2003 2004 2005 2006Altman Z-Scores 1.592 1.631 1.983 2.492 2.884
The Altman Z- score is a weighted ratio based formula that incorporates several
financial statement items, to assess the credit risk of a firm. We can plug
historical data into the formula to see how the company is leveraged, and the
company’s ability to pay debt installments on principal as well as the interest on
their obligations. A Z-score greater than 2.7 implies that the firm has a low level
of risk to default on their debt, and a score of less than 1.8 signals that the firm
is at a higher risk of defaulting. A firm’s credit risk plays an important role in their
ability to raise capital through debt. If a company with little risk of default
(investment grade) wishes to raise capital through debt, their debt will trade at
par (the face value of the debt) or at a premium to par. This means that they
most likely will not have trouble reaching their goal amount. Conversely, if a high
credit risk (junk status) firm wishes to raise the same amount of debt as the
previous firm, their debt will trade at a discount to par. This means that they will
have to issue more debt than the investment grade firm to raise the same
amount of capital, making it more difficult to attain the financing needed. By
examining Cummins’ Z-scores from the past five years we can see that the firm
has been consistently decreasing their credit risk, from 1.592 in 2002, to 2.884 in
2006. We attribute this building of credit worthiness to management’s focus in
turning the capital structure of the company around in 2004. Cummins has
focused on financing growth through cash generated from operations while using
what is left over to pay down debt. Evidence can be found by looking at the past
financial statements that shows a dramatic decrease in debt to equity. The firm
crossed over into investment grade status in 2006 that will give them the ability
to issue debt to banks and pension funds increasing their ability to raise capital
with more ease. Management must keep and improve their investment status, or

- 89 -
they will not be able to issue debt to banks and pension funds that are restricted
from any investments lower than investment grade. Since those entities are
responsible for investing in the majority of debt issuances, the credit risk
associated with Cummins could be vital to the company’s profitability and growth
in the future.
Discounted Dividends Model
Observed Price 144.99g
0 0.02 0.04 0.06 Undervalued0.09 35.10 45.12 63.17 105.29 Overvalued
0.119 24.75 29.75 37.30 49.960.129 22.33 26.43 32.37 41.750.139 20.32 23.74 28.53 35.760.149 18.62 21.51 25.45 31.17
Sensitivity Analysis
The discounted dividend model is a “traditional” finance model that calculates
the firm’s equity by taking the present value of forecasted dividends. For the
model we forecasted 10 years out with a terminal value (perpetuity) in year 11.
The model requires the use of forecasted future dividends and the estimated
cost of equity for the firm. We took the present value of the dividends for year
1-10 $9.61, the present value of the terminal value (with zero growth) $6.06 for
a value of equity of $24.69. We then took the estimated value at April 1, 2007
of $24.75. The Sensitivity Analysis was run by taking different costs of equity
and growth rates for the terminal value. The higher growth rates caused the
equity to spike, but still showed that Cummins Inc. stock price is overvalued.
The discounted dividends model is not applicable due to Cummins Inc. low
dividend payout ratio which has been decreasing from 15% down to about 9%.

- 90 -
Free Cash Flow Model
g Observed Price
0 0.01 0.02 0.04
WACC 0.0937 $85.95 $96.84 $110.68 153.84 Undervalued
0.104 $65.36 $73.31 $83.16 112.09 Overvalued
0.114 $49.11 $55.11 $62.38 82.81
0.124 $35.64 $40.24 $45.72 $60.60
0.134 $24.31 $27.89 $32.10 $43.20
Sensitivity Analysis
$144.99
The Free Cash Flow Model is another “traditional” finance models. It uses
the forecasted free cash flows to the firm and discounts them back using the
weighted average cost of capitol (WACC). Free cash flows to the firm is
estimated by taking the cash from operations and adding the cash from investing
activities. The total present value of the free cash flows was $4158 and the
present value of the terminal cash flows was $4409 assuming no growth. The
value of the firm’s equity was $85.95. The Sensitivity Analysis allowed us to look
at what a different WACC and growth rates would do to the value of the firm’s
equity. In all variations of WACC and the growth rate, the firm is overvalued
except when the growth rate of 4% was used.
Residual Income (RI)

- 91 -
Sensitivity Analysisg Observed Price 144.99
0 -0.1 -0.2 -0.5Ke 0.09 186.48 156.45 147.13 138.13 Undervalued
0.119 123.33 114.92 111.79 108.46 Overvalued0.129 105.34 101.42 99.88 98.200.139 88.89 88.46 88.29 88.100.149 73.50 75.87 76.88 78.04
The Residual Income Model is found by finding the forecasted residual income of
the firm, and discounting it back using the estimated cost of equity. The current
book value of equity is added to the residual income for years 1-10, and then
added to the terminal value residual income. The book value of equity for the
end of 2006 (beginning of 2007) was $76.31, the residual income for years 1-10
was $28.34, and the terminal value (zero growth) was $18.36. This put the
firm’s value at $123.02. We then found the value at April 1, 2007 to be $123.33.
The Sensitivity Analysis was used to determine the effects of various
combinations of the cost of equity and growth rates. A negative growth rate was
used because in the long run, a positive terminal residual income cannot be
sustained. In all variations, the firm is overvalued unless a cost of equity of 9%
is used with a growth rate of less then -20%.

- 92 -
Abnormal Earnings Growth
g Observed Price 0 0.02 0.03 0.05
Ke 0.09 $202.71 $206.48 $210.23 221.49 Undervalued0.1189 $113.34 $112.88 $112.57 111.68 Overvalued0.1289 $95.99 $95.34 $94.91 93.730.1389 $82.34 $81.66 $81.23 $80.070.1489 $71.37 $70.74 $70.35 $69.32
Sensitivity Analysis$144.99
The Abnormal Earnings Growth Model is used to value the firm’s equity by
discounting the firm’s increase in earnings each year. The earnings are then
invested in a Dividend Reinvestment Program (DRIP) at the estimated cost of
equity. The present value of the DRIP is added to the earnings per share, which
is the cumulative dividend earnings. Normal earnings are calculated by taking
last years earnings and multiplying by the estimated cost of equity. The
difference between the normal earnings and the cumulative dividend earnings is
the abnormal earnings growth. The abnormal earnings are then discounted back
to year one using the estimated cost of equity. To determine the intrinsic value
per share, the core earnings per share (2007) is added to the present value of
the abnormal earnings growth and the present value of the terminal year (year
11). The terminal value with the estimated cost of equity was negative, so we
chose a positive growth rate in our sensitivity analysis. In all of the various
combinations, the firm is overvalued. When we used a cost of equity that was
less than our estimated cost of equity, we were able to get a value that was
closer to the firm’s value. (If the cost of equity were in fact closer to 9%, a
negative growth rate would have been used which would have shown an intrinsic
value that was closer to the observed price)

- 93 -
Analyst Recommendation
Through a careful analysis of the five competitive forces, the industry that
Cummins Inc. operates, the competition that it faces as well as the immediate
threat of substitute products, we are able to see how Cummins Inc. has
remained the cost leader in the industry. Cummins Inc. is closely following these
key success factors that have helped them to produce a low cost, affordable
product while maintaining industry leading quality. Through overhaul in
management in 2003, Cummins has been able to go from a stagnant growth rate
in earnings to a high growth firm returning more earnings to the company to
finance investments, and not issuing debt while attempting to expand. This is
fundamental to the financial stability of the firm in the future, because the
extreme growth rates recorded over the past three years, after the
reconstruction period, most likely can not be sustained, putting the firm in better
position to handle slower sales growth as well as any economic downturns that
may arise. Through intrinsic valuation, we believe that Cummins Inc. is currently
overvalued. The main reason that we believe the market is overvaluing Cummins
Inc. is because of the abnormal growth rates attained in the 2004 to 2006
period, after management overhauled and implemented their new financial
strategies. These attractive growth rates may continue in the short-run, but we
believe, through the valuation models we have applied, that these high growth
rates can not be sustained. Our valuations price the future growth attainable
much less than what investors are willing to pay for them. We believe that the
observed market price of $144.99, is overvalued. Through our research and
analysis it is in our opinion that Cummins Inc. is currently overvalued and
presents a selling opportunity.
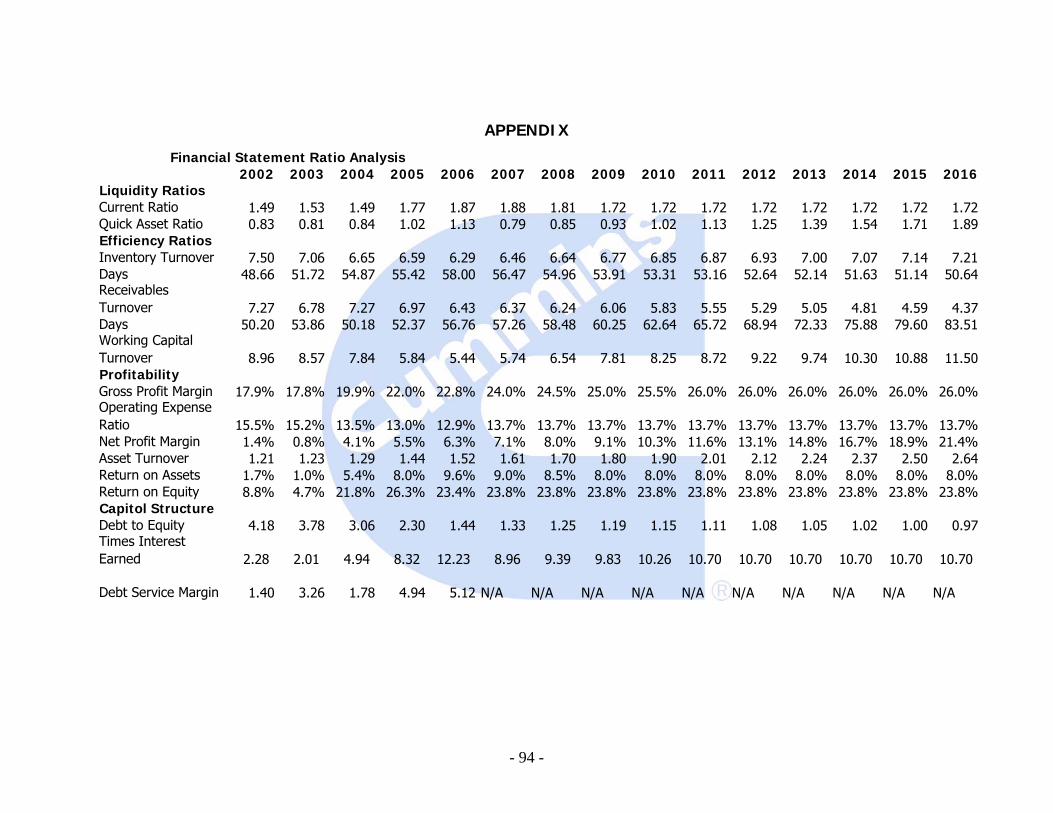
- 94 -
APPENDIX
2002 2003 2004 2005 2006 2007 2008 2009 2010 2011 2012 2013 2014 2015 2016Liquidity RatiosCurrent Ratio 1.49 1.53 1.49 1.77 1.87 1.88 1.81 1.72 1.72 1.72 1.72 1.72 1.72 1.72 1.72Quick Asset Ratio 0.83 0.81 0.84 1.02 1.13 0.79 0.85 0.93 1.02 1.13 1.25 1.39 1.54 1.71 1.89Efficiency RatiosInventory Turnover 7.50 7.06 6.65 6.59 6.29 6.46 6.64 6.77 6.85 6.87 6.93 7.00 7.07 7.14 7.21Days 48.66 51.72 54.87 55.42 58.00 56.47 54.96 53.91 53.31 53.16 52.64 52.14 51.63 51.14 50.64Receivables Turnover 7.27 6.78 7.27 6.97 6.43 6.37 6.24 6.06 5.83 5.55 5.29 5.05 4.81 4.59 4.37Days 50.20 53.86 50.18 52.37 56.76 57.26 58.48 60.25 62.64 65.72 68.94 72.33 75.88 79.60 83.51Working Capital Turnover 8.96 8.57 7.84 5.84 5.44 5.74 6.54 7.81 8.25 8.72 9.22 9.74 10.30 10.88 11.50Profitability Gross Profit Margin 17.9% 17.8% 19.9% 22.0% 22.8% 24.0% 24.5% 25.0% 25.5% 26.0% 26.0% 26.0% 26.0% 26.0% 26.0%Operating Expense Ratio 15.5% 15.2% 13.5% 13.0% 12.9% 13.7% 13.7% 13.7% 13.7% 13.7% 13.7% 13.7% 13.7% 13.7% 13.7%Net Profit Margin 1.4% 0.8% 4.1% 5.5% 6.3% 7.1% 8.0% 9.1% 10.3% 11.6% 13.1% 14.8% 16.7% 18.9% 21.4%Asset Turnover 1.21 1.23 1.29 1.44 1.52 1.61 1.70 1.80 1.90 2.01 2.12 2.24 2.37 2.50 2.64Return on Assets 1.7% 1.0% 5.4% 8.0% 9.6% 9.0% 8.5% 8.0% 8.0% 8.0% 8.0% 8.0% 8.0% 8.0% 8.0%Return on Equity 8.8% 4.7% 21.8% 26.3% 23.4% 23.8% 23.8% 23.8% 23.8% 23.8% 23.8% 23.8% 23.8% 23.8% 23.8%Capitol StructureDebt to Equity 4.18 3.78 3.06 2.30 1.44 1.33 1.25 1.19 1.15 1.11 1.08 1.05 1.02 1.00 0.97Times Interest Earned 2.28 2.01 4.94 8.32 12.23 8.96 9.39 9.83 10.26 10.70 10.70 10.70 10.70 10.70 10.70
Debt Service Margin 1.40 3.26 1.78 4.94 5.12 N/A N/A N/A N/A N/A N/A N/A N/A N/A N/A
Financial Statement Ratio Analysis

- 95 -
Value Weighted Cost of Equity 72 Month Summary Output
Regression Statistics Beta 1.4799914Multiple R 0.5780813 Adj. R Squa 32.47%R Square 0.3341779 Ke 0.0505787 5.06% annual measure 0.1188898Adj. R 0.3246662 Rf 0.0448903Standard Er 0.0805332 MRP 0.0038435 0.05 0.0525Observation 72
CoefficientsStandard Erro t Stat P-value Lower 95% Upper 95% Lower 95.0%Upper 95.0%Intercept 0.0209325 0.0095112 2.200832 0.0310484 0.0019631 0.039902 0.0019631 0.039902X Variable 1 1.4799914 0.2496896 5.9273262 1.052E-07 0.9820013 1.9779815 0.9820013 1.9779815
60 Month Summary OutputRegression Statistics Beta 1.5722205
Multiple R 0.5580955 Adj. R Squa 29.96%R Square 0.3114706 Ke 0.0915028 9.15%Adj. R 0.2995994 Rf 0.043885Standard Er 0.0839981 MRP 0.030287Observation 60
CoefficientsStandard Erro t Stat P-value Lower 95% Upper 95% Lower 95.0%Upper 95.0%Intercept 0.0190389 0.0109372 1.7407522 0.0870299 -0.002854 0.0409321 -0.002854 0.0409321X Variable 1 1.5722205 0.3069391 5.1222562 3.603E-06 0.9578152 2.1866258 0.9578152 2.1866258
48 Month Summary OutputRegression Statistics Beta 1.1334176
Multiple R 0.323834 Adj. R Squa 8.54%R Square 0.1048685 Ke 0.162324 16.23%Adj. R 0.0854091 Rf 0.0437458Standard Er 0.078872 MRP 0.1046201Observation 48
CoefficientsStandard Erro t Stat P-value Lower 95% Upper 95% Lower 95.0%Upper 95.0%Intercept 0.0286745 0.0125958 2.2765119 0.0275153 0.0033205 0.0540285 0.0033205 0.0540285X Variable 1 1.1334176 0.4882384 2.3214429 0.0247468 0.1506446 2.1161905 0.1506446 2.1161905
36 Month Summary OutputRegression Statistics Beta 0.5124391
Multiple R 0.1526323 Adj. R Squa -0.54%R Square 0.0232966 Ke 0.0640343 6.40%Adj. R -0.00543 Rf 0.0448667Standard Er 0.0685174 MRP 0.0374047Observation 36
CoefficientsStandard Erro t Stat P-value Lower 95% Upper 95% Lower 95.0%Upper 95.0%Intercept 0.0285839 0.0119091 2.4001631 0.0220094 0.0043816 0.0527862 0.0043816 0.0527862X Variable 1 0.5124391 0.5690333 0.9005431 0.374166 -0.643976 1.6688539 -0.643976 1.6688539
24 Month Summary OutputRegression Statistics Beta 0.8797089
Multiple R 0.2816152 Adj. R Squa 3.75%R Square 0.0793071 Ke 0.0792 7.92%Adj. R 0.0374574 Rf 0.0458625Standard Er 0.0594897 MRP 0.037896Observation 24
CoefficientsStandard Erro t Stat P-value Lower 95% Upper 95% Lower 95.0%Upper 95.0%Intercept 0.0224605 0.0128764 1.7443203 0.0950606 -0.004243 0.0491645 -0.004243 0.0491645X Variable 1 0.8797089 0.6390413 1.3766073 0.1824834 -0.445582 2.2049994 -0.445582 2.2049994

- 96 -
Dividend Discount 1 2 3 4 5 6 7 8 9 102006 2007 2008 2009 2010 2011 2012 2013 2014 2015 2016 Termina
DPS 1.44 1.50 1.57 1.64 1.71 1.79 1.86 1.95 2.03 2.12 2.21PV Factor 0.8937 0.7988 0.7139 0.6380 0.5702 0.5096 0.4555 0.4071 0.3638 0.3252PV of Future Dividends 1.29 1.20 1.12 1.05 0.98 0.91 0.85 0.79 0.74 0.69
Total PV of Forecasted Future Dividends 9.61Continuing (Terminal) Value 18.63Present Value of Continuing Terminal Value 6.06
Esitmated Value per Share (12/31/06) 24.69FV Factor 1.0025 0.01022Esitmated Value per Share (04/01/07) 24.75 Observed Price 144.99Observed Value 144.99 gDiff -120.24 0 0.02 0.04 0.06 Undervalued
Ke 0.09 35.10 45.12 63.17 105.29 OvervaluedActual Price per share 144.99 0.119 24.75 29.75 37.30 49.96Cost of Equity 0.1189 0.129 22.33 26.43 32.37 41.75growth rate 0 0.139 20.32 23.74 28.53 35.76
0.149 18.62 21.51 25.45 31.17
Sensitivity Analysis

- 97 -
Residual Income (RI) 1 2 3 4 5 6 7 8 9 10 Terminal
2006 2007 2008 2009 2010 2011 2012 2013 2014 2015 2016Beginning BE (per share) 63.01 76.31 85.34 96.53 110.15 126.45 145.68 166.85 190.15 215.81 244.05Earnings Per Share 14.74 10.47 12.76 15.34 18.18 21.27 23.40 25.74 28.31 31.14 34.26Dividends per share 1.44 1.44 1.57 1.72 1.87 2.04 2.23 2.44 2.66 2.90 3.17Ending BE (per share) 76.31 85.34 96.53 110.15 126.45 145.68 166.85 190.15 215.81 244.05 275.14Ke 0.1189"Normal" Income 9.07 10.15 11.48 13.10 15.04 17.32 19.84 22.61 25.66 29.02(Change) 1.22 1.24 1.23 1.15 -0.16 -0.18 -0.20 -0.22 -0.24Residual Income (RI) 1.40 2.61 3.86 5.08 6.24 6.08 5.90 5.70 5.48 5.24 5.24Discount Factor 0.92 0.84 0.77 0.70 0.65 0.59 0.54 0.50 0.45 0.42Present Value of RI 1.28 2.19 2.97 3.58 4.03 3.59 3.20 2.83 2.49 2.18
BV Equity (per share) 2006 76.31Total PV of RI (end 2006) 28.34Continuation (Terminal) Value 44.08PV of Terminal Value (end 2006) 18.36Estimated Value (2006) 123.02 Sensitivity AnalysisFV Factor 1.0025 0.01022 g Observed Price 144.99Esitmated Value per Share (04/01/07) 123.33 0 -0.1 -0.2 -0.5
Ke 0.09 186.48 156.45 147.13 138.13 UndervaluedActual Price per share 144.99 0.119 123.33 114.92 111.79 108.46 OvervaluedGrowth 0 0.129 105.34 101.42 99.88 98.20Ke 0.1189 0.139 88.89 88.46 88.29 88.10
0.149 73.50 75.87 76.88 78.04

- 98 -
Free Cash Flow 1 2 3 4 5 6 7 8 9 10 Terminal
2006 2007 2008 2009 2010 2011 2012 2013 2014 2015 2016
Cash Flow from Operations 840 933 1045 1181 1346 1548 1795 2100 2458 2875 3364Cash Provided (Used) by Investing Activities -335 -406 -491 -594 -718 -869 -1052 -1273 -1540 -1864
Free Cash Flow (to firm) 505 527 554 587 627 678 743 828 917 1,012 1,012
discount rate (9.37% WACC) 0.914 0.836 0.764 0.699 0.639 0.584 0.534 0.488 0.447 0.408Present Value of Free Cash Flows 462 441 423 410 401 396 397 404 410 413Total Present Value of Annual Cash Flows 4,158
Continuing (Terminal) Value 10,798PV of Continuing (Terminal) Value 4,409 g Observed Price Value of the Firm (end of 2006) 8,567 0 0.01 0.02 0.04Preferred Stock $4,409 WACC 0.0937 $85.95 $96.84 $110.68 153.84 UndervaluedValue of Equity (end of 2006) 4,158 0.104 $65.36 $73.31 $83.16 112.09 OvervaluedEstimated Value per Share 85.73 0.114 $49.11 $55.11 $62.38 82.81FV Factor 1.0025 0.01022 0.124 $35.64 $40.24 $45.72 $60.60Esitmated Value per Share (04/01/07) 85.95 0.134 $24.31 $27.89 $32.10 $43.20
Actual Price per share $144.99
WACC 0.0937
terminal growth 0.00
Sensitivity Analysis
$144.99

- 99 -
AEG 1 2 3 4 5 6 7 8 9 10 Termina2006 2007 2008 2009 2010 2011 2012 2013 2014 2015 2016
EPS 15.02 10.47 12.76 15.34 18.18 21.27 23.40 25.74 28.31 31.14 34.26DPS 1.44 1.44 1.57 1.72 1.87 2.04 2.23 2.44 2.66 2.90 3.17DPS invested at 11.89% (Drip) 0.17 0.17 0.19 0.20 0.22 0.24 0.27 0.29 0.32 0.34Cum-Dividend Earnings 10.64 12.93 15.52 18.38 21.49 23.64 26.00 28.60 31.46 34.60Normal Earnings 16.81 11.71 14.28 17.16 20.34 23.80 26.18 28.80 31.68 34.85
Abnormal Earning Growth (AEG) -6.17 1.22 1.24 1.23 1.15 -0.16 -0.18 -0.20 -0.22 -0.24 -0.24PV Factor 0.89 0.80 0.71 0.64 0.57 0.51 0.46 0.41 0.36PV of AEG 1.09 0.99 0.87 0.74 -0.09 -0.09 -0.09 -0.09 -0.09 -0.09
Core EPS 10.47 -0.746Total PV of AEG 3.25PV of Terminal Value -0.27Total Average EPS Perp (t+1) 13.44Capitalization Rate (perpetuity) 0.1226
Intrinsic Value Per Share 109.64FV Factor 1.0025 0.01Esitmated Value per Share (04/01/07) 109.92Actual Price per share 144.99Ke 0.1189 g Observed Price g 0 0 0.02 0.03 0.05
Ke 0.09 $148.81 $151.96 $154.33 162.6 Overvalued0.1189 $109.92 $109.47 $109.17 108.31 Undervalued0.1289 $100.93 $100.24 $99.79 98.540.1389 $93.29 $92.52 $92.03 $90.710.1489 $86.68 $85.92 $85.44 $84.19
Sensitivity Analysis$144.99

- 100 -
References:
1. Yahoo Finance: http://finance.yahoo.com
2. MSN Money:http://money.msn.com
3. Cummins Corporate Website: http://www.cummins.com
4. Caterpillar Corporate Website: http://www.cat.com
5. Securities and Exchange Commission Website: http://www.sec.gov
6. Palepu, Healy and Bernard, Business Analysis and Valuation (Ohio: Thomson- Southwestern, 3rd Edition, 2004)
7. St. Louis Federal Reserve: http://research.stlouisfed.org/fred2/categories/22


![Hino Torque Spring2007[1]](https://static.fdocuments.us/doc/165x107/5517c5e049795947228b4b3e/hino-torque-spring20071.jpg)