Callaway Equity Valuation and Analysis - Mark E....
99
1 Callaway Equity Valuation and Analysis Valued at 1 April, 2007 Andrew Latham: [email protected] Matt Rouse: [email protected] Justin Ruggles: [email protected] Terry Smith: [email protected]
-
Upload
phungkhuong -
Category
Documents
-
view
224 -
download
1
Transcript of Callaway Equity Valuation and Analysis - Mark E....

1
Callaway Equity Valuation and
Analysis Valued at 1 April, 2007
Andrew Latham: [email protected] Matt Rouse: [email protected]
Justin Ruggles: [email protected] Terry Smith: [email protected]

2
Table of Contents
Executive Summary 3
Business & Industry Analysis 6
Accounting Analysis 18
Financial Analysis 32
Valuation Analysis 70
Appendices
Appendix 1 82
Appendix 2 83
Appendix 3 89
Appendix 4 90
Appendix 5 92
Appendix 6 97
References 98
3
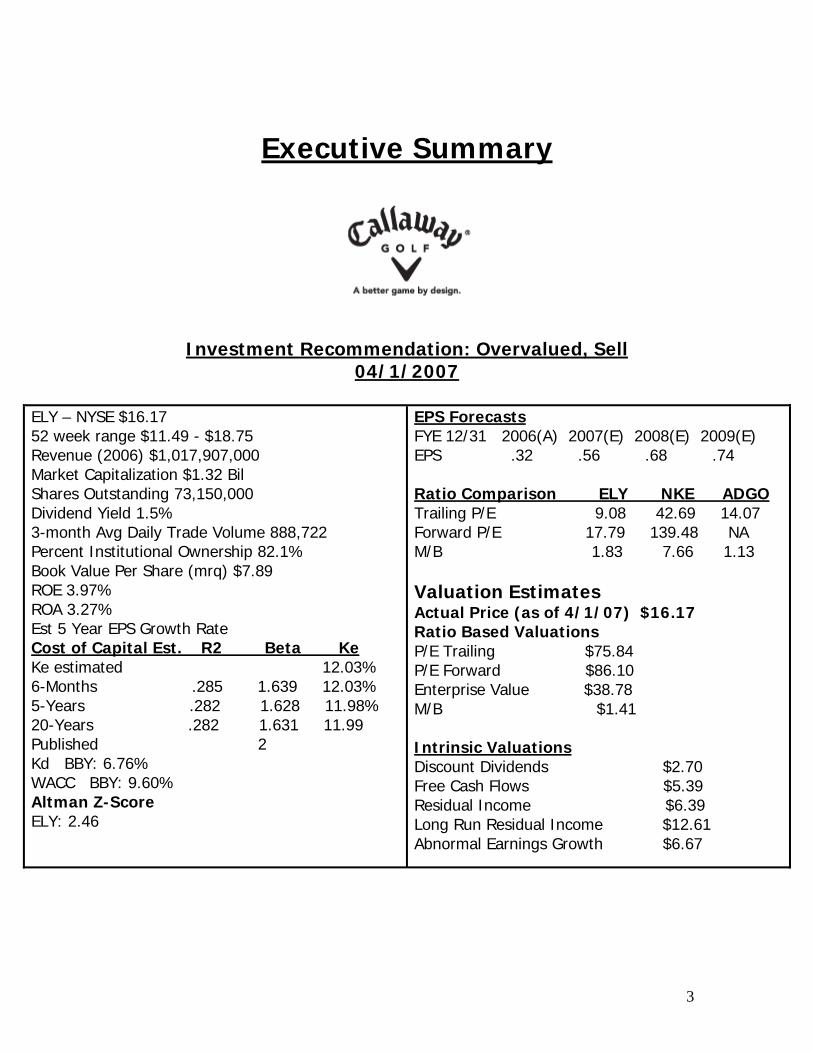
Executive Summary
Investment Recommendation: Overvalued, Sell
04/1/2007
ELY – NYSE $16.17 52 week range $11.49 - $18.75 Revenue (2006) $1,017,907,000 Market Capitalization $1.32 Bil Shares Outstanding 73,150,000 Dividend Yield 1.5% 3-month Avg Daily Trade Volume 888,722 Percent Institutional Ownership 82.1% Book Value Per Share (mrq) $7.89 ROE 3.97% ROA 3.27% Est 5 Year EPS Growth Rate Cost of Capital Est. R2 Beta Ke Ke estimated 12.03% 6-Months .285 1.639 12.03% 5-Years .282 1.628 11.98% 20-Years .282 1.631 11.99 Published 2 Kd BBY: 6.76% WACC BBY: 9.60% Altman Z-Score ELY: 2.46
EPS Forecasts FYE 12/31 2006(A) 2007(E) 2008(E) 2009(E) EPS .32 .56 .68 .74 Ratio Comparison ELY NKE ADGO Trailing P/E 9.08 42.69 14.07 Forward P/E 17.79 139.48 NA M/B 1.83 7.66 1.13 Valuation Estimates Actual Price (as of 4/1/07) $16.17 Ratio Based Valuations P/E Trailing $75.84 P/E Forward $86.10 Enterprise Value $38.78 M/B $1.41 Intrinsic Valuations Discount Dividends $2.70 Free Cash Flows $5.39 Residual Income $6.39 Long Run Residual Income $12.61 Abnormal Earnings Growth $6.67
4
Recommendation – Overvalued Firm
Company, Industry Overview and Analysis
Callaway Golf is a leading designer, manufacturer, and seller of high
quality golf clubs, golf balls, and golf accessories. They were incorporated in
California in 1982 and have since acquired several other companies throughout
their existence. They have several competitors that are also highly established in
the golf industry. These include, but are not limited to, Titleist, Ping, Taylor
Made, Cobra, Nike, and Adams. Out of all of these Titleist, Cobra, Nike, and
Adams are the only publicly traded companies. However Titleist and Cobra are
owned by a conglomerate parent company named Fortune Brands Incorporated.
These companies are in a highly competitive industry that is characterized by a
high amount of research and development, innovation, and brand imaging.
Competing on cost is a minimal factor compared to the previous in the golf
industry, as quality is the highest emphasis. Creating a competitive advantage is
achieved through customer retention by having a unique and favorable brand
image, as well as having a highly qualified product. Callaway is seen as one of
the leading organizations in the golf industry.
Accounting Analysis
The accounting analysis utilizes ratios and information disclosed in a firms
10-k, in order to asses the quality of a firms disclosure, as well as the quality of a
firms actual information, and possible distortion. The main elements used from
the 10-k are the income statement, balance sheet, statement of cash flows, and
other disclosed information regarding key accounting policies. Callaway Golf’s
disclosure of information in their 10-kis moderate at best. Some of their actions
in the past suggest aggressive policies with regards to accounting practices. For

5
example, in 2002 Callaway undertook a new policy that reduced warranty liability
reserves by 17 million dollars. This led to the eventual separation of Callaway
and KPMG as well as a 26% increase in earnings per share, rather than a 15%
decline. The accounting analysis also screens a firms 10-k for possible distortion,
or red flags that may indicate distortion in a firms numbers. We did not identify
any apparent red flags for Callaway that could lead to possible distortion with
regards to their financial information.
Financial Analysis
Financial Analysis consists of a set of ratios that evaluate a company’s
liquidity, profitability, and capital structure. These ratios are beneficial in
determining a company’s past performance, current performance, and possible
trends for the future. By calculating these ratios for Callaway’s competitors we
also gain an understanding of their status in the industry.
The liquidity ratios evaluate a company’s ability to converts assets into
cash, which characterizes their ability to pay their debt. Callaway’s ability to
collect receivables and their inventory management are vital to their liquidity.
These ratios include the current ratio, quick ratio, receivables turnover, days
sales outstanding, inventory turnover, days supply of inventory, and working
capital turnover. The profitability ratios determine a firms ability to generate
profits, these include gross profit margin, operating profit margin, net profit
margin, asset turnover, return on assets, and return on equity. And finally a
firm’s capital structure determines a firms financing structure. These ratios
include debt to equity, times interest earned, debt service margin. Additionally
the financial analysis includes a sustainable growth rate and an internal growth
rate.
The core of the financial analysis is the forecasted balance sheet, income
statement, and statement of cash flows. In addition to those there is also a
common size for each of the statements. The common size breaks every item on
the statement to a percentage amount. These forecasts are based on several
6
assumptions and can be assumed to be relatively accurate for the first
proceeding years, with a declining accuracy as the years continue.
Intrinsic Valuation
The intrinsic valuation models determine the present value of all future
cash flows generated by the firm; however each model has a different degree of
explanatory power. This present value is theoretically the implied value of the
firm per share of stock. Essential to these valuations is the firms cost of equity,
cost of debt, and the weighted average cost of capital(WACC). Callaway golf has
an after tax cost of debt of 4.39%, a cost of equity of 12.03%, and a WACC of
9.60%. The five valuation models we used are discounted dividends, free cash
flows, residual income, long run residual income, and abnormal earnings growth.
These models gave the following results: Discounted Dividends: $2.70, Free Cash
Flows: $5.35, Residual Income: $6.39. Long Run Residual Income: $12.26,
Abnormal Earnings Growth: $5.19. As Callaway Golf’s actual price per share on
April 1st of 2007 was $16.17, the valuation models would identify Callaway as
overvalued. Another key component to the intrinsic valuation is the Altman Z-
Score, which is used to determine the credit worthiness of the firm. A score of
1.8 or below indicates a firm that has bad credit and is in danger of bankruptcy,
while a score of 2.67 or above indicates the opposite. Callaway Golf has a Z-
Score of 2.46 which would indicate that they are not in immediate danger of
bankruptcy, but they do not have highly favorable credit.
Business & Industry Analysis Company overview
Callaway Golf was incorporated in California in 1982, and then
reincorporated in Delaware on July 1, 1999. Since their foundation they have
acquired several other brands such as Odyssey Sports and Top-Flite Golf. They
are a sporting goods company that designs, manufactures, and sells high quality
golf clubs, golf balls, and a wide range of golf accessories. They distribute their
7
product generally by selling to golf retailers, sporting goods retailers, mass
merchants, and wholly owned subsidiaries. Their industry is characterized by
several other highly recognized brand names, such as Titleist, TaylorMade, Nike,
Adams Golf, etc. This leads to a high degree of competition and strong brand
recognition. Callaway Golf is a seasonal business in which approximately two-
thirds of its sales occur in the first half of its fiscal year, which ends December
31st, according to their annual 10-K.
Although Callaway Golf distributes through over 100 countries,
approximately 56% of their net sales are derived from distribution within the
United States. The majority of Callaway’s international sales come from Europe,
Japan, Canada, Korea, and Australia, in which they have wholly-owned
subsidiaries. The bulk of Callaway’s net sales come from sales on golf clubs and
golf balls. On a segment base, customers that distribute golf balls in the United
States are much more concentrated than golf club customers. As stated in their
10-K in 2005, the top five customers of Callaway golf balls accounted for 24% of
the total golf ball sales. The loss of one of these customers could have a
significantly negative affect on the sale of golf balls.
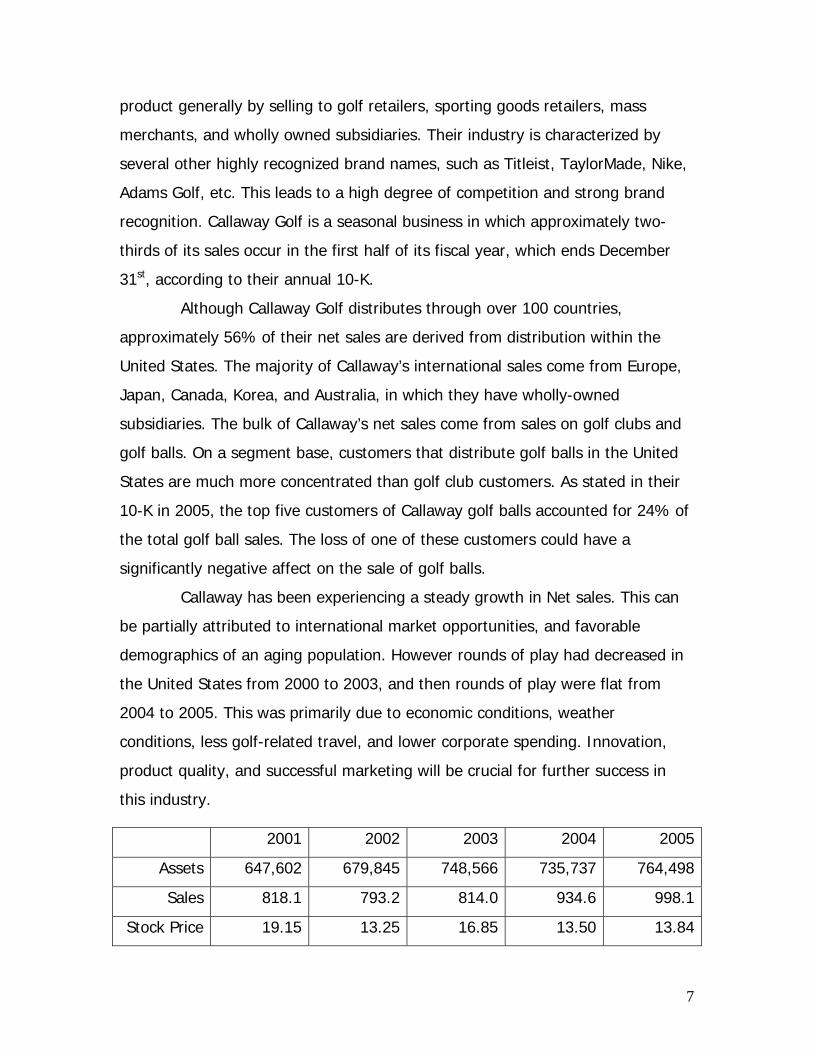
Callaway has been experiencing a steady growth in Net sales. This can
be partially attributed to international market opportunities, and favorable
demographics of an aging population. However rounds of play had decreased in
the United States from 2000 to 2003, and then rounds of play were flat from
2004 to 2005. This was primarily due to economic conditions, weather
conditions, less golf-related travel, and lower corporate spending. Innovation,
product quality, and successful marketing will be crucial for further success in
this industry.
2001 2002 2003 2004 2005
Assets 647,602 679,845 748,566 735,737 764,498
Sales 818.1 793.2 814.0 934.6 998.1
Stock Price 19.15 13.25 16.85 13.50 13.84

8
*Sales in millions
Five Forces Model
The five forces model compares five elements of an industry. A company
within the industry needs stand out in or overcome these five different elements:
rivalry among existing firms, threat of new entrants, threat of substitute
products, bargaining power of buyers, and bargaining power of suppliers. The
five forces model will outline the type of industry Callaway must compete in.
Rivalry Among Existing Firms
Rivalry among existing firms in an industry is a significant source of
competition. Highly competitive industries are likely to drive prices down closer
towards marginal cost. Firms may also rely upon innovation and brand image to
distinguish themselves from competitors.
Industry Growth
Growth in an industry directly correlates to gaining market share. In an
industry with strong growth, competitors are not forced to gain market share
from other firms to grow. Golf sporting companies; however, are in an industry
that has not seen substantial growth in several years. In the Industry, Callaway
already has a sizeable share of worldwide golf club sales and golf ball products
that rank second in market share, so in order to significantly gain more share in
the industry they must gain market share from other firms or the industry itself
must see more growth. As competition within the industry increases, firms are
being forced to increase expenditures on tour and advertising support along with
product development. These pressures and increased costs are negatively
affecting the industry. For companies to avoid these adverse affects they must
continue to compete on the basis of innovation, quality, performance, customer

9
service, and price. Though the majority of added market share must come from
other firms, the industry is still growing at a slow rate.
Concentration and Balance of Competitors
The number and size of firms in an industry determines its concentration
and balance, and the degree of concentration in an industry determines the
amount of price competition between firms. The Golf industry is in a highly
competitive industry with a number of well-established and well-financed
companies with recognized brand names. Their main competitors include:
TaylorMade, Titleist, and Ping. New product introductions, price reductions,
consignment sales, extended payment terms, and increased spending on
advertising and brand image continue to increase market competition. For a
company to stand out, they must find a way to differentiate itself from
competitors, while still providing price competitive products. The industry is
moderately concentrated and increasingly competitive.
Degree of Differentiation and Switching Costs
The degree to which a firm is able to differentiate their products or
services from competitors allows them to avoid less direct competition. If
products are similar, customers will base decisions solely on price. The industry
contains more differentiation and higher switching costs. A company must try to
take pride in commitment to innovation. A company must revolutionized things,
like Callaway did with their driver technology and the original Big Bertha Driver.
In order for a company to compete they can try innovation in clubs, putters, balls
and accessories with scientifically advanced products. A golf company must use
their cutting-edge technology and respect for the game to make premium
products for all types of golfers. The firms must focus on providing unique high-
quality products along with good service to set them apart in their industry. This
industry contains a higher degree of differentiation accompanied by higher
switching costs.
10
Ratio of Fixed to Variable Costs
The ratio of fixed to variable costs is an important factor in determining
price for a firm’s products or services. A firm may conduct operations in both
owned and leased properties. The golf companies do not have retail space,
since they distribute their products to golf retailers, sporting good retailers, and
mass merchants. This would reduce the fixed costs incurred by the golf
manufacturing companies. The industry’s size has made it a large consumer of
certain materials, including steel, titanium alloys, carbon fiber and rubber. The
industry does not make these materials themselves, and must rely on suppliers
to supplement these variable costs.
Excess Capacity and Exit Barriers
If supply is greater than demand in an industry, excess capacity will exist.
This will force firms to cut prices to fill capacity. Most companies in the industry
plans their manufacturing capacity based upon the forecasted demand for its
products. If actual demand for its products exceeds the forecasted demand, the
Company may not be able to produce sufficient quantities of new products in
time to fulfill actual demand, which could limit the Company’s sales and
adversely affect its financial performance. On the other hand, if actual demand is
less than the forecasted demand for its products, excess inventories could result.
In an industry whose product life cycle is estimated at two years, excess
inventory must be minimal. Exit barriers in the industry are substantial due to the
costs of property, plant, and equipment. This means a company in this industry
must have a very efficient inventory system in order to minimize excess supply
and building space due to the high costs.
Threat of New Entrants

11
The next five force factor is threat of new entrants. This is very important
in a industry. This will explain how the degree of competition in an industry can
increase and how easily.
Economies of Scale
When a industry has large economies of scale, a new entrant must invest
a large amount and not see the returns for a long time. Economies of scale is a
big determinant when it comes to a companies overall strategy. A leading
competitor in the sporting goods industry gives it an advantage over new
entrants. The size of the corporation entering the industry plays a big factor. In
the sporting goods industry which has high economies of scale new entrants
must enter with a large amount of capital to maintain market share. In order to
compete in the sporting goods industry companies must be able to bargain with
their buyers. While a firm can have higher prices than its competitors, it has an
overall higher quality product which buyers are willing to spend. This gives
companies like Callaway an advantage over new entrants into the sporting goods
industry. Also, when entering, companies will not only have to compete on
quality, performance and ease of use, but also brand recognition. If companies
were able to compete on price and quality they will then have to compete and
offer the same services. The industry has large economies of scale.
First Mover Advantage
In the sporting goods industry companies compete on quality,
performance, and ease of use. Incorporate first mover advantage by selling sets
of irons to compete with other manufactures. Overall Callaway offers drivers,
woods, irons, wedges, and putters, but not a full complete set. To create a first
mover advantage and compete with firms that are entering the industry Callaway
will have to allow the sale of a complete set of golf clubs. Although quality and
brand image of a product will increase the customers switching costs, the
performance and ease of use will allow most of the growth of the industry.
12
When switching products in the golf industry you are paying a little more, but are
receiving the higher quality product that a firm offers offers. Because of this first
mover advantage is not a very high risk.
Access to Channels of Distribution and Relationships
When there is limited space in the present distribution channels and too
big of a cost to create a new one, this can create another barrier to entry. When
entering the sporting goods industry, which has high costs to develop new
channels, acts as powerful barriers to entry. Callaway has maintained good
relationships with its existing supplier of metals and graphites to manufacture its
golf clubs. While Callaway provides a higher quality product at a higher price it
maintains good relationships with its buyers and suppliers to make it difficult for
new firms to enter into the industry. Callaway is able to gain more channels by
maintaining their high quality golf clubs and accessories. As the sporting goods
industry grows Callaway will have to maintain and then gain more channels to be
successful in the industry.
Legal Barriers
In the sporting goods industry there are no legal barriers that prevent any
firm from entering the industry. The only legal barriers that Callaway must have
are insurance for factories and facilities of products. In the sporting goods
industry there are no patents or licensing regulations that exist. In the end, this
creates a high risk of new entrants into the sporting goods industry, so quality
and performance are a must when it comes to Callaway’s industry.
It is expensive to enter this industry and the right capacity in order to
compete with existing firms, and first mover advantage is not a risk. Existing
firms have concrete channels of distribution and relationships. Although there are
no legal barriers to enter the industry, the threat of new entrants is low to this
industry. It would take to much money to invest to enter with out enough return.

13
Threat of Substitute Products
The threat of substitute products in this industry is everywhere. There are
different sports to play, other well established brand names, and many imitations
to name a few. In order for a company to survive, they must differentiate
themselves for other competition in the industry.
In this industry the majority of companies are well established, well
financed and possessing recognizable and credible brand names. Therefore
there is a threat of substitutes because several other companies provide very
similar products at highly competitive prices. Callaway’s strategy is to match
price with top performance. Even though a company’s products are often higher
in price than their competitors, consumers are willing to sacrifice price in return,
they receive some of the highest quality sporting good products offered on the
market. A company can gain an advantage by having full time regional field
representatives, and dedicated in house sales representatives that work together
to initiate and maintain long lasting relationships with customers. Building a
loyal customer base is one of should be a top priority. In addition, golfers
usually purchase sporting products based on performance, ease of use, and
appearance, not necessarily price.
Another way to battle the threat of substitutes through product
differentiation by investing huge amounts of resources dedicated to innovation
and improving upon existing technologies. One defining characteristic of a firm
in the industry that sets them apart from their competitors is that they have the
ability and resources to customize golf clubs to fit the specific needs of a
particular consumer. A company can get an edge by having a separate team of
manufacturing and club fitting specialists that can custom fit and manufacture
clubs to their consumers. This elite team of club fitting specialists and
manufacturers has vehicles with club fitting capacity enabling them to provide
custom clubs to consumers anywhere, even on the golf course, further setting
them apart from the competition.

14
Furthermore, a firm may devote a large part of their resources to
advertising and marketing. The ability to advertise in national magazines,
television, and sponsor many professional golfers and celebrities, can give a
company even another way to differentiate themselves. The sports and golf
apparel industry is difficult to predict and may be subject to rapid and
unanticipated changes due to the highly competitive market.
Bargaining Power of Buyers
The bargaining power of buyers incorporates price sensitivity and relative
bargaining power. The two factors make up the next five forces model and
measure the strength of the buyers.
Although the industry is price sensitive, golf companies usually cater to
an audience that isn’t as concerned with price compared to other sports apparel
consumer bases. Golf equipment is a leisure good therefore, a high percentage
of the consumer base, isn’t as sensitive to price compared to other sporting
industries. To most customers, the percentage to the customers cost structure is
relatively small when purchasing golf equipment. The buyer’s power is strong
when it comes to paying for quality. If a company were to fall short on quality
then the customers bargaining power would come in to play and most likely lead
to customers seeking other golf manufacturers, however if a firm is able to
consistently produce some of the highest quality products on the market it will
be able to maintain high levels of sales and a loyal customer base. There are
many alternative products available to the buyer, however, when the level
quality comes into play, consumers will find a pay for it.
Bargaining Power of Suppliers
In the golf industry, suppliers are primarily the manufacturers of raw
materials. The materials in a golf club vary depending on the type of club. The
overall quality also depends on the materials used. Customers of golf products
are primarily concerned with performance, image, and brand recognition, rather

15
than the specifications of the materials used. There is concern however with the
distinction of steel versus graphite shafts or aluminum versus titanium club
heads. There are a limited number of suppliers for their club heads and shafts.
Due to the company’s size, it consumes large amounts of certain materials that it
does not produce internally. They also require specific manufacturing techniques
and processes which would make it difficult to use an alternative supplier quickly.
United Parcel Service provides the primary shipping service for Callaway
nationally and internationally. A disruption in shipping could also have negative
effects on the company’s supply chain. Maintaining a good relationship with
suppliers and shippers is essential for a company to maintain consistent supplies.
With these factors in consideration we conclude that the threat of bargaining
power of suppliers is moderate.
Classifying the Industry
This is a highly competitive industry. In this industry, firms must rely upon
innovation and brand image to distinguish themselves from competitors. Golf
sporting companies are in an industry that has not seen substantial growth in
several years, making it even more competitive. As competition within the
industry increases, firms are being forced to increase expenditures on product
development and placement. For a company to stand out, they must find a way
to differentiate itself from competitors, while still providing price competitive
products. This industry is also classified with a mixed cost structure, there are
many ways that your costs will increase, but also many ways to decrease your
costs. This means a company in this industry must be very efficient in everything
they do. It is expensive to enter this industry and the right capacity in order to
compete with existing firms, due to large economies of scale. Also, when
entering, companies will not only have to compete on quality and performance,
but also brand recognition.
Value Chain Industry Analysis

16
For a company to be successful in this industry it is vital that the
consumer see them as the superior product. This leads to an extensive amount
of research and development, product variety, and advertising. Therefore cost
leadership competition between firms that are recognized as superior brands, is
relatively low, making a differentiated product a key to success.
Research and Development
Expected performance of a golf club or golf ball is linked directly to
quality. One way that golf companies improve quality is through research and
development. Developers of golf balls and golf clubs have a wide variety of tools
they use in this process, ranging from computer design software, to both
destructive and non-destructive test methods. Research and development has
also yielded a large variety of golf products. Every category of golf club has a
variety of clubs to choose from. They are distinguished from one another by
characteristics such as distance, accuracy, weight, feel, as well as many others.
These characteristics, along with quality, are just one more area of
differentiation that is achieved through current technology. And in a business
where the estimated use of the product is 2 years, technology plays an important
role.
Investment in Brand Image
Another method that golf companies use to achieve a strategic
competitive advantage is heavy investment into the brand itself. Many
organizations endorse a professional golfer, which establishes value to the
customer by linking a prestigious golfer with a golf company’s product. Brand
images are also established through targeted printed advertisements in sport or
golf related magazines, as well as television commercials on golf related
telecasts.
Superior Product Quality
17
In order for a brand image to be maintained over time, a firm must
continually offer the quality that is expected of it. This can only be achieved
through retaining customers and continuous innovation. Whichever company is
able to improve and revolutionize their product will gain a significant competitive
edge. In such a fast paced industry where new products and models come
regularly, strategic differentiation is what separates a company from success or
failure.
Competitive Strategy Analysis
In the golf apparel industry, most manufacturers lower the prices of their
products accordingly in order to stay competitive with all other manufacturers.
Callaway’s approach to staying on top of the Golf apparel industry has always
been to provide top quality golf products with cutting edge technology, at the
lowest price possible. Callaway products are in high demand because of their
outstanding quality and top performance, not because they are offered at a
lower price.
Research and Development
“Golfers generally purchase [Callaway] products on the basis of
performance, ease of use and appearance” (Thompson One). Therefore
Callaway concentrates on product differentiation. Callaway spends invests
millions of dollars annually in research and development as well as production
efficiency. Callaway has both CAD software (computer aided design) and CAM
software (computer aided manufacturing), as they point out very clearly in their
10-K, in order to improve manufacturing efficiency as well as to ensure their
products are provided to the consumer at the lowest price possible.
Superior Product Quality

18
Callaway has been on the forefront of a quality for many years. In the
past, this was achieved by Callaway’s introduction of the Big Bertha club line,
which through a process of stretching titanium over the face of the club head,
gave superior control and quality. This is an example of how differentiating a
product had led to a competitive advantage.
Investment in Brand Image
Callaway also likes to keep their brand recognizable, by spending money
in advertising their image in the proper place. Callaway advertises only through
mediums that cater specifically to their key demographics. Most of their printed
advertisements are found in Golf Magazine, Golf World and Golf Digest, all of
which are national publications.
One of Callaway’s most defining attributes, described in its 10-K, is their
unparalleled customer service. Callaway has a mobile club fitting and
manufacturing division that can customize clubs to consumers anywhere in the
country. Club fitting customers and professionals help promote sales and brand
loyalty.
In order for Callaway to sustain the competitive advantage they have
now, they will continue their innovative approach partnered with the highest
quality, top performing golf products available on the market today.
Accounting Analysis In accounting analysis we will be using Callaway’s 10-k to asses the
quality of accounting. The most essential portions of the 10-k will be the balance
sheet, the income statement, and the statement of cash flows. Also,
management’s discussion of key accounting policies will be an integral part of
our valuation. The following will be broken into 5 parts. First we will identify and
evaluate Callaway’s key accounting policies, accounting flexibility, actual
accounting strategy, quantitative and qualitative analysis, and potential red flags.

19
Key Accounting Policies
Callaway Golf’s competitive strategy is based largely on product
differentiation. Because of this, Callaway uses accounting policies that best
reflect their identified key success factors. Some of the more prominent of these
accounting policies include research and development, warranty expense and
reserves, inventory management, and goodwill and intangibles.
In order for Callaway to be successful in their industry, they must always
be on the leading edge of technology. This is achieved through extensive
research and development. GAAP requires research and development to be
expensed to the cost of goods sold account (COGS). This restricts management’s
flexibility and makes the benefits to the firm from R&D difficult to capitalize.
Some of the most direct benefits from investments in R&D include an increase in
intangible assets such as patents and improved product quality. Technological
advancements such as computer aided design and manufacturing software are
also directly related to R&D expenditures. “Through the use of this technology,
the Company has been able to accelerate the design, development and testing of
new golf clubs and golf balls” (Callaway 10-K 2005).
Since Callaway differentiates itself from competitors based on factors such
as customer service and superior product quality, it is their policy to honor
warranties past the stated 2 years. Warranties are estimated by historical
frequency claims, as well as the cost of satisfying warranty claims. Callaway also
keeps warranty reserves to ensure coverage of claims. They adjust these
reserves to maintain the percentage of warranty reserves to sales fairly constant
as indicated in the table. This shows that management has been able to
successfully predict and account for any significant changes in warranty
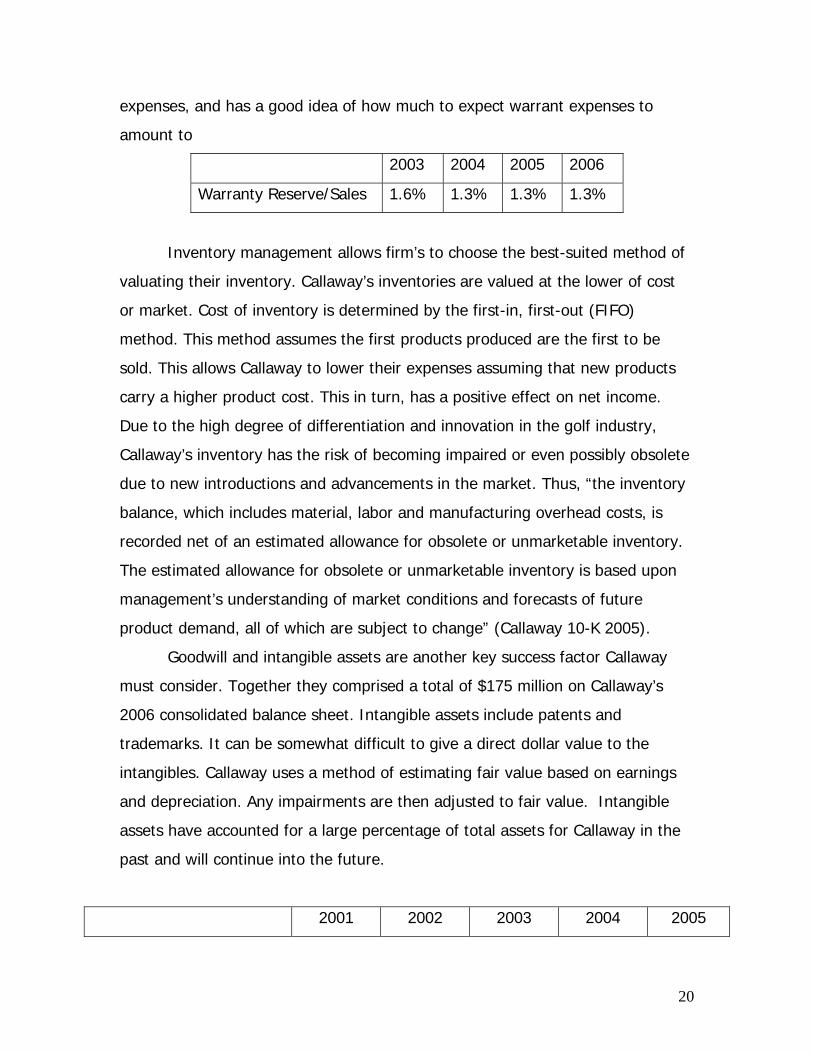
20
expenses, and has a good idea of how much to expect warrant expenses to
amount to
2003 2004 2005 2006
Warranty Reserve/Sales 1.6% 1.3% 1.3% 1.3%
Inventory management allows firm’s to choose the best-suited method of
valuating their inventory. Callaway’s inventories are valued at the lower of cost
or market. Cost of inventory is determined by the first-in, first-out (FIFO)
method. This method assumes the first products produced are the first to be
sold. This allows Callaway to lower their expenses assuming that new products
carry a higher product cost. This in turn, has a positive effect on net income.
Due to the high degree of differentiation and innovation in the golf industry,
Callaway’s inventory has the risk of becoming impaired or even possibly obsolete
due to new introductions and advancements in the market. Thus, “the inventory
balance, which includes material, labor and manufacturing overhead costs, is
recorded net of an estimated allowance for obsolete or unmarketable inventory.
The estimated allowance for obsolete or unmarketable inventory is based upon
management’s understanding of market conditions and forecasts of future
product demand, all of which are subject to change” (Callaway 10-K 2005).
Goodwill and intangible assets are another key success factor Callaway
must consider. Together they comprised a total of $175 million on Callaway’s
2006 consolidated balance sheet. Intangible assets include patents and
trademarks. It can be somewhat difficult to give a direct dollar value to the
intangibles. Callaway uses a method of estimating fair value based on earnings
and depreciation. Any impairments are then adjusted to fair value. Intangible
assets have accounted for a large percentage of total assets for Callaway in the
past and will continue into the future.
2001 2002 2003 2004 2005

21
Intangible Assets 104,467 $103,115 $149,635 $149,168 $146,123
Total Assets $647,602 $679,845 $748,566 $735,737 $764,498
% of Assets in Intangibles 16.1% 15.2% 20% 20.3% 19.1%
*Numbers in millions
Accounting Flexibility
The amount of accounting flexibility given to managers can directly
influence how informative the firm’s financial reports will be to outsiders. The
determining factor, however, is not necessarily the amount of flexibility given but
how the managers decide to use that flexibility.
Callaway’s success highly depends on their ability to differentiate their
products; therefore, they must invest large amounts of money in research and
development. There is no flexibility given to managers in the reporting of R&D; it
must be expensed as incurred. This lack of flexibility is detrimental to managers
because even though expensed R&D provides unrecognized future benefits to
the company in the form of advancements and introductions of new golf clubs
and golf balls.
Managers have the option of choosing their method of calculating
inventory; the LIFO, FIFO, and Average Cost are the methods that are available.
Callaway, along with other competitors in the industry, chooses to value their
inventory through FIFO. This flexibility given to managers allows them to either
boost their net income and lower expenses (FIFO), or lower their expenses to
decrease the amount of taxes they must pay (LIFO) depending upon what is
needed to best represent their firm. In the case of Callaway, the FIFO method
allows them to decrease the risk of impaired or obsolete inventory. The
possibility of impairment along with the higher amount contributed to cost of
goods sold could lead to an overstatement of Callaway’s assets.
Goodwill and intangible assets are a large and vital part of Callaway’s
success. Intangible assets with an infinite life cannot be amortized; their fair
value is measured annually and impairments are assessed accordingly. Callaway

22
uses its best judgment based on the most current facts and circumstances
surrounding its business when applying these impairment rules. These estimates
do contain error and provide management with flexibility through possible
manipulation of fair values.
Callaway’s ability to determine whether they classify leases as operating
leases or capital leases provides a substantial amount of flexibility. Choosing to
use operating leases lowers you liabilities and increases expenses, because it is
an off-balance sheet account and listed under expenses. Callaway has taken this
approach and lists its facilities under operating leases. Because Callaway is not a
retailer and only holds operating leases in its warehouses, distribution and office
facilities this is not a large concern as rent expense for 2005 was only $7.7
million. The flexibility is still given and Callaway uses it to their benefit.
Callaway’s key accounting policies grant them some flexibility in their
reporting of financial numbers. GAAP provides no flexibility in reporting R&D, but
they have been given flexibility in other areas. This flexibility will allow Callaway
to accurately disclose meaningful information to outsiders.
Actual Accounting Strategy
Callaway has been a publicly traded company since 1982; therefore they
prepare their financial statements in accordance with accounting principles
generally accepted in the United States. This means they must follow the
guidelines that GAAP provides for their accounting disclosure. Callaway currently
uses the accounting firm Deloitte & Touché to audit their financial reports, after
switching from the KPMG firm in 2002.
An accounting issue between management of the company and KPMG
sprung up over a warranty issue in 2002. After Callaway overestimated their
warranty reserve for two years, they decided it could be dramatically reduced.
They changed the way they estimated warranty costs due to better product
engineering and manufacturing systems combined with accurate record keeping
and lowered costs associated with resolving warranty claims according to

23
WarrantyWeek.com. They came to the conclusion that the warranty reserve
should be reduced by 17 million dollars. KPMG agreed with this number but
disagreed with the way Callaway wanted to reduce the warranty fund. Callaway
wanted to, and eventually did, account for the reduction of warranties for the
quarter at which the new estimate occurred, which meant a 10.5 million dollar
gross profit increase in the third quarter of 2002. KPMG disagreed and wanted
go back and allocate the reduced costs to prior years. Callaway aggressively put
pressure on KPMG to agree with the company. After the matter was not
resolved, Callaway chose to fire the company over restating years of earnings.
They hired Deloitte & Touché and reported a 26% increase in earnings per share
rather than a 15% decline in 2002. This also made gross profit margins remain
steady at 50%, instead of falling to 48% due to the warranty adjustment. This
accounting strategy worked. After Callaway explained the accounting
disagreement in its annual report, investors took the news well and the stock
price in 2003 started to increase (warrantyweek). While this change in
accounting policy is easily justified by Callaway, it is still a very aggressive and
spontaneous step that was taken, and it had a significant impact on the firms
displayed earnings. Earnings per share took a 41% increase from what would
have been a 15% decline to a 26% increase. Aggressive actions with such large
impacts such as this leads us to question management’s actions.
The company has two operating segments divided into golf clubs and golf
balls; they also break down geographic segments. This gives Callaway the
opportunity to look at each aspect of their operations, which helps them narrow
down problems within the company more efficiently. When looking closer at
Callaway’s operations, one finds that the company uses operating leases for
warehouses, distribution and office facilities, vehicles and office equipment. This
gives Callaway more expenses for the cost of the operating lease. This lowers
their liabilities and also lowers their taxes due to heavier expenses. To account
for inventories Callaway uses the first in, first out method when determining cost
24
of inventories. This method will give Callaway’s net income an increase, because
expenses will decrease.
Callaway has done well with their accounting since the estimation error in
2002. Callaway used aggressive accounting for that situation and in other in
other parts of accounting, such as using operating leases and the FIFO inventory
method. They use industry standard accounting practices by estimating based on
historical data and market fluctuations, depreciate assets using common life
spans, check for impairments periodically or when an event takes place, and
always disclose information in entirety. This part accounting shows some
conservatism in their financial statements. When they use aggressive accounting
in some practices, they fully explain their decision and why they choose it. This
gives them a fair position in the market place and also confidence with
stakeholders.
Quantitative and Qualitative Analysis
To fully assess whether or not Callaway distorts any of their accounting
numbers we have to take a look at the sporting goods industry as a whole. To
evaluate the degree of accounting in the industry we must run diagnostics ratios.
To do this we will combine ratios and fully complete a qualitative and
quantitative analysis of Callaway. Many companies decide to beef up their assets
by disclosing information on their financial statements. It has been known by
many corporations to manipulate their financials to beef up their sales and
reduce expenses to show a greater profit and revenue during a bad quarter or
year. So to understand if Callaway and the industry have done this we will run
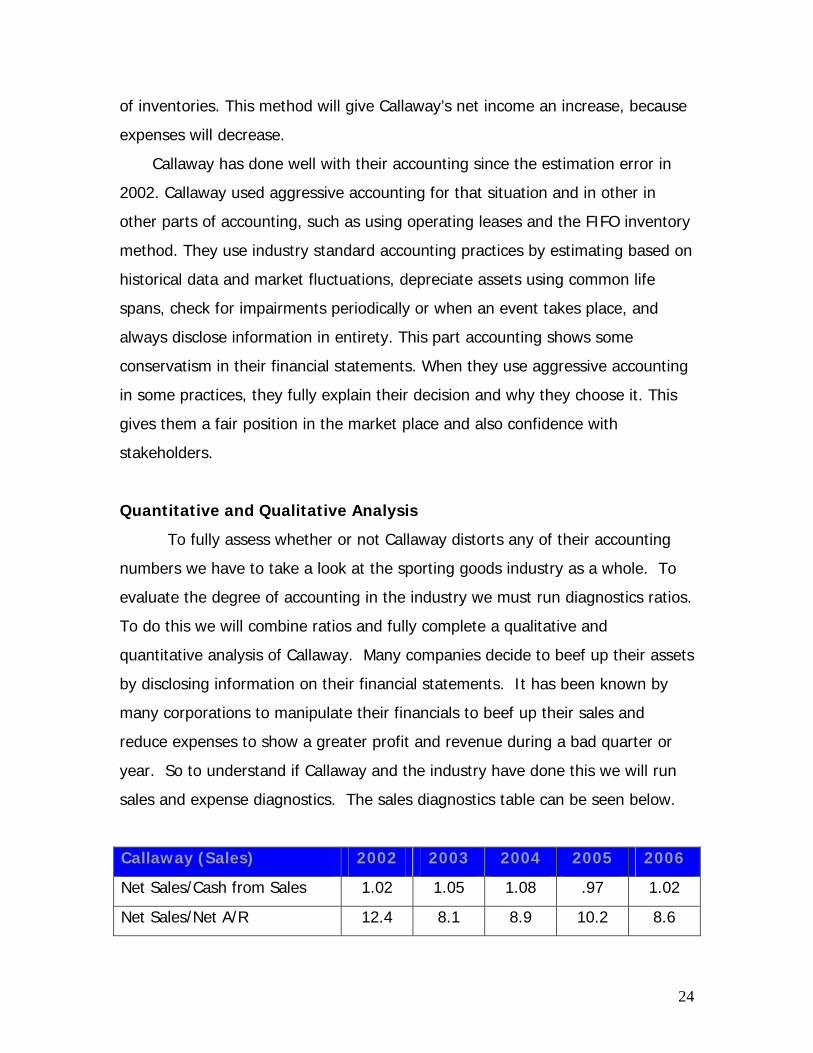
sales and expense diagnostics. The sales diagnostics table can be seen below.
Callaway (Sales) 2002 2003 2004 2005 2006
Net Sales/Cash from Sales 1.02 1.05 1.08 .97 1.02
Net Sales/Net A/R 12.4 8.1 8.9 10.2 8.6

25
Net Sales/Warranty Liabilities 58.9 74 77.6 75.2 76.2
Net Sales/Inventory 5.2 4.4 5.2 4.1 3.8
As the table shows, Callaway’s numbers tend to stay pretty much average
throughout the five years that we can see. This means that there are no
identifiable great favorable fluctuations which may indicate manipulation.
Net sales over cash from sales were most unfavorable in 2005 at 1.08.
This means that in 2004 Callaway was receiving less cash than for products sold,
however afterwards in 2005, the ratio dropped below one, which means that
Callaway rebounded and collected additional cash from the previous period.
With regards to sales divided by accounts receivable the numbers have
been pretty consistent around 9 with 12 in the earlier year. Net sales over net
accounts receivable, are very closely related to net sales over cash from sales.
These numbers can be expected to fluctuate in a related manner and have so in
our chart, which leads us to believe that manipulation is unlikely.
Warranty liabilities have remained about the same throughout the years
with 75. The only great variation was in 2002 with net sales over warrant
liabilities of 58.9. This change can largely be explained by Callaway’s large
change in warranty liabilities policy in 2002.
Lastly, Sales divided by inventory has been consistent around 4 to 5
showing they have kept sales constant leaving inventory low. This indicates that
Callaway has a mediocre ability to mange their inventory stocks.

26
Net Sales/Cash From Sales
0
0.2
0.4
0.6
0.8
1
1.2
1.4
2001 2002 2003 2004 2005 2006
CallawayAdams
As the graph above shows Callaway and one of its main publicly traded
competitors, Adams Golf, show a somewhat consistent net sale over cash from
sales. It would seem that the industry is performing rather consistently, however
overall, Callaway stays closer to 1 than Adams, who had a sharp increase in 2002
and 2005.
Net Sales/Accounts Receivable
0
2
4
6
8
10
12
14
16
18
2001 2002 2003 2004 2005 2006
Callaway GolfAdams Golf
Again, this graph shows that the golf industry is following the same trend
with this ratio, which would indicate that manipulation is unlikely. A higher net
sales over accounts receivable is favorable as it indicates a smaller amount of
receivables to sales, and a smaller risk of uncollectible accounts being written off.
27
In the golf industry, manufactures sell in bulk to distributors, so it is understood
why accounts receivables is so high in relations to sales. Callaway has
successfull7 outperformed Adams with this ratio after Adams took a sharp drop
in 2002. Ideally this ratio would be improved in the future through good
management of accounts receivables.
Net Sales/Warranty Liability
0
10
20
30
40
50
60
70
80
90
2002 2003 2004 2005 2006
Callaway Golf
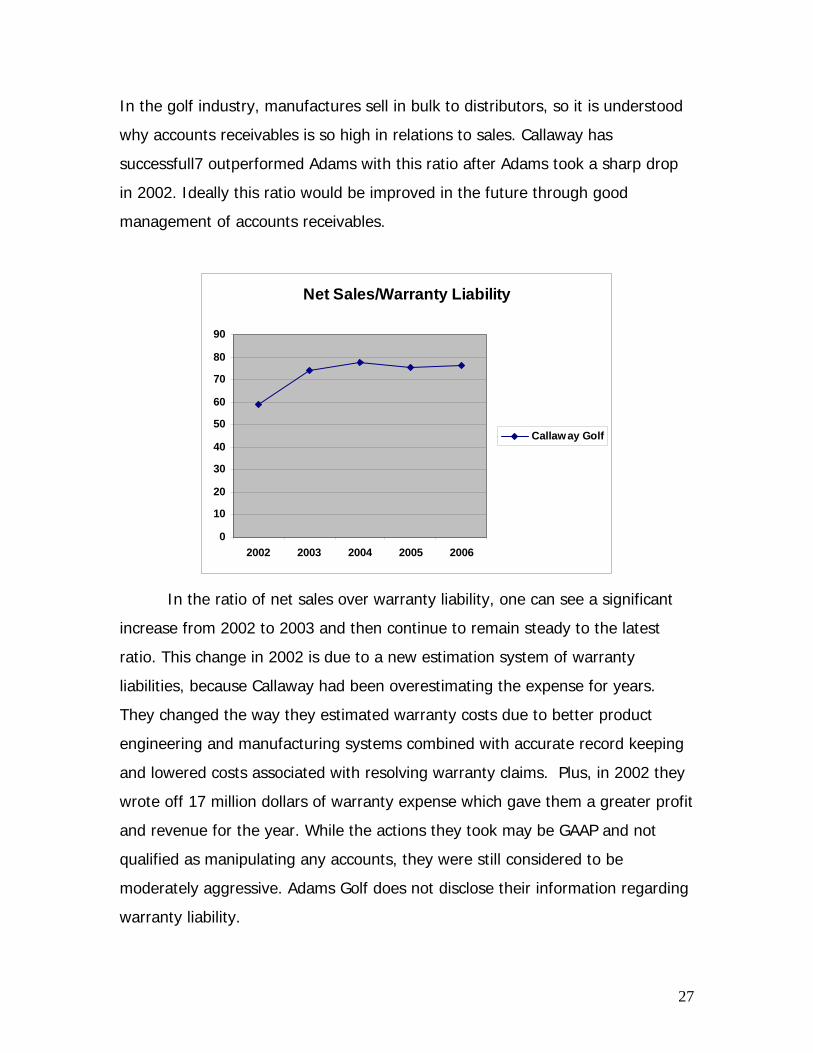
In the ratio of net sales over warranty liability, one can see a significant
increase from 2002 to 2003 and then continue to remain steady to the latest
ratio. This change in 2002 is due to a new estimation system of warranty
liabilities, because Callaway had been overestimating the expense for years.
They changed the way they estimated warranty costs due to better product
engineering and manufacturing systems combined with accurate record keeping
and lowered costs associated with resolving warranty claims. Plus, in 2002 they
wrote off 17 million dollars of warranty expense which gave them a greater profit
and revenue for the year. While the actions they took may be GAAP and not
qualified as manipulating any accounts, they were still considered to be
moderately aggressive. Adams Golf does not disclose their information regarding
warranty liability.
28
Net Sales/Inventory
0
1
2
3
4
5
6
7
2001 2002 2003 2004 2005 2006
Callaway GolfAdams Golf
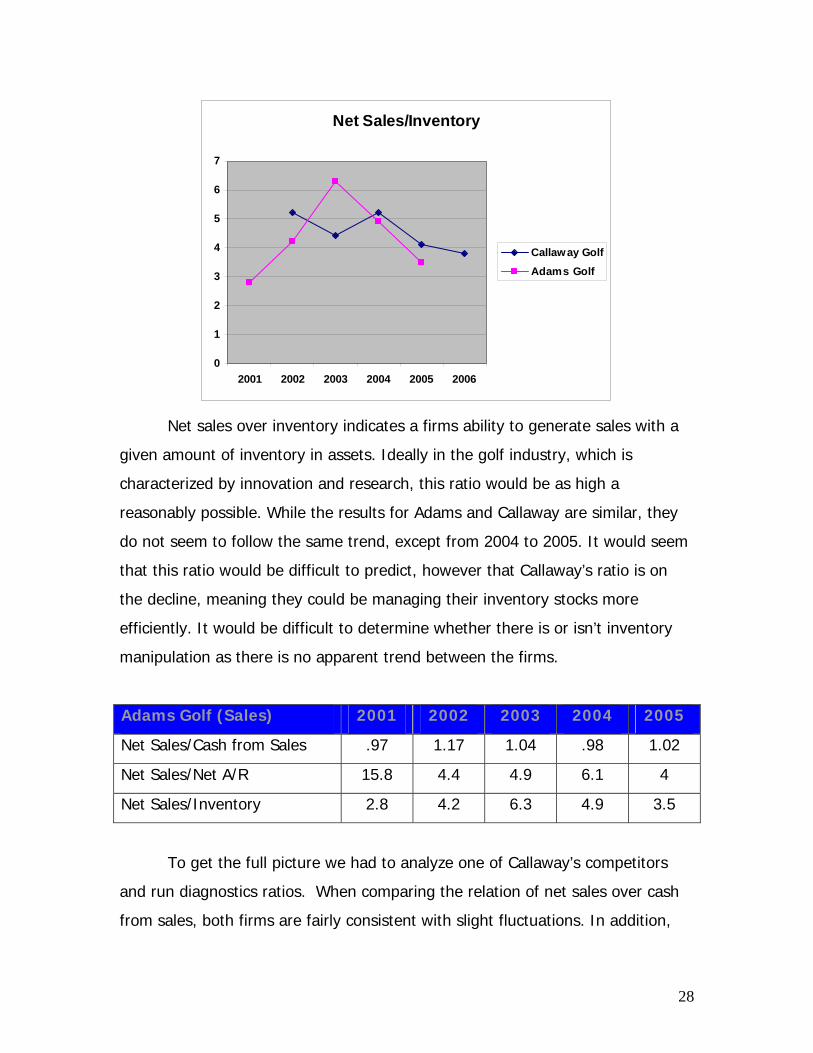
Net sales over inventory indicates a firms ability to generate sales with a
given amount of inventory in assets. Ideally in the golf industry, which is
characterized by innovation and research, this ratio would be as high a
reasonably possible. While the results for Adams and Callaway are similar, they
do not seem to follow the same trend, except from 2004 to 2005. It would seem
that this ratio would be difficult to predict, however that Callaway’s ratio is on
the decline, meaning they could be managing their inventory stocks more
efficiently. It would be difficult to determine whether there is or isn’t inventory
manipulation as there is no apparent trend between the firms.
Adams Golf (Sales) 2001 2002 2003 2004 2005
Net Sales/Cash from Sales .97 1.17 1.04 .98 1.02
Net Sales/Net A/R 15.8 4.4 4.9 6.1 4
Net Sales/Inventory 2.8 4.2 6.3 4.9 3.5
To get the full picture we had to analyze one of Callaway’s competitors
and run diagnostics ratios. When comparing the relation of net sales over cash
from sales, both firms are fairly consistent with slight fluctuations. In addition,

29
when you factor in net sales over net accounts receivables, both firms follow a
similar trend. When you combine these two ratios, we conclude that the two
firms have a relevant reflection of the current trends in the golf industry. This
leads us to believe that Callaway has not been manipulating their sales or
revenues diagnostics, as it does to stray too far away from the industry, however
it would seem that Callaway outperforms Adams Golf on these levels. Both firms
experienced a large amount of fluctuation with regards to their net sales over
inventory. This makes it difficult to set a standard for what the industry should
experience. Callaway’s change in this ratio has not been a favorable one, which
would lead us to believe that they have not been trying to distort their inventory
in order to obtain a better ratio.
Callaway (Expense) 2002 2003 2004 2005 2006
Asset Turnover 1.16 1.1 1.3 1.3 1.2
CFFO/OI 1.3 1.8 -0.3 4.1 0.5
Callaway’s asset turnover has remained fairly constant with the largest
shift between 2003 and 2004. This means Callaway’s assets have increased at
about the same rate that their sales have been increasing, although it appears
that assets are slowly increasing faster than sales. The golf industry is
characterized by a large amount of assets, and one can assume the larger the
firm, the lower this ratio would be. Thus we find the asset turnover ratio for
Callaway and Adams not to be surprising. Cash flows from operations over
operating income have fluctuated greatly. The largest shift occurs after 2003.
This can be explained by Callaway’s acquisition of Top-Flite golf. This caused
them to have a negative operating income for that period. If Adams Golf reflects
the golf industry it could be assumed that Callaway should rebound from the
costs of the acquisition with an increase in the ratio. However the sharp increase
in 2005 followed by a sharp decrease is questionable.

30
CFFO/OI
-1
-0.5
0
0.5
1
1.52
2.5
3
3.5
4
4.5
2001 2002 2003 2004 2005 2006
Callaway GolfAdams Golf
Asset Turnover
0
0.2
0.4
0.6
0.8
1
1.2
1.4
1.6
1.8
2001 2002 2003 2004 2005 2006
Callaway GolfAdams Golf
Adams Golf (Expense) 2001 2002 2003 2004 2005
Declining Asset Turnover 1.4 1.4 1.7 1.5 1.3
CFFO/OI 0.9 .4 2.2 2 3
31
As stated above, Adams and Callaway’s sales over asset ratio seems to be
converging to an industry standard which would not lead us to question the
numbers. With regards to cash flows from operations, the acquisition of Top-Flite
makes it difficult to explain the behavior of the ratio post year 2003. We can only
expect that operating income will increase for the following years. With this
being said we cannot explain the sharp rebound from the increase in 2005.
Potential Red Flags
During the course of our accounting analysis of Callaway Golf we did not
detect any potential Red Flags. Research & Development is expensed as incurred
allowing little flexibility, which minimizes concern. Their aggressive warranty
policy in past years has raised concern; however, they have explained the
reasons for their course of action and had proven to be the appropriate course of
action. Callaway uses the FIFO inventory method, which is commonly used and
accepted by GAAP. This leads us to believe that there has not been any
significant distortion concerning inventory. Callaway’s goodwill and intangibles
are adjusted annually to account for possible impairments; therefore, no red
flags are raised. After evaluating Callaway’s key accounting policies we feel there
are no potential threats in their financial statements.
Overall Conclusion
As we stated, there are no apparent red flags that would call for the need
to attempt to revise any of Callaway’s financial statements. Their most
aggressive actions taken over the past 5 years, was the alteration of the
warranty liabilities policy. It may be possible to go back and adjust Callaway’s
warranty liability to reflect how their financial statement would appear without
the alteration, however since it has occurred; the adjustment has been seen as
acceptable by shareholders and analysts alike. The transparency of Callaway’s
10-k can be seen as moderate. They do note a large amount of their key
32
accounting policies, as well as external threats. They did not note their warranty
liabilities policy change in their 10-k. All of the information found regarding this
was found in an article from “warranty week”. We have found no apparent
reasons to doubt the quality of the information disclosed in the financial
statements. Excluding cash flows from operations over operating income, there
were no major ratio fluctuations, that did not follow the industry, which may lead
us to suspect sales or expense manipulation.
Financial Analysis According to Palepu, Healy, and Bernard “the goal of financial analysis is
to use financial data to evaluate the current and past performance of a firm and
to assess its sustainability.” A financial analysis using a series of ratios and
forecasted financial statements are the methods used to bring meaning to
financial data.
Ratio Analysis and Forecasted Financials
Completing a company valuation report involves solving numerous
financial ratios and using forecasting methodology to see where the company
stands now and in the future. Financial ratios and forecasts are used to provide
managers with a company’s performance and planning measures as well. They
are also very useful for analysts in providing information to investors, bankers,
and debt collectors. Next, the ratios will help give a comparison within the
industry about how they match up to its competitors. Financial forecasting is the
next step after financial ratios which are estimates of how the company will
perform in the future. The methodology to completing this is by providing future
income statements, balance sheets, and statement of cash flows. While doing so
forecasts will be divided into liquidity, profitability, and capital structure analysis.
These three ratio sections will help us complete an industry comparison to
Callaway and see how they match up to the competition.

33
Ratio Analysis
In this section we will be performing analysis of the important ratios that
measure the liquidity, profitability, and the capital structure of Callaway and the
rest of the industry. The financial statement ratio analysis can provide valuable
information that can tell many things about a company. The first set of ratios we
will measure have to with liquidity; This will tell us the firm’s ability to meet its
cash obligations in a timely manner. Probability ratios will tell us the principle
objectives of profit, and capital structure ratios refer to the source of a
company’s financing. We will interpret these ratios and find their significance. In
addition growth rates for Callaway will be figured. We will perform a trend
analysis of Callaway and cross sectional analysis including both individual
competitors and the entire industry.
Trend (Time Series) Analysis
The first group of ratios we will be evaluating are liquidity ratios. These
ratios help to determine how easily a firm can convert its assets into cash, as
well as how a firm generates cash flows. These ratios are vital to determining a
firm’s ability to successfully complete the money marry-go-round. The first of
these ratios we will evaluate is the current ratio.
Current Ratio
2002 2003 2004 2005 2006
Callaway 3.38 2.95 3.26 3.13 2.21
The current ratio can literately be translated as a dollar amount of current
assets for every one dollar of current liabilities. At a glance, Callaway’s current
ratio has fluctuated, however it has been on an overall decline. A decline in
current ratio is beneficial to a company such as Callaway with a number around
3. This means that more assets are being utilized and invested rather than sitting
34
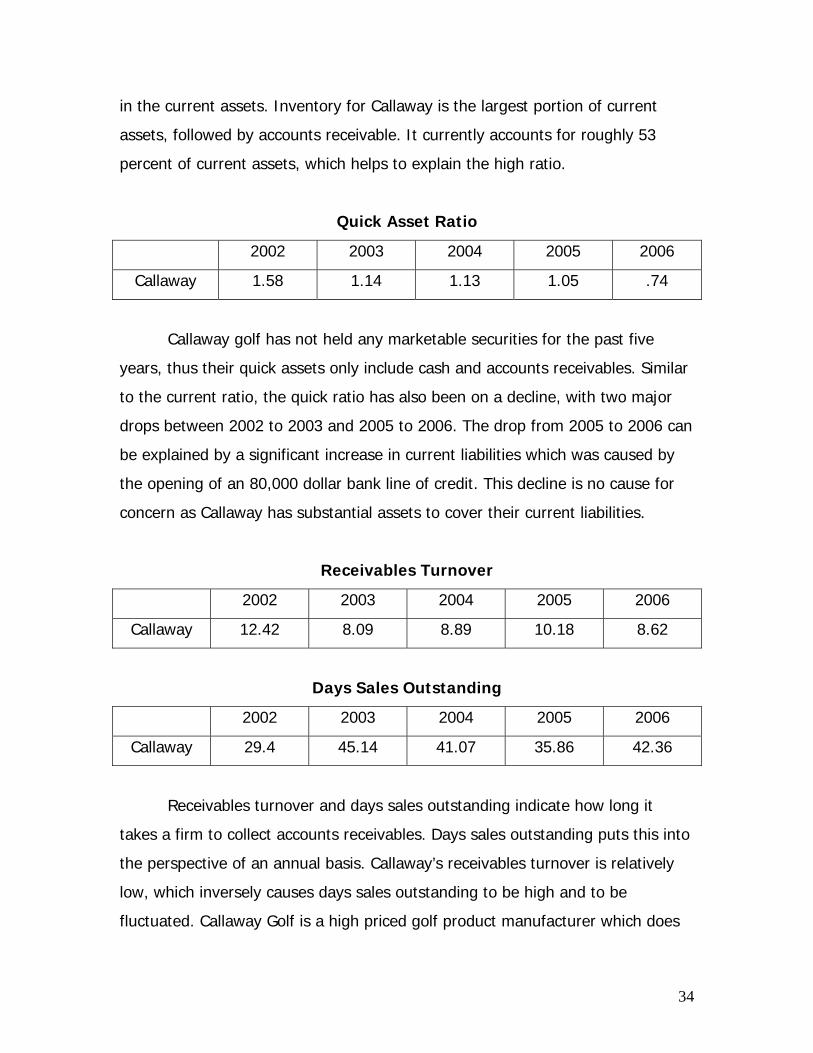
in the current assets. Inventory for Callaway is the largest portion of current
assets, followed by accounts receivable. It currently accounts for roughly 53
percent of current assets, which helps to explain the high ratio.
Quick Asset Ratio
2002 2003 2004 2005 2006
Callaway 1.58 1.14 1.13 1.05 .74
Callaway golf has not held any marketable securities for the past five
years, thus their quick assets only include cash and accounts receivables. Similar
to the current ratio, the quick ratio has also been on a decline, with two major
drops between 2002 to 2003 and 2005 to 2006. The drop from 2005 to 2006 can
be explained by a significant increase in current liabilities which was caused by
the opening of an 80,000 dollar bank line of credit. This decline is no cause for
concern as Callaway has substantial assets to cover their current liabilities.
Receivables Turnover
2002 2003 2004 2005 2006
Callaway 12.42 8.09 8.89 10.18 8.62
Days Sales Outstanding
2002 2003 2004 2005 2006
Callaway 29.4 45.14 41.07 35.86 42.36
Receivables turnover and days sales outstanding indicate how long it
takes a firm to collect accounts receivables. Days sales outstanding puts this into
the perspective of an annual basis. Callaway’s receivables turnover is relatively
low, which inversely causes days sales outstanding to be high and to be
fluctuated. Callaway Golf is a high priced golf product manufacturer which does

35
not distribute their product directly to the consumer. They distribute through golf
retailers and sporting goods retailers. These sales involve wholesales at a high
purchasing price. Therefore it is not surprising that Callaway’s days sales
outstanding for the past five years surpasses the time of a month, with 2002 as
the exception. Callaway’s ability to collect their accounts receivables depends on
their customer, which can help to explain the fluctuations across time. It is also
important to note, as with any large days sales outstanding, there is a higher risk
of incurring bad debts expenses.
Inventory Turnover
2002 2003 2004 2005 2006
Callaway 2.59 2.40 3.18 2.42 2.34
Days Supply of Inventory
2002 2003 2004 2005 2006
Callaway 140.93 151.96 114.92 151.08 156.11
The golf industry is a seasonal industry in which the manufacturing firms
produce a limited variety of products and a limited number of models, which are
constantly improved. This means that a majority of sales for a golf company are
in late spring and summer, while the rest of the season, in comparison, has
relatively less sales. In a company such as Callaway where inventory accounts
for roughly one third of assets, inventory turnover will be relatively low. In 2004
Callaway experienced a substantial increase in sales, thus cost of goods sold also
took a sharp rise which caused inventory to flow out from the company faster.
Afterwards cost of goods sold related to inventory leveled back out and resumed
the previous trend. Overall Callaway’s inventory turnover has taken a steady
decrease, which would suggest that Callaway is steadily producing more
inventory than they sell. This left over inventory becomes obsolete as new
models and golf products are produced.
36
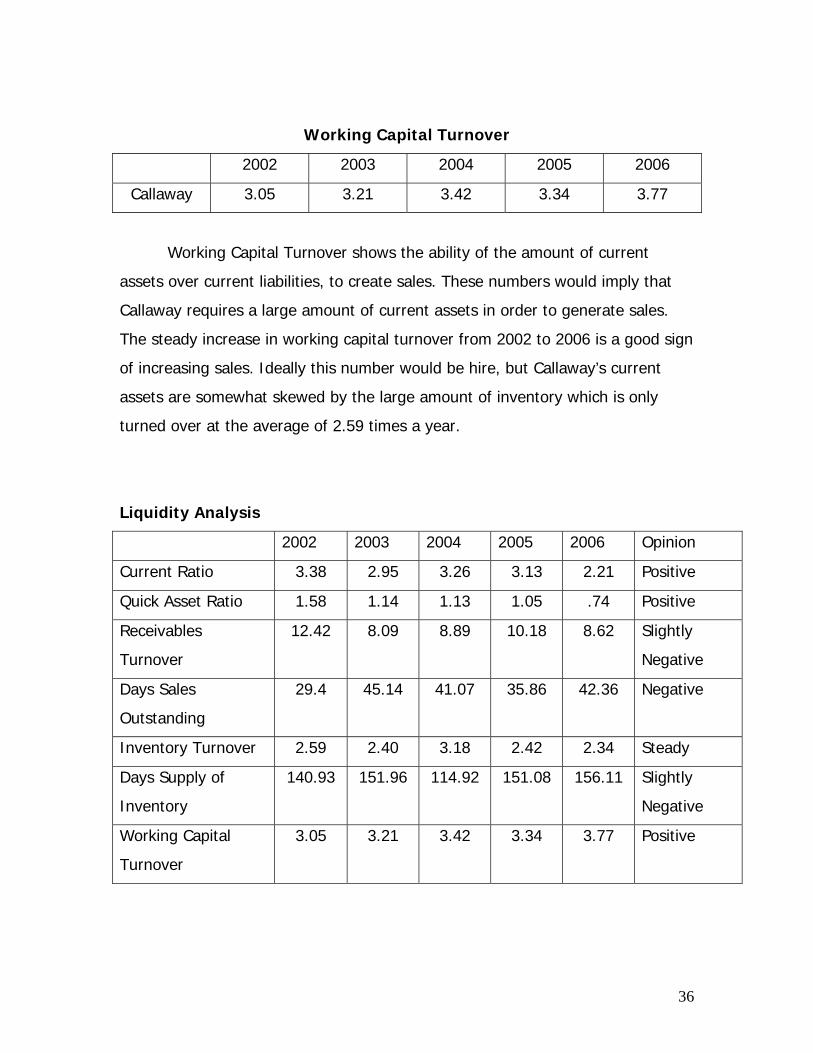
Working Capital Turnover
2002 2003 2004 2005 2006
Callaway 3.05 3.21 3.42 3.34 3.77
Working Capital Turnover shows the ability of the amount of current
assets over current liabilities, to create sales. These numbers would imply that
Callaway requires a large amount of current assets in order to generate sales.
The steady increase in working capital turnover from 2002 to 2006 is a good sign
of increasing sales. Ideally this number would be hire, but Callaway’s current
assets are somewhat skewed by the large amount of inventory which is only
turned over at the average of 2.59 times a year.
Liquidity Analysis
2002 2003 2004 2005 2006 Opinion
Current Ratio 3.38 2.95 3.26 3.13 2.21 Positive
Quick Asset Ratio 1.58 1.14 1.13 1.05 .74 Positive
Receivables
Turnover
12.42 8.09 8.89 10.18 8.62 Slightly
Negative
Days Sales
Outstanding
29.4 45.14 41.07 35.86 42.36 Negative
Inventory Turnover 2.59 2.40 3.18 2.42 2.34 Steady
Days Supply of
Inventory
140.93 151.96 114.92 151.08 156.11 Slightly
Negative
Working Capital
Turnover
3.05 3.21 3.42 3.34 3.77 Positive

37
Overall, management of current assets and liabilities has been efficiently
dealt with by Callaway; however, they must improve inventory management and
collection of receivables.
Profitability The Profitability Analysis of a company helps determine a company’s
ability to efficiently and effectively produce profits. The ratios below provide
insight into Callaway’s profitability starting with Gross Profit Margin.
Gross Profit Margin: Sales-COGS/Sales
2002 2003 2004 2005 2006
Callaway 50.45% 45.28% 38.4% 41.52% 39.12%
Gross profit of a company is determined by the difference between sales
and cost of goods sold. The gross profit margin ratio measures the percentage of
gross profit compared to sales. Callaway’s gross profit margin has remained fairly
steady over the past three years varying only three percentage points after their
margin was on a steady decline over 2002-2004 dropping over 12%. This steady
margin shows that Callaway has been able to maintain an increase in sales
consistent with an increase in COGS. Callaway understands the importance of
gross profit margin to their success, and in November 2006, the company began
the implementation of gross margin initiatives designed to positively impact gross
margins over the next two years according to their 2006 10-k.
Operating Profit Margin: Operating Income/Sales
2002 2003 2004 2005 2006
Callaway 17.55% 14.59% 0.89% 7.01% 1.70%
The operating profit margin relates the percentage of operating income to
one dollar of sales. The margin was on a decline leading into the net loss in
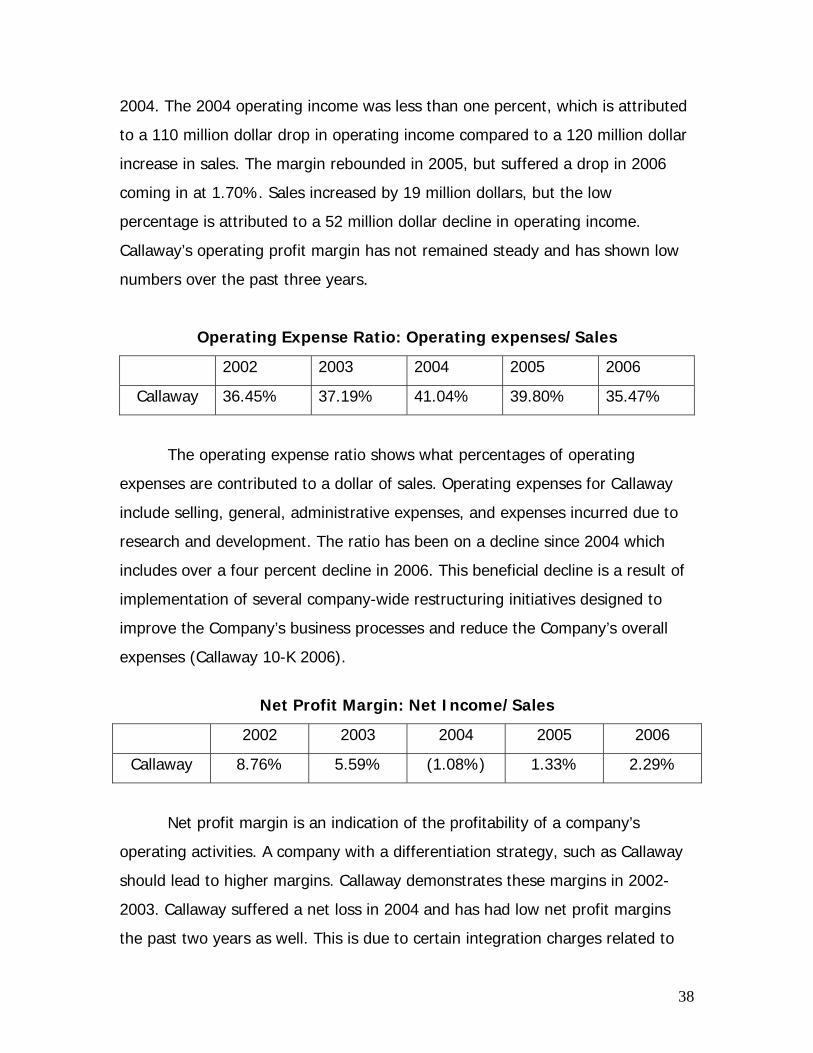
38
2004. The 2004 operating income was less than one percent, which is attributed
to a 110 million dollar drop in operating income compared to a 120 million dollar
increase in sales. The margin rebounded in 2005, but suffered a drop in 2006
coming in at 1.70%. Sales increased by 19 million dollars, but the low
percentage is attributed to a 52 million dollar decline in operating income.
Callaway’s operating profit margin has not remained steady and has shown low
numbers over the past three years.
Operating Expense Ratio: Operating expenses/Sales
2002 2003 2004 2005 2006
Callaway 36.45% 37.19% 41.04% 39.80% 35.47%
The operating expense ratio shows what percentages of operating
expenses are contributed to a dollar of sales. Operating expenses for Callaway
include selling, general, administrative expenses, and expenses incurred due to
research and development. The ratio has been on a decline since 2004 which
includes over a four percent decline in 2006. This beneficial decline is a result of
implementation of several company-wide restructuring initiatives designed to
improve the Company’s business processes and reduce the Company’s overall
expenses (Callaway 10-K 2006).
Net Profit Margin: Net Income/Sales
2002 2003 2004 2005 2006
Callaway 8.76% 5.59% (1.08%) 1.33% 2.29%
Net profit margin is an indication of the profitability of a company’s
operating activities. A company with a differentiation strategy, such as Callaway
should lead to higher margins. Callaway demonstrates these margins in 2002-
2003. Callaway suffered a net loss in 2004 and has had low net profit margins
the past two years as well. This is due to certain integration charges related to

39
the acquisition of Top-Flite in late 2003. Callaway’s net profit margin should
continue to gradually increase as the payments of these charges are completed.
Asset Turnover: Sales/Total Assets
2002 2003 2004 2005 2006
Callaway 1.17 1.09 1.27 1.31 1.20
The revenue productivity of a company’s total assets is measured by the
asset turnover ratio. This ratio represents the amount of sales attributed to a
dollar of assets. Callaway’s ratio has remained fairly stable throughout the five
year period maintaining a ratio between 1.09 and 1.31. These numbers could be
improved, and could be the result of Callaway having large amounts of money
tied up in assets.
Return on Assets: Net Income/Total Assets
2002 2003 2004 2005 2006
Callaway 10.22% 6.08% (1.37%) 1.74% 2.75%
The return on assets ratio provides insight into how much net income a
company can produce for each dollar of assets. Callaway’s ROA took a hit in
2004 and has continued through 2006. As mentioned earlier the integration
charges from the Top-Flite acquisition led to a loss in 2004 and low levels of net
income in 2005 and 2006. Their ROA is improving as the company emerges from
these charges. Their net income has gone from a 10 million dollar loss to a 13
million dollar gain to 23 million in 2006.

40
Return on Equity: Net Income/Equity
2002 2003 2004 2005 2006
Callaway 12.78% 7.72% (1.72%) 2.23% 4.04%
The return on equity of a company represents the percentage of equity
they return in the form of net income. Much like the net profit margin and ROA,
Callaway’s ROE has been influenced by the cost of acquisitions. Their ROE has
increased steadily over the past three years and will continue to improve as they
emerge from the costs of those acquisitions. Their ratios before their net loss
provides a measure of the company’s potential and where they hope to return.
Profitability Analysis
2002 2003 2004 2005 2006 Opinion
Gross Profit Margin 50.45% 45.28% 38.40% 41.52% 39.12% Negative
Operating Income
Margin
17.55% 14.59% 0.89% 7.01% 1.70% Negative
Operating Expense
Ratio
36.45% 37.19% 41.04% 39.80% 35.47% Positive
Net Profit Margin 8.76% 5.59% (1.08%) 1.33% 2.29% Positive
Asset Turnover 1.17 1.09 1.27 1.31 1.20 Slightly Positive
Return on Assets 10.22% 6.08% (1.37%) 1.74% 2.75% Slightly Positive
Return on Equity 12.78% 7.72% (1.72%) 2.23% 4.04% Slightly Positive
The major variable that has caused change in these ratios was the
acquisition of Top-Flite. This is represented by the declining gross profit margin
and operating income margin and the negative returns on assets and equity in
2004. Callaway’s net profit margin, return on assets, and return on equity can be
expected to increase in the future. Return on equity can be expected to most
likely cap off at around 15% several years down the road.

41
Capital Structure
A Company can be financed through internal or external resources. A
company that grows with internal financing uses their own retained earnings to
finance ongoing operations or new operations. These earnings are generated
from the company’s operations and then used by the company. A company that
uses external resources can have two different types of financing. Debt financing
and equity financing are two ways a company may obtain cash to finance its
operations. Debt financing means a company may issue bonds or take out a loan
from a bank in order to get cash now to pay back later. This debt is recorded in
the company’s liabilities on the balance sheet. The first measure of capital
structure we will analyze is the debt to equity ratio. This ratio shows their debt
financing to their equity financing.
Debt to Equity Ratio
2002 2003 2004 2005 2006
Callaway .2 .27 .25 .28 .47
When looking at Callaway’s debt to equity ratio, we find it has been
increasing over the past five years. Their ratio is still relatively small, which
means the amount of equity they use to finance their operations exceeds their
debt financing. Callaway averages about a .29 debt to equity ratio, which tells us
that for every dollar of existing equity they have only $.29 of liability financing.
The ratio has been increasing and this means Callaway has been increasing their
liabilities when compared to the company’s equity. Callaway uses more equity to
finance their operations than debt.
Times interest earned is a measure to see if the company has earned
enough to repay its interest on borrowed money. To find times interest earned,
the operating income is divided by the interest expense. Callaway’s times interest
earned has fluctuated over the past five years.

42
Times Interest Earned
2002 2003 2004 2005 2006
Callaway 66.31 49.81 -26.14 7.55 6.84
The interest expense has remained relatively stable, but the operating
income started to dive in 2003 and in 2004. In 2004 Callaway’s operating income
was negative which came up with a negative times interest earned, showing that
they could not pay their interest expense. Times interest earned steadied in 2005
and stayed close in 2006. They can now guarantee their interest payments after
the decline in 2004.
The debt service margin measures the company’s ability to make
payments on debt. The ratio is found by dividing the cash flow from operations
by the notes payable liability. Callaway has no disclosure of notes payables and
therefore we substituted accounts payable, the difference being a more
commonly known short-term liability rather than the long-term liability of notes
payable. Regardless, it still shows the ability to pay off debt.
Debt Service Margin*
2002 2003 2004 2005 2006
Callaway 2.25 1.49 .11 .69 .15
• Accounts Payable substituted for Notes Payable
Callaway’s debt service margin declined in 2004 due to a dramatic fall in
cash from operations. After 2003 the numbers of the ratios are telling us that for
every dollar owed in accounts payable Callaway would not be able to pay it back
using the cash from operations.

43
Capital Structure Analysis
2002 2003 2004 2005 2006 Opinion
Debt to Equity Ratio .2 .27 .25 .28 .47 Slightly
Unfavorable
Times Interest
Earned
66.31 49.81 -26.14 7.55 6.84 Unfavorable
Debt Service Margin 2.25 1.49 .11 .69 .15 Unfavorable
The fact that debt financing is growing at a faster rate than equity, is
unfavorable. Additionally a declining times interest earned while debt to equity is
increasing, is a bad combination.
Sustainable Growth Rate
2002 2003 2004 2005 2006
Callaway .33% 1.06% 4.27% 3.25% 7.09%
As the graph above shows the sustainable growth rate for Callaway that
company has been increasing from year to year due to the fact that the golf
industry is seeing more and more competition so Callaway has been improving in
business. We project that the company will keep increasing in the future. So
after attaining information about the company’s growth rate we can solidly show
that it will be easy to predict the company’s future forecasts. Callaway started
its years off really slowly in 2002 because of economic reasons then again from
2004 to 2005 the company had a negative net income which dropped the growth
rate of the firm. We can get a better look at the firm by showing the company’s
internal growth rate then compared to Callaway’s competitors in cross sectional
analysis.
44
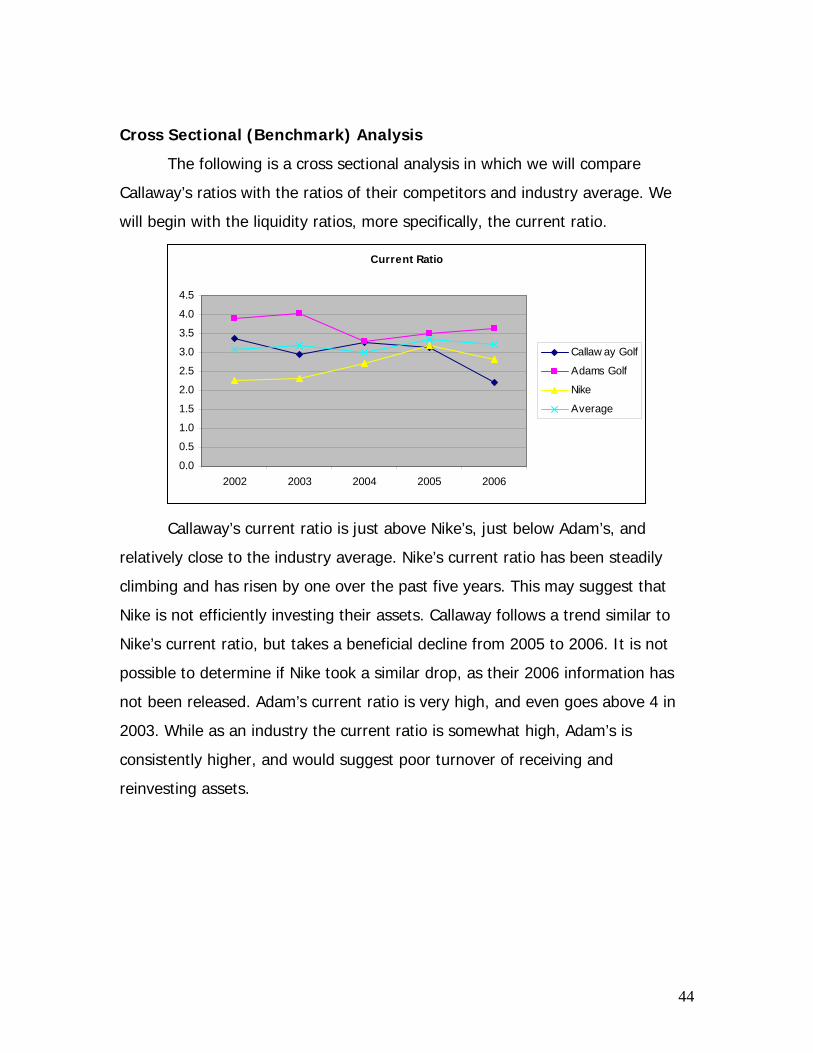
Cross Sectional (Benchmark) Analysis
The following is a cross sectional analysis in which we will compare
Callaway’s ratios with the ratios of their competitors and industry average. We
will begin with the liquidity ratios, more specifically, the current ratio.
Current Ratio
0.0
0.5
1.0
1.5
2.0
2.5
3.0
3.5
4.0
4.5
2002 2003 2004 2005 2006
Callaw ay Golf
Adams Golf
Nike
Average
Callaway’s current ratio is just above Nike’s, just below Adam’s, and
relatively close to the industry average. Nike’s current ratio has been steadily
climbing and has risen by one over the past five years. This may suggest that
Nike is not efficiently investing their assets. Callaway follows a trend similar to
Nike’s current ratio, but takes a beneficial decline from 2005 to 2006. It is not
possible to determine if Nike took a similar drop, as their 2006 information has
not been released. Adam’s current ratio is very high, and even goes above 4 in
2003. While as an industry the current ratio is somewhat high, Adam’s is
consistently higher, and would suggest poor turnover of receiving and
reinvesting assets.

45
Quick Asset Ratio
0.00
0.50
1.00
1.50
2.00
2.50
3.00
2002 2003 2004 2005 2006
Callaway GolfAdams GolfNikeAverage
Again, as an industry, the quick asset ratio is relatively high. While Nike is
on a steady rise that mirrors their current ratio, Callaway and Adams both
experience a decline. Callaway’s Decline is a result of increased liabilities. Nike’s
liabilities have also been increasing consistently, however they have also
increased their assets at a higher rate. Both assets and liabilities have increased
for Adams, liabilities are just increasing at a higher rate. In the past Callaway has
had a sufficient amount of quick assets to cover for their liabilities, however if
their quick asset ratio continues to decline at the current rate, they may not be
able to account for their liabilities.
Accounts Recievable Turnover
0.00
2.00
4.00
6.00
8.00
10.00
12.00
14.00
2002 2003 2004 2005 2006
Callaway GolfAdams GolfNikeAverage
46
With regards to accounts receivable turnover, Callaway differs greatly
from their industry and fluctuates at a much larger rate than their competitors.
This means Callaway is greater at collecting their accounts receivable than their
competitors. This is a beneficial factor as it decreases the chance of uncollectible
debt expenses. While the industry tends to remain steady, Callaway has
experienced a large amount of fluctuation the past five years, mainly due to a
sharp drop since 2002. This decrease was due to a large increase in accounts
receivable. Callaway’s ability to stay substantially above their industry’s average
suggests superior management of accounts with their retailers.
Days Supply of Recievables
0
20
40
60
80
100
2002 2003 2004 2005 2006
Callaway GolfAdams GolfNikeAverage
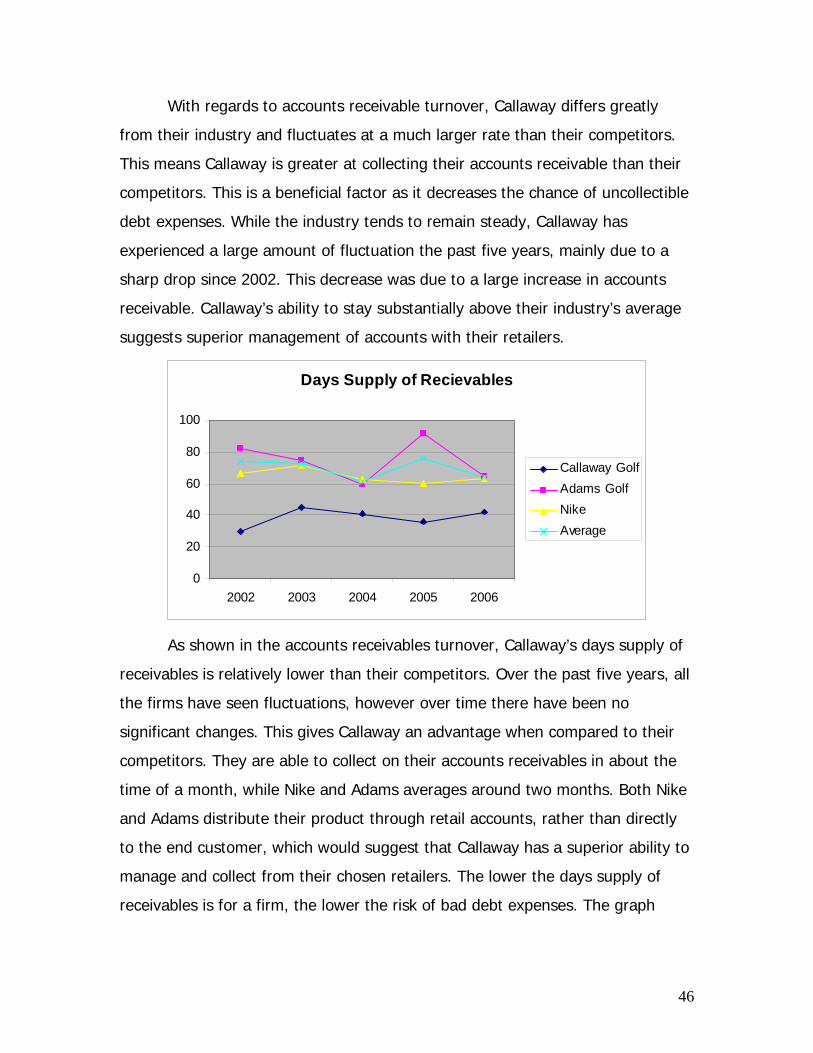
As shown in the accounts receivables turnover, Callaway’s days supply of
receivables is relatively lower than their competitors. Over the past five years, all
the firms have seen fluctuations, however over time there have been no
significant changes. This gives Callaway an advantage when compared to their
competitors. They are able to collect on their accounts receivables in about the
time of a month, while Nike and Adams averages around two months. Both Nike
and Adams distribute their product through retail accounts, rather than directly
to the end customer, which would suggest that Callaway has a superior ability to
manage and collect from their chosen retailers. The lower the days supply of
receivables is for a firm, the lower the risk of bad debt expenses. The graph

47
above shows that Callaway risk of bad debt expenses is relatively lower than
their competitors if you rely on the days supply of receivables.
Inventory Turnover
0
1
2
3
4
5
2002 2003 2004 2005 2006
Callaway GolfAdams GolfNikeAverage
While Nike has a consistent inventory turnover, Callaway and Adams have
fluctuated, and have currently been following the same trend since 2004. Nike
has been successful in maintaining a superior inventory turnover relevant to their
industry, while both Callaway and Adams fall below the average. Since 2004
Callaway has been able to stay above Adams golf, but a declining turnover of
inventory is still not beneficial. The reason for this decrease is a larger increase
in inventory relative to cost of goods sold. A large amount of sitting inventory
could be hazardous for a company in the golf industry which is characterized by
innovation and research and development. Callaway’s increase in turnover from
2003 to 2005 was brought on by a brief decrease in inventory followed by an
increase that put Callaway back to its previous trend. Excluding that change,
Callaway’s inventory turnover has stayed near 2.5.

48
Days Supply of Inventory
0.00
50.00
100.00
150.00
200.00
250.00
2002 2003 2004 2005 2006
Callaway GolfAdams GolfNikeAverage
Again, Nike has experienced a steady days supply of inventory as a result
of their inventory turnover. Days supply of inventory can be translated as the
number of days it takes a firm to expel current inventory and have new inventory
on hand. In the golf industry a lower days supply of inventory is favorable, but
the seasonality of the business makes it difficult. With the majority of inventory
being sold in the late spring and early summer, this leaves roughly three quarters
of the year when sales are in a “down time”. Callaway does almost directly flow
with the industry average, and also goes along the same pattern as Adams in
2004. Nike would have a lower days supply of inventory as they also deal with
less seasonal products as well as golf and apparel products.

49
Working Capital Turnover
00.5
11.5
22.5
33.5
44.5
2002 2003 2004 2005 2006
Callaway GolfAdams GolfNikeAverage
Working capital turnover measures productivity in a company as it
evaluates how much sales is generated based on the difference between current
assets and current liabilities. A higher working capital turnover indicates that a
firm experiences high sales while only needing a limited amount of working
capital. Callaway and Nike have the higher working capital turnover while Adams
fluctuates between 2 and 2.5. In 2002 Callaway hovered around the industry
average until recent years where they have grown to be higher than Nike as
Nike’s working capital turnover declined. This illustrates a steady growth in sales
related to the needed amount of current assets over current liabilities. It should
also be noted that the industry average has been on a decline while Callaway
has increased, thus Callaway has been outperforming their industry with regards
to working capital turnover.
Overall, Callaway’s liquidity is declining while the industry average is not
changing. This indicated that management has been investing more assets than
they had previously. But this may also indicate a growing amount of liabilities. At
current times, Callaway would be able to cover growing liabilities, but not
indefinitely.
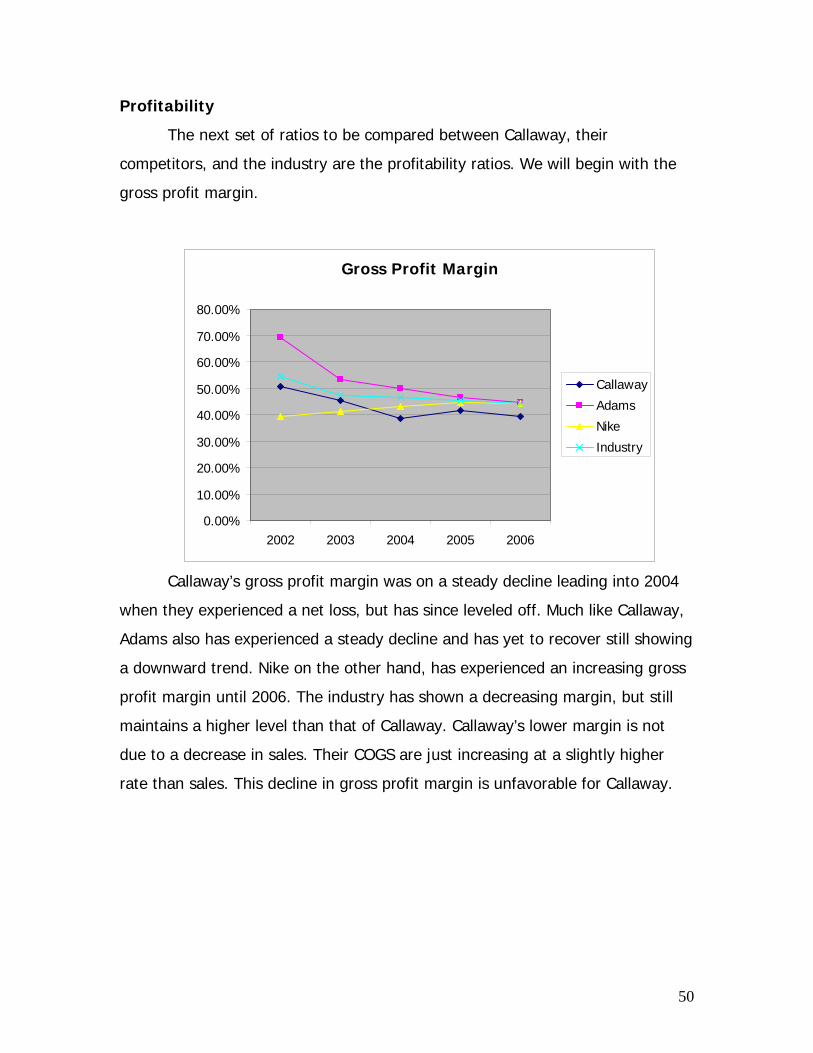
50
Profitability
The next set of ratios to be compared between Callaway, their
competitors, and the industry are the profitability ratios. We will begin with the
gross profit margin.
Callaway’s gross profit margin was on a steady decline leading into 2004
when they experienced a net loss, but has since leveled off. Much like Callaway,
Adams also has experienced a steady decline and has yet to recover still showing
a downward trend. Nike on the other hand, has experienced an increasing gross
profit margin until 2006. The industry has shown a decreasing margin, but still
maintains a higher level than that of Callaway. Callaway’s lower margin is not
due to a decrease in sales. Their COGS are just increasing at a slightly higher
rate than sales. This decline in gross profit margin is unfavorable for Callaway.
Gross Profit Margin
0.00%
10.00%
20.00%
30.00%
40.00%
50.00%
60.00%
70.00%
80.00%
2002 2003 2004 2005 2006
Callaway
Adams
Nike
Industry

51
Operating Profit Margin
-30.00%
-25.00%
-20.00%
-15.00%
-10.00%
-5.00%
0.00%
5.00%
10.00%
15.00%
20.00%
2002 2003 2004 2005 2006
Years
Per
cent
ages Callaway
AdamsNike Industry
The operating profit margin for Callaway has not remained steady over
the past five years; however, the margins for Nike and Adams have since 2003.
Adam’s suffered a loss in 2002 and have been able to maintain a steady margin
between 3.62% and 5.46% the past four years. Unlike Adam’s, Callaway’s
margin has not remained steady since their 2004 loss with the past margins
being 7.01% and 1.70%. This unsteady trend and the low margin in 2006 is an
unfavorable sign for Callaway.
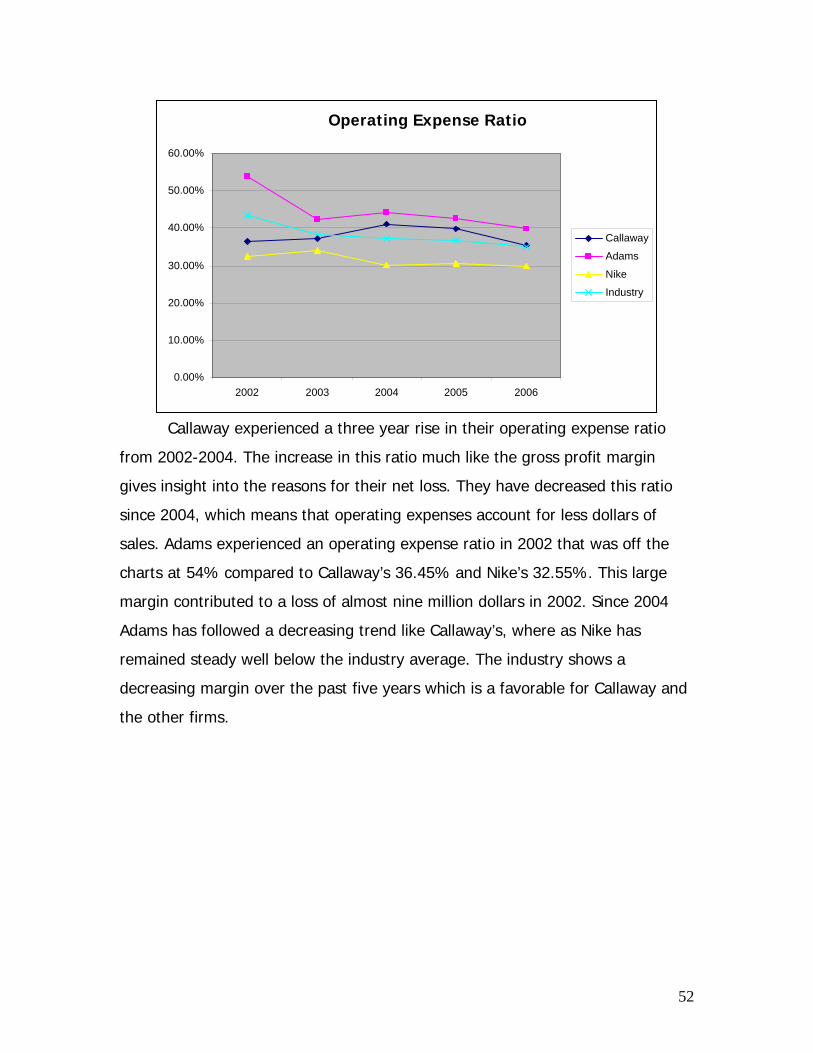
52
Callaway experienced a three year rise in their operating expense ratio
from 2002-2004. The increase in this ratio much like the gross profit margin
gives insight into the reasons for their net loss. They have decreased this ratio
since 2004, which means that operating expenses account for less dollars of
sales. Adams experienced an operating expense ratio in 2002 that was off the
charts at 54% compared to Callaway’s 36.45% and Nike’s 32.55%. This large
margin contributed to a loss of almost nine million dollars in 2002. Since 2004
Adams has followed a decreasing trend like Callaway’s, where as Nike has
remained steady well below the industry average. The industry shows a
decreasing margin over the past five years which is a favorable for Callaway and
the other firms.
Operating Expense Ratio
0.00%
10.00%
20.00%
30.00%
40.00%
50.00%
60.00%
2002 2003 2004 2005 2006
Callaway Adams
Nike
Industry
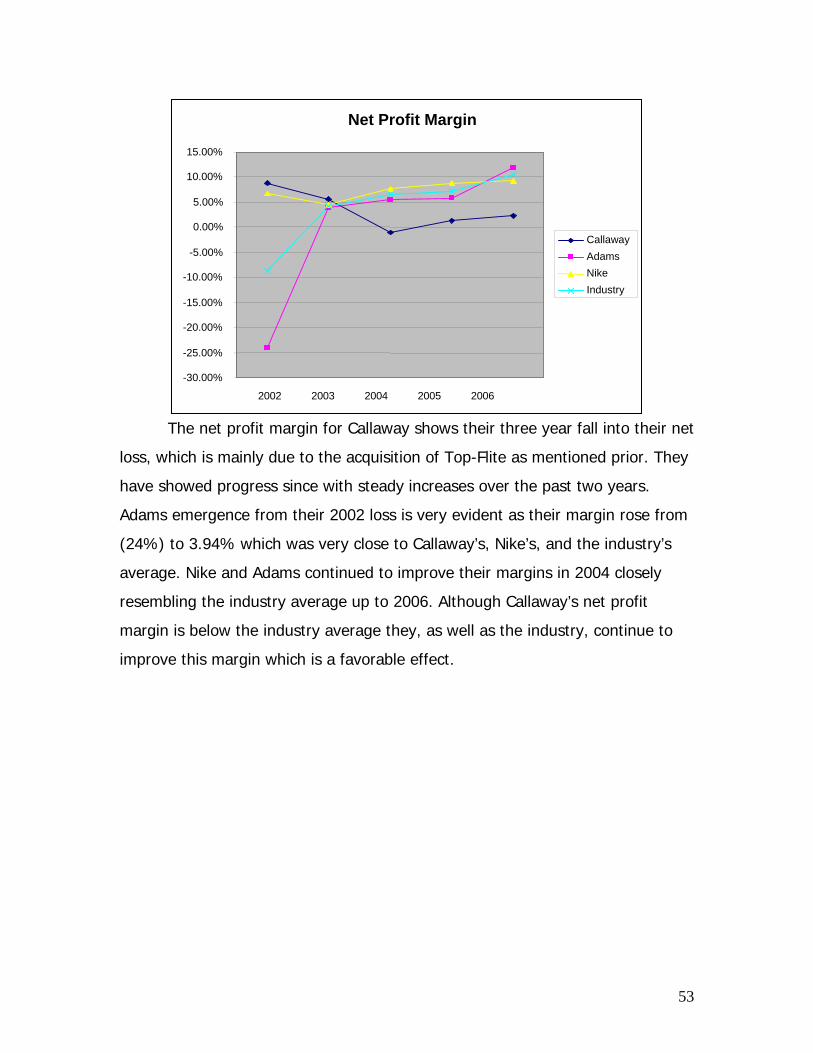
53
The net profit margin for Callaway shows their three year fall into their net
loss, which is mainly due to the acquisition of Top-Flite as mentioned prior. They
have showed progress since with steady increases over the past two years.
Adams emergence from their 2002 loss is very evident as their margin rose from
(24%) to 3.94% which was very close to Callaway’s, Nike’s, and the industry’s
average. Nike and Adams continued to improve their margins in 2004 closely
resembling the industry average up to 2006. Although Callaway’s net profit
margin is below the industry average they, as well as the industry, continue to
improve this margin which is a favorable effect.
Net Profit Margin
-30.00% -25.00% -20.00% -15.00% -10.00%
-5.00% 0.00% 5.00%
10.00% 15.00%
2002 2003 2004 2005 2006
Callaway AdamsNike Industry

54
The asset turnover ratio is a measure of the effectiveness of a company’s
assets generating sales. The asset turnover for Callaway has been below the
industry average each year of the past five, and only surpassed Adams slightly in
2005. Their ratio grew from 2003 to 2005, but fell slightly this past year. Adams
ratio is a complete contrast to that of Callaway as their ratio increased when
Callaway’s decreased and vice versa. Nike has remained steady and close to the
industry average. Callaway’s asset turnover decline in 2006 along with its
consistency below the industry average are unfavorable factors affecting this
company.
Asset Turnover
0
0.2 0.4 0.6 0.8
1
1.2 1.4 1.6 1.8
2002 2003 2004 2005 2006
Callaway AdamsNike Industry
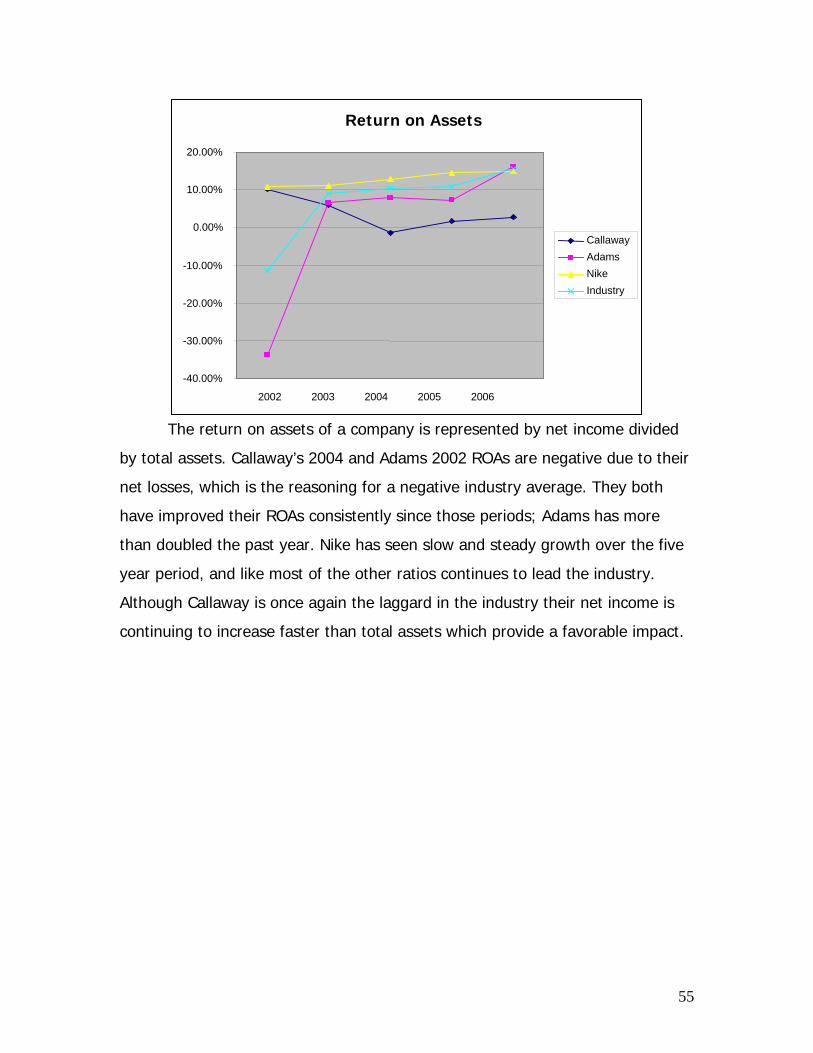
55
The return on assets of a company is represented by net income divided
by total assets. Callaway’s 2004 and Adams 2002 ROAs are negative due to their
net losses, which is the reasoning for a negative industry average. They both
have improved their ROAs consistently since those periods; Adams has more
than doubled the past year. Nike has seen slow and steady growth over the five
year period, and like most of the other ratios continues to lead the industry.
Although Callaway is once again the laggard in the industry their net income is
continuing to increase faster than total assets which provide a favorable impact.
Return on Assets
-40.00%
-30.00%
-20.00%
-10.00%
0.00%
10.00%
20.00%
2002 2003 2004 2005 2006
Callaway AdamsNike Industry

56
The Return on Equity ratio demonstrates a company’s ability to generate
net income through their equity, and as in the previous charts the industry is led
by Nike with improvements from Callaway and Adams since the effect of their
net losses. Although the ratios for Callaway tend to be below the industry
average they have not seen a decrease in sales in the past five years, which
demonstrates their potential to continually increase their profitability in the
future.
Capital Structure
The capital structure ratios, the last set of ratios, will now be presented
containing information regarding the debt to equity, times interest earned, and
the debt service margin ratios.
Return on Equity
-50.00%
-40.00%
-30.00%
-20.00%
-10.00%
0.00%
10.00%
20.00%
30.00%
2002 2003 2004 2005 2006
Callaway AdamsNike Industry

57
Debt to Equity Ratio
0
0.1
0.2
0.3
0.4
0.5
0.6
0.7
0.8
2002 2003 2004 2005 2006
CallawayAdams GolfNikeIndustry Average
Callaway has the lowest debt to equity ratio out of their competitors and
the industry. This means they finance their operations and growth with more
equity, such as stocks and bonds. Nike, on the other hand, seems to finance a
larger percentage of their operations and growth with debt, compared to the rest
of the industry. Adams Golf has stayed at a relatively stable rate and is close to
the industry mean. These different debt to equity ratios for each company can
affect interest rates the companies get on borrowing money. Callaway seems to
be in pretty good shape compared to the rest of the market and can borrow on a
low interest rate based on their debt to equity ratio.

58
Times Interest Earned
-200
0
200
400
600
800
1000
1200
1400
2002 2003 2004 2005 2006
CallawayAdams GolfNikeIndustry Average
Adam’s Golf has out performed Callaway and the industry in terms of
repaying interest debt. Their interest expense in 2006 was low and their
operating income was the highest since 2002, exceeding the industry’s times
interest earned average by a huge amount. Nike ended up at 2006 with a
negative figure showing they did not have the ability to pay their debt in 2006.
Callaway is not far from Nike and both companies may have over leveraged,
showing two low figures compared to the industry.
Debt Service Margin
-2
0
2
4
6
8
10
12
2002 2003 2004 2005 2006
CallawayAdams GolfNikeIndustry Average
*Accounts payable substituted for notes payable
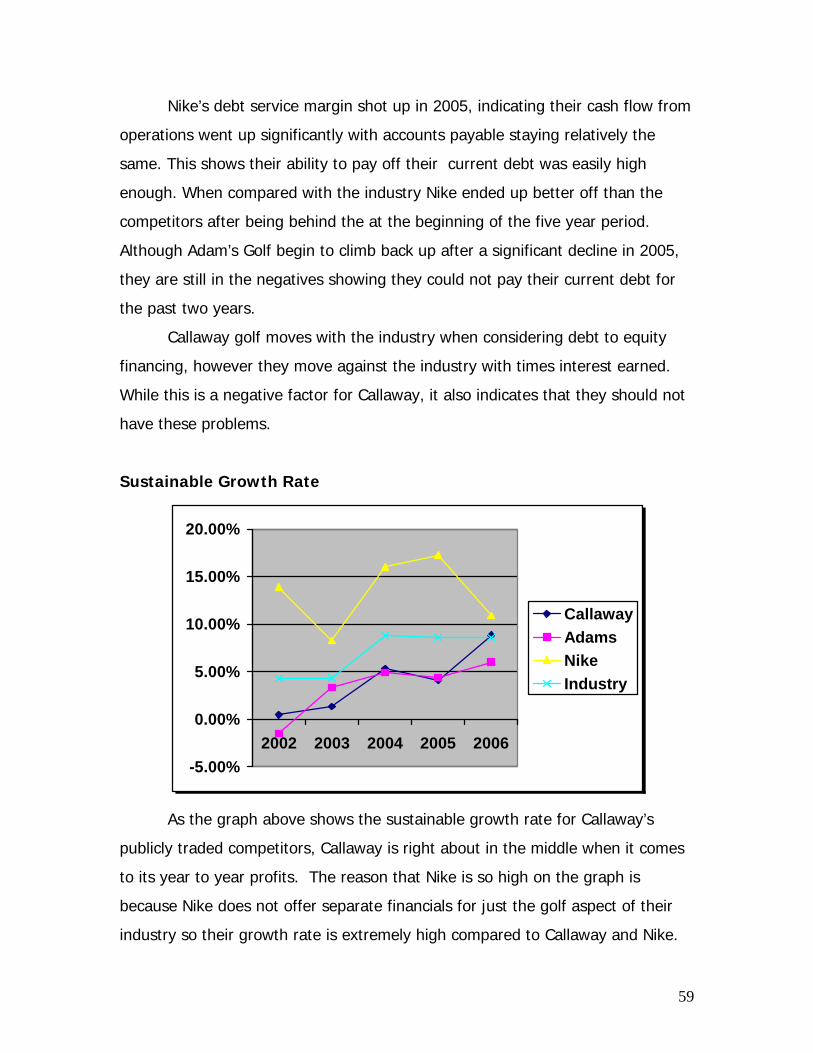
59
Nike’s debt service margin shot up in 2005, indicating their cash flow from
operations went up significantly with accounts payable staying relatively the
same. This shows their ability to pay off their current debt was easily high
enough. When compared with the industry Nike ended up better off than the
competitors after being behind the at the beginning of the five year period.
Although Adam’s Golf begin to climb back up after a significant decline in 2005,
they are still in the negatives showing they could not pay their current debt for
the past two years.
Callaway golf moves with the industry when considering debt to equity
financing, however they move against the industry with times interest earned.
While this is a negative factor for Callaway, it also indicates that they should not
have these problems.
Sustainable Growth Rate
-5.00%
0.00%
5.00%
10.00%
15.00%
20.00%
2002 2003 2004 2005 2006
CallawayAdamsNikeIndustry
As the graph above shows the sustainable growth rate for Callaway’s
publicly traded competitors, Callaway is right about in the middle when it comes
to its year to year profits. The reason that Nike is so high on the graph is
because Nike does not offer separate financials for just the golf aspect of their
industry so their growth rate is extremely high compared to Callaway and Nike.
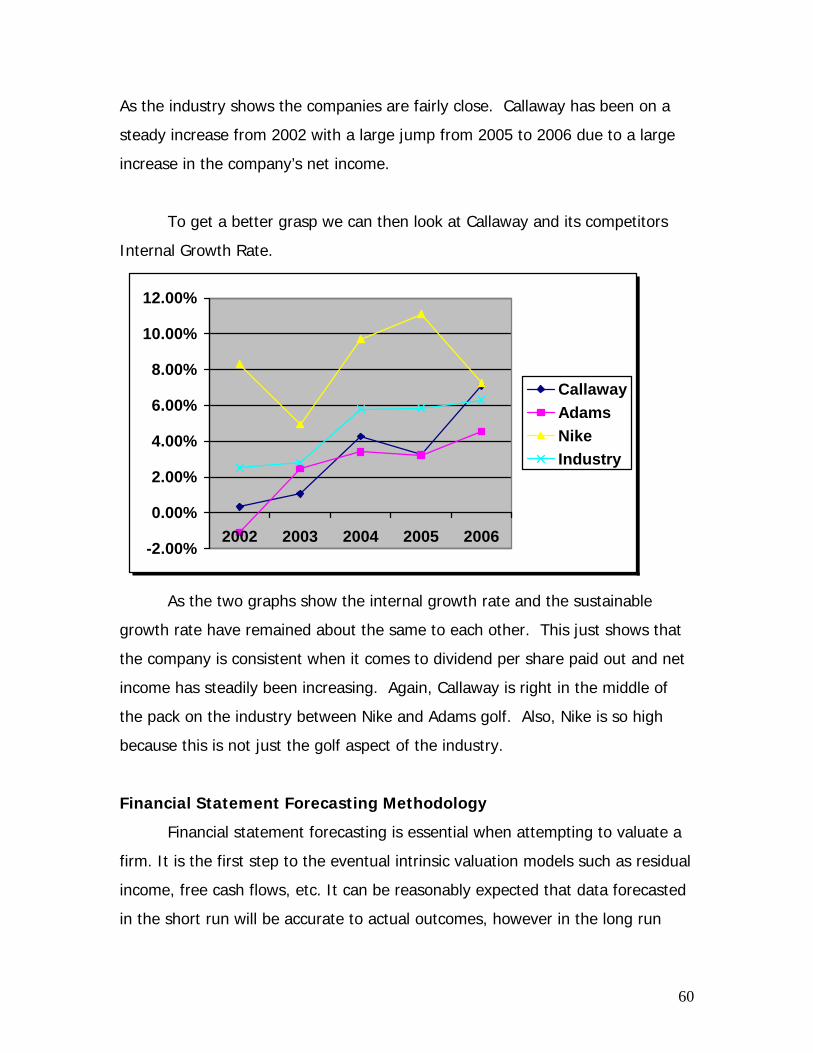
60
As the industry shows the companies are fairly close. Callaway has been on a
steady increase from 2002 with a large jump from 2005 to 2006 due to a large
increase in the company’s net income.
To get a better grasp we can then look at Callaway and its competitors
Internal Growth Rate.
-2.00%
0.00%
2.00%
4.00%
6.00%
8.00%
10.00%
12.00%
2002 2003 2004 2005 2006
CallawayAdamsNikeIndustry
As the two graphs show the internal growth rate and the sustainable
growth rate have remained about the same to each other. This just shows that
the company is consistent when it comes to dividend per share paid out and net
income has steadily been increasing. Again, Callaway is right in the middle of
the pack on the industry between Nike and Adams golf. Also, Nike is so high
because this is not just the golf aspect of the industry.
Financial Statement Forecasting Methodology
Financial statement forecasting is essential when attempting to valuate a
firm. It is the first step to the eventual intrinsic valuation models such as residual
income, free cash flows, etc. It can be reasonably expected that data forecasted
in the short run will be accurate to actual outcomes, however in the long run

61
there will be errors, simply because it is impossible to accurately predict a firms
movements so far into the future.
Income Statement
We began our financial statement forecasting for Callaway Golf with the
income statement. We projected that net sales would grow for the first year at a
rate of 2.75%. Afterwards, net sales would increase by an additional .75%
annually, until achieving a steady growth rate of 6.5% per year. In other words,
a net sales increase of 2.75% in 2007, 3.5% in 2008, 4.25% in 2009, 5.0% in
2010, 5.75% in 2011, and finally an indefinite 6.5% from 2012 onwards. We
chose this method after finding the average increase in total revenue across 5
years to be 6.55%. However the total revenue increases for each of the 5 years
individually, were highly fluctuated, and it seemed unlikely that the average of
6.55% increase in net sales would be achieved and maintained right away.
Callaway’s IGR would also suggest a slower paced growth that will continue to
increase over time. We also took into account the demographic of an aging
population. Studies have shown that the rounds of golf played increases with
age, thus an aging population would suggest an increase in total sales as the
“baby boomer” generation continues to age. The rest of our numbers for the
forecasted section of our income statement, were derived by assigning a
percentage of sales which was found through averaging 5 years of numbers.
These averages were also adjusted accordingly for recent trends and the
elimination or adjusting for outlier years.

62
2002 2003 2004 2005 2006 2007 2008 2009 2010 2011 2012 2013 2014 2015 2016Total Revenue 793,219.00 814,032.00 934,564 998,093 1,017,907 1,068,802 1,282,563 1,410,819 1,551,901 1,738,129 1,946,705 2,180,309 2,441,946 2,734,980 3,063,177
Cost of Revenue 393,068.00 445,417.00 575,742 583,679 619,832 609,752 731,702 804,872 885,360 991,603 1,110,595 1,243,866 1,393,130 1,560,306 1,747,543
Gross Profit 400,151.00 368,615.00 358,822 414,414 398,075 459,051 550,861 605,947 666,541 746,526 836,110 936,443 1,048,816 1,174,674 1,315,635
Operating ExpensesResearch and Development 32,182.00 29,529.00 30,557 26,989 26,785 26,720 32,064 35,270 38,798 43,453 48,668 54,508 61,049 68,374 76,579
Selling General and Administrative 256,909.00 273,231.00 352,967 370,219 334,235 371,195 445,434 489,977 538,975 603,652 676,091 757,221 848,088 949,858 1,063,842
Operating Income or Loss 111,060.00 65,855.00 (24,702.00) 17,206 37,055 61,135 73,363 80,699 88,769 99,421 111,352 124,714 139,679 156,441 175,214
Income from Continuing OperationsTotal Other Income/Net Expenses 2,271.00 3,550 1,934 (390.00) 3,364 3,420 4,104 4,515 4,966 5,562 6,229 6,977 7,814 8,752 9,802
Earnings Before Interest and Taxes 113,331.00 69,405 (22,768.00) 16,816 40,419 68,403 82,084 90,292 99,322 111,240 124,589 139,540 156,285 175,039 196,043
Interest Expense 1,660.00 1,522 945 2,279 5,421 6,413 7,695 8,465 9,311 10,429 11,680 13,082 14,652 16,410 18,379
Income Before Tax 111,671.00 67,883 (23,713.00) 14,537 34,998 58,143 69,771 76,749 84,423 94,554 105,901 118,609 132,842 148,783 166,637
Income Tax Expense 42,225.00 22,360 (13,610.00) 1,253 11,708 16,887 20,264 22,291 24,520 27,462 30,758 34,449 38,583 43,213 48,398
Net Income From Continuing Ops 69,446.00 45,523 (10,103.00) 13,284 23,290 41,256 49,507 54,458 59,903 67,092 75,143 84,160 94,259 105,570 118,239
Net Income 69,446.00 45,523 (10,103.00) 13,284 23,290 41,256 49,507 54,458 59,903 67,092 75,143 84,160 94,259 105,570 118,239
Common Size Income Statement 2002 2003 2004 2005 2006 2007 2008 2009 2010 2011 2012 2013 2014 2015 2016Total Revenue 100.00% 100.00% 100.00% 100.00% 100.00% 100.00% 100.00% 100.00% 100.00% 100.00% 100.00% 100.00% 100.00% 100.00% 100.00%
Cost of Revenue 49.55% 54.72% 61.60% 58.48% 60.89% 57.05% 57.05% 57.05% 57.05% 57.05% 57.05% 57.05% 57.05% 57.05% 57.05%
Gross Profit 50.45% 45.28% 38.39% 41.52% 39.11% 42.95% 42.95% 42.95% 42.95% 42.95% 42.95% 42.95% 42.95% 42.95% 42.95%
Operating ExpensesResearch and Development 4.06% 3.63% 3.26% 2.70% 2.63% 2.50% 2.50% 2.50% 2.50% 2.50% 2.50% 2.50% 2.50% 2.50% 2.50%
Selling General and Administrative 32.39% 33.57% 37.76% 37.09% 32.84% 34.73% 34.73% 34.73% 34.73% 34.73% 34.73% 34.73% 34.73% 34.73% 34.73%
Total Operating ExpensesOperating Income or Loss 14.00% 8.09% -2.64% 1.72% 3.64% 5.72% 5.72% 5.72% 5.72% 5.72% 5.72% 5.72% 5.72% 5.72% 5.72%
Income from Continuing OperationsTotal Other Income/Net Expenses 29.00% 0.44% 0.21% N/A 0.33% 0.32% 0.32% 0.32% 0.32% 0.32% 0.32% 0.32% 0.32% 0.32% 0.32%
Earnings Before Interest and Taxes 14.29% 8.53% -2.43% 1.68% 3.97% 6.04% 6.04% 6.04% 6.04% 6.04% 6.04% 6.04% 6.04% 6.04% 6.04%
Interest Expense 21.00% 0.19% 0.10% 0.23% 0.53% 0.60% 0.60% 0.60% 0.60% 0.60% 0.60% 0.60% 0.60% 0.60% 0.60%
Income Before Tax 14.08% 8.34% -2.54% 1.46% 3.44% 5.44% 5.44% 5.44% 5.44% 5.44% 5.44% 5.44% 5.44% 5.44% 5.44%
Income Tax Expense 5.32% 2.75% -1.46% 0.13% 1.15% 1.58% 1.58% 1.58% 1.58% 1.58% 1.58% 1.58% 1.58% 1.58% 1.58%
Net Income From Continuing Ops 8.75% 5.59% -1.08% 1.33% 2.29% 3.86% 3.86% 3.86% 3.86% 3.86% 3.86% 3.86% 3.86% 3.86% 3.86%
Net Income 8.75% 5.59% -1.08% 1.33% 2.29% 3.86% 3.86% 3.86% 3.86% 3.86% 3.86% 3.86% 3.86% 3.86% 3.86%
Income Statement for Callaway GolfActual Financial Statements Forecast Financial Statements
63
Balance Sheet
Our methods for financial forecasting Callaway’s balance sheet were very
similar to the methods we used in forecasting Callaway’s income statement. This
involved taking 5 years worth of averages for actual numbers, as well as
averages for the changes that major items experienced. We determined total
assets first by calculating averages and then adjusting for current trends, then
distributing out to the sub-categories in the same manor. We also used averages
for calculating total liabilities and shareholders’ equity. Additionally when
calculating liabilities and equity, we took into account ratios that demonstrated
the relationship between the changes in assets and the changes in liabilities and
equity. We made sure that our assets equaled total liabilities and shareholders
equity. Essentially we grew Callaway’s equity and assets at a constant rate, and
spread the numbers into the subcategories at a pre-determined percentage of
assets or total equity and liabilities.

64
2002 2003 2004 2005 2006 2007 2008 2009 2010 2011 2012 2013 2014 2015 2016Cash And Cash Equivalents 108,452 47,340 31,657 49,481 46,362 53,987 56,881 59,777 63,000 69,874 71,220 76,993 82,764 89,753 97,937
Net Receivables 63,867 100,664 166,809 138,300 160,040 179,956 189,603 199,256 210,000 232,914 237,398 256,642 275,879 299,177 326,457
Inventory 151,760 185,389 181,230 241,577 265,110 287,930 303,365 318,810 336,000 372,662 379,837 410,627 441,407 478,683 522,332
Other Current Assets 44,948 50,069 14,036 9,232 21,688 31,492 33,181 34,870 36,750 40,760 41,545 44,912 48,279 52,356 57,130
Total Current Assets 369,027 383,462 393,732 438,590 493,200 553,365 583,030 612,713 645,749 716,210 730,000 789,174 848,329 919,969 1,003,856
Property Plant and Equipment 167,340 164,763 135,865 127,739 131,224 130,468 137,462 144,461 152,250 168,863 172,114 186,065 200,012 216,903 236,681
Goodwill 18,202 20,216 30,468 29,068 30,833 31,492 33,181 34,870 36,750 40,760 41,545 44,912 48,279 52,356 57,130
Intangible Assets 103,115 149,635 149,168 146,123 144,326 134,967 142,203 149,442 157,500 174,685 178,049 192,481 206,909 224,383 244,843
Other Assets 16,945 18,201 16,667 16,462 27,543 26,993 28,441 29,888 31,500 34,937 35,610 38,496 41,382 44,877 48,969
Deferred Long Term Asset Charges 5,216 12,289 9,837 6,516 18,821 22,495 23,700 24,907 26,250 29,114 29,675 32,080 34,485 37,397 40,807
Total Non-current Assets 310,818 365,104 342,005.00 325,908.00 352,747 346,415 364,987 383,568 404,250 448,359 456,992 494,035 531,067 575,915 628,430
Total Assets 679,845 748,566 735,737 764,498 845,947 899,780 948,017 996,281 1,049,999 1,164,569 1,186,992 1,283,209 1,379,396 1,495,884 1,632,286
Liabilities
Current Liabilities
Accounts Payable 98,352 117,958 107,759 140,184 143,455 152,963 161,163 169,368 178,500 197,977 201,789 218,146 234,497 254,300 277,489
Short/Current Long Term Debt 10,809 12,202 13,039 21 80,000 85,479 90,062 94,647 99,750 110,634 112,764 121,905 131,043 142,109 155,067
Total Current Liabilities 109,161 130,160 120,798 140,205 223,455 238,442 251,225 264,014 278,250 308,611 314,553 340,050 365,540 396,409 432,556
Long Term Debt 19,922 20,076 19,948 19,922 - 24,564 25,881 27,198 28,665 31,793 32,405 35,032 37,658 40,838 44,561
Other Liabilities - - - - 19,922 21,595 22,752 23,911 25,200 27,950 28,488 30,797 33,106 35,901 39,175
Deferred Long Term Liability 7,375 8,947 8,674 8,323 23,466 24,924 26,260 27,597 29,085 32,259 32,880 35,545 38,209 41,436 45,214
Minority Interest - - - - 1,987 - - - - - - - - - -
Total Liabilities 136,458 159,183 149,420 168,450 268,830 309,524 326,118 342,721 361,200 400,612 408,325 441,424 474,512 514,584 561,506
Stockholders' Equity
Common Stock 836 837 848 850 851
Retained Earnings 439,454 466,441 437,269 430,996 435,074 420,417 444,549 470,066 497,048 525,578 555,747 587,647 621,377 657,044 694,759
Treasury Stock -130,331 -135,086 -141,384 -141,423 -194,295
Capital Surplus 371,496 400,939 387,950 393,676 402,628
Other Stockholder Equity -138,068 -143,748 -98,366 -88,051 -67,141
Total Stockholders' Equity 543,387 589,383 586,317 596,048 577,117 597,891 626,916 657,966 694,461 789,860 789,860 850,612 921,463 1,003,625 1,098,456
Total Liabilities and Stocholders' Equity 679,845 748,566 735,737 764,498 845,947 899,780 948,017 996,281 1,049,999 1,164,569 1,186,992 1,283,209 1,379,396 1,495,884 1,632,286
Balance Sheet for Callaway GolfActual Financial Statements Forecast Financial Statements

65
2002 2003 2004 2005 2006 2007 2008 2009 2010 2011 2012 2013 2014 2015 2016Cash And Cash Equivalents 15.95% 12.35% 4.30% 6.47% 5.41% 6.00% 6.00% 6.00% 6.00% 6.00% 6.00% 6.00% 6.00% 6.00% 6.00%
Net Receivables 9.39% 26.25% 22.67% 18.09% 18.92% 20.00% 20.00% 20.00% 20.00% 20.00% 20.00% 20.00% 20.00% 20.00% 20.00%
Inventory 22.32% 48.35% 24.63% 31.60% 31.34% 32.00% 32.00% 32.00% 32.00% 32.00% 32.00% 32.00% 32.00% 32.00% 32.00%
Other Current Assets 6.61% 13.06% 1.91% 1.21% 2.65% 3.50% 3.50% 3.50% 3.50% 3.50% 3.50% 3.50% 3.50% 3.50% 3.50%
Total Current Assets 54.28% 51.23% 53.52% 57.37% 58.30% 61.50% 61.50% 61.50% 61.50% 61.50% 61.50% 61.50% 61.50% 61.50% 61.50%
Property Plant and Equipment 24.61% 22.01% 18.47% 16.71% 15.51% 14.50% 14.50% 14.50% 14.50% 14.50% 14.50% 14.50% 14.50% 14.50% 14.50%
Goodwill 2.68% 2.70% 4.14% 3.80% 3.64% 3.50% 3.50% 3.50% 3.50% 3.50% 3.50% 3.50% 3.50% 3.50% 3.50%
Intangible Assets 15.17% 19.99% 20.27% 19.11% 17.06% 15.00% 15.00% 15.00% 15.00% 15.00% 15.00% 15.00% 15.00% 15.00% 15.00%
Other Assets 2.49% 2.43% 2.27% 2.15% 3.26% 3.00% 3.00% 3.00% 3.00% 3.00% 3.00% 3.00% 3.00% 3.00% 3.00%
Deferred Long Term Asset Charges 0.77% 1.64% 1.34% 0.85% 2.22% 2.50% 2.50% 2.50% 2.50% 2.50% 2.50% 2.50% 2.50% 2.50% 2.50%
Total Assets 100.00% 100.00% 100.00% 100.00% 100.00% 100.00% 100.00% 100.00% 100.00% 100.00% 100.00% 100.00% 100.00% 100.00% 100.00%
Liabilities
Current Liabilities
Accounts Payable #REF! #REF! 14.65% 18.34% 16.96% 17.00% 17.00% 17.00% 17.00% 17.00% 17.00% 17.00% 17.00% 17.00% 17.00%
Short/Current Long Term Debt #REF! #REF! 1.77% - 9.46% 9.50% 9.50% 9.50% 9.50% 9.50% 9.50% 9.50% 9.50% 9.50% 9.50%
Total Current Liabilities #REF! #REF! 16.42% 18.34% 26.41% 26.50% 26.50% 26.50% 26.50% 26.50% 26.50% 26.50% 26.50% 26.50% 26.50%
Long Term Debt 2.93% #REF! 2.71% 2.61% - 2.73% 2.73% 2.73% 2.73% 2.73% 2.73% 2.73% 2.73% 2.73% 2.73%
Other Liabilities #REF! #REF! 1.18% 1.09% 2.35% 2.40% 2.40% 2.40% 2.40% 2.40% 2.40% 2.40% 2.40% 2.40% 2.40%
Deferred Long Term Liability - - - - 2.77% 2.77% 2.77% 2.77% 2.77% 2.77% 2.77% 2.77% 2.77% 2.77% 2.77%
Minority Interest - - - - 0.23% - - - - - - - - - -
Total Liabilities #REF! #REF! 20.31% 22.03% 31.78% 34.40% 34.40% 34.40% 34.40% 34.40% 34.40% 34.40% 34.40% 34.40% 34.40%
Stockholders' Equity
Common Stock #REF! #REF! 0.12% 0.11% 0.10% 0.11% 0.11% 0.11% 0.11% 0.11% 0.11% 0.11% 0.11% 0.11% 0.11%
Retained Earnings #REF! #REF! 59.43% 56.38% 51.43% 47.00% 47.00% 47.00% 47.00% 47.00% 47.00% 47.00% 47.00% 47.00% 47.00%
Treasury Stock #REF! #REF! -19.22% -18.47% -22.97% -20.01% -20.01% -20.01% -20.01% -20.01% -20.01% -20.01% -20.01% -20.01% -20.01%
Capital Surplus #REF! #REF! 52.73% 51.49% 47.59% 44.50% 44.50% 44.50% 44.50% 44.50% 44.50% 44.50% 44.50% 44.50% 44.50%
Other Stockholder Equity #REF! #REF! -13.37% -11.52% -7.94% -6.00% -6.00% -6.00% -6.00% -6.00% -6.00% -6.00% -6.00% -6.00% -6.00%
Total Stockholders' Equity #REF! #REF! 79.69% 77.97% 68.22% 65.60% 65.60% 65.60% 65.60% 65.60% 65.60% 65.60% 65.60% 65.60% 65.60%
Total Liabilities and Stocholders' Equity 100.00% 100.00% 100.00% 100.00% 100.00% 100.00% 100.00% 100.00% 100.00% 100.00% 100.00% 100.00% 100.00% 100.00% 100.00%
Balance Sheet for Callaway GolfActual Financial Statements Forecast Financial Statements
66
Statement of Cash Flows
The statement of cash flows contained fewer forecast able numbers
compared to the income statement and balance sheet. Trends were difficult to
predict; however, Net Income has been previously forecasted in the income
state. When deciding which information is relevant to the forecast we must try to
observe any noticeable trends in the past five years. The cash flows from
operations (CFFO) was difficult to forecast because of the 2004 net loss. This
year is an outlier and was not figured in the data. CFFO was forecasted as an
average percentage of net income for the four remaining years and increased
proportionally with net income. The average percentage of depreciation and
amortization as related to CFFO on the common size statement of cash flows was
used to determine its increasing trend for the next ten years. Capital
expenditures and cash flows from investing (CFFI) were both forecasted using
averages from the past three years and grown according to the growth during
that span.

67
Statement of Cash Flows for Callaway Golf
2002 2003 2004 2005 2006 2007 2008 2009 2010 2011 2012 2013 2014 2015 2016Net income (loss) 69,446$ 45,523$ $ (10,103) $ 13,284 $ 23,290 41,256$ $ 49,507 $ 54,448 $ 59,903 67,092$ 75,143$ 84,160$ 94,259$ 105,570$ 118,239$ Depreciation and amortization 37,640$ 44,496$ 51,154$ 38,260$ 32,274$ 33,888$ 40,665$ 44,724$ 49,205$ 55,110$ 61,723$ 69,130$ 77,425$ 86,716$ 97,122$ Noncash compensation 314$ 15$ 1,741$ 6,527$ 11,921$ Loss on disposal of long-lived assets 1,168$ 24,163$ 7,669$ 4,031$ 1,135$ Deferred taxes 11,357$ (8,320)$ 7,707$ (3,906)$ 979$ Tax benefit from exercise of stock options 5,479$ (982)$ 2,161$ 2,408$ -$ Net noncash foreign currency hedging loss (4,328)$ 2,619$ 1,811$ -$ -$ Changes in assets and liabilitiesAccounts receivable, net (9,279)$ 12,698$ (1,048)$ 2,296$ (12,128)$ Inventories, net 21,785$ 4,897$ 10,299$ (65,595)$ (16,842)$ Other assets 10,202$ (4,743)$ 1,554$ 7,583$ (4,475)$ Accounts payable and accrued expenses 11,579$ 2,561$ (17,122)$ 32,423$ (4,525)$ Accrued employee compensation and benefits (2,383)$ (3,898)$ (5,895)$ 5,121$ (6,376)$ Accrued warranty expense (21,400)$ (838)$ (584)$ 1,224$ 98$ Income taxes receivable and payable 6,185$ 4,004$ (40,711)$ 26,676$ (6,936)$ Other liabilities (922)$ 1,572$ (273)$ (351)$ (1,128)$ Cash from operating activities 139,214$ 118,743$ 8,360$ 69,981$ 17,287$ 44,589$ 53,507$ 58,847$ 64,743$ 72,513$ 81,215$ 90,960$ 101,875$ 114,100$ 127,793$
Capital expenditures (73,502)$ (7,810)$ (25,809)$ (33,942)$ (32,453)$ Investment in golf related ventures -$ -$ -$ -$ (10,008)$ Proceeds from sale of capital assets 871$ 178$ 431$ 1,363$ 469$ Acquisitions, net of cash acquired -$ 160,321$ (9,204)$ -$ 374$ Cash from investing activities (67,633)$ (167,929)$ (34,582)$ (32,579)$ (41,618)$ (8,363)$ 19,768$ 20,902$ 22,102$ 23,371$ 24,712$ 26,131$ 27,631$ 29,217$ 30,894$
Issuance of common stock 18,305$ 17,994$ 20,311$ 14,812$ 9,606$ Acquisition of treasury stock (46,457)$ (4,755)$ (6,298)$ (39)$ (52,872)$ Dividends paid, net (18,601)$ (18,536)$ (19,069)$ (19,557)$ (19,212)$ (20,482)$ (20,482)$ (23,408)$ (23,408)$ (23,408)$ (23,408)$ (23,408)$ (23,408)$ (23,408)$ (23,408)$ Proceeds from (payments on) line of credit -$ -$ 13,000$ (13,000)$ 80,000$ Minority interest in consolidated subsidiary -$ -$ -$ -$ 1,987$ Tax benefit from exercise of stock options -$ -$ -$ -$ 578$ Other financing activities -$ -$ -$ (44)$ (16)$ Cash from financing activities (49,127)$ (13,414)$ 7,944$ (17,828)$ 20,071$
Foreign exchange effects 1,735$ 1,488$ 2,595$ (1,750)$ 1,411$ Net increase (decrease) in cash and cash equivalents 24,189$ (61,112)$ (15,683)$ 17,824$ (3,119)$ Cash and cash equivalents at beginning of year 84,263$ 108,452$ 47,340$ 31,657$ 49,481$ Cash and cash equivalents at end of year 108,452$ 47,340$ 31,657$ 49,481$ 46,362$
Actual Financial Statements Forecast Financial Statements

68
2002 2003 2004 2005 2006 2007 2008 2009 2010 2011 2012 2013 2014 2015 2016Net income (loss) 49.88% 38.34% -120.85% 18.98% 134.73% 91.92% 91.92% 91.92% 91.92% 91.92% 91.92% 91.92% 91.92% 91.92% 91.92%Depreciation and amortization 27.04% 37.47% 611.89% 54.67% 186.70% 76.47% 76.47% 76.47% 76.47% 76.47% 76.47% 76.47% 76.47% 76.47% 76.47%Noncash compensation 0.23% 0.01% 20.83% 9.33% 68.96%Loss on disposal of long-lived assets 0.84% 20.35% 91.73% 5.76% 6.57%Deferred taxes 8.16% -7.01% 92.19% -5.58% 5.66%Tax benefit from exercise of stock options 3.94% -0.83% 25.85% 3.44% 0.00%Net noncash foreign currency hedging loss -3.11% 2.21% 21.66% 0.00% 0.00%Changes in assets and liabilitiesAccounts receivable, net -6.67% 10.69% -12.54% 3.28% -70.16%Inventories, net 15.65% 4.12% 123.19% -93.73% -97.43%Other assets 7.33% -3.99% 18.59% 10.84% -25.89%Accounts payable and accrued expenses 8.32% 2.16% -204.81% 46.33% -26.18%Accrued employee compensation and benefits -1.71% -3.28% -70.51% 7.32% -36.88%Accrued warranty expense -15.37% -0.71% -6.99% 1.75% 0.57%Income taxes receivable and payable 4.44% 3.37% -486.97% 38.12% -40.12%Other liabilities -0.66% 1.32% -3.27% -0.50% -6.53%Cash from operating activities 100.00% 100.00% 100.00% 100.00% 100.00% 100.00% 100.00% 100.00% 100.00% 100.00% 100.00% 100.00% 100.00% 100.00% 100.00%
Actual Financial Statements Forecast Financial StatementsStatement of Cash Flows for Callaway Golf
69
Analysis and Forecasting Conclusion
After forecasting the financial statements for Callaway Golf, we believe
they will continue to grow at a relatively good rate for their industry. Their
company is currently at a point where they are satisfying the costs of the
acquisition of Top-Flite golf, and beginning to reap the benefits. With this in
mind, the acquisition made it difficult to accurately forecast the results of such a
purchase as it occurred in September of 2003 and did not have an affect until
2004. It is difficult to realize exacticly how much this will increase sales in the
future. As noted in Callaway’s 10-K, the aging population of the United States
should also be beneficial for the golf industry and Callaway in particular, and
should be apparent with an increase in sales for years to come.
The largest weakness for our forecasting is the fact that Callaway is a
company that has experienced many fluctuations in the past 5 years due to
acquisitions and the industry itself. The golf industry is highly seasonal and can
experience great changes based on something as simple as the weather. We
attempted to carefully exam the trends that Callaway experienced before their
acquisition, as well as the results and increases they have experienced
afterwards. At some points we even excluded outlier years when determining
growth rates and liability portions. We also assume that this investment will
prove to be beneficial to the company.
For this draft we have computed and analyzed ratios that reflect liquidity,
profitability, capital structure, and growth for Callaway Golf. Additionally, we
organized information from Callaway’s Income Statement, Balance Sheet, and
Statement of Cash Flows. We also computed the common size version for each
of the preceding. This information was used to assess Callaway’s situation in the
golf industry for the past 5 years, as well as forecast out 10 years worth of
information based on our findings. The results of these forecasts are the
following.

70
Valuation Analysis Valuation is the process of converting a forecast into an estimate of the
value of the firm (PH&B). With the forecasts computed prior, we will use several
valuation methods to estimate a price for Callaway Golf. Each valuation method
has advantages and disadvantages, and when put together they add value to the
analysis for investors.
Cost of Capital The cost of capital is a weighted average of the cost of equity and the
cost of debt. Firm finance their operation from three main transactions they are
issuing stock, debt, and reinvesting back into their corporation. In order to
obtain a WACC you must have consistent inputs into your formulas of cost of
debt, equity, expected return and the risk free rate.
To come up with the numbers for the cost of debt we must run
regressions which were run using a 6 month treasury bond. We had to look up
the monthly market return off of the S&P 500 and also use a respective risk free
rate. We used the 6 month bond because it had the highest explanatory power
for us which is the highest adjusted r squared in respect to the other bonds on
the market. When the regressions were run we obtained a beta which was
concluded using the highest adjusted r squared. The beta that we have chosen
to use is 1.64 with an adjusted r squared of 28.46% which was the highest of all
the models. After completing regressions and finding a pretty accurate beta we
then plugged it in to the CAPM model to find the cost of equity. The cost of
equity is important to the firm because it is the number that investors are
required to return on investments.
Ke = 4.44 + 1.64(.0463)

71
Cost of Debt
The calculation of the cost of debt isn’t as complex as finding the beta. All
of the respective information is found on the balance sheets for the company or
in discussions. To find the cost of debt you get the total of current and long
term liabilities then finding a weighted average and multiplying them each by its
interest rates.
Kd = 6.76% (before tax)
Kd = 4.39% (after tax)
Weighted Average Cost of Capital
The weighted average cost of capital has two possible outcomes it has a
before tax and an after tax. For our calculations we used the after tax formula
since it gives a more accurate representation of Callaway since we pay taxes on
all of our revenues.
WAAC after tax = Ve/Vf (Ke) + Vd/Vf (Kd) (1-tax rate)
After tax = 577,117/845,947(.1203) + 268,830/845,947(.0676) (1-.35) = 9.60%
The formula above show how WACC was calculated using the after tax
formula. This is a more accurate representation as a said because if we were to
calculate WACC before tax it would not include the tax rate which would be a
wrong representation of our firm due to the fact that we pay taxes on our
revenues.
Comparables Valuation
When you need to obtain your companies price per share you have to
complete method of comparables to get an industry average. The method of
comparables does not give you an accurate average because most of the time
the companies you are comparing yours too does not give an accurate depiction

72
of the industry you are in. When obtaining an average you do not use Callaway
as part of the average. As I said the method of comparables is probably the
least accurate way to obtain a price per share but it is quick and easy.
Method of Comparables
PPS EPS BPS DPS
ELY 14.41 .32 7.89 .28
NKE 99.03 .36 12.93 .65
ADGO.OB 1.97 .38 1.74 0
Trailing Price/Earnings
ELY 75.84
NKE 42.69
ADGO 14.07
Industry 28.38
Est. Share Price 9.08
The trailing price over earnings ratio concludes that the estimated share
price would be 9.08 which is undervalue of Callaway’s current price of 16.17.
These results were found by taking the price per share for the current period and
then dividing it by the earning per share from the last period. You then take the
average of the industry and multiply it by Callaway’s current earnings per share
to obtain the estimated share price.
Forward Price/Earnings
ELY 17.79
NKE 139.48
ADGO 0
Industry 69.74
Est. Share Price 56.49

73
The forward price over earnings share price is estimated to be 56.49. To
solve for the forward price over earnings we took the analysts estimates of the
EPS and took the current price per share and divided the two. We then took an
industry average. To obtain the estimated share price we took the industry
average and multiplied it by Callaway’s earnings per share.
Market/Book
ELY 1.83
NKE 7.66
ADGO 1.13
Industry 4.40
Est. Share Price 1.41
The market to book has estimated that we will have a estimated share
price of 1.41 which way overvalues Callaway at 16.17. This number is really low
due to the fact that Callaway and the competing companies have fairly high BPS.
This makes that numbers low because when you find the value you take the PPS
divided by the BPS. You then take an industry average excluding Callaway and
then multiply the industry average by Callaway’s BPS to obtain estimated
earnings per share.
Dividends/Price
ELY .02
NKE .01
ADGO .00
Industry .01
Est. Share Price .2
74
To find the share price we took the dividends per share and divided it by
the price per share. We then took an industry average excluding Callaway and
Adam’s because you don’t include zeroes in the average. To obtain the
estimated share price we took Callaway’s dividends per share and divided it by
the industry average.
P.E.G Ratio
ELY 54.92
NKE 266.81
ADGO 3.80
Industry 135.31
Est. Share Price 42.76
The price earning growth estimates the share price to be 42.76 which still
overvalues Callaway at 16.17. We found these prices by taking the Price over
Earnings then dividing that by 1 minus the earnings per share growth rate. We
then took the industry average and multiplied it by 1 minus Callaway’s growth
rate to obtain the estimated share price.
Intrinsic Valuation Methods:
Discounted Dividends
The first model that will be discussed is the discounted dividends model. This
model incorporates dividends paid and also projected dividends to be paid. The
cost of equity is used as the discount rate and also a growth rate of the
dividends. We have ten years of dividends forecasted out and used the discount
rate to discount them back and find a proper valuation according to this
valuation model. We had to use a perpetuity for the end of the model, because
we assume that dividends will be paid indefinitely, also discounted back to
present year dollars.

75
We have created different scenarios in a sensitivity analysis of different
possibilities of cost of equity and growth rate. The different combinations
formulate a different valuation prices. We believe the middle price of $6.37 to be
closest to our valuation, but with a small adjustment of cost of equity or change
of a growth rate, a price can change easily. This is showing that the dividend
discount model lacks much explanatory power of a correct price using the
dividend discount model.
Discounted Free Cash Flows
The discounted free cash flows model is different than the other valuation
models in that it uses the WACC as the discount rate. As mentioned earlier,
Callaway’s WACC is 9.6%. First, you must calculate the FCF, which is done by
subtracting cash flows from investing activities from cash flows from operations.
Your calculated FCF is then multiplied by a present value factor (1/(1+WACC)t),
which accounts for each forecasted year individually. A terminal value perpetuity
is then estimated and discounted back just as the FCF. The PV of the FCF and PV
terminal value perpetuity make up the value of the firm. The value of the firm is
then subtracted from the 2006 total liabilities found on the balance sheet. This
gives us an estimated market value of equity, which is then divided by the
number of shares outstanding completing our valuation of the firm.
ke g 0.02 0.05 0.08 0.12 0.15 0.18 0.22
0.01 $97.62 $19.45 $10.26 $6.40 $5.00 $4.05 $3.140.02 NA $22.30 $10.53 $6.40 $4.98 $4.03 $3.130.04 -$28.11 $45.11 $11.45 $6.37 $4.92 $3.99 $3.110.06 -$7.15 -$23.31 $14.23 $6.33 $4.85 $3.94 $3.080.07 -$2.96 -$6.21 $19.79 $6.30 $4.80 $3.91 $3.07
Overvalued (<90%) $14.55
Undervalued (>110%) $17.79
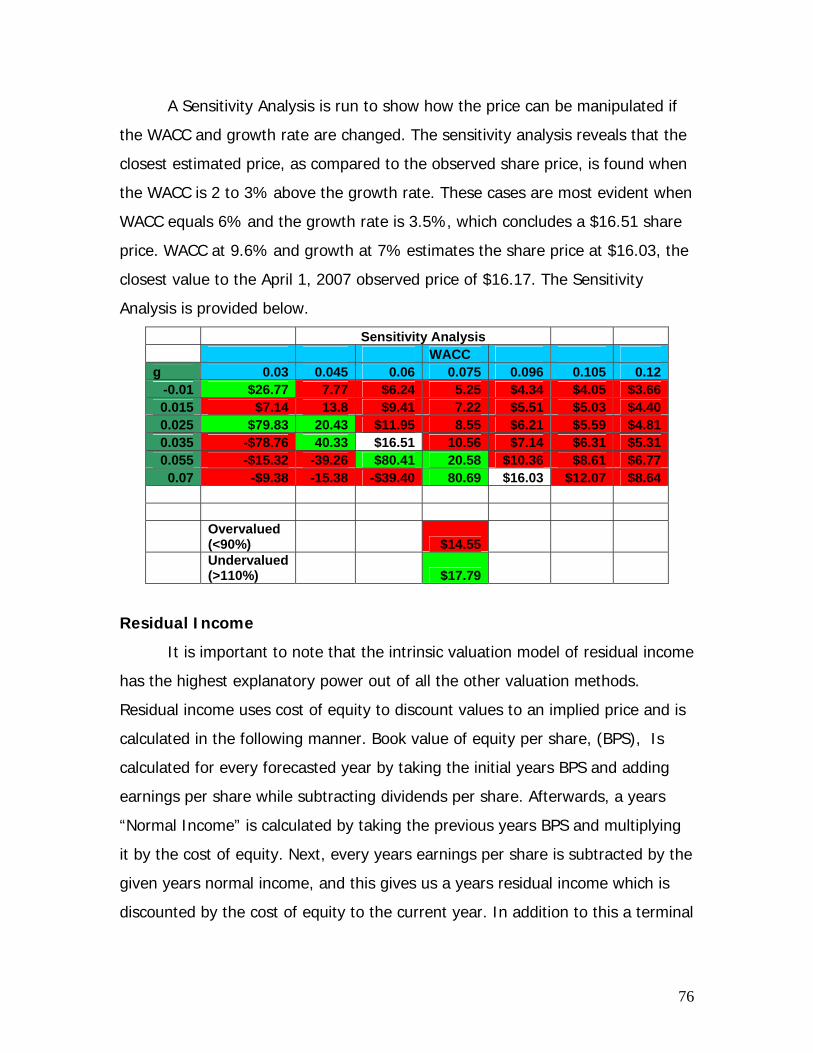
76
A Sensitivity Analysis is run to show how the price can be manipulated if
the WACC and growth rate are changed. The sensitivity analysis reveals that the
closest estimated price, as compared to the observed share price, is found when
the WACC is 2 to 3% above the growth rate. These cases are most evident when
WACC equals 6% and the growth rate is 3.5%, which concludes a $16.51 share
price. WACC at 9.6% and growth at 7% estimates the share price at $16.03, the
closest value to the April 1, 2007 observed price of $16.17. The Sensitivity
Analysis is provided below.
Sensitivity Analysis WACC g 0.03 0.045 0.06 0.075 0.096 0.105 0.12
-0.01 $26.77 7.77 $6.24 5.25 $4.34 $4.05 $3.660.015 $7.14 13.8 $9.41 7.22 $5.51 $5.03 $4.400.025 $79.83 20.43 $11.95 8.55 $6.21 $5.59 $4.810.035 -$78.76 40.33 $16.51 10.56 $7.14 $6.31 $5.310.055 -$15.32 -39.26 $80.41 20.58 $10.36 $8.61 $6.77
0.07 -$9.38 -15.38 -$39.40 80.69 $16.03 $12.07 $8.64
Overvalued (<90%) $14.55
Undervalued (>110%) $17.79
Residual Income
It is important to note that the intrinsic valuation model of residual income
has the highest explanatory power out of all the other valuation methods.
Residual income uses cost of equity to discount values to an implied price and is
calculated in the following manner. Book value of equity per share, (BPS), Is
calculated for every forecasted year by taking the initial years BPS and adding
earnings per share while subtracting dividends per share. Afterwards, a years
“Normal Income” is calculated by taking the previous years BPS and multiplying
it by the cost of equity. Next, every years earnings per share is subtracted by the
given years normal income, and this gives us a years residual income which is
discounted by the cost of equity to the current year. In addition to this a terminal
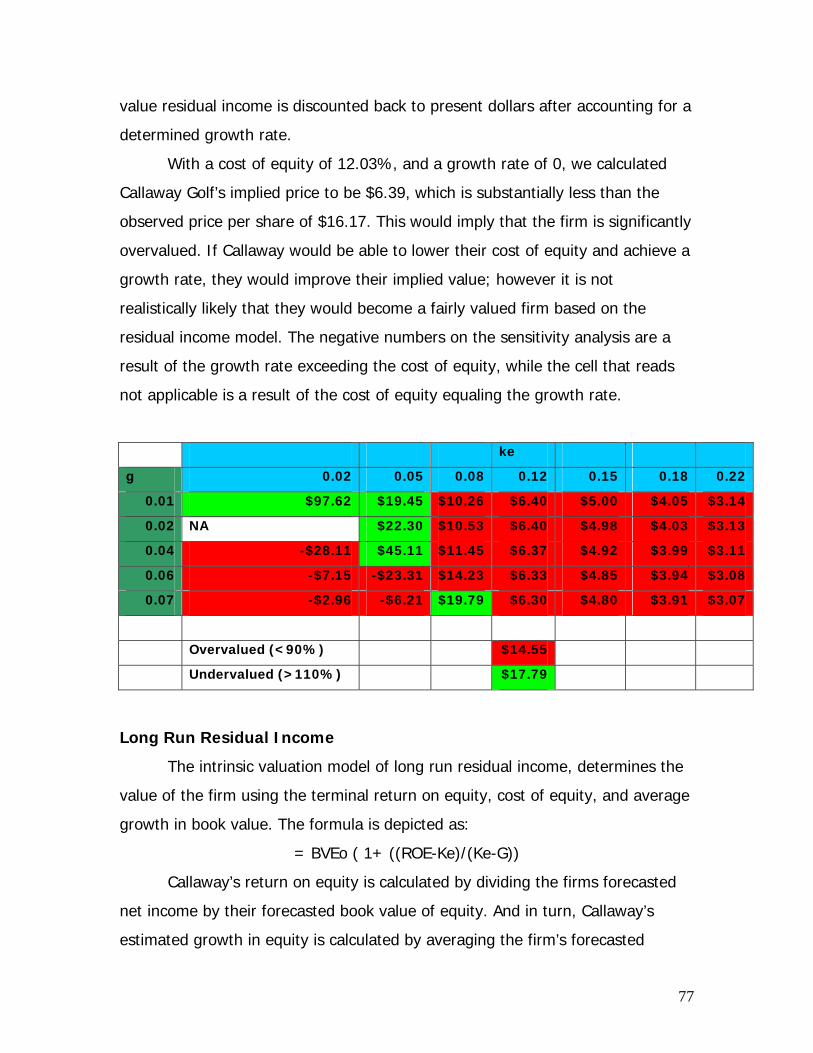
77
value residual income is discounted back to present dollars after accounting for a
determined growth rate.
With a cost of equity of 12.03%, and a growth rate of 0, we calculated
Callaway Golf’s implied price to be $6.39, which is substantially less than the
observed price per share of $16.17. This would imply that the firm is significantly
overvalued. If Callaway would be able to lower their cost of equity and achieve a
growth rate, they would improve their implied value; however it is not
realistically likely that they would become a fairly valued firm based on the
residual income model. The negative numbers on the sensitivity analysis are a
result of the growth rate exceeding the cost of equity, while the cell that reads
not applicable is a result of the cost of equity equaling the growth rate.
ke
g 0.02 0.05 0.08 0.12 0.15 0.18 0.22
0.01 $97.62 $19.45 $10.26 $6.40 $5.00 $4.05 $3.14
0.02 NA $22.30 $10.53 $6.40 $4.98 $4.03 $3.13
0.04 -$28.11 $45.11 $11.45 $6.37 $4.92 $3.99 $3.11
0.06 -$7.15 -$23.31 $14.23 $6.33 $4.85 $3.94 $3.08
0.07 -$2.96 -$6.21 $19.79 $6.30 $4.80 $3.91 $3.07
Overvalued (<90%) $14.55
Undervalued (>110%) $17.79
Long Run Residual Income
The intrinsic valuation model of long run residual income, determines the
value of the firm using the terminal return on equity, cost of equity, and average
growth in book value. The formula is depicted as:
= BVEo ( 1+ ((ROE-Ke)/(Ke-G))
Callaway’s return on equity is calculated by dividing the firms forecasted
net income by their forecasted book value of equity. And in turn, Callaway’s
estimated growth in equity is calculated by averaging the firm’s forecasted

78
beginning book value of equity by the end book value of equity. In Callaway’s
case, their return on equity is at a growing stage. This is because of their
acquisition of Top Flite Golf. It would be aggressive to forecast a rapid growth in
ROE after their negative net income in 2003, and growing income since.
However we are assuming an implied ROE of 15% which would be a reasonable
terminal ROE assumption as they must have a ROE above their cost of equity of
12.03%, in order to create value.
Out of all the intrinsic valuation models, long run residual income gives us
the closest implied price to actual price for Callaway, of $12.61. With this being
said, the implied price would indicate that Callaway is slightly over-valued which
is the most favorable implied valuation we have obtained. If they would be able
to increase their return on equity to above 15%, with their current cost of equity,
Callaway may be able to achieve an implied price that would merit them as a
fairly valued firm. Similarly, if Callaway would be able to lower their cost of
equity, their implied value would increase dramatically and may even suggest
them to be an undervalued company. The reason we believe this model
demonstrates such a good explanatory power of Callaway’s price, is the fact that
terminal ROE excludes the difficulties of forecasting the results of a company
who’s net income has fluctuated in the amounts that it has recently.
Sensitivity Analysis
g 0.11 0.13 0.15 0.17 0.19
0.08 $26.34 $38.48 $50.63 $62.77 $74.92
0.1 $10.55 $15.42 $20.28 $25.15 $30.01
0.1203 $6.56 $9.58 $12.61 $15.63 $18.66
0.14 $4.80 $7.01 $9.22 $11.44 $13.65
0.16 $3.77 $5.51 $7.25 $8.99 $10.73
Overvalued (<90%) $14.55
Undervalued (>110%) $17.79

79
Abnormal Earnings Growth
When computing Abnormal Earnings Growth, expected earnings per share
and dividends paid are an integral part of the valuation. You begin by calculating
DRIP, which is done by multiplying dividends per share by ke. Then find the
Cum-Dividends Earnings by adding the DRIP plus the expected price per share.
Normal Earnings are then computed by multiplying the ke times your
“benchmark” earnings, which is the EPS from the previous year. Subtract the
Normal Earnings from the Cum-Dividends Earnings to find your AEG for that
year. In order to create value for the firm the AEG must be greater than zero, or
value is destroyed. Callaway manages to create value for all of the forecasted
years. A PV Factor using ke is used to calculate the PV of AEG. The total PV of
AEG is subtracted from your Core EPS, which is the EPS for the first forecasted
year (2007) to find Callaway’s total average EPS. The intrinsic value per share is
calculated by subtracting the growth rate from ke and dividing that total by the
total average EPS (.78/(.1203-0)).
The Sensitivity Analysis shows that at 15% ke and 10% growth the
estimated share price of $16.15 is very close to the observed price of $16.17.
When we show negative growth of -2.5% at a ke of 2% the estimated price is
also close at $17.41. When growth ranges from 10 to 50% the price is negative
unless the ke is 18% or 22%.
Sensitivity Analysis ke g 0.02 0.05 0.08 0.12 0.15 0.18 0.22
-0.025 17.41 10.52 7.57 5.53 4.61 3.96 3.34-0.01 26.11 13.15 8.83 6.17 5.05 4.28 3.56
0.1 -$9.79 -$15.78 -$39.73 $40.10 $16.15 $10.16 $6.830.2 -$4.35 -$5.26 -$6.62 -$10.02 -$16.15 $40.62 $40.960.5 -$1.63 -$1.75 -$1.89 -$2.11 -$2.31 -$2.54 -$2.93
Overvalued (<90%) $14.55
Undervalued (>110%) $17.79

80
Altman Z-Score Credit Analysis
The Altman Z-Score is a fairly new valuation tool which assesses a firm’s
likeliness to go bankrupt. Through historical evaluations it has proven to be a
very reliable valuation. It states that if a firm has a Z-Score of 1.8 or less, there
is a high chance that it will go bankrupt in the near future, while if a firm has a
Z-Score above 2.7, there is a smaller threat of imminent bankruptcy. The formula
itself consists of major ratios that are weighted to give the firm a score. The
actual equation is as follows:
Z-Score= 1.2(Working Capital/Total Assets) + 1.4(Retained Earnings/Total
Assets) + 3.3(Earnings before Interest and Taxes) + 0.6(Market Value of
Equity/Book Value of Liabilities) +1.0 (Sales/Total Assets)
The Z-Score for Callaway Golf comes to 2.46, which is in between the two
check numbers of 1.8 and 2.7. This would indicate that Callaway is not in any
immediate danger of going bankrupt; however they are not above the score of
2.7 which would suggest that they are not completely safe from the possibility of
bankruptcy. The Z-Score of 2.46 would suggest that Callaway Golf does have
some credit problems. The major disadvantage of this is the fact that creditors
weigh the Z-Score very highly, to the point of over-weighting, when considering
loans. This would mean that Callaway would likely pay a premium expense for
loans and notes payable.
While Callaway is much closer to the upper end of the grey are between
1.8 and 2.7, this is an unfavorable sign of credit problems which does hinder the
firm.
Valuation Conclusion:
After assessing the value of Callaway Golf using several methods, we
conclude that Callaway Golf is overvalued. While some of the models we used
seem to be more accurate than others, all of them point to the fact that Callaway
Golf’s true dollar value per share is substantially lower than their stated price as
of April 1st, 2007. The intrinsic valuation model which produced the highest price

81
per share was the long run residual income model which gave an implied price of
$12.61 per share. The model that produced the lowest price per share was the
discounted dividend model which gave an implied price per share of $2.70. The
other models we used, and their yielded price per share, were free cash flows at
$5.39, residual income at $6.39, and abnormal earnings growth at $6.67.
Callaway’s actual price per share was $14.41, and with discounted dividends, one
would exclude it as an outlier. If you average the results of all these findings,
you come up with a share price of $6.75. If you exclude discounted dividends as
an outlier then the implied price would be $7.77. Regardless of what may be an
outlier and what may not, it is evident that Callaway Golf’s price per share is well
below the stated price of $14.41. Therefore we confidently, and positively asses
Callaway Golf as overvalued.

82
Appendix-1 Cost of Debt and Equity
Cost of Debt
Liabilities Interest Weight Current Liabilities Accounts Payable 143455 0.055 0.5336 0.029349 Short/Current Long Term Debt 80000 0.1 0.2976 0.029759 Other Current Liabilities - Total Current 223455 Long Term Liabilites Long Term Debt - Other Liabilities 19922 0.04 0.0741 0.002964 Deferred Long Term Liability Charges 23466 0.06 0.0873 0.005237 Minority Interest 1987 0.045 0.0074 0.000333 Total Long Term 45375 Total Liabilities 268830 1.0000 Total 0.067642
Cost of Equity
CAPM = Rf + B(MRP)
.1203 = .0444 + 1.64(.0463)
Ke = .1203 = 12.03%
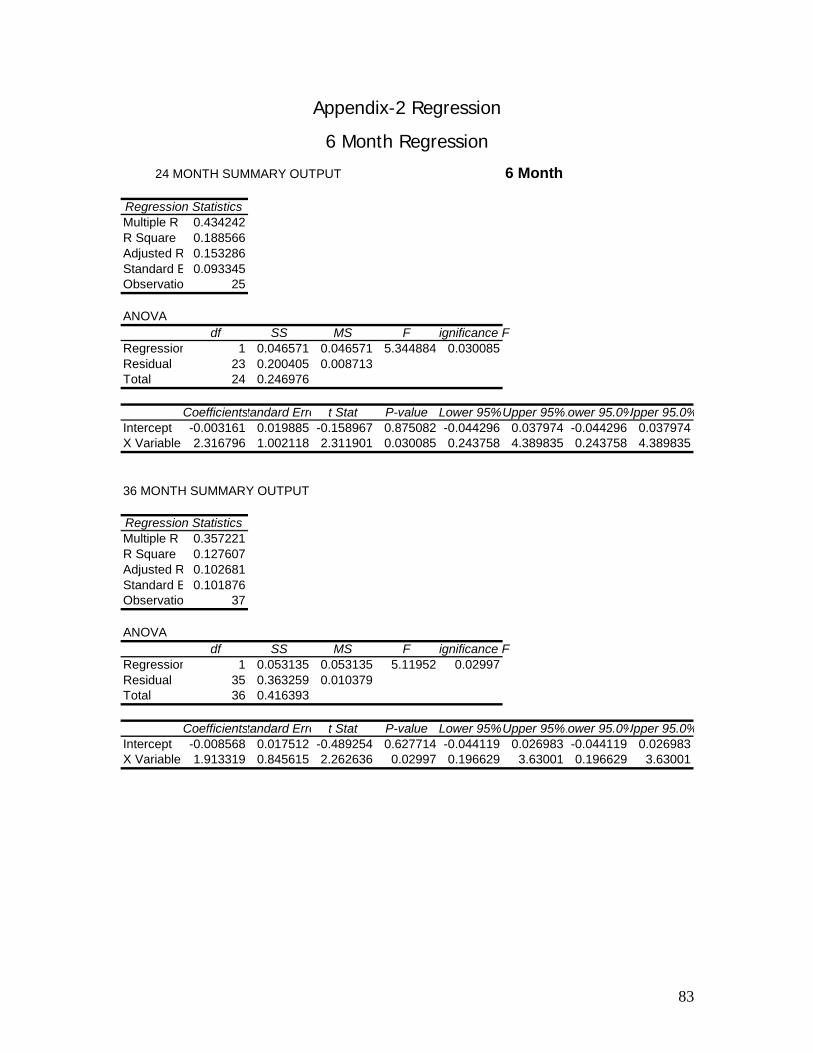
83
Appendix-2 Regression
6 Month Regression
6 Month
Regression StatisticsMultiple R 0.434242R Square 0.188566Adjusted R 0.153286Standard E 0.093345Observatio 25
ANOVAdf SS MS F ignificance F
Regression 1 0.046571 0.046571 5.344884 0.030085Residual 23 0.200405 0.008713Total 24 0.246976
Coefficientstandard Erro t Stat P-value Lower 95%Upper 95%Lower 95.0%Upper 95.0%Intercept -0.003161 0.019885 -0.158967 0.875082 -0.044296 0.037974 -0.044296 0.037974X Variable 2.316796 1.002118 2.311901 0.030085 0.243758 4.389835 0.243758 4.389835
36 MONTH SUMMARY OUTPUT
Regression StatisticsMultiple R 0.357221R Square 0.127607Adjusted R 0.102681Standard E 0.101876Observatio 37
ANOVAdf SS MS F ignificance F
Regression 1 0.053135 0.053135 5.11952 0.02997Residual 35 0.363259 0.010379Total 36 0.416393
Coefficientstandard Erro t Stat P-value Lower 95%Upper 95%Lower 95.0%Upper 95.0%Intercept -0.008568 0.017512 -0.489254 0.627714 -0.044119 0.026983 -0.044119 0.026983X Variable 1.913319 0.845615 2.262636 0.02997 0.196629 3.63001 0.196629 3.63001
24 MONTH SUMMARY OUTPUT
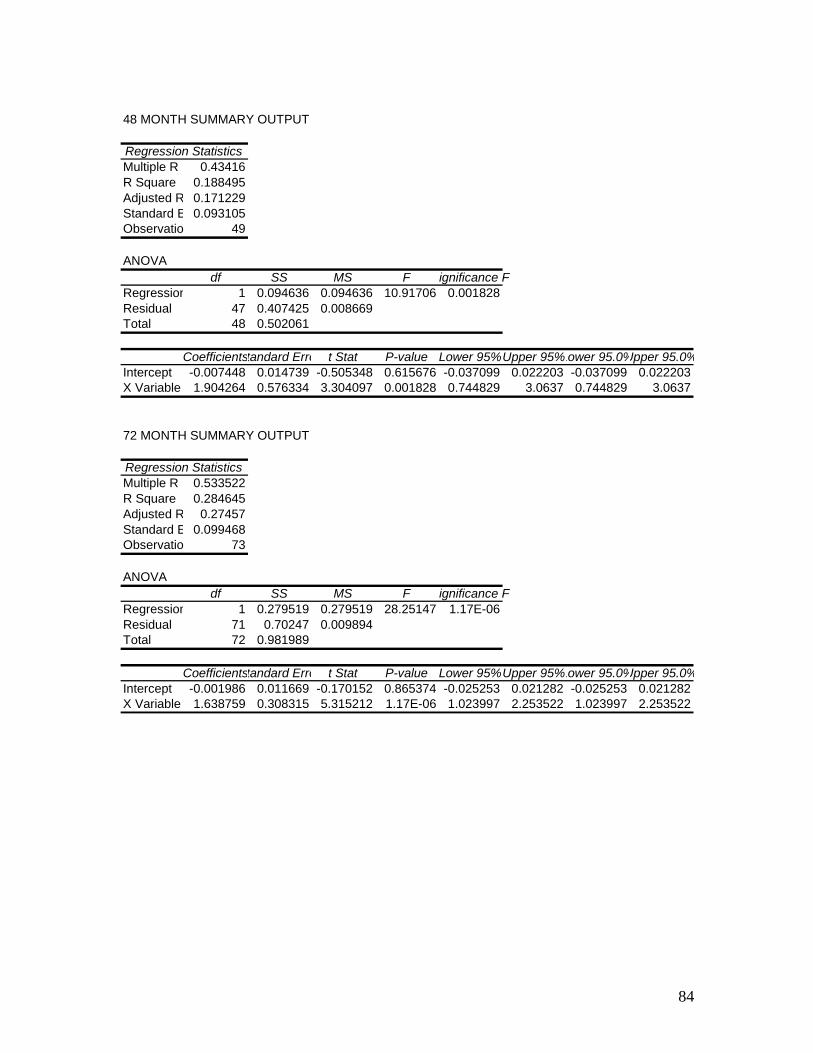
84
48 MONTH SUMMARY OUTPUT
Regression StatisticsMultiple R 0.43416R Square 0.188495Adjusted R 0.171229Standard E 0.093105Observatio 49
ANOVAdf SS MS F ignificance F
Regression 1 0.094636 0.094636 10.91706 0.001828Residual 47 0.407425 0.008669Total 48 0.502061
Coefficientstandard Erro t Stat P-value Lower 95%Upper 95%Lower 95.0%Upper 95.0%Intercept -0.007448 0.014739 -0.505348 0.615676 -0.037099 0.022203 -0.037099 0.022203X Variable 1.904264 0.576334 3.304097 0.001828 0.744829 3.0637 0.744829 3.0637
72 MONTH SUMMARY OUTPUT
Regression StatisticsMultiple R 0.533522R Square 0.284645Adjusted R 0.27457Standard E 0.099468Observatio 73
ANOVAdf SS MS F ignificance F
Regression 1 0.279519 0.279519 28.25147 1.17E-06Residual 71 0.70247 0.009894Total 72 0.981989
Coefficientstandard Erro t Stat P-value Lower 95%Upper 95%Lower 95.0%Upper 95.0%Intercept -0.001986 0.011669 -0.170152 0.865374 -0.025253 0.021282 -0.025253 0.021282X Variable 1.638759 0.308315 5.315212 1.17E-06 1.023997 2.253522 1.023997 2.253522

85
5 Year Regression
24 MONTH SUMMARY OUTPUT 5 Year
Regression StatisticsMultiple R 0.432468R Square 0.187028Adjusted R 0.151682Standard E 0.093251Observatio 25
ANOVAdf SS MS F ignificance F
Regression 1 0.046011 0.046011 5.291268 0.030842Residual 23 0.2 0.008696Total 24 0.246011
Coefficientstandard Erro t Stat P-value Lower 95%Upper 95%Lower 95.0%Upper 95.0%Intercept -0.006954 0.019865 -0.350042 0.729492 -0.048047 0.03414 -0.048047 0.03414X Variable 2.30282 1.001106 2.300276 0.030842 0.231874 4.373766 0.231874 4.373766
36 MONTH SUMMARY OUTPUT
Regression StatisticsMultiple R 0.355888R Square 0.126656Adjusted R 0.101704Standard E 0.101775Observatio 37
ANOVAdf SS MS F ignificance F
Regression 1 0.052576 0.052576 5.075856 0.030632Residual 35 0.362532 0.010358Total 36 0.415108
Coefficientstandard Erro t Stat P-value Lower 95%Upper 95%Lower 95.0%Upper 95.0%Intercept -0.011948 0.017494 -0.682936 0.499143 -0.047463 0.023568 -0.047463 0.023568X Variable 1.903237 0.844769 2.252966 0.030632 0.188264 3.61821 0.188264 3.61821
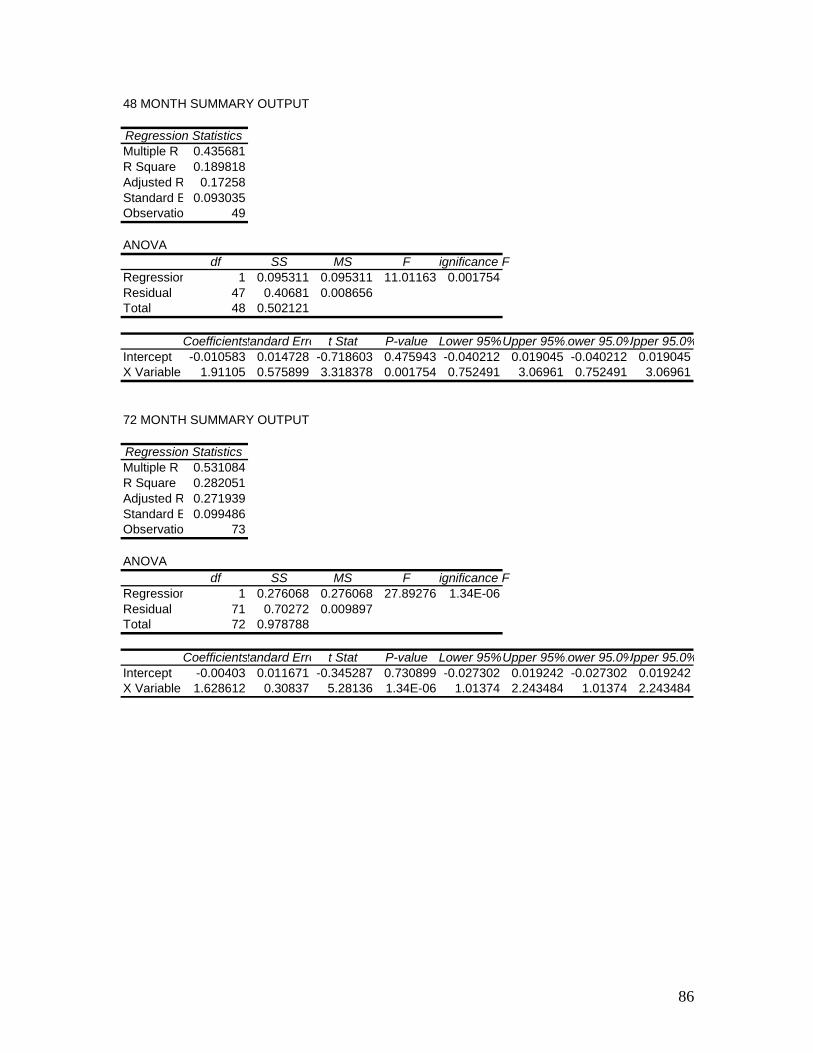
86
48 MONTH SUMMARY OUTPUT
Regression StatisticsMultiple R 0.435681R Square 0.189818Adjusted R 0.17258Standard E 0.093035Observatio 49
ANOVAdf SS MS F ignificance F
Regression 1 0.095311 0.095311 11.01163 0.001754Residual 47 0.40681 0.008656Total 48 0.502121
Coefficientstandard Erro t Stat P-value Lower 95%Upper 95%Lower 95.0%Upper 95.0%Intercept -0.010583 0.014728 -0.718603 0.475943 -0.040212 0.019045 -0.040212 0.019045X Variable 1.91105 0.575899 3.318378 0.001754 0.752491 3.06961 0.752491 3.06961
72 MONTH SUMMARY OUTPUT
Regression StatisticsMultiple R 0.531084R Square 0.282051Adjusted R 0.271939Standard E 0.099486Observatio 73
ANOVAdf SS MS F ignificance F
Regression 1 0.276068 0.276068 27.89276 1.34E-06Residual 71 0.70272 0.009897Total 72 0.978788
Coefficientstandard Erro t Stat P-value Lower 95%Upper 95%Lower 95.0%Upper 95.0%Intercept -0.00403 0.011671 -0.345287 0.730899 -0.027302 0.019242 -0.027302 0.019242X Variable 1.628612 0.30837 5.28136 1.34E-06 1.01374 2.243484 1.01374 2.243484
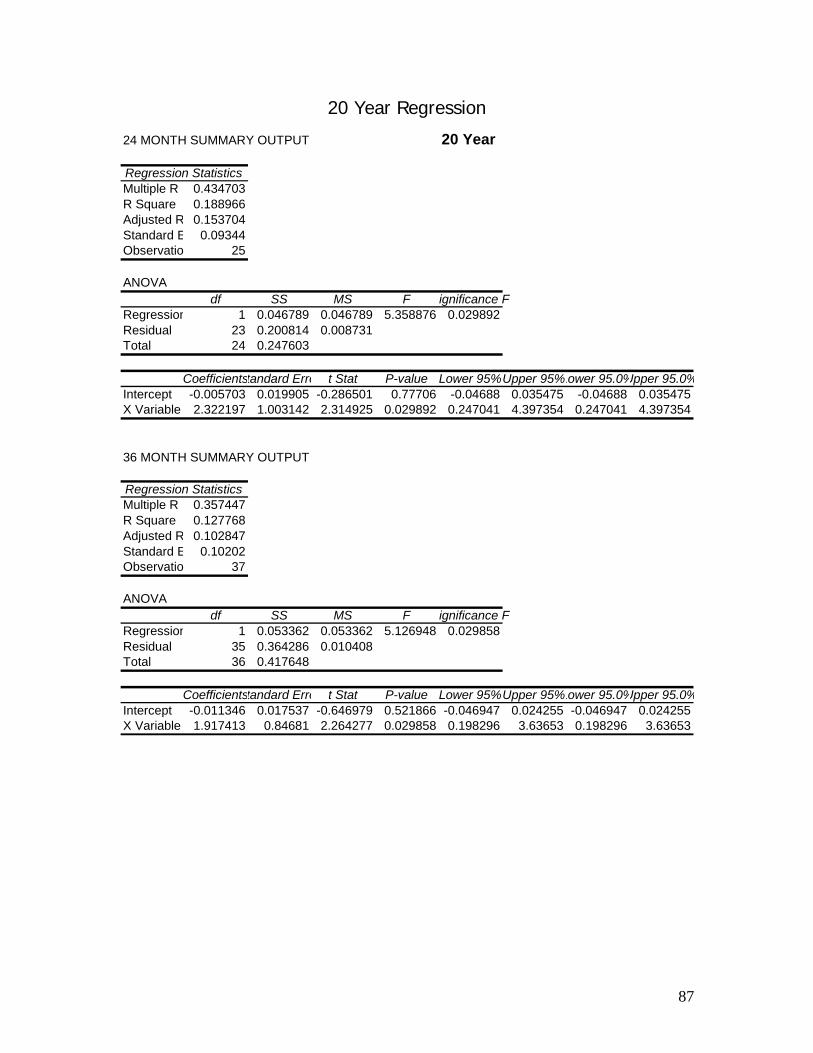
87
20 Year Regression
24 MONTH SUMMARY OUTPUT 20 Year
Regression StatisticsMultiple R 0.434703R Square 0.188966Adjusted R 0.153704Standard E 0.09344Observatio 25
ANOVAdf SS MS F ignificance F
Regression 1 0.046789 0.046789 5.358876 0.029892Residual 23 0.200814 0.008731Total 24 0.247603
Coefficientstandard Erro t Stat P-value Lower 95%Upper 95%Lower 95.0%Upper 95.0%Intercept -0.005703 0.019905 -0.286501 0.77706 -0.04688 0.035475 -0.04688 0.035475X Variable 2.322197 1.003142 2.314925 0.029892 0.247041 4.397354 0.247041 4.397354
36 MONTH SUMMARY OUTPUT
Regression StatisticsMultiple R 0.357447R Square 0.127768Adjusted R 0.102847Standard E 0.10202Observatio 37
ANOVAdf SS MS F ignificance F
Regression 1 0.053362 0.053362 5.126948 0.029858Residual 35 0.364286 0.010408Total 36 0.417648
Coefficientstandard Erro t Stat P-value Lower 95%Upper 95%Lower 95.0%Upper 95.0%Intercept -0.011346 0.017537 -0.646979 0.521866 -0.046947 0.024255 -0.046947 0.024255X Variable 1.917413 0.84681 2.264277 0.029858 0.198296 3.63653 0.198296 3.63653

88
48 MONTH SUMMARY OUTPUT
Regression StatisticsMultiple R 0.434888R Square 0.189128Adjusted R 0.171875Standard E 0.093222Observatio 49
ANOVAdf SS MS F ignificance F
Regression 1 0.095267 0.095267 10.96229 0.001792Residual 47 0.408448 0.00869Total 48 0.503715
Coefficientstandard Erro t Stat P-value Lower 95%Upper 95%Lower 95.0%Upper 95.0%Intercept -0.010196 0.014757 -0.690915 0.493017 -0.039884 0.019492 -0.039884 0.019492X Variable 1.910601 0.577058 3.310935 0.001792 0.74971 3.071491 0.74971 3.071491
72 MONTH SUMMARY OUTPUT
Regression StatisticsMultiple R 0.531246R Square 0.282223Adjusted R 0.272113Standard E 0.099589Observatio 73
ANOVAdf SS MS F ignificance F
Regression 1 0.276877 0.276877 27.91647 1.33E-06Residual 71 0.704182 0.009918Total 72 0.981059
Coefficientstandard Erro t Stat P-value Lower 95%Upper 95%Lower 95.0%Upper 95.0%Intercept -0.003847 0.011683 -0.329304 0.742896 -0.027143 0.019449 -0.027143 0.019449X Variable 1.630998 0.30869 5.283604 1.33E-06 1.015487 2.246509 1.015487 2.246509

89
Appendix-3 WACC
Weighted Average Cost of Capital
Vd/Vf (Kd) (1-T) + Ve/Vf (Ke)
268830/845947 (.0676) (1-.35) + 577117/845947 (.1203)
WACC = .096 = 9.6%

90
Appendix-4 Method of Comparables
2001 2002 2003 2004 2005 2006 2007CallawayPPS 19.15 13.25 16.85 13.5 13.84 14.41 16.17EPS 0.89 1.05 0.67 0.14 0.19 0.32 0.81EPS Growth 0.18 0.362 0.79 0.357 0.684BPS 8.23 8.79 8.49 8.51 7.89DPS 0.28 0.28 0.28 0.28 0.28Forward P/E 19.78 120.36 71.05 43.25 17.79Trailing P/E 21.52 12.62 25.15 96.43 72.84 45.03M/B 1.61 1.92 1.59 1.63 1.83D/P 0.021 0.017 0.021 0.02 0.02PEG 39.93 39.11 -53.87 53.48 54.92Price/Sales 0.017 0.021 0.014 0.014 0.014P/EBIT 11.83 24.78 -56.25 92.27 41.17P/EBITDA 19.2 36.63 -135 106.46 62.65P/FCF per share 12.22 -22.95 -35.52 25.9 -43.23Enterprise 11.41 17.28 -76.7 62.54 38.78
NikePPS 56.24 44.47 68.46 90.69 86.79 99.03 106.43EPS 1.29 1.25 0.9 1.8 2.32 0.36 0.71EPS Growth 0.031 0.28 1 0.289 0.845BPS 7.22 7.57 9.09 10.81 12.93DPS 0.25 0.31 0.43 0.53 0.65Trailing P/E 34.47 54.77 100.77 48.22 42.69Forward P/E 49.41 38.03 39.09 241.08 139.48M/B 6.16 9.04 9.98 8.03 7.66D/P 0.005 0.004 0.005 0.006 0.007PEG 19.28 106.98 0 29.23 266.81Price/Sales 0.004 0.006 0.007 0.006 0.006P/EBIT 4.37 6.1 6.25 4.67 4.62P/EBITDA 6.66 9.25 9.59 7.16 7.11P/FCF per share 30.37 51.1 45.78 37.41 129.68Enterprise 10.5 10.07 9.24 8.4 7.78
Method of Comparables

91
Adams PPS 0.38 0.25 0.71 1.4 1.2 1.97 2.00EPS 0.63 0.4 0.09 0.14 0.14 0.38 NAEPS Growth 0.365 0.775 0.556 0 1.71BPS 0.87 0.99 1.17 1.41 1.74DPS 0 0 0 0 0Trailing P/E -0.4 1.78 15.56 8.57 14.07Forward P/E 2.78 5.07 10.00 3.16 NAM/B 0.29 0.72 1.2 0.85 1.13D/P 0 0 0 0 0PEG 0.88 7.89 22.52 4.83 3.8Price/Sales 6.59 1.39 2.46 2.12 2.59P/EBIT -0.002 0.0003 0.043 0.036 0.054P/EBITDA -0.003 0.035 0.045 0.037 0.022P/FCF per share -1.62 4 5.3 -4.19 -54.88Enterprise -3.6 20.06 17.79 16.93 7.23
IndustryAverage Trailing P/E 17.035 28.275 58.165 28.395 28.38Average Forward P/E 26.09 21.55 24.55 122.12 NAD/P 0.0025 0.002 0.0025 0.003 0.0035M/B 3.225 4.88 5.59 4.44 4.395Average PEG 10.08 57.435 11.26 17.03 135.305
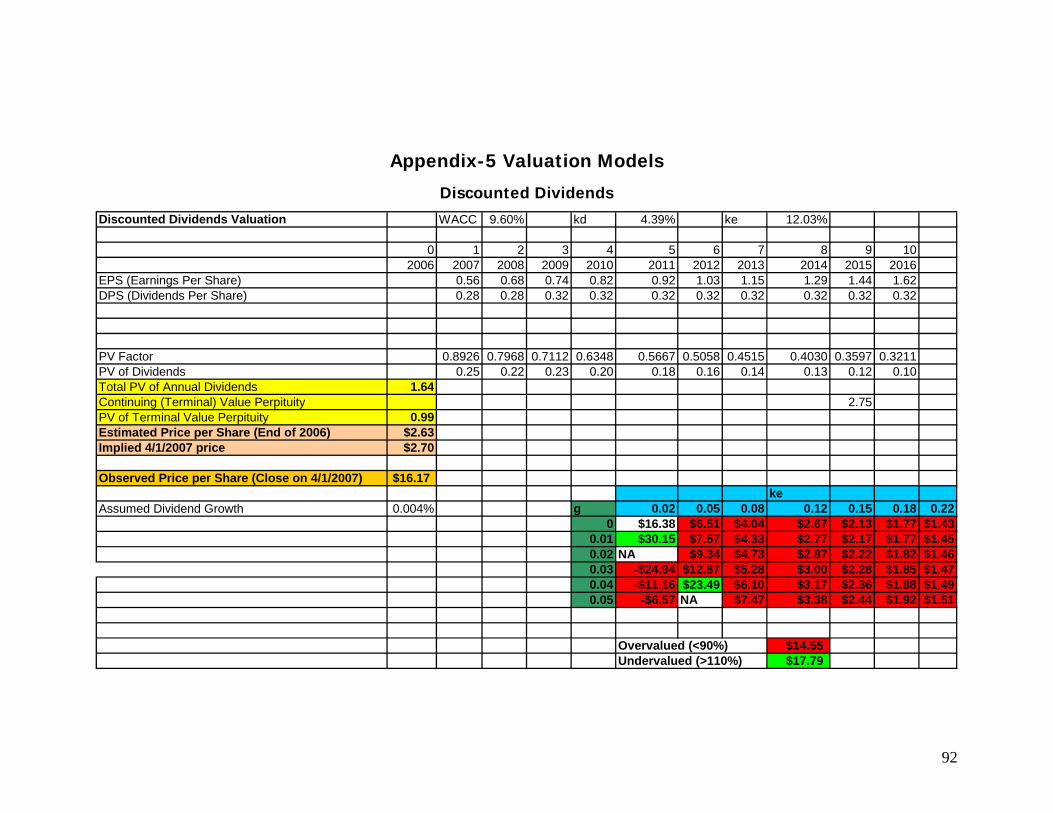
92
Appendix-5 Valuation Models
Discounted Dividends Discounted Dividends Valuation WACC 9.60% kd 4.39% ke 12.03%
0 1 2 3 4 5 6 7 8 9 102006 2007 2008 2009 2010 2011 2012 2013 2014 2015 2016
EPS (Earnings Per Share) 0.56 0.68 0.74 0.82 0.92 1.03 1.15 1.29 1.44 1.62DPS (Dividends Per Share) 0.28 0.28 0.32 0.32 0.32 0.32 0.32 0.32 0.32 0.32
PV Factor 0.8926 0.7968 0.7112 0.6348 0.5667 0.5058 0.4515 0.4030 0.3597 0.3211PV of Dividends 0.25 0.22 0.23 0.20 0.18 0.16 0.14 0.13 0.12 0.10Total PV of Annual Dividends 1.64Continuing (Terminal) Value Perpituity 2.75PV of Terminal Value Perpituity 0.99Estimated Price per Share (End of 2006) $2.63Implied 4/1/2007 price $2.70
Observed Price per Share (Close on 4/1/2007) $16.17ke
Assumed Dividend Growth 0.004% g 0.02 0.05 0.08 0.12 0.15 0.18 0.220 $16.38 $6.51 $4.04 $2.67 $2.13 $1.77 $1.43
0.01 $30.15 $7.57 $4.33 $2.77 $2.17 $1.77 $1.450.02 NA $9.34 $4.73 $2.87 $2.22 $1.82 $1.460.03 -$24.94 $12.87 $5.28 $3.00 $2.28 $1.85 $1.470.04 -$11.16 $23.49 $6.10 $3.17 $2.36 $1.88 $1.490.05 -$6.57 NA $7.47 $3.38 $2.44 $1.92 $1.51
Overvalued (<90%) $14.55Undervalued (>110%) $17.79

93
Free Cash Flows Free Cash Flows Valuation WACC (AT) 9.60% kd 4.39% ke 12.03%
0 1 2 3 4 5 6 7 8 9 102006 2007 2008 2009 2010 2011 2012 2013 2014 2015 2016
Cash From Operations 44,518 52,883 57,978 63,599 71,000 79,305 88,593 98,980 110,598 123,594 Cash From Investment 6332 -18571 -18582 -20681 -24191 -28551 -37044 -37032 -44848 -52515Free Cash Flows 50,850 34,312 39,396 42,918 46,809 50,754 51,549 61,948 65,750 71,079 72,000
PV Factor 0.9124 0.8325 0.7596 0.6930 0.6323 0.5769 0.5264 0.4803 0.4382 0.3998PV of Free Cash Flows 46,395.99 28,564.39 29,924.06 29,743.86 29,598.97 29,282.42 27,136.03 29,753.83 28,813.82 28,420.77 Total PV of Free Cash Flows 307,634.12 PV of Terminal Value Perpetuity 346,855.72 Value of Firm 654,489.84 867,469.88 Book Value of Liabilities 268,830.00 Estimated Market Value of Equity 385,659.84 Number of Shares 73,150 WACCEstimated Price Per Share (End of 2006) 5.27$ g 0.03 0.045 0.06 0.075 0.096 0.105 0.12Implied 4/1/2007 price 5.39$ -0.01 $26.77 7.77 $6.24 5.25 $4.34 $4.05 $3.66
0.015 $7.14 13.8 $9.41 7.22 $5.51 $5.03 $4.400.025 $79.83 20.43 $11.95 8.55 $6.21 $5.59 $4.81
Observed Price per Share (Close on 4/1/2007) $16.17 0.035 -$78.76 40.33 $16.51 10.56 $7.14 $6.31 $5.310.055 -$15.32 -39.26 $80.41 20.58 $10.36 $8.61 $6.77
WACC (AT) 0.096 0.07 -$9.38 -15.38 -$39.40 80.69 $16.03 $12.07 $8.64Terminal Growth 0.013
Overvalued (<90%) $14.55Undervalued (>110%) $17.79
Sensitivity Analysis

94
Residual Income
Residual Income Valuation WACC 9.60% kd 4.39% ke 12.03% Shares/O 73150
0 1 2 3 4 5 6 7 8 9 102006 2007 2008 2009 2010 2011 2012 2013 2014 2015 2016
Net Income $41,256 $49,507 $54,458 $59,903 $67,072 $75,143 $84,160 $94,259 $105,570 $118,239EPS (Earnings Per Share) 0.56 0.68 0.74 0.82 0.92 1.03 1.15 1.29 1.44 1.62Divends Paid $20,482 $20,482 $23,408 $23,408 $23,408 $23,408 $23,408 $23,408 $23,408 $23,408DPS (Dividends Per Share) 0.28 0.28 0.32 0.32 0.32 0.32 0.32 0.32 0.32 0.32BPS (Book Per Share) 7.89 8.17 8.57 8.99 9.49 10.09 10.80 11.63 12.60 13.72 15.02Book Value of Equity $577,117 $597,891 $626,916 $657,966 $694,461 $738,125 $789,860 $850,612 $921,463 $1,003,625 $1,098,456
EPS (Earnings Per Share) 0.56 0.68 0.74 0.82 0.92 1.03 1.15 1.29 1.44 1.62Normal Income 0.95 0.98 1.03 1.08 1.14 1.21 1.30 1.40 1.52Residual Income -0.39 -0.31 -0.29 -0.26 -0.23 -0.19 -0.15 -0.11 -0.07PV Factor 0.89 0.80 0.71 0.63 0.57 0.51 0.45 0.40 0.36PV of Residual Income -0.34 -0.24 -0.20 -0.17 -0.13 -0.09 -0.07 -0.04 -0.03 -0.03Total PV of Annual Residual Income -1.32 -21.21%Continuing (Terminal) Value Perpituity -0.22PV of Terminal Value Perpituity -0.08 -1.25%BPS (Book Value Equity per Share) 7.61 122.46% keEstimated Price per Share (End of 2006) $6.21 100.00% g 0.02 0.05 0.08 0.12 0.15 0.18 0.22Implied 4/1/2007 price $6.39 0.1 $3.33 $4.05 $3.12 $6.03 $4.52 $3.76 $3.00
0.2 $9.15 $8.62 $7.75 $6.60 $6.01 $6.49 $1.38Logical Test for Growth in Perpituity g 0 0.5 $12.06 $10.14 $8.41 $6.51 $5.37 $4.44 $3.46
0.8 $12.73 $10.44 $8.52 $6.50 $5.32 $4.37 $3.39Observed Price per Share (Close on 4/1/2007) $16.17 1 $12.95 $10.54 $8.56 $6.50 $5.31 $4.36 $3.38
Initial ke 12.03
Overvalued (<90%) $14.55Undervalued (>110%) $17.79

95
Long Run Residual Income Long Run Residual Income Valuation WACC 9.60% kd 4.39% ke 12.03% Shares O 73150
0 1 2 3 4 5 6 7 8 9 102006 2007 2008 2009 2010 2011 2012 2013 2014 2015 2016
Net Income $41,256 $49,507 $54,458 $59,903 $67,072 $75,143 $84,160 $94,259 $105,570 $118,239EPS (Earnings Per Share) 0.56 0.68 0.74 0.82 0.92 1.03 1.15 1.29 1.44 1.62Divends Paid $20,482 $20,482 $23,408 $23,408 $23,408 $23,408 $23,408 $23,408 $23,408 $23,408DPS (Dividends Per Share) 0.28 0.28 0.32 0.32 0.32 0.32 0.32 0.32 0.32 0.32Beginning BPS (Book Per Share) 7.89 8.17 8.57 9.00 9.49 10.09 10.80 11.63 12.60 13.72BPS (Book Per Share) 7.89 8.17 8.57 9.00 9.49 10.09 10.80 11.63 12.60 13.72 15.02Book Value of Equity $597,928 $626,953 $658,003 $694,498 $738,162 $789,897 $850,649 $921,500 $1,003,662 $1,098,493
ke 12.03%
ROE 6.90% 7.90% 8.28% 8.63% 9.09% 9.51% 9.89% 10.23% 10.52% 10.76%Growth in Book Value of Equity 3.60% 4.85% 4.95% 5.55% 6.29% 7.01% 7.69% 8.33% 8.92% 9.45%
Implied Long Run ROE 15.00% g 0.11 0.13 0.15 0.17 0.19Average ROE 9.17% 0.08 $26.34 $38.48 $50.63 $62.77 $74.92Average Growth in Book Value of Equity 6.66% 0.1 $10.55 $15.42 $20.28 $25.15 $30.01
0.1203 $6.56 $9.58 $12.61 $15.63 $18.66LRResInc Perp Value $12.26 0.14 $4.80 $7.01 $9.22 $11.44 $13.65Implied 4/1/2007 price $12.61 0.16 $3.77 $5.51 $7.25 $8.99 $10.73
Observed Price per Share (Close on 4/1/2007) $16.17Overvalued (<90%) $14.55Undervalued (>110%) $17.79
Sensitivity Analysis
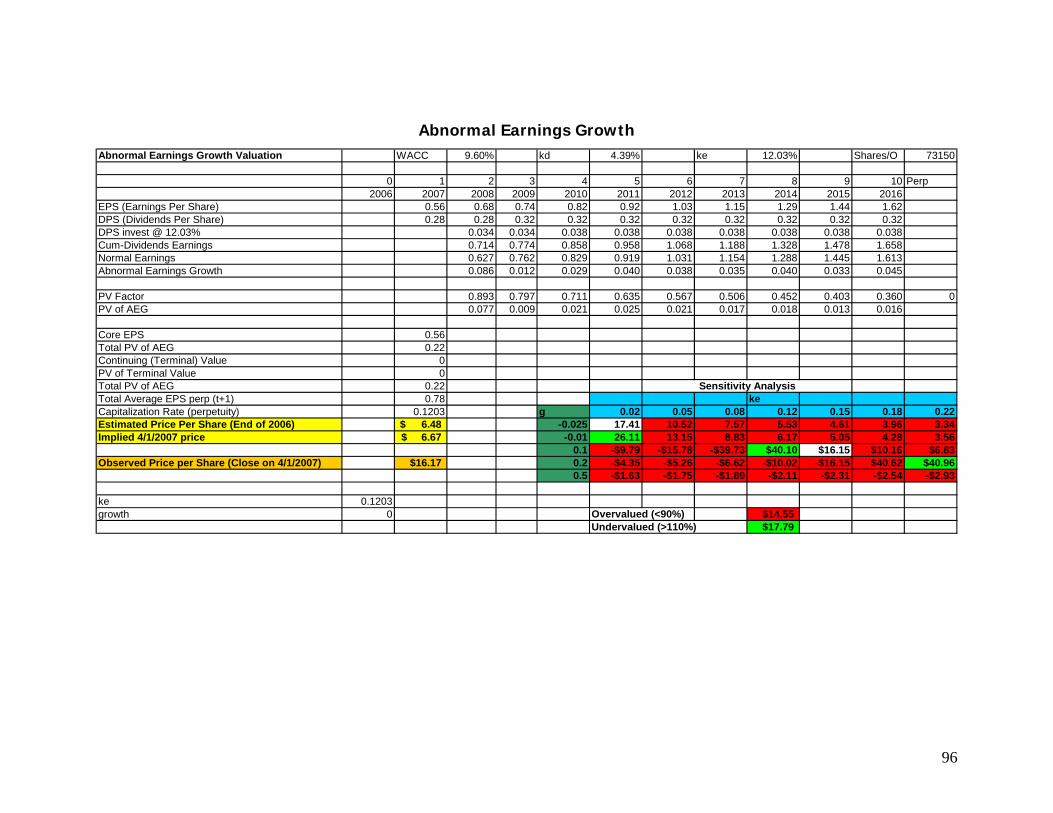
96
Abnormal Earnings Growth Abnormal Earnings Growth Valuation WACC 9.60% kd 4.39% ke 12.03% Shares/O 73150
0 1 2 3 4 5 6 7 8 9 10 Perp2006 2007 2008 2009 2010 2011 2012 2013 2014 2015 2016
EPS (Earnings Per Share) 0.56 0.68 0.74 0.82 0.92 1.03 1.15 1.29 1.44 1.62DPS (Dividends Per Share) 0.28 0.28 0.32 0.32 0.32 0.32 0.32 0.32 0.32 0.32DPS invest @ 12.03% 0.034 0.034 0.038 0.038 0.038 0.038 0.038 0.038 0.038Cum-Dividends Earnings 0.714 0.774 0.858 0.958 1.068 1.188 1.328 1.478 1.658Normal Earnings 0.627 0.762 0.829 0.919 1.031 1.154 1.288 1.445 1.613Abnormal Earnings Growth 0.086 0.012 0.029 0.040 0.038 0.035 0.040 0.033 0.045
PV Factor 0.893 0.797 0.711 0.635 0.567 0.506 0.452 0.403 0.360 0PV of AEG 0.077 0.009 0.021 0.025 0.021 0.017 0.018 0.013 0.016
Core EPS 0.56Total PV of AEG 0.22Continuing (Terminal) Value 0PV of Terminal Value 0Total PV of AEG 0.22Total Average EPS perp (t+1) 0.78 keCapitalization Rate (perpetuity) 0.1203 g 0.02 0.05 0.08 0.12 0.15 0.18 0.22Estimated Price Per Share (End of 2006) 6.48$ -0.025 17.41 10.52 7.57 5.53 4.61 3.96 3.34Implied 4/1/2007 price 6.67$ -0.01 26.11 13.15 8.83 6.17 5.05 4.28 3.56
0.1 -$9.79 -$15.78 -$39.73 $40.10 $16.15 $10.16 $6.83Observed Price per Share (Close on 4/1/2007) $16.17 0.2 -$4.35 -$5.26 -$6.62 -$10.02 -$16.15 $40.62 $40.96
0.5 -$1.63 -$1.75 -$1.89 -$2.11 -$2.31 -$2.54 -$2.93
ke 0.1203growth 0 Overvalued (<90%) $14.55
Undervalued (>110%) $17.79
Sensitivity Analysis

97
Appendix-6 Altman Z-Score
Total Assets 845947 Working Capital 269745 493200 223455 Retained Earnings 435074 EBIT 40419 Market Value of Equity 16.17 Book Value of Liabilities 268380 Sales 1017907 WC/TA RE/TA EBIT/TA MVE/BVL Sales/TA 0.31887 0.51430 0.04778 0.00006 1.20328 Multiple 1.2 1.4 3.3 0.6 1 0.382641 0.720026 0.157673 3.62E-05 1.203275 Altman Z-Score 2.46 1.2((493200-223455)/845947) + 1.4(435074/845947) + 3.3(40419/845947) + 0.6(16.17/268380) + 1(1017907/845947)=2.46
98
References
Callaway Golf Website: www.callawaygolf.com
Adam’s Golf Website: www.adamsgolf.com
Nike Website: www.nike.com
Yahoo Finance: http://finance.yahoo.com
Edgarscan, PWC: www.edgarscan.pwcglobal.com
Warranty Article: www.warrantyweek.com
St. Louis Federal Reserve Data Repository:
http://research.stlouisfed.org/fred2/
Palepu, Healy and Bernard, Business Analysis and Valuation (Ohio:
Thompson-Southwestern, 3rd edition, 2004)

99