Crustal Seismic Anisotropy in Southern California · Crustal Seismic Anisotropy in Southern...
31
II-114 | IRIS CORE PROPOSAL 2010 | VOLUME II | CRUSTAL STRUCTURE Crustal Seismic Anisotropy in Southern California Ryan Porter (University of Arizona), George Zandt (University of Arizona), Nadine McQuarrie (Princeton University) Understanding lower crustal deformational processes and the related features that can be imaged by seismic waves is an important goal in active tectonics and seismology. Using data from publicly available stations, we calculated teleseismic receiver functions to measure crustal anisotropy at 38 broadband seismic stations in southern California. Results reveal a signature of pervasive seismic anisotropy located in the lower crust that is consistent with the presence of schists emplaced during Laramide flat slab subduction. Anisotropy is identified in receiver functions by the large amplitudes and small move-out of the diagnostic converted phases. Within southern California, receiver functions from numerous stations reveal patterns indicative of a basal crustal layer of hexagonal anisotropy with a dipping symmetry axis. Neighborhood algorithm searches [Frederiksen et al., 2003] for depth and thickness of the anisotropic layer and the trend and plunge of the anisotropy symmetry (slow) axis have been com- pleted for the stations. e searches produced a wide range of results but a dominant SW-NE trend of the anisotropy symmetry axes emerged among the measurements. When the measurements were assigned to crustal blocks and restored to their pre-36 Ma locations and orientations using the reconstruction of McQuarrie and Wernicke [2005], the regional scale SW-NE trend became even more consistent (Fig. 1). is suggests that anisotropy predates Pacific-North American plate strike slip motion, though a small subset of the results can be attributed to NW-SE shearing that may be related to San Andreas transform motion (Fig 1). We interpret this dominant trend as a fossilized fabric within schists, created from a top-to-the-southwest sense of shear that existed along the length of coastal California during pre-transform, early Tertiary subduction. Comparison of receiver func- tion common conversion point stacks to seismic models from the active LARSE experiment shows a strong correlation between the location of anisotropic layers and “bright” reflectors from Fuis et al. [2007], further affirming these results (Fig. 2). References Frederiksen, A. W., H. Folsom, and G. Zandt (2003), Neighbourhood inversion of teleseismic Ps conversions for anisotropy and layer dip, Geophys. J. Int., 155(1), 200-212. Fuis, G. S., M. D. Kohler, M. Scherwath, U. ten Brink, H. J. A. Van Avendonk, and J. M. Murphy (2007), A comparison between the transpressional plate boundaries of the South Island, New Zealand, and southern California, USA: the Alpine and San Andreas Fault systems, in A Continental Plate Boundary: Tectonics at South Island, New Zealand, edited by D. Okaya, T. Stern and F. Davey, pp. 307-327, American Geophysical Union. McQuarrie, N., and B. P. Wernicke (2005), An animated tectonic reconstruction of southwestern North America since 36 Ma Geosphere, 1(3), 147–172. Acknowledgements: is work was funded by a grant from Southern California Earthquake Center and NSF EAR Earthscope Program award #0745588. Figure 2. Common Conversion Point (CCP) cross-section for southern California, overlain with results from the LARSE project (Fuis et al., 2007) to illustrate similarities. In the RF stack, red shading corre- sponds to positive polarity arrivals and blue to negative. The thick white line represents the RF Moho, while the thick black line represents the LARSE Moho. Thin white lines represent structures (i.e., top of potential shear zones) seen in RFs. The thin black lines represent reflectors interpreted as a decolle- ment in the LARSE cross-section and the thick black bodies represent the LARSE bright reflectors (Fuis et al., 2007). The thick vertical red line is the projection of the San Andreas fault. Figure 1. Map of station locations and unique anisotropy axis orientations at 36 Ma based on the reconstruction of McQuarrie and Wernicke (2005). Station color-coding corre- sponds to the crustal blocks. The large arrows show the best fitting block trend-lines rotated back to their orientation at 36 Ma. The rose diagram shows the number of stations with anisotropy trends within each 10° bin when rotated back to their 36 Ma orientations. Vectors show Early Tertiary Farallon-North America relative motion vectors.
Transcript of Crustal Seismic Anisotropy in Southern California · Crustal Seismic Anisotropy in Southern...

II-114 | IRIS CoRe PRoPoSal 2010 | Volume I I | CRuSTal STRuCTuRe
Crustal Seismic Anisotropy in Southern CaliforniaRyan Porter (University of Arizona), George Zandt (University of Arizona), Nadine McQuarrie (Princeton University)
Understanding lower crustal deformational processes and the related features that can be imaged by seismic waves is an important goal in active tectonics and seismology. Using data from publicly available stations, we calculated teleseismic receiver functionstomeasurecrustalanisotropyat38broadbandseismicstationsinsouthernCalifornia.ResultsrevealasignatureofpervasiveseismicanisotropylocatedinthelowercrustthatisconsistentwiththepresenceofschistsemplacedduringLaramideflatslabsubduction.Anisotropyisidentifiedinreceiverfunctionsbythelargeamplitudesandsmallmove-outofthediagnosticconvertedphases.WithinsouthernCalifornia,receiverfunctionsfromnumerousstationsrevealpatternsindicativeofabasalcrustallayerofhexagonalanisotropywithadippingsymmetryaxis.Neighborhoodalgorithmsearches[Frederiksenetal.,2003]fordepthandthicknessoftheanisotropiclayerandthetrendandplungeoftheanisotropysymmetry(slow)axishavebeencom-pletedforthestations.ThesearchesproducedawiderangeofresultsbutadominantSW-NEtrendoftheanisotropysymmetryaxesemergedamongthemeasurements.Whenthemeasurementswereassignedtocrustalblocksandrestoredtotheirpre-36Ma locations and orientations using the reconstruction of McQuarrie and Wernicke [2005], theregionalscaleSW-NEtrendbecameevenmoreconsistent(Fig.1).ThissuggeststhatanisotropypredatesPacific-NorthAmericanplatestrikeslipmotion,thoughasmallsubsetoftheresultscanbeattributedtoNW-SEshearingthatmayberelatedtoSanAndreastransformmotion(Fig1).Weinterpretthisdominanttrendasafossilizedfabricwithinschists,createdfromatop-to-the-southwestsenseofshearthatexistedalongthelengthofcoastalCaliforniaduringpre-transform,earlyTertiarysubduction.Comparisonofreceiverfunc-tioncommonconversionpointstackstoseismicmodelsfromtheactiveLARSEexperimentshowsastrongcorrelationbetweenthelocationofanisotropiclayersand“bright”reflectorsfrom Fuis et al.[2007],furtheraffirmingtheseresults(Fig.2).
References
Frederiksen,A.W.,H.Folsom,andG.Zandt(2003),NeighbourhoodinversionofteleseismicPsconversionsforanisotropyandlayerdip,Geophys. J. Int., 155(1),200-212.
Fuis,G.S.,M.D.Kohler,M.Scherwath,U.tenBrink,H.J.A.VanAvendonk,andJ.M.Murphy(2007),Acomparisonbetweenthetranspressionalplate boundaries of the South Island, New Zealand, and southern California, USA: the Alpine and San Andreas Fault systems, in A Continental PlateBoundary:TectonicsatSouthIsland,NewZealand,editedbyD.Okaya,T.SternandF.Davey,pp.307-327,AmericanGeophysicalUnion.
McQuarrie,N.,andB.P.Wernicke(2005),AnanimatedtectonicreconstructionofsouthwesternNorthAmericasince36MaGeosphere, 1(3),147–172.
Acknowledgements:ThisworkwasfundedbyagrantfromSouthernCaliforniaEarthquakeCenterandNSFEAREarthscopeProgramaward#0745588.
figure 2. Common Conversion Point (CCP) cross-section for southern California, overlain with results from the laRSe project (fuis et al., 2007) to illustrate similarities. In the Rf stack, red shading corre-sponds to positive polarity arrivals and blue to negative. The thick white line represents the Rf moho, while the thick black line represents the laRSe moho. Thin white lines represent structures (i.e., top of potential shear zones) seen in Rfs. The thin black lines represent reflectors interpreted as a decolle-ment in the laRSe cross-section and the thick black bodies represent the laRSe bright reflectors (fuis et al., 2007). The thick vertical red line is the projection of the San andreas fault.
figure 1. map of station locations and unique anisotropy axis orientations at 36 ma based on the reconstruction of mcQuarrie and Wernicke (2005). Station color-coding corre-sponds to the crustal blocks. The large arrows show the best fitting block trend-lines rotated back to their orientation at 36 ma. The rose diagram shows the number of stations with anisotropy trends within each 10° bin when rotated back to their 36 ma orientations. Vectors show early Tertiary farallon-north america relative motion vectors.

IRIS CoRe PRoPoSal 2010 | Volume I I | CRuSTal STRuCTuRe | I I -115
Adjoint Tomography of the Southern California CrustCarl Tape (Harvard University), Qinya Liu (University of Toronto), Alessia Maggi (University of Strasbourg), Jeroen Tromp (Princeton University)
Weiterativelyimprovea3DtomographicmodelofthesouthernCaliforniacrustusingnumericalsimulationsofseismicwavepropagationbasedonaspectral-elementmethod(SEM)incombinationwithanadjointmethod.Theinitial3Dmodelispro-videdbytheSouthernCaliforniaEarthquakeCenter.Thedatasetcomprisesthree-componentseismicwaveforms(i.e.bothbodyandsurfacewaves),filteredovertheperiodrange2-30s,from143localearthquakesrecordedbyanetworkof203stations.TimewindowsformeasurementsareautomaticallyselectedbytheFLEXWINalgorithm.Themisfitfunctioninthetomographicinver-sion is based on frequency-dependent multitaper traveltime differences. The gradient of the misfit function and related finite-frequency sensitivity kernels for each earthquake are computed using an adjoint technique. The kernels are combined using a source subspace projection method to compute a model update at each iteration of a gradient-based minimization algorithm. The inversioninvolved16iterations,whichrequired6800wavefieldsimulations.Thenewcrustalmodel,m16,isdescribedintermsofindependentshear(Vs)andbulk-sound(Vb)wavespeedvariations.Itexhibitsstrongheterogeneity,includinglocalchangesof+/-30percentwithrespecttotheinitial3Dmodel.Themodelrevealsseveralfeaturesthatrelatetogeologicalobservations,suchas sedimentary basins, exhumed batholiths, and contrasting lithologies across faults. The quality of the new model is validated by quantifyingwaveformmisfitsoffull-lengthseismogramsfrom91earthquakesthatwerenotusedinthetomographicinversion.The new model provides more accurate synthetic seismograms that will benefit seismic hazard assessment.
References
Tape,C.,Liu,Q.,Maggi,A.,Tromp,J.,2009,AdjointtomographyofthesouthernCaliforniacrust,Science, 325,988–992.
Tape,C.,Liu,Q.,Maggi,A.,Tromp,J.,2010,SeismictomographyofthesouthernCaliforniacrustbasedonspectral-elementandadjointmeth-ods, Geophys. J. Int., 180,433-462.
Maggi,A.,Tape,C.,Chen,M.,Chao,D.,Tromp,J.,2009,Anautomatedtime-windowselectionalgorithmforseismictomography,Geophys. J. Int., 178,257–281.
Acknowledgements:SeismicwaveformswereprovidedbythedatacenterslistedinTable2(IRIS,SCEDC,NCEDC).AllearthquakesimulationswereperformedontheCITerraDellclusterattheDivisionofGeological&PlanetarySciences(GPS)oftheCaliforniaInstituteofTechnology.WeacknowledgesupportbytheNationalScienceFoundationundergrantEAR-0711177.ThisresearchwassupportedbytheSouthernCaliforniaEarthquakeCenter.SCECisfundedbyNSFCooperativeAgreementEAR-0106924andUSGSCooperativeAgreement02HQAG0008.
Iterative improvement of a three-component seis-mogram. (a) Cross section of the Vs tomographic models for a path from a mw 4.5 earthquake (star) on the White Wolf fault to station Dan (triangle) in the eastern mojave Desert. upper right is the initial 3D model, m00; lower right is the final 3D model, m16; and lower left is the difference between the two, ln(m16/m00). faults labeled for reference are San andreas (Sa), Garlock (G), and Camp Rock (CR). (b) Iterative three-component seismogram fits to data for models m00, m01, m04, and m16. also shown are synthetic seismograms computed for a standard 1D model. Synthetic seismograms (red) and recorded seismograms (black), filtered over the period range 6 to 30 s. left column, vertical component (Z); center column, radial component (R); right column, transverse component (T). Inset “DT” label indicates the time shift between the two windowed records that provides the maximum cross-correlation.

II-116 | IRIS CoRe PRoPoSal 2010 | Volume I I | CRuSTal STRuCTuRe
Nature of Crustal Terranes and the Moho in Northern Costa Rica from Receiver Function AnalysisLepolt Linkimer (Department of Geosciences, University of Arizona), Susan L. Beck (Department of Geosciences, University of Arizona), Susan Y. Schwartz (Department of Earth and Planetary Sciences, University of California), George Zandt (Department of Geosciences, University of Arizona), Vadim Levin (Department of Earth and Planetary Sciences, Rutgers University)
The Central American subduction zone in northern Costa Rica shows along-strike variations in both the incoming and overridingplates.ByanalyzingthesubductingoceanicMoho(M1)andtheupperplateMoho(M2)withreceiverfunctions,weinvestigatethevariabilityinthehydrationstateofthesubductingCocosPlateandthenatureofcrustalterraneswithintheoverridingCaribbeanPlate.Wecalculatehigh-qualityP-andPP-wavereceiverfunctionsusingbroadbanddataoftheGlobalSeismologyNetwork,GeoscopeProject,andtheCRSEIZE,Pocosol,andCorisubmodexperiments.Inaddition,weestimatethedepth(H)andverticallyaveragedVp/Vs(k)toMohoandpresentasensitivitystudytoexploretheeffectsofadippinginterfaceonreceiverfunctionsandtheHandkestimates.OurresultsareconsistentwithadrieroceanicmantlesubductingbeneaththesouthernmostpartoftheNicoyaPeninsula,ascomparedtoaserpentinizedoceanicmantlesubductingbeneaththenorthernpart.IntheCaribbeanPlate,wedescribethenatureoftheMesquito,Nicoya,andChorotegaterranesbyintegratingnewandpublishedVp/Vsestimates.BoththeNicoyaandChorotegaterranesdisplayhighVp/Vs(1.80-1.92)consistentwiththeiroce-aniccharacter.Incontrast,theoceanicMesquitoTerranemostlydisplayslowerVp/Vs(1.62-1.80)morecompatiblewithconti-nentalcrust,whichmayindicatethatsubductionzonemagmatismismodifyingthecrusttodisplaycontinentalcharacter(seeFigure).OurestimatesshowthatthedeepestM2(~42km)isobservedinthevolcanicarcregionwhereastheshallowestM2(~27-33km)isobservedinpartsofthefore-arcandback-arcregions.
References
DeShon, H. R., and S. Y. Schwartz(2004),Evidenceforserpentinizationof the forearc mantle wedge along the Nicoya Peninsula, Costa Rica,Geophys. Res. Lett., 31,L21611.
MacKenzie, L., G. A. Abers, K. M.Fischer,E.M.Syracuse,J.M.Protti,V.Gonzalez,andW.Strauch(2008),Crustal structure along the south-ern Central American volcanic front, Geochem. Geophys. Geosyst., 9, Q08S09.
Sallarès, V., J. J. Dañobeitia, and E. R.Flueh(2001),Lithosphericstructureof the Costa Rican Isthmus: Effects of subduction zone magmatism on an oceanic plateau, J. Geophys. Res., 106(B1),621-643.
Acknowledgements: Data from sta-tions JTS, HDC, and CRSEIZE (inpart) were obtained from the DataManagement Center via IRIS. Thanks toS.HusenandV.Maurerformak-ing the CORISUBMOD data avail-able. Partial funding was providedbyNSFgrantsEAR0510966(S.BeckandG.Zandt) andEAR0506463 (S.Schwartz).
Generalized interpretation of terrane boundaries at surface (a) and along the X-Y cross-section (b) integrating results from this study, DeShon and Schwartz [2004], macKenzie et al. [2008], and Sallarès et al. [2001].
IRIS CoRe PRoPoSal 2010 | Volume I I | CRuSTal STRuCTuRe | I I -117
Crustal Structure of the High Lava Plains of Oregon: A Large Controlled-Source ExperimentCatherine Cox (University of Oklahoma), Randy Keller (University of Oklahoma)
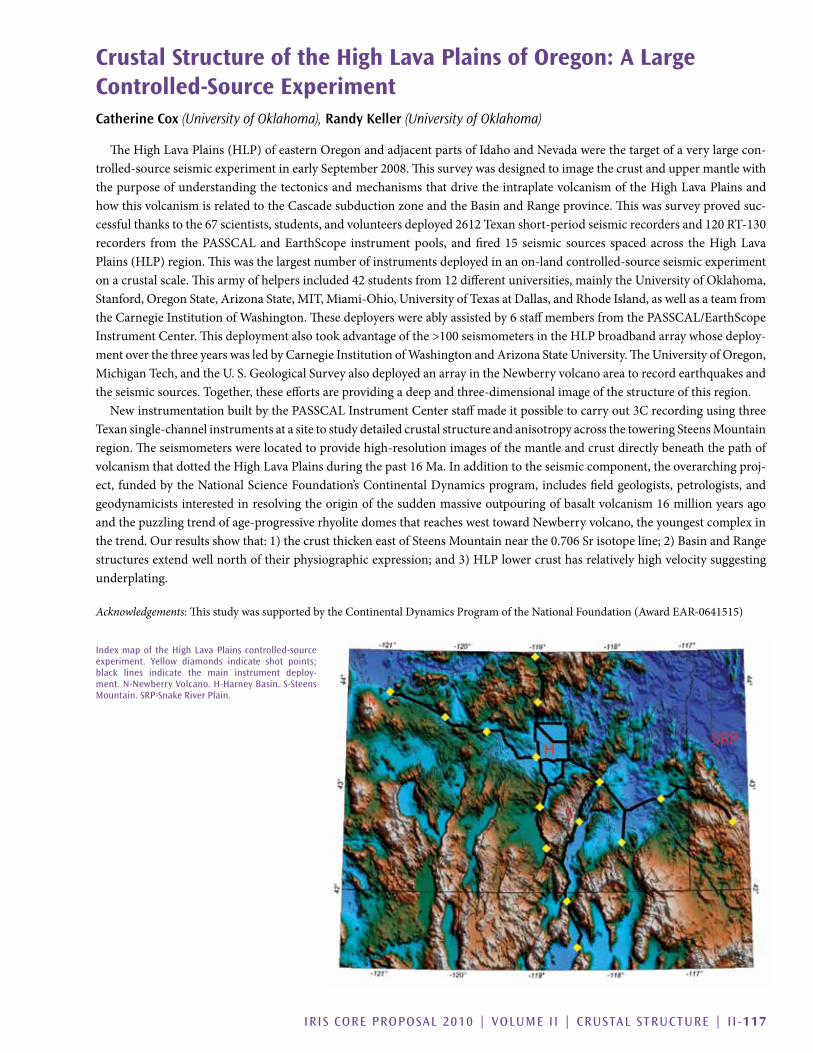
TheHighLavaPlains(HLP)ofeasternOregonandadjacentpartsofIdahoandNevadawerethetargetofaverylargecon-trolled-sourceseismicexperimentinearlySeptember2008.ThissurveywasdesignedtoimagethecrustanduppermantlewiththepurposeofunderstandingthetectonicsandmechanismsthatdrivetheintraplatevolcanismoftheHighLavaPlainsandhowthisvolcanismisrelatedtotheCascadesubductionzoneandtheBasinandRangeprovince.Thiswassurveyprovedsuc-cessfulthankstothe67scientists,students,andvolunteersdeployed2612Texanshort-periodseismicrecordersand120RT-130recorders from thePASSCALandEarthScope instrumentpools, andfired15 seismic sources spacedacross theHighLavaPlains(HLP)region.Thiswasthelargestnumberofinstrumentsdeployedinanon-landcontrolled-sourceseismicexperimentonacrustalscale.Thisarmyofhelpersincluded42studentsfrom12differentuniversities,mainlytheUniversityofOklahoma,Stanford,OregonState,ArizonaState,MIT,Miami-Ohio,UniversityofTexasatDallas,andRhodeIsland,aswellasateamfromtheCarnegieInstitutionofWashington.Thesedeployerswereablyassistedby6staffmembersfromthePASSCAL/EarthScopeInstrumentCenter.Thisdeploymentalsotookadvantageofthe>100seismometersintheHLPbroadbandarraywhosedeploy-mentoverthethreeyearswasledbyCarnegieInstitutionofWashingtonandArizonaStateUniversity.TheUniversityofOregon,MichiganTech,andtheU.S.GeologicalSurveyalsodeployedanarrayintheNewberryvolcanoareatorecordearthquakesandtheseismicsources.Together,theseeffortsareprovidingadeepandthree-dimensionalimageofthestructureofthisregion.
NewinstrumentationbuiltbythePASSCALInstrumentCenterstaffmadeitpossibletocarryout3CrecordingusingthreeTexansingle-channelinstrumentsatasitetostudydetailedcrustalstructureandanisotropyacrossthetoweringSteensMountainregion. The seismometers were located to provide high-resolution images of the mantle and crust directly beneath the path of volcanismthatdottedtheHighLavaPlainsduringthepast16Ma.Inadditiontotheseismiccomponent,theoverarchingproj-ect, funded by the National Science Foundation’s Continental Dynamics program, includes field geologists, petrologists, and geodynamicistsinterestedinresolvingtheoriginofthesuddenmassiveoutpouringofbasaltvolcanism16millionyearsagoand the puzzling trend of age-progressive rhyolite domes that reaches west toward Newberry volcano, the youngest complex in thetrend.Ourresultsshowthat:1)thecrustthickeneastofSteensMountainnearthe0.706Srisotopeline;2)BasinandRangestructuresextendwellnorthoftheirphysiographicexpression;and3)HLPlowercrusthasrelativelyhighvelocitysuggestingunderplating.
Acknowledgements:ThisstudywassupportedbytheContinentalDynamicsProgramoftheNationalFoundation(AwardEAR-0641515)
Index map of the High lava Plains controlled-source experiment. Yellow diamonds indicate shot points; black lines indicate the main instrument deploy-ment. n-newberry Volcano. H-Harney basin. S-Steens mountain. SRP-Snake River Plain.

II-118 | IRIS CoRe PRoPoSal 2010 | Volume I I | CRuSTal STRuCTuRe
Shear Velocity Images of the Cascadia ETS Source RegionJosh A. Calkins (Lamont-Doherty Earth Observatory), Geoffrey A. Abers (Lamont-Doherty Earth Observatory), Göran Ekström (Lamont-Doherty Earth Observatory), Kenneth C. Creager (University of Washington), Stéphane Rondenay (Massachusetts Institute of Technology)
High-resolution3Dshearvelocity(Vs)imagesofthewesternWashingtonlithosphererevealstructuralsegmentationaboveandbelowtheplateinterfacecorrelatingwithtransientdeformationpatterns.Usingaspectraltechnique[Ekströmetal,2009],we extracted phase velocities from cross-correlated ambient noise recorded by the densely spaced “CAFE” Earthscope FlexArray. The spectral approach resolves shear velocities at station offsets less than 1wavelength, significantly shorter than typicallyobtainedbystandardgroup-velocityapproaches,increasingthenumberofuseablepathsandresolution.TomographicimagesclearlyilluminatethehighVs(>4.5km/sec)subductingslabmantle.ThemostprominentanomalyisazoneoflowVs(3.0-3.3km/sec)inthemidtolowercontinentalcrust,directlyabovetheportionoftheslabexpectedtobeundergoingdehydrationreactions.Thislowvelocityzone(LVZ),whichismostpronouncedbeneaththeOlympicPeninsula,coversanareabothspatiallycoincidentwithandupdipoftheregionofmostintenseepisodictremorandslip(ETS).ThelowVsandcomparisonwithpub-lishedP-wavevelocitymodelsindicatethatVp/Vsratiosinthisregionaregreaterthan1.9,suggestingafluidrichlowercrust.TheLVZdisappearssouthward,near47°N,coincidentwithsharpdecreasesinintraslabseismicityandETSactivityaswellasstructuralchangesintheslab.Thespatialcoincidenceofthesefeaturessuggeststhatlong-termfluid-fluxingoftheoverridingplate via dewatering of a persistently hydrated patch of the Juan de Fuca slab may partially control slip on the plate interface and impact the rheology of the overriding continental crust.
References
AbersG.A.,L.S.Mackenzie,S.Rondenay,Z.Zhang,A.G.Wech,andK.C.Creager,2009.ImagingthesourceregionofCascadiatremorandintermediated-depth earthquakes. Geology, 37,1119-1122.
Calkins,J.A.,G.A.Abers,G.Ekstrom,K.C.Creager,andS.Rondenay.ShallowstructureoftheCascadiasubductionzonebeneathwesternWashingtonfromspectralambientnoisecorrelation.Submittedto J. Geophys. Res.,2010.
Ekström,G.,G.A.Abers,andS.C.Webb,2009.Determinationofsurface-wavephasevelocitiesacrossUSArrayfromnoiseandAki’sspectralformulation. Geophys. Res. Lett., 36,L18301.
Acknowledgements:ThisworkwasfundedbytheNationalScienceFoundationgrantEAR-0544847.
Results and interpretation of shear velocity imaging of Western Washington from spectral ambient noise analysis. Shaded relief map in the background shows PaSSCal stations (black circles), locations of major cities and topo-graphic features, and the depth to the sub-ducting slab in km (black lines and numbers, from mcCrory et al, 2004). upper panel shows shear velocity profile along line b-b’, highlight-ing the low Vs zone in the north american plate directly above the portion of the sub-ducting Juan de fuca slab (thick black line, after abers et al, 2009) expected to be under-going dehydration reactions. lower right panel is a cartoon illustrating the main features of the Vs model near the center of the Cafe array and possible interpretations.

IRIS CoRe PRoPoSal 2010 | Volume I I | CRuSTal STRuCTuRe | I I -119
Controlled Source Seismic Experiments in Northern ChinaRandy Keller (University of Oklahoma), Gao Rui (Chinese Academy of Geological Sciences)
SinoProbeisChina'sambitiousnationaljointearthscienceresearchprojectthatwasestablishedtodevelopacomprehen-siveunderstandingofthedeepinteriorbeneaththeChinesecontinent.AsoneoftheeightmajorprogramswithinSinoProbe,SinoProbe-02initiatedalarge-scalecontrolled-sourceseismicexperimentinNorthChinaundertheleadershipoftheChineseAcademyofGeologicalSciences(CAGS)oftheMinistryofLandandResources(MLR)incooperationwiththeUniversityofOklahomaandUniversityofMissouri-Columbia.ThisexperimentwasconductedinDecemberof2009,andconsistedofthreecoordinatedseismicrecordingeffortsalongaprofilethatextendedfromnearBeijingnorthwestwardtotheMongolianborder.TheprofilebeganneartheeasternedgeoftheWesternBlockoftheNorthChinaPrecambriancraton,crossedthisfeaturetotheSolonkersuturezone,andendedintheCentralAsianorogenicbelt(CAOB)(Fig.1).
TheCAOBisoneoftheworld'smostprominentsitesofformationjuvenilePhanerozoiccrust.InthesouthernsegmentoftheCAOB,theSolonkersuturezonewasinvolvedinthefinalclosureofthepaleo–AsianOceanandamalgamationoftheNorthChina craton and Mongolian arc terranes. South of the Solonker suture zone, the zone of seismicity around the city of Zhangbei ismostseismicallyactiveregioninnorthChinaandincludesthe19January1998Zhangbeiearthquakethatclaimed~50livesand caused severe damage.
Theexperimentemployedacombinationof2-Dseismicreflectionimagingandrefraction/wide-anglereflectionmethods.Theseismicreflectionprofileusedexplosivesourceseachrecordedat600-1200locationsfor30secondstocreateacommon-midpoint(CMP)stackedimage.Fortherefraction/wide-anglereflectionportionoftheexperiment,8largeshotswerefiredandrecordedinseveralcasestodistancesof200km.Themainseismicmonitoringsystememployedwasthesingle-channelRefTek125(“Texan”)recorderfromthePASSCAL/UTEPinstrumentpool.Alongtheprofile,4deploymentsof300Texaninstrumentswereplaceda~1kmintervals(indexmap,sky-blueline).Inaddition,120supplementary,3-componentrecordingsystemsweredeployedaspartofthereflectiondatarecordingsystem(indexmap,yellowline).
Acknowledgements:TheauthorsacknowledgeChinaNSFgrants40830316andthesupportofSinoprobe-02.Wealsothankthefollowingpar-ticipantsfromUSA:GalenKaip,StephenHolloway,StevenHarder,JeffersonChang,CatherineCoxwhowerefundedbyaUSNSFPIREgrant(0730154).
Index map of the Sinoprobe-2 reflection (black line) and refraction (yellow and blue lines) profiles. Caob-Central asian orogenic belt; SS-Solonker suture zone; nCC-north China Craton. Red circles are epicenters.

II-120 | IRIS CoRe PRoPoSal 2010 | Volume I I | CRuSTal STRuCTuRe
Radial Anisotropy in the Deep Crust beneath the western US Caused by ExtensionMorgan Moschetti (US Geological Survey), Michael Ritzwoller (Univ. of Colorado), Fan-Chi Lin (Univ. of Colorado), Yingjie Yang (Univ. of Colorado)
Although laboratory experiments have established that crustal rocks can be strongly anisotropic, the evidence for crustal anisotropy across large regions of the western US has not previously been documented. Surface wavescanbeusedtoidentifycrustalradialanisotropy(VSH!=VSV),buttheshortperiod(<20s)surfacewavedispersionmeasurementsthatarepre-dominantly sensitive to crustal velocity structure are largely missing from distant earthquake signals because of scattering and attenuation. The devel-opment of noise interferometry methods now allows the measurement of surfacewavedispersionattheseshorterperiods.BecauseLoveandRayleighwavesarepredominantlysensitivetoVSHandVSV,respectively,thesimul-taneous inversion of these measurements allows us to investigate the effects ofcrustalradialanisotropy.We invertRayleighandLovewavedispersionmeasurements from ambient noise and earthquake tomography for a radi-ally anisotropic shear-velocity model of the crust and uppermost mantle beneaththewesternUS(Moschettietal.,2010a,2010b).WheretheEarthexhibits radially anisotropic properties, the effect of inverting for an isotro-picmodelresultsinacharacteristicdatamisfittermedthe"Rayleigh-Lovediscrepancy" forwhich the predictedRayleigh and Lovewave speeds arefaster and slower, respectively, than the observed surface wave speeds. An isotropicmodelresultsinlargeRayleigh-LovediscrepanciesacrossmostofthewesternUS.WefindthatamodelwithananisotropicuppermostmantlealsoresultsinaRayleigh-Lovediscrepancyatperiodsthataremainlysensi-tive to crustal depths, but that the discrepancy is generally restricted to the BasinandRange(BR)andtheRockyMountainBR(RMBR)provinces.Theintroduction of radial anisotropy in the deep crust resolves this discrepancy atallbutafew,smallregionsinthewesternUS.Withinthosegeologicprov-inces that have experienced significant extension during the Cenozoic Era (~65Ma),crustalanisotropyisoftenrequiredtoresolvetheRayleigh-Lovediscrepancy. Radial and azimuthal anisotropy in the upper mantle are gen-erally ascribed to the alignment of olivine, and we similarly propose that the deep crustal anisotropy is caused by the alignment of anisotropic crustal minerals during crustal extension. This observation also supports the hypothesis that the response of the deep crust to crustal thinning is widespread within the extensional provinces.
References
Moschetti,M.P.,M.H.Ritzwoller,F.Lin,Y.Yang(2010a)Seismicevidenceforwidespreadwestern-USdeep-crustaldeformationcausedbyextension, Nature, 464,885-889.
Moschetti,M.P.,M.H.Ritzwoller,F.Lin,Y.Yang(2010b)Crustalshear-wavevelocitystructureofthewesternUSinferredfromambientseis-mic noise and earthquake data, J. Geophys. Res.(Inpress)
Acknowledgements: Research support from the National Science Foundation (NSF) (EAR-0450082 and EAR-0711526) and an NDSEGFellowshipfromtheAmericanSocietyforEngineeringEducationtoM.P.M.areacknowledged.ThefacilitiesoftheIRISDataManagementSystem, and specifically the IRIS Data Management Center, were used to access the waveform and metadata required in this study.
Crustal radial anisotropy (%)0 1 2 3 4 5
amplitude of crustal radial anisotropy in the middle and lower crust. Strong anisotropy is mainly restricted to the predominant extensional provinces (basin and Range, Rocky mountain basin and Range, and omineca extended belt) of the western uS.

IRIS CoRe PRoPoSal 2010 | Volume I I | CRuSTal STRuCTuRe | I I -121
Structural Interpretations Based on a 3D Seismic Survey in Hawthorne, NevadaAnnie Kell-Hills (Nevada Seismological Laboratory)
Hawthorne,NevadaislocatedintheWalkerLakeDomainoftheGreatBasin,aregioninthewesternUnitedStatesknownforextensional tectonics and the high temperature gradients necessary for geothermal power production. Geothermal heat sources include magmatic and extensional types. The extensional type is more common for Nevada, where near-surface thermal gra-dients come from a thinned crust instead of from volcanism. Extensional systems often do not exhibit surface indicators such asspringsorfumaroles;rather,thethermalfluidsremaincappedbelowthesurfacein“blind”systemsrequiringtheneedforgeophysical exploration [Coolbaugh et al., 2005].Heterogeneousstructureandseismicvelocitiescommontogeothermalsys-tems create particular seismic imaging difficulties because simplifying assumptions about velocity gradients cannot be made. A 3dseismicvolumecollectedbytheNavyGeothermalProgramsOfficeontheHawthorneAmmunitionDepotrepresentsarareopportunitytoexaminetherangeofgeologicinterpretationsthatcanexistonseismicdataintheGreatBasin.Strongreflec-tion events within the volume project to a ~20 degree dip, allowing the possibility of a low angle normal fault; while bedding offsets could be interpreted as a series of steep basin-ward step faults. Synclines in vertical sections correspond to concentric circles in horizontal sections, not only raising questions about the possibility of migration processing artifacts, but also present-ing similarities to sill intrusions as seen in North Sea 3d data. This data set reveals seismic evidence for a range of structural interpretations.
References
Coolbaugh,M.F.,Arehart,G.B.,Faulds,J.E.,&Garside,L.J.(2005).GeothermalsystemsintheGreatBasin,westernUnitedStates:Modernanalogues to the roles of magmatism, structure, and regional tectonics in the formation of gold deposits . Geological Society of Nevada Symposium,1063,1081.
Inline and crossline sections showing strong reflections events indicating a range of structural interpretations. Inline sections clearly show 20° dipping reflectors, offset stratigraphy and synclinal events.

II-122 | IRIS CoRe PRoPoSal 2010 | Volume I I | CRuSTal STRuCTuRe
Assembling a Nevada 3D Velocity Model: Earthquake-wave Propagation in the Basin & Range, and Seismic Shaking Predictions for Las VegasJohn N. Louie (University of Nevada, Reno)
The development of an open-source 3d modeling environment allows seis-mologists, explorationists, engineers, and students to predict wave propagation through geologically complex regions. The environment combines geologic and geotechnical data sets with gridding, modeling, and output specifications into portal packs for execution on standalone workstations, clusters, and supercom-puting grids. A tutorial interface helps the user scale the grid to the facilities available, from small test runs to efforts requiring major resources. The ability to configure computations at a range of scales and model complexity is intended to promote wide use of advanced seismic modeling. Geologic models can include many basins in addition to the target urban basin, and detailed geotechnical infor-mationwhereavailable.TopredictearthquakeshakinginNevadaurbanareas,the 3d model assembles several data sets at a wide variety of scales, from regional geologic maps to shallow shear-velocity measurements from microtremor tran-sectshaving0.3-kmspacing(fig.1).ForLasVegastheprincipalearthquakehaz-ardisfromtheFurnaceCreekfaultsystem,capableofM7.5events.Peakgroundvelocity(PGV)resultsfromfinite-differencewavemodelingat0.3Hzshownoobvious correlation between amplification and basin depth or dip of the basin floor.Animationsofshakingshowtheexpectedstrongtrappingandlongshak-ing durations within basins, as well as diffusion and scattering of energy between the many basins in the region. The two Furnace Creek scenarios tested, involv-ingruptureawayfromandtowardLasVegas,producedunexpectedlydifferentPGVinthecity(fig.2).Rupturedirectivitytowardthecitymayamplifyshakingby a factor of fifteen at some locations. Despite affecting only the very shallow-estzoneofmodels (<30m), theVs30geotechnical shear-velocityshowsclearcorrelationto0.3-HzPGVpredictionsinbasins.Increasingbasinthicknessesto1.3kmcorrelatewithincreasedPGV,butthebasineffectat0.3Hzsaturatesforbasinthicknessesgreaterthan1.3km;deeperpartsofthebasinshowvarianceanduncertaintyofafactoroftwoinpredictedPGV.
References
Louie,JohnN.,2008,AssemblingaNevada3-dvelocitymodel:earthquake-wavepropa-gation in theBasin&Range, and seismic shakingpredictions forLasVegas: SEGExpandedAbstracts,27,2166-2170.
Acknowledgements: Research supported by the U.S. Geological Survey (USGS),Department of the Interior, under USGS award numbers 08HQGR0015 and08HQGR0046; by Lawrence Livermore National Laboratory under LDRD TestReadiness funds; and by a Fulbright Senior Scholar award for work in New Zealand. The views and conclusions contained in this document are those of the authors and should not be interpreted as necessarily representing the official policies, either expressed or implied, of the U.S. Government. Instruments used in the field program were provided by the PASSCAL facility of the Incorporated Research Institutionsfor Seismology (IRIS) through the PASSCAL Instrument Center at New MexicoTech.DatacollectedduringthisexperimentwillbeavailablethroughtheIRISDataManagement Center. The facilities of the IRIS Consortium are supported by the National ScienceFoundationunderCooperativeAgreementEAR-0552316 andbythe Department of Energy National Nuclear Security Administration.
figure 1: map of average shear velocity from the surface to 1000 m depth assembled for the nevada region, with part of California, on a shaded-relief basin-thickness map.
figure 2: maps comparing m7.5 furnace Creek fault sce-narios affecting las Vegas. The upper image is a basin thickness map for the region of computation; middle is a snapshot map of e3D wave propagation at 0.3 Hz through the assembled model. below are maximum ground-motion (PGV) maps, on the left for rupture away from las Vegas, and on the right for rupture toward the city.

IRIS CoRe PRoPoSal 2010 | Volume I I | CRuSTal STRuCTuRe | I I -123
Optimized Velocities and Prestack Depth Migration in the Reno-Area BasinJohn N. Louie (University of Nevada, Reno), Satish Pullammanappallil (Optim, Inc.), Annie Kell-Hills (University of Nevada, Reno)
WecollectedseismicreflectionprofilesintheReno,NevadaareabasinincollaborationwiththeUSGSandnees@UTexasduringJune2009.Stratigraphichorizonsandverticaloffsetsassociatedwith faultingappearalonga6.72kmTruckeeRiverprofilewhilestrong,horizontallypropagatingbodywavesareseeninshotgathersfromthesouthern3.84kmManzanitaLaneprofile(fig.1).Reno-areabasinfilloverliesMioceneandesiticvolcanicrocksandconsistsofNeogenesedimentaryrocksandQuaternary outwash deposits. Using the seismic shot records, we created optimized velocity models of the Reno basin using commercialSeisOpt®@2D™software.TherefractedP-wavearrivalsprovideinputsforaglobalvelocitymodeloverthelengthoftheprofilesandtoadepthproportionaltothesourceoffsetdistances,expectedtobe150-200m.Withinthisbasinmostofthe lateral velocity heterogeneity appears within 200 m of the surface. Comparing this velocity model to stacked sections pro-ducedbytheUSGSaddedconfidencetotheinterpretationsofstrongreflectionboundariesseenintheseismicsections(fig.2).Boundariesinthevelocitymodelcoincidewithprominentreflectionboundariesaswellaswithknowndepthsofvolcanicfilland other deposits, constraining their depths and velocities. The tomographic velocity sections were then used as input with the shotrecordstoaKirchhoffpre-stackdepthmigration(PSDM)imagingsteeplydippingstructureandfurtherconstrainingcur-rentinterpretationsandfault/basingeometry.ThePSDMresolvedthecauseofthehorizontallypropagatingwavesseenalongManzanitaLaneassidewallreflectionsfromasteeplydippingfault(fig.3).
Acknowledgements:Research supportedby theU.S.Geological Survey (USGS),Departmentof the Interior, underUSGSawardnumbersG09AP00051,08HQGR0015,and08HQGR0046.Theviewsandconclusionscontained in thisdocumentare thoseof theauthorsandshould not be interpreted as necessarily representing the official policies, either expressed or implied, of the U.S. Government.
figure 1: Two shot records from the manzanita lane survey, south Reno, showing strong horizontally-propagating body waves originating at surface fault traces.
figure 2: Depth section 2.3 km long extending to 1000 m depth, running west (left) to east (right) along the Truckee River through downtown Reno. no ver-tical exaggeration. Colors indicate velocities optimized from 1st-arrival picks, with Quaternary gravels (green) overlying Tertiary sands (red). The reflections are interpreted as showing two west-dipping normal faults (blue lines).
figure 3: Portion of the depth section, 1.4 km long extending to 1000 m depth, running west (left) to east (right) along manzanita lane in south Reno. no verti-cal exaggeration- local ground surface is at 150 m depth on the vertical scale. The horizontally propagating waves image into a combination of a steeply dip-ping fault structure (dashed purple line) and a shallow-dipping structure (solid purple line).

II-124 | IRIS CoRe PRoPoSal 2010 | Volume I I | CRuSTal STRuCTuRe
figure 1: map of average shear velocity from the surface to 30 m depth assembled for the Wellington – lower Hutt region of new Zealand, with the 1500 m/s velocity isosurface in shaded relief to show bedrock and basin-floor topography from benites and olsen (2005). locations of 27 of 46 sites measured in 2006 for shallow shear velocity are marked with dashed circles, labeled with the measured Vs30 in m/s. Kaiser and louie (2006) made an additional 19 measurements in one neighborhood in the lower center of the map, with only two results shown here. The measurements allowed a revision of the shallow velocity model, with Vs30 not exceeding 800 m/s. The basin-bounding Wellington fault runs along the northwest side of the basin.
figure 2: map of peak ground velocity (PGV) computed for the Wellington – lower Hutt region of new Zealand for a m3.2 event 8 km below the city, with the 1500 m/s velocity isosurface in shaded relief to show bedrock and basin-floor topography from benites and olsen (2005). The yellow color indicates PGV as high as 2.27 cm/s. 3D effects of complex basin geometry and soft soils are evident.
Shallow Shear-Velocity Measurements and Prediction of Earthquake Shaking in the wellington Metropolitan Area, New ZealandJohn N. Louie (University of Nevada, Reno)
ThecityofWellington,NewZealand’scapital,sitsastridetheAustralia-Pacificplateboundaryatatransitionfromstrikeslipto subduction motion. The resulting high earthquake hazard and risk motivate multiple research efforts to better understand the potentialforseismicshaking.Physics-basedmodelingofaLanders-typeM7.2ruptureontheWellingtonfault,whichtransectsthecity,byBenitesandOlsen[2005]showedpotentialforpeakgroundvelocitiesashighas1.5m/s.Suchahighhazarddemandsa thorough understanding of the setting, and few measurements of ground-stiffness parameters such as the average shear veloc-ityfromthesurfaceto30mdepth(Vs30)existedinWellingtonpriorto1996.ThatyearKaiserandLouie(2006andnotyetpub-lished)maderefractionmicrotremormeasurementsofVs30at46sitesinWellingtonandLowerHuttcities(fig.1).BenitesandOlsen’s(2005)geotechnicalmodelincludedvelocitiesfor“rock”sitesthatwereafactoroftwohigherthanthemeasurements,sowedevelopedarevisedmodelfromthemeasurements.WethenusedtheE3Dphysics-basedmodelingcodeofLarsenetal.[2001]topredictgroundmotionsforaM3.2event8kmbelowthecitythatyear,usingboththeoriginalandrevisedmodels(fig.2).Therevisedmodelisnotquiteasefficientattrappingwaveenergyinbasins,aswastheoriginalmodel.MostoftheVs30measurementswere made at strong-motion recording stations, so the resulting seismometer data are now better calibrated for site conditions.
References
Benites,RafaelandKimB.Olsen,2005,ModelingstronggroundmotionintheWellingtonmetropolitanarea,NewZealand:Bull. Seismol. Soc. Amer., 95,2180–2196.
Kaiser,A.E.,andJ.N.Louie,2006,Shear-wavevelocitiesinParkwaybasin,Wainuiomata,fromrefractionmicrotremorsurfacewavedisper-sion:GNSScienceReport2006/024,July,LowerHutt,NewZealand,16pp.
Larsen,S.,Wiley,R.,Roberts,P.,andHouse,L.,2001,Next-generationnumericalmodeling:incorporatingelasticity,anisotropyandattenua-tion:SocietyofExplorationGeophysicistsAnnualInternationalMeeting,ExpandedAbstracts,1218-1221.
Acknowledgements:Researchsupportedbya2006FulbrightSeniorScholarawardtoLouieforworkinNewZealand,andbyGNSScience.InstrumentsusedinthefieldprogramwereprovidedcourtesyofM.SavageoftheVictoriaUniversityofWellington,andS.HarderoftheUniversityofTexasElPaso.

IRIS CoRe PRoPoSal 2010 | Volume I I | CRuSTal STRuCTuRe | I I -125
Crustal Structure beneath the High Lava Plains of Eastern Oregon and Surrounding Regions from Receiver Function AnalysisKevin C. Eagar and Matthew J. Fouch (Arizona State University), David E. James and Richard W. Carlson (Carnegie Institution of Washington)
WeanalyzeteleseismicP-to-SreceiverfunctionstoimagecrustalstructurebeneaththeHighLavaPlains(HLP)ofeasternOregonandsurroundingregions.Thecoveragefrom206broadbandseismicstationsprovidesthefirstopportunitytoresolvesmallscalevariationsincrustalcomposition,thickness,andheterogeneity.WeutilizebothHκstackingandanewGaussian-weightedcommonconversionpointstackingtechnique.Wefindcrustthatis≥40kmthickbeneaththeCascades,IdahoBatholith,andOwyheePlateau,andthinner(~31km)crustbeneaththeHLPandnorthernGreatBasin.LowPoisson’sratiosof~0.250char-acterizethegraniticIdahoBatholith,whiletheOwyheePlateaupossessesvaluesof~0.270,typicalofaveragecontinentalcrust.TheOwyheePlateauisathicksimplecrustalblockwithdistinctedgesatdepth.ThewesternHLPexhibitshighaveragevaluesof0.295,expectedfromwidespreadbasalticvolcanism.Combinedwithothergeologicalandgeophysicalobservations,theareasofhighPoisson’sratios(~0.320)andlowvelocityzonesinthecrustbeneathnorth-centralandsouthernOregonareconsistentwiththepresenceofpartialmeltoneithersideoftheHLPtrack,suggestingacentralzonewherecrustalmeltshavedrainedtothesur-face,perhapsenabledbytheBrothersFaultzone.ThickercrustandananomalousN-SbandoflowPoisson’sratios(~0.252)skirt-ingtheSteensMountainescarpmentisconsistentwithresiduumfromamid-crustalmagmasourceofthemassivefloodbasalts,supporting the view of extensive mafic under- and intraplating of the crust from Cenozoic volcanism.
References
Eagar,K.C.,M.J.Fouch,D.E.James,R.W.Carlson,andtheHighLavaPlainsSeismicWorkingGroup,CrustalstructurebeneaththeHighLavaPlainsofEasternOregonandsurroundingregionsfromreceiverfunctionanalysis,submittedtoJ. Geophys. Res.,June2010.
Acknowledgements:ThisworkwouldnothavebeenpossiblewithouthighqualityseismicdataprovidedthroughthehardworkoftheTAandtheHLPSeismicExperimentteams(http://www.dtm.ciw.edu/research/HLP),andtheservicesoftheIRISDMC.Asalways,theIRISPASSCALprogramprovided world-class technical field support. A special thanks goes to Jenda Johnson, whose contributions to the project have been innumerable andimmeasurable,andStevenGoldenforprovidingfieldanddatasupport.Wewouldalsoliketoacknowledgetheworkandproductivediscus-sionsonthecrustalevolutionwiththeotherPIsoftheHLPproject,includingAnitaGrunder,BillHart,TimGrove,RandyKeller,SteveHarder,andBobDuncan.ThisresearchwassupportedbyNationalScienceFoundationawardsEAR-0548288(MJFEarthScopeCAREERgrant),EAR-0507248(MJFContinentalDynamicsHighLavaPlainsgrant)andEAR-0506914(DEJ/RWCContinentalDynamicsHighLavaPlainsgrant).
01020304050607080
Dep
th (k
m)
-0.20-0.15
-0.10-0.05
0.00 0.05 0.10 0.15 0.20
Amplitude
0 100 200 300 400 500 600C’C
HLP GBBMCRB
37 3734.533
LVZ?
31.5
3
01020304050607080
Dep
th (k
m)
0 100 200 300 400 500 600 700 800B’B
OP GBHLPCM
41.5 37.5 35.542
43.5 35.5
LVZ?
3
.704
.706
Distance (km)
01020304050607080
Dep
th (k
m)
0 100 200 300 400 500 600 700A’A
IBBMCM
41 3530
40
LVZ?
.704
.706
3
122˚W 120˚W 118˚W 116˚W 114˚W
41˚N
42˚N
43˚N
44˚N
45˚N
46˚N
A’AB
B’
C
C’
a)
b)
c)
d)
01020304050607080
Dep
th (k
m)
-0.20-0.15
-0.10-0.05
0.00 0.05 0.10 0.15 0.20
Amplitude
0 100 200 300 400 500 600C’C
HLP GBBMCRB
37 3734.533
LVZ?
31.5
3
01020304050607080
Dep
th (k
m)
0 100 200 300 400 500 600 700 800B’B
OP GBHLPCM
41.5 37.5 35.542
43.5 35.5
LVZ?
3
.704
.706
Distance (km)
01020304050607080
Dep
th (k
m)
0 100 200 300 400 500 600 700A’A
IBBMCM
41 3530
40
LVZ?
.704
.706
3
122˚W 120˚W 118˚W 116˚W 114˚W
41˚N
42˚N
43˚N
44˚N
45˚N
46˚N
A’AB
B’
C
C’
a)
b)
c)
d)
30
30
30
30
30
30
35
35
35
35
35
35
40
40
50
25 30 35 40 45Moho Depth (km)
122˚W 120˚W 118˚W 116˚W 114˚W
40˚N 40˚N
42˚N 42˚N
44˚N 44˚N
46˚N 46˚N
GB
0.70
6 lin
e
0.704
line
0.706 line
0.704 line
35
35
35
4550
MP
SRP
IB
OP
HLP
BM
CM
CRB
0.
.225
.225
.250
.250
0.25
.250
.250
.275
.275
.275
.275
.275
.275
.275
.300
.300
.300.325
.325
0.205 0.240 0.275 0.310 0.345Poisson’s Ratio
122˚W 120˚W 118˚W 116˚W 114˚W
40˚N 40˚N
42˚N 42˚N
44˚N 44˚N
46˚N 46˚N
.275
.250
.300
.300
0.70
6 lin
e
0.704
line
0.706 line
0.704 line
MP
SRP
IB
OP
HLP
BM
CM
CRB
GB
.250
.300
.300
figure 3: map of Poisson’s ratios derived from H-k stacking analysis. Smoothing parameters and geo-logical/geochemical features are the same as in figure 1. black solid lines denote 0.025 contours.
figure 2: Cross-sections of moho depths and crustal features. Geologic and geochemical provinces labeled as in the maps. Colored background is amplitudes from GCCP stacking. Solid line with depth labels is moho valued picked from maximum ampli-tudes in GCCP stacks. Dotted black lines labeled lVZ are areas of strong negative amplitudes in the crust. White stars represent Hk moho depths from the nearest stations along each profile. Profile a-a’ is oriented east-west; profile C-C’ is oriented north-south.
figure 1: map of moho depth derived from H-k stacking analysis. Single station results (col-ored circles) are smoothed over a 10 x 10 km grid using splines under tension with a tension factor of 0.3 using the Generic mapping Tools [Smith and Wessel, 1990]. Red colors denote shallower moho; blue colors denote deeper moho; gray regions represent areas of limited sampling in this study. black solid lines denote 5 km contours. 87Sr/86Sr isopleths of 0.704 and 0.706 (“.704” and “.706” lines) denoted by black dashed lines. Geologic provinces include Cascade volcanic arc (Cm), blue mountains (bm), High lava Plains (HlP), Columbia River basin (CRb), Snake River Plain (SRP), Idaho batholith (Ib), owyhee Plateau (oP), modoc Plateau (mP), and Great basin (Gb).

II-126 | IRIS CoRe PRoPoSal 2010 | Volume I I | CRuSTal STRuCTuRe
Imaging Radially Anisotropic Crustal Velocity Structure in Nw CanadaColleen A. Dalton (Boston University), James B. Gaherty (LDEO, Columbia University), Anna M. Courtier (James Madison University)
The tectonic evolution of Northwestern Canada spans several billion years of Earth history. As such, it presents an ideal environment for studying the processes of continental accretionandgrowth.Weuseambient-noise cross-correlation to image aniso-tropic crustal seismic-velocity struc-ture in NW Canada. Our focus areasurrounds the CANOE (CAnadianNOrthwest Experiment) array, a16-monthIRISPASSCALdeploymentof 59 broadband seismic stations.Wealso include 42 broadband stations from the Canadian National Seismograph Network and the POLARIS network.We estimate the Green's function foreach pair of stations by cross-corre-lating day-long time series of ambi-ent noise in the time period July 2004 -June2005.Weobservefundamental-mode Rayleigh waves on cross-corre-lated vertical-component records and Lovewaveson the transversecompo-nents.Wemeasuregroupvelocitiesforthe surface waves in the period range 5-30s.Laterally,groupvelocitiesvaryby as much as ±15% at the shortestperiods and ±6% at longer periods,with the fastest velocities found within the Slave province and very slow velocities associated with thick sedimentary layers at short periods.
Weinvestigate3-Dshear-velocitystructureusingtwoapproaches.WeuseaMonteCarloapproachtotestwhetherthedataareconsistentwithisotropicvelocityandfindthattheLovewavedatarequirefastervelocitiesinthemiddle--lowercrustthantheRayleighwavesdo;i.e.,VSH>VSV.Wealsoinvertthegroup-velocityvalues(>2500interstationpaths)for3-Dradiallyaniso-tropic shear-wave velocity within the crust. Since the sensitivity kernels depend strongly on the assumed elastic structure, we use local kernels to account for the effects of laterally variable sedimentary structure. The resulting model correlates with several known geologic structures, including sedimentary basins at shallow depths and possibly the Cordillera-craton transition in the lower crust. The crustal model will also be useful for future studies of the upper mantle in this area.
(a,b) measurements of Rayleigh and love wave group velocity, plotted as color-coded line segments along the great-circle path connecting each station pair. Color scale ranges from 2.75-3.25 km/s and 3.0-3.6 km/s for the Rayleigh and love waves, respectively. (c,d) Isotropic velocity perturbation in the 3-D seismic model of the study area, shown here at 15- and 30-km depth. The white and black lines indicate the Tintina fault and Great Slave lake Shear Zone, respectively. The white barbed line shows the eastern limit of Cordilleran deformation.

IRIS CoRe PRoPoSal 2010 | Volume I I | CRuSTal STRuCTuRe | I I -127
Controlled-Source Seismic Investigation of the generation and Collapse of a Batholith Complex, Coast Mountains, western CanadaK. Wang (Virginia Tech), J. A. Hole (Virginia Tech), A. L. Stephenson (University of Victoria), G. D. Spence (University of Victoria), K. C. Miller (Texas A&M University), S. H. Harder (University of Texas, El Paso), R. M. Clowes (University of British Columbia)
In2009,theBATHOLITHSprojectacquireda400-kmlongrefractionandwide-anglereflectionseismicsurveyacrosstheCoastMountainsofBritishColumbia,Canada,aJurassictoEocenecontinentalarcbatholithcomplex.
Granitic batholiths created by magmatic differentiation in arcs above subduction zones make continental crust more felsic thantheoriginalmaterialsderivedfromthemantle.However,differentiationfromamaficprotolithresultsinalargevolumeofultramafic residual that is petrologically part of the crust, not changing the bulk composition. This residue may reside hidden beneath the geophysical Moho, or it may have delaminated to sink into the mantle due to its relative density. Delamination may occur during subduction or during the collapse of the arc after subduction stops, and may coincide with a commonly observed latepulseofmagmatism.AspartoftheBATHOLITHSmulti-disciplinaryinvestigationoftheseprocesses,traveltimesfromtheseismicsurveyarebeingusedtobuilda2-DP-wavevelocitymodelofthecrust.
Eastofthebatholithcomplex,surfaceMesozoicsedimentaryandvolcanicrocksareindicatedbyvelocitiesof4-5km/sto2-5kmdepth.Beneaththisbasin,theStikineterrane,anaccretedlatePaleozoictoearlyMesozoicislandarc,hasfelsicseismicvelocitiesof5.8-6.2km/stoatleast15kmdepth.Aseismicreflectorisobservedat~20kmdepthbeneathStikiniabutdoesnotextendintothearccomplex.Basedonwide-anglereflections,thelowercrusthasavelocityof~6.8km/sunderStikinia,indicat-ingmaficrocks.TheMohoisat35-38kmdepthandtheuppermantlehasafastvelocityof~8.1km/sunderStikinia.
Tothewestinthecontinentalarccomplex,velocitiesof5.6-6.2km/sindicategraniticrocksintheuppercrusttoatleast15kmdepth.Astrongseismicreflectorisobservedat~27kmdepthonlybeneaththehighestmountainsandyoungestbatholithsin the eastern part of the batholith complex.
Wide-anglereflectionsindicateavelocity<6.6km/sabovethe27-kmreflectorandabovetheMohointhewesternarccom-plex, indicating a felsic to intermediate composition. The Moho is at 30-33 km depth under the western Coast Mountains and dipseastwardtomaximumof38-40kmbeneaththehighestmountains.Thevelocitybetweenthe27-kmreflectorandthedeep-estMohois>6.8km/s,butthedataarecurrentlybeinganalyzedtobetterconstrainthisnumberandsearchformagmaticresid-ual.Theuppermantlehasaslowvelocityof~7.9km/sunderthearccomplex.
Acknowledgements:TheBATHOLITHScontrolled-sourceseismicprojectisfundedbyanNSFgrantfromtheContinentalDynamicsProgramand by a Canadian NSERC grant.
Preliminary seismic velocity model from the baTHolITHS controlled-source seismic survey. lower crust and moho structure is still being modeled, and may change from this figure. The Stikine terrane to the east of the arc extends from model km 0 to 210. The Jurassic-Cretaceous arc lies west of the Coast Shear Zone at about model km 320. The youngest arc (Cretaceous-eocene) and highest mountains are from model km 210 to 320. The curved surface of the model represents the spherical earth.

II-128 | IRIS CoRe PRoPoSal 2010 | Volume I I | CRuSTal STRuCTuRe
SIMA/PICASSO: Seismic Investigations of the Moroccan Atlas/program to Investigate Convective Alboran Sea System OverturnR. Carbonell (CSIC Earth Science Institute), J. Gallart (CSIC Earth Science Institute), M. Harnafi (Scientific Institute of Rabat, Rabat, Morocco), A. Levander (Rice University, Earth Science Department)
InApril2010weconducteda~500kmlongseismicrefractionsurveyextendingfromtheSaharaDeserttotheMediterraneanSeaacrossMorocco.TherefractionprofilecrossedtherecentlyupliftedHighAtlas,theMiddleAtlas,andthewesternedgeoftheRifMountains.Theproject,SeismicInvestigationsoftheMoroccanAtlas(SIMA),isaffiliatedwiththePICASSOprogramin Spain and Morocco.
SIMAutilized930Reftek125TexanseismographsfromthePASSCALInstrumentCenter.Nominalinstrumentspacingwas350mfromElHajeb(centralMorocco)southtotheSahara,and500mtothenorth.Theinstrumentsrecordedsix1000kgshotslocatedfromElHajebsouth.Aninternationallydiversefieldcrewof75facultyandstudentsfrommorethanadozeninstitutionsinAfrica,Europe,andNorthAmericaconductedthe2weeklongexperiment.Preliminaryexaminationofthedatashowsquitecomplicatedwide-anglereflectionsfromseverallevelsofthecrust.
PICASSOisaprojectthatincludeslandandseamagnetotelluricmeasurements,activeandpassiveseismicexperiments,geo-chemical sampling, structural geology, and geodynamic investigations of the western Mediterranean, and particularly of the Betics,theGibraltarArc,theAlboranSea,theRif,andtheAtlasMountains.PICASSOinstitutionsincludeRice,USC,Oregon,andWHOIintheUSA,CSICEarthScienceInstitute"JaumeAlmera",Barcelona,theUniversityofBarcelona,andtheUniversityof Salamanca in Spain, the Dublin Institute for Advanced Studies in Ireland, GEOMAR and the University of Muenster in Germany, and the Scientific Institute of Rabat, in Morocco.
Acknowledgements:SIMAwasfundedbyagrantfromtheSpanishScienceFoundation(FECYT),andwassupportedaspartofPICASSObygrantEAR0808939fromtheNSFContinentalDynamicsProgram.WethanktheScientificInstituteofRabat,Rabat,Morocco,forgenerousassistanceinthefield,andLloydCarothers,MikeFort,andLisaFoleyfromthePASSCALInstrumentCenterforoutstandingfieldsupport.
map showing SIma seismic refraction profile (stations are plotted in red), and shotpoints (black stars). SP1 is near el Hajeb, morocco.

IRIS CoRe PRoPoSal 2010 | Volume I I | CRuSTal STRuCTuRe | I I -129
Northward Thinning of Tibetan Crust Revealed by Virtual Seismic ProfilesTai-Lin Tseng (University of Illinois, Urbana-Champaign), Wang-Ping Chen (University of Illinois, Urbana-Champaign), Robert L. Nowack (Purdue Univetrsity, W. Lafayette, IN)
A new approach of constructing deep-penetrating seismic profiles reveals significant, regional variations in crustal thickness undernear-constantelevationofTibet.Overdistancesofhundredsofkilometers,thecrustisasthickas75kminsouthernTibetbutshoalstojustover60kmundertheQiangtangterraneincentralTibetwherethedeviationfromAiryisostasyisequivalenttoathicknessofover10kminmissingcrust.Northwardthinningofcrustoccursgraduallyoveradistanceofabout200kmwheremechanical deformation, instead of pervasive magmatism, also seems to have disrupted the crust-mantle interface.
References
Tseng,T.-L.,W.-P.ChenandR.L.Nowack,NorthwardthinningofTibetancrustrevealedbyvirtualseismicprofiles,Geophys. Res. Lett., 36, L24304(withon-linesupplements),doi:10.1029/2009GL040457,2009.
Acknowledgements:ThestudywassupportedbyU.S.NationalScienceFoundationgrantsEAR99-09362(Hi-CLIMB),EAR06-35419andU.S.AirForcecontractFA8718-08-C-002.
a comparison between crustal thickness estimated from wide-angle P-wave reflections (red dots) and an image of the Tibetan lithosphere obtained by Gaussian beam migration of direct P- to S-wave conversions [nowack et al., 2010]. The convention is that a scatterer representing an increase in impedance with depth results in a blue pixel centered on the position of the scatterer. black curves (dashed when uncertain), highlighting particularly strong impedance contrasts, show interpretations of the moho transition zone in nowack et al. [2009]. notice near-constant crustal thickness over distances of hundreds of kilometers when the moho is a simple inter-face near both ends of the profile. In the intervening zone of disrupted moho, average crustal thickness decreases gradually northward by more than 10 km, from as much as 75 km to just over 60 km. notice that the Imf is offset from the onset of shoaled moho near the bnS. “H1350” marks the location of station whose observed waveform is discussed in detail by Tseng et al. [2009].

II-130 | IRIS CoRe PRoPoSal 2010 | Volume I I | CRuSTal STRuCTuRe
Quantification of Landscape Evolution Processes with Seismic Refraction Imaging, Boulder Creek watershed, ColoradoKevin M. Befus (University of Colorado at Boulder), Anne F. Sheehan (University of Colorado at Boulder)
Weuseminimallyinvasiveshallowgeophysicaltechniquestoimagethestructureofthecriticalzonefromsurfacetobed-rock(0-25m)throughouttwosmalldrainageswithintheBoulderCreekCriticalZoneObservatory(BcCZO).Shallowseismicrefraction(SSR)revealsthephysicalcharacteristicsoftheshallowsubsurface.ResultsoftheSSRsurveysprovideapseudo-3Dnetworkofcriticalzonecompressionalwavevelocity(Vp)structurewithineachcatchment.
TheevolutionofeachcatchmentwithintheBcCZOcontainsignalsofbotherosionandweatheringdependentuponthelarge-scale geomorphic processes down to the microbial weathering of mineral grains. The geophysical approach describes the arena for the small-scale processes while also providing a quantitative description of the critical zone structure at an instant in time.Thisstudyencompassestwocatchments,BetassoandGordonGulch,withconnectedrecentandcontinuinggeomorphicprocesses:fluvialrejuvenationandlong-termquiescenterosion,respectively.
GeophysicalresultsshowcrystallinebedrockVpwasgreaterthan3500m/s,unconsolidatedmaterialVpwasgenerallylessthan700m/sandvariousgradientsofweatheredbedrockandconsolidatedmaterialrangedfrom700-3500m/sifpresent.FreshbedrockvaluesinBetassowereimaged12.1±2.8mbelowthegroundsurface.Moderatelyweatheredbedrock(Vp>2000m/s)wasimagedat6.0±2.4mdepth.Weatheredrockandconsolidatedmaterialswereimagedat3.4±1.8mdepth.Unconsolidatedmaterialsweregenerallythinnerthanthesensitivityofourlinesetupat0.9±0.8mthick.InGordonGulchfreshbedrockvalueswereimaged11.7±3.1mbelowthegroundsurface,moderatelyweatheredbedrockat5.8±2.7mdepth,andweatheredrockandconsolidatedmaterialsat3.2±1.9mdepth.Again,unconsolidatedmaterialsweregenerallythinnerthanthesensitivityofourlinesetupat0.9±0.7mthick.
Significant topography and irregular bedrock surfaces contribute additional complexity to the critical zone architecture in each catchment. Aspect driven differences in the subsurface within each catchment overprints the broader geomorphic signals. SSR subsurface structure models will guide future investigations of critical zone processes from landscape to hydrologic model-ing and assist in expanding point measurements of physical, chemical, and biological processes to the catchment scale.
Acknowledgements:IappreciateworkingasaresearchassistantaspartoftheBoulderCreekCriticalZoneObservatory(BcCZO)fundedbyNSFgrantNSF-EAR0724960.IacknowledgetheMentorshipProgramoftheUniversityofColorado'sDepartmentofGeologicalSciencesandtheBcCZOinfundingmyfieldassistants.Also,IthankAustinAndrusfortakingtimeoutofworkingonhisownrelatedIRISproj-ecttoassistmewithmyfieldwork.IappreciateIRISPasscalforloaningGeometricsGeodeseismicequipmentandfieldcomputerswithimportant analysis software.
four SSR transects crossing the Gordon Gulch catchment. north-facing slopes show consistently deeper low velocities (< 2500 m/s) and likely describe deeper weathering fronts compared to the profiles on the south-facing slope.

IRIS CoRe PRoPoSal 2010 | Volume I I | CRuSTal STRuCTuRe | I I -131
An Integrated Analysis of an Ancient Plate Boundary in the Rocky MountainsEva-Maria Rumpfhuber (University of Oklahoma), Randy Keller (University of Oklahoma)
Integration of multiple data sets to obtain better resolved, multiple parameter earth models has recently received new emphasis.Weconductedanintegratedanalysisofthecontrolled-sourceseismic(CSS)andpassivesourceseismicdatafromtheCD-ROM(ContinentalDynamicsoftheRockyMountains)experimentalongwithgravityandseismicreflectiondata.AspecificgoalofthisstudywasestablishastrongertiebetweentheCD-ROMandDeepProbeexperimentsthattogetherforma profile that extends from northern New Mexico to Alberta, Canada. A major advantage of the CD-ROM seismic experiment datasetwasthecoincidenceoftheseismicprofiles(Fig.1),whichfacilitatedajointinterpretationofournewresultsandthepre-viousCD-ROMresults.Asthefirststepinthisprocess,wecreatedanewP-wavevelocityandinterfacemodelfromtheCSSdatabased on an advanced picking strategy that produced a new and extended set of travel-time picks relative to those employed in previous studies. In addition, we were able to identify a substantial set of S-wave arrivals and establish an independent S-wave model.Thus,wewereabletocompareandjointlyinterpretcrustalthicknessesthevarioustechniquesproducedaswellasvp/vs ratios from receiver functions and the CSS dataset. Furthermore, the comparisons provided insights about the strengths and uncertainties of each technique. Thanks to the integration of the controlled-source and receiver function results, we were able to construct a well-constrained structural model and tectonic interpretation that shows the structural framework of the transition fromtheWyomingcratontothenorthacrossthesutureCheyennebeltsuturezoneintotheProterozoicterranestothesouth(Fig.2).Theinterpretationthatcrustal-scalecrocodilestructuresarepresentprovidesanexplanationforthesouthdipoftheCheyennebeltsutureintheuppercrustandthenorth-dippingslabinthemantle(Fig.2).Theverydistinctcrustalstructuresnorthandsouthofthesuturezoneareclearlyshowninourmodelanddocumentthattheblocksthatcollided~1.8Gatoformthe Cheyenne belt suture zone have retained their basic crustal and uppermost mantle structure since that time.
Acknowledgements:ThisworkwassupportedbytheNationalScienceFoundationaspartoftheGEONproject(EAR-0225670)
figure 1: Index map of the CD-Rom seismic experi-ments. The controlled source seismic stations (green), their corresponding shotpoints (red stars), and the northern and southern passive arrays (light blue dia-monds) are shown. Yellow dots indicate the locations of gravity stations. The Deep Probe experiment profile that also used the Day loma shotpoint is shown as a white dashed line.
figure 2: Tectonic synthesis based on the integration of the seismic data from the CD-Rom and Deep Probe experiments. The yellow color indicates the Wyoming Craton in the north, and the blue color represents the Proterozoic terranes to the south. an area of complex suturing (Crocodile structure) is indicated in green. The horizontal lined pattern in the lower crust indicates interpreted zones of under-plated material based on xenolith data.

II-132 | IRIS CoRe PRoPoSal 2010 | Volume I I | CRuSTal STRuCTuRe
Full-wave Ambient Noise Tomography of Northern CascadiaYang Shen (University of Rhode Island), Wei Zhang (University of Rhode Island)
WeuseempiricalGreen’sfunctionsderivedambientnoisetoiterativelyimprovea3Dvelocitymodelofthecrustandupper-mostmantlebeneathnorthernCascadia.Thedatasetincludesupto5years(2005-2009)continuousrecordsfrom69broad-bandseismicstations.Wavepropagationissimulatedusingafinite-differencemethodwithboundaryconforminggridsthataccountfortheeffectsoftopographyand3Dheterogeneity.TheinitialreferencemodelisCRUST2.0.Traveltimeanomaliesare measured by cross-correlating empirical and synthetic Green functions. Finite-frequency sensitivity kernels are computed using the scattering integral method. In the frequency and time window of interest, the empirical Green’s function derived from cross-correlation of vertical-to-vertical component is dominated by Rayleigh waves, which are sensitive to not only shear but alsocompressionalwavespeeds.SotheinverseproblemisstructuredasajointsolutionforVpandVs.Thesolutionconvergesafter4modeliterations,withatotal96%variancereduction.ResolutiontestsshowaVpresolutionintheshallowcrust.TheVpstructure is validated by a comparison with active-source experiments and well logs. A comparison of the observed and pre-dicted earthquake waveforms shows a much-improved waveform fit, indicating that the new model could be used to refine seis-mic hazard assessment. The new model also reveals features that relate to geological observations, such as the sediment basins, the accretionary complex and the Siletz terrane.
References
Shen,Y.,andW.Zhang(2010),Full-waveambientnoisetomographyinNorthernCascadia,Seismol. Res. Lett., 81(2),SSA2010Abstract.
Acknowledgements:This research was supported by the National Science Foundation under grant 0727919 and the Air Force ResearchLaboratoryundercontractFA9453-10-C-0217.TheIRISDMCprovidedseismicwaveforms.
The 3D shear velocity model of northern Cascadia from full-wave ambient noise tomography. The mesh represents the upper surface of the subducted oceanic crust. Color indicates the wave speed in km/s. Several geological features are clearly imaged, such as the Seattle basin, the accretionary complex, the Siletz Terrane and the sediment beneath Columbia River basalts.

IRIS CoRe PRoPoSal 2010 | Volume I I | CRuSTal STRuCTuRe | I I -133
Crustal Velocity Structure of Turkey from Ambient Noise TomographyLinda M. Warren (Saint Louis University), Susan L. Beck (University of Arizona), George Zandt (University of Arizona), C. Berk Biryol (University of Arizona), A. Arda Ozacar (Middle Eastern Technical University), Yingjie Yang (University of Colorado)
IneasternTurkey, theongoingconvergenceof theArabianandAfricanplateswithEurasiahasresulted in thewestwardextrusionoftheAnatolianplate.Tobetterunderstandthecurrentstateandthetectonichistoryofthisregion,weimagecrustand uppermost mantle structure with ambient noise tomography. Our study area extends from longitudes of 32-44 degrees E. WeusecontinuousdatafromtwoPASSCALdeployments,our2006-2008NorthAnatolianFaultPassiveSeismicExperimentandthe1999-2001EasternTurkeySeismicExperiment,aswellasfromadditionalseismometersintheregion.Wecomputedailycross-correlations of noise records between all station pairs and stack them over the entire time period for which they are avail-able,aswellasinseasonalsubsets,toobtaininterstationempiricalGreen'sfunctions.Afterselectinginterstationcross-correla-tions with high signal-to-noise ratios and measuring interstation phase velocities, we compute phase velocity maps at periods rangingfrom8-40s.Atallperiods,thephasevelocitymapsaresimilarforwinterandsummersubsetsofthedata,indicatingthat seasonal variations in noise sources do not bias our results. Across the study area, we invert the phase velocity estimates for shear velocity as a function of depth. The shear velocity model, which extends to 50 km depth, highlights tectonic features appar-entatthesurface:theEasternAnatolianVolcanicProvinceisaprominentlow-velocityanomalywhereastheKirsehirBlockhasrelatively fast velocities. In addition, in the southeastern part of our study area, we image a high velocity region below 20 km depth which may be the northern tip of the underthrusting Arabian plate. There are velocity jumps across the Central and East Anatolian Fault Zones. The North Anatolian Fault Zone appears as a fast anomaly in the upper crust.
Acknowledgements:Thisworkwas fundby theNationalScienceFoundation throughgrantEAR-0309838andIndependentResearchandDevelopment time.
Phase velocity (left column) and horizontal reso-lution maps (right column) for periods of 8, 14, 25, and 40 s. Phase velocity maps, with period labeled in the lower left, show percent variations relative to the mean phase velocity. Phase veloci-ties are plotted for regions with horizontal resolu-tion <=150 km, with white contour lines showing regions with resolution <=100 km. Stations (gray triangles), faults (gray lines), and paleo-sutures (red lines) are also shown. The resolution maps in the right column show path coverage (red lines) and horizontal resolution.

II-134 | IRIS CoRe PRoPoSal 2010 | Volume I I | CRuSTal STRuCTuRe
Seismic Noise Tomography in the Chile Ridge Subduction RegionA. Gallego (University of Florida), R. M. Russo (University of Florida), D. Comte (Universidad de Chile), V. I. Mocanu (University of Bucharest), R. E. Murdie (Goldfields Australia), J. C. Vandecar (DTM -Carnegie Institution of Washington)
We used cross-correlation of ambient seismic noiserecorded in theChile Triple Junction (CTJ) region to esti-mate inter-station surfacewave time-domainGreen's func-tions, and then inverted travel times to obtain crustal sur-face wave velocity models. Inter-station distances within the ChileRidgeSubductionProject temporaryseismicnetworkrangedfrom40to~100km.Weselected365days,andcross-correlated and stacked 24 hours of vertical component data at38 stationspairs, resulting innominally703 travel-timesalongassumed-straightinter-stationpaths.Velocitiesintwo-dimensional cells of 30 x 30 km were calculated using a lin-ear least-squares inversion of the Rayleigh wave travel times. Furthermore we performed a Rayleigh wave dispersion anal-ysis to estimate the sensitivity of different period waves at depthandtocalculatea3DmodelofthePatagoniancrust.Theprocess was applied to cross correlation pairs determined in twoperiodbands,5-10sec,correspondingtoshallowcrustalvelocitiesdowntoapproximately10kmdepth,and10-20sec,for velocities down to around 20 km.Our results show that cellvelocitiescorrelatewellwithknowngeologicfeatures:Wefind high crustal velocitieswhere the Patagonian Batholithoutcrops or is likely present at depth, and low velocities cor-relatewith theactivevolcanicarcof theSouthernVolcanicZone and the subducted Chile ridge, where thermal activity ispresent.Highvelocitiesinthemountainousportionsofthesoutheastern study area appear to correlate with outcropping oldermetamorphicunits.Lowvelocity in theeastcorrelatewith sequences of volcaniclastic deposits.
References
Gallego,A.,R.M.Russo,D.Comte,V.Mocanu,R.Murdie,andJ.VanDecar,SeismicnoisetomographyintheChileRidgeSubductionregion,accepted for publication in Geophysical Journal International,03June2010.
Acknowledgements:ThisworkwassupportedbyU.S.NationalScienceFoundationgrantEAR-0126244andCONICYT-CHILEgrant1050367.
3-D inversion derived from dispersion analysis; the color bands correspond to the percentage variation with respect to the calculated 1-D model

IRIS CoRe PRoPoSal 2010 | Volume I I | CRuSTal STRuCTuRe | I I -135
Ambient Noise Tomography of the Pampean Flat Slab RegionRyan Porter (University of Arizona), George Zandt (University of Arizona), Susan Beck (University of Arizona), Linda Warren (Earthscope Program, Division of Earth Sciences, NSF), Hersh Gilbert (Purdue University), Patricia Alvarado (Universidad Nacional de San Juan), Megan Anderson (Colorado College)
Ambient noise tomography is a recently developed seismic analysis technique that uses background noise to approximate theseismicvelocitieswitharegion.WeapplythistechniquetoastudyofthePampeanflatslabregion(Fig.1)tobetterunder-standcrustalfeaturesrelatedtotheconvergenceoftheNazcaandSouthAmericanPlates.Flatslabsubductionhasledtoashut-off of arc magmatism and a migration of deformation inboard from the plate margin. The region’s crust is composed of several terranesaccretedontheRiodelaPlatacratonwithzonesofthin-skinneddeformationinthePrecordilleraandthick-skinneddeformationintheSierrasPampeanas.Thepurposeofthisworkistouseambientnoisetobetterunderstandtherolethesefea-tures play in the region’s tectonic evolution. Ambient noise tomography is based on the principal that the cross-correlation of seismic noise recorded at two seismic stations can approximate the Green’s function between the stations. This noise is generally associatedwithoceanwavescollidingwiththecoast.WeusetheambientnoisetocalculateRayleighwavedispersioncurvesandconvertthosemeasurementsintoshearwavevelocities.AdetaileddescriptionofthemethodisfoundinBensonetal.[2007].Twoadvantagesofambientnoiseovertraditionalsurfacewavetomographyarethatitproducesahigherqualitysignalatshorterperiods and it does not require earthquakes at certain backazimuths and distances. Initial results from this work suggest that shearwavevelocitiesintheuppercrustareprimarilycontrolledbythepresenceof(slow)basinsand(fast)bedrockexposuresandthatthesebasinsmayextendasdeepas~10-12km(Fig2).LowervelocitiesareobservedbeneaththeshutoffvolcanicarcthanintheSierrasPampeanassuggestingthata)thepresenceofarcrelatedrocksisretardingseismicvelocitiesorb)thatthedifferencesinMohodepthisimpactingthemeasuredseismicvelocities.Wegenerallyobservefasterseismicvelocitiesinareasofthick-skinneddeformationthaninthin-skinnedareas.ThisisespeciallytruebeneaththePrecodillera,whichhasaccommo-dated60–75%ofthesurfaceshorteningsince10Ma[Allmendinger, 1990],andexhibitsrelativelyslowvelocitiesdownto30km,suggesting that deformation is preferentially focused in this low velocity region.
References
Allmendinger, R., D. Figueroa, D. Snyder, J. Beer, C. Mpodozis, and B. Isacks (1990), FORELAND SHORTENING AND CRUSTALBALANCINGINTHEANDESAT30°SLATITUDE,Tectonics, 9(4),789-809.
Anderson,M.L.,Alvarado,P.,Zandt,G.,Beck,S.(2007),GeometryandbrittledeformationofthesubductingNazcaPlate,CentralChileandArgentina. Geophys. J. Int., 171,419-434.
Bensen,G.D.,M.H.Ritzwoller,M.P.Barmin,A.L.Levshin,F.Lin,M.P.Moschetti,N.M.Shapiro,andY.Yang(2007),Processingseismicambi-ent noise data to obtain reliable broad-band surface wave dispersion measurements, Geophys. J. Int., 169,1239-1260.
Acknowledgements:ThisworkwasfundedbyNSFaward#0510966.
figure 2. Cross-section of shear wave velocities at 31 degrees S. (location shown in figure 1). The low velocities observed above the moho at -66 to -68 degrees are likely due to uncertainties in moho depth. measurements are corrected for topography and zones with less than 100 km resolution are shaded out. Green dashed lines show surface locations of terrane boundaries. Topography is exag-gerated 10x.
figure 1. location map of the study area. Red line shows location of cross sec-tion in figure 2. Slab contours from anderson (2007).

II-136 | IRIS CoRe PRoPoSal 2010 | Volume I I | CRuSTal STRuCTuRe
Pacific Northwest Crust and Lithosphere Structure Imaged with Ambient Noise TomographyHaiying Gao (University of Oregon), Eugene Humphreys (University of Oregon), Huajian Yao (Mass. Inst. of Tech.), Robert van der Hilst (Mass. Inst. of Tech.)
Rayleigh-wave ambient noise tomography from periods 6-40 secondsis used to study the PacificNorthwest crust and uppermostmantle struc-tureswiththemethodsofYaoetal.[2006].Weincludeatotalofabout300broadband stations recording from 2006-2009, including EarthScope USTransportableArray,theWallowaflex-array,aportionoftheHighLavaPlainsflexarray,andsevenpermanentstations.ThewesternU.S.modelofYangetal. [2008]isusedforshear-wavevelocityreference.Wefocusonthreeareas:
1)Cascades. In theWashingtonCascades, wheremagmatic productiondiminishes northward to low values, the upper crust near magmatic centers usually is fast and the lower crust is slow. In Oregon, magmatic production rate is high and the crust and upper mantle are slow, whereas the old western Cascades upper crust is quite fast. These observations are consistent with the idea that magmatic intrusions make crust fast, but that high temperature can be dominant.
2)PascoBasin.Theuppercrustisveryslow,suggestingthatthisdeepsedi-mentary basin (which is covered byColumbiaRiver flood basalt flows) islarger than previously mapped.
3)Siletzia.ThefastlowercrustanduppermantleofeasternWashingtonand north-central Oregon is attributed to Siletzia, a fragment of ocean litho-spherethataccreted~50Ma.TheSEboundaryofSiletzia(theKlamath-BlueMountainsgravity lineament;dashed line) is thought to represent a trans-form suture, and is well defined by the tomography. The NE suture is thought tobeasubductionthrustsystemthattrendsNWtoVancouverIsland(dottedline).WesuggestthateasternWashington’slow-lying(seedash-dotline),tec-tonically rigid and seismically faster lower crust and upper mantle is under-thrust Siletzia lithosphere.
References
Yang, Y., Ritzwoller, M.H., Lin, F.-C., Moschetti, M.P., and Shapiro, N.M.,Structure of the crust and uppermost mantle beneath the western United States revealed by ambient noise and earthquake tomography, J. Geophys. Res., 113, doi:10.1029/2008JB005833,2008.
Yao,H.,vanderHilst,R.D.,anddeHoop,M.V.,Surface-WavearraytomographyinSETibetfromambientseismicnoiseandtwo-stationanalysis–I.Phasevelocitymaps,Geophys. J. Int., 166(2),732-744,doi:10.1111/j.1365-246X.2006.03028.x.,2006.
Gao,H.,E.D.Humphreys,H.Yao,andR.D.vanderHilst,CrustalandlithospherestructureofthePacificNorthwestwithambientnoisetomography,inprep.
Acknowledgements:ThisresearchissupportedbyNSFawardEAR-051000.
Tomography maps show the inverted isotropic shear-wave velocity structures (perturbations of ± 0.5 km/s relative to the average velocity; blue is fast). Triangles show the Quaternary volcanoes of the Cascade arc, and P.b. is the Pasco basin.

IRIS CoRe PRoPoSal 2010 | Volume I I | CRuSTal STRuCTuRe | I I -137
Ambient Noise Monitoring of Seismic SpeedMichel Campillo (Université Joseph Fourier and CNRS, Grenoble, France), Nikolai Shapiro (IPGP and CNRS, Paris, France), Florent Brenguier (Observatoire Volcanologique de la Réunion), Matthieu Landes (CEA, Bruyère-le-Chatel)
Withtheavailabilityofcontinuousrecordingsfromnumerousseismologicalnetworks,itisnowpossibletousetheambientseismic noise to monitor the temporal evolution of mechanical properties of the Earth’s crust. As an example, we show the detec-tionofco-seismicandpostseismicchangeofseismicspeedsassociatedwiththe2004Parkfieldearthquakebasedoncorrela-tionsofseismicnoiserecordedbystationsoftheHighResolutionSeismicNetwork[Brenguier et al., 2008].Thevelocitydropsatthe time of the earthquake, and recovers slowly during the next years. The similarity of the time evolution of the velocity anom-alywiththestrainmeasuredbyGPSsuggeststhatthevelocitychangecanbeassociatedtoboththewell-documentedresponseof shallow layers to strong motions, and the strain at depth. Changes of velocity are small and a high precision of measurement is required. Specifically, we must separate the effect of changes at depth and the apparent changes due to the temporal migration of the sources of noise. The latter can be also studies from the analysis of long continuous seismic recordings available at inter-national data centers such as IRIS DMC [e.g. Landes et al., 2010].
References
BrenguierF.,M.Campillo,C.Hadziioannou,N.M.Shapiro,R.M.Nadeau,E.Larose(2008),PostseismicrelaxationalongtheSanAndreasfaultintheParkfieldareainvestigatedwithcontinuousseismologicalobservationsSCIENCE, 321 (5895),1478-1481.
LandesM,HubansF,ShapiroNM,PaulA.,andM.CampilloOriginofdeepoceanmicroseismsbyusingteleseismicbodywaves J. Geophysical Res. 115:B05302,2010
Acknowledgements:ThisworkissupportedbytheEuropeanResearchCouncilAdvancedGrantWHISPER
Top: Temporal evolution of the velocity in the region of Parkfield for the period 2002-2008 (see brenguier et al. 2008 for details). bottom: an example of the seasonal variation of the sources of secondary microseisms obtained from tele-seismic body waves (see landes et al. 2010 for details).
seismic bands do not coincide with each other indicating thatthese two peaks are generated in different regions and pos-sibly by different physical process. P waves are more easilyidentified in the secondary microseismic band than in theprimary microseismic band. While we cannot exclude thatthis difference is related to the more efficient mechanismgenerating secondary microseismic P waves than primaryones, a simple explanation of this observation can be relatedto difference in wave propagation. Strong noise sources gen-erate both body wave and surface waves. For the latter, theirattenuation is much stronger at higher frequencies. Therefore,surface waves in the secondary microseismic peak propagatemuch less efficiently over very long distances than in the low‐frequency primary microseismic band. As a consequence, fordistant noise sources, the relative part of the body waves inthe recorded seismic noise is relatively high in the secondarymicroseismic band while the primary microseismic bandremains largely dominated by surface waves, making obser-vation of P waves more difficult.[29] Using array‐based processing of the teleseismic P
waves to locate regions generating strong microseisms hassignificant advantages relative to using surface waves [e.g.,Stehly et al., 2006]. The latter yields only a determination oftheir back azimuths at the array location while with bodywaves we can measure both back azimuths and slownessesthat can be converted into distances. Therefore, we canlocate the source regions more accurately with body wavesthan with surface waves.
[30] We can compare our maps of the source density inthe secondary microseismic band (Figure 10) with results byGerstoft et al. [2008], who applied beam‐forming to thenoise records of the Southern California seismic network.We find similar source locations in southern Pacific andIndian oceans during summer months and in northernPacific and Atlantic ocean during winter months. Usingthree networks simultaneously allows us to image sourceregions with higher reliability. One of most important con-sequences of this improved reliability is that we clearly seethat strongest sources of P wave microseisms are located indeep oceans far from coasts for the secondary microseism.Also, the observed source regions are significantly smallerthan areas affected by significant wave heights. Overall ourobservations are consistent with the generation of microse-isms by nonlinear interaction of ocean waves propagating inopposite directions that create a pressure distribution on theseafloor at twice the frequency of the interfering waves[Longuet‐Higgins, 1950]. Following Kedar et al. [2008], thiswave‐wave interaction occurs in deep oceans and the geo-graphical intensity of this interaction may be computed fromoceanic wave action models. Moreover, the efficiency of thecoupling between the interfering oceanic waves and the sea-floor may depend on the depth of the water column, i.e., onthe bathymetry. As a result, an efficient transfer of energyfrom oceanic to seismic waves occurs over geographicallyvery limited and specific areas. It is in particular interesting tonote that the source area near Iceland seen in Figure 10 during
Figure 10. Seasonal variation of the location of P wave seismic noise sources in the secondary micro-seismic band (0.1–0.3 Hz).
LANDÈS ET AL.: ORIGIN OF DEEP OCEAN MICROSEISMS B05302B05302
11 of 14

II-138 | IRIS CoRe PRoPoSal 2010 | Volume I I | CRuSTal STRuCTuRe
Vp Structure of Mount St. Helens Imaged with Local Earthquake TomographyGregory Waite (Michigan Technological University), Seth Moran (USGS)
WepresentanewP-wavevelocitymodelforMSHusinglocalearthquakedatarecordedbythePacificNorthwestSeismographStationsandCascadesVolcanoObservatorysincethe18May1980eruption.Thesedatawereaugmentedwithrecordsfromadensearrayof19temporarystationsdeployedduringthesecondhalfof2005.BetweenJune1980andtheSeptember2004,19,379earthquakeswerelocatedbythePNSNwithina50kmby50kmareacenteredonMSH.Anadditional6916eventswerelocated in this area between October 2004 and the end of 2005, which represents a small fraction of the total number of events associatedwiththe2004-2008eruption.Thelargenumberofearthquakesinthecatalogpermitsacarefulselectionofdataforonlythebest-quality7798events.Becausethedistributionofearthquakesinthestudyareaisconcentratedbeneaththevolcanoand within two nearly linear trends, we used a graded inversion scheme to compute a coarse-grid model that focused on the regional structure, followed by a fine-grid inversion to improve spatial resolution directly beneath the volcanic edifice.
Thewell-resolvedvelocityanomaliesbelowMSHaregenerallyconsistentwithpreviousstudiesthathavefoundtwoigne-ousintrusivebodiesNEandNWoftheedifice,andastructuralboundarythatparallelstheSHZ.NorthofMSH,theSHZisboundedbyalow-velocityanomalytothewestandtheSpiritLakePlutontotheeast.ThecoincidenceofthevelocityanomaliesandthetrendofearthquakesstrengthenstheargumentthatMSHsitsalongasignificantNNW-trendingstructuralanomaly[e.g., Parsons et al., 1999].
Small-scalefeaturesofthemagmaticsystemwerelesswellresolved,butasignificantlow-velocityzonefrom1-3kmbslmaybeduetoashallowmagma-storagereservoir(Figure1).Astronghigh-velocityanomaly,previouslyinterpretedasamagmaplug [Lees, 1992]wasfoundtobeeastoftheverticalzoneofearthquakesdirectlybeneathMSHinsteadofwithintheearthquakezone. This anomaly may be attributed to crystallized magma, but we do not interpret it as a plug within the conduit. The deeper low-velocity anomaly that we interpret as part of the magma storage system is poorly resolved due to the lack of deep earth-quakes, but is consistent with earlier suggestions that the earthquake-free region is likely to be magma rich.
References
Lees,J.M.(1992),ThemagmasystemofMountSt.Helens;non-linearhigh-resolutionP-wavetomography,J. Volcanol. Geotherm. Res., 53,103-116.
Parsons,T.,R.E.Wells,M.A.Fisher,E.Flueh,andU.S.tenBrink(1999),Three-dimensionalvelocitystructureofSiletziaandotheraccretedterranesintheCascadiaforearcofWashington,J. Geophys. Res., 104(B8),18,015-18,039.
Waite,G.P.,andS.C.Moran(2009),VPStructureofMountSt.Helens,Washington,USA,ImagedwithLocalEarthquakeTomography,J. Volcanol. Geotherm. Res., 182(1-2),113-122.
Acknowledgements:WethankthestaffatthePNSNfortheirdedicationtoprovidinghigh-qualitydataandIRIS-PASSCALInstrumentCenterfor providing instruments and support for the temporary network. Data collected will be available through the IRIS Data Management Center. The facilities of the IRIS Consortium are supported by the National Science Foundation under Cooperative Agreement EAR-0552316,theNSFOfficeofPolarProgramsandtheDOENationalNuclearSecurityAdministration.
a west-east cross section through a single fine-grid model highlights the low velocity anomaly directly beneath the volcano. There is no vertical exaggeration.

IRIS CoRe PRoPoSal 2010 | Volume I I | CRuSTal STRuCTuRe | I I -139
Mushy Magma beneath yellowstoneRisheng Chu (California Institute of Technology), Don Helmberger (California Institute of Technology), Daoyuan Sun (California Institute of Technology), Jennifer M. Jackson (California Institute of Technology), Lupei Zhu (Saint Louis University)
RecentGPSandInSARstudiesshowthattheYellowstonecalderaisupliftingatarateof7cm/year,whichisapparentlyrelatedtoamagmarecharge(Fig.A)[Chang et al., 2007].Seismictomographicstudies,however,claimahighdegreeofcrystallizationof the underlying magma body based on velocities inferred from regional seismic data. In this research, we analyzed receiver functionsrecordedbyEarthScopestationH17Afrom100teleseismicearthquakesin2008.TwoP-to-SVconvertedphasesthatcorrespondtothetopandbottomofalowvelocitylayer(LVL)areidentified(Fig.B-C).Aftermodelingthesephases,wefoundtheLVLatabout5kmdepthbeneaththecaldera.P-andS-wavevelocitiesare2.3km/secand1.1km/sec,respectively.ThisshallowLVLbeneaththeYellowstoneCalderaissevereenoughtocausedifficultieswithseismictoolapplications.Inparticu-lar,seismologistsexpectteleseismicPwavestoarrivewithmotionsupandawayordownandback.ManyoftheobservationsrecordedbytheYISAPASSCALarrayviolatethisassumption.Stationsnearthetrailingedgehavereversalradial-componentmotions,whilestationsneartheleadingedgedonot(Fig.D).SyntheticwavepropagationshowthatitistheedgeoftheLVLthataresharpenoughforPwavetowraparoundtheendstoreachthereceiversbeforethedirectarrivals.Ifthevelocitydropisnotsevereenough,radialandverticalcomponentshavethesamepolarities(Fig.D).TheflippingoftheradialcomponentcanbeusedtovalidatethelowPvelocity.Wemodeledthedegreeofmagmameltbyassumingafluid-filledporousmaterialcon-sistingofgraniteandamixtureofrhyolitemeltandsupercriticalwaterandCO2attemperatureof800°Candpressureat5km.Wefoundthatthisshallowmagmabodyhasavolumeofover4,300km³andisatleast32%meltsaturatedwithabout8%waterplus CO2 by volume.
References
Chang,W.L.,R.B.Smith,C.Wicks,J.M.Farrell,andC.M.Puskas,AcceleratedupliftandmagmaticintrusionoftheYellowstoneCaldera,2004to2006,Science, 318,952-956,2007.
Chu,R.,D.V.Helmberger,D.Sun,J.M.Jackson,andL.Zhu,MushymagmabeneathYellowstone,Geophys. Res. Lett., 37,L01306,2010.
Acknowledgements: All waveform data used in this study were obtained from IRIS Data Management Center. This work is funded by the TectonicsObservatoryatCaliforniaInstituteofTechnologyunderGrantNo.GPS.TO2-4.1-GRANT.MOORETO2.Thisiscontribution10035oftheTectonicsObservatoryatCaltech.
123 321
NWSE0
5
10
15
20
Dep
th (k
m)
−15 −10 −5 0 5 10 15 20 25 30 35
Y102 Y103H17A
P wave
S wave
9.0 km Vp = 2.29Vs = 1.10
Vp = 5.70Vs = 3.30
3.6 km
LVZ
H17A
1 2 3
Y102 dVs=-66% Y102 dVs=-33%
0 5t (sec)
B
DC
A
Ver.
Rad.
Recent GPS and InSaR studies show that the Yellowstone caldera is uplifting at a rate of 7 cm/year, which is apparently related to a magma recharge (Chang et al. 2007, fig. a). In receiver functions recorded by earthScope station H17a from 100 teleseismic earthquakes in 2008, two P-to-SV converted phases exist that are consistent with the top and bottom of a low velocity layer (lVl) at about 5 km depth beneath the Yellowstone caldera (fig. b and C). Comparisons of synthetic waveforms and observed data for two velocity reductions are shown in fig. D. our preferred P- and S-wave velocities suggest at least 32% melt saturated with about 8% water plus Co2 by volume.

II-140 | IRIS CoRe PRoPoSal 2010 | Volume I I | CRuSTal STRuCTuRe
Structure of the Chesapeake Bay Impact Crater from wide-Angle Seismic waveform TomographyW. Ryan Lester (Virginia Tech; now at U. Texas Austin), John A. Hole (Virginia Tech), Rufus D. Catchings (U. S. Geological Survey, Menlo Park), Florian Bleibinhaus (University of Salzburg)
TheChesapeakeBayimpactstructureisoneofthelargestandmostwellpreservedimpactstructuresonEarth.Ithasauniquemorphology composed of an inner crater penetrating crystalline basement surrounded by a wider crater in the overlying sedi-ments. In 2004, the U.S. Geological Survey conducted a seismic survey with the goals of constraining crater structure and in support of the drilling of a borehole into the deepest part of the crater [Catchings et al., 2008].Waveforminversionwasappliedto these data to produce a higher-resolution velocity model of the crater. Northeast of the crystalline crater, undeformed, east-ward-slopingcrystallinebasementis~1.5kmdeep.Theedgeoftheinnercraterisat~15kmradiusandslopesgraduallydowntoadepthof1.5–1.8km.Acentralpeakof4-5kmradiusrisestoadepthof~0.8km.Basementvelocityinthecrystallinecraterismuchlowerthanundeformedbasement,whichsuggests~10%fracturingofthecraterfloor,andupto20%fracturingofthecentraluplift.Abasementupliftandalateralchangeofbasementvelocityoccurataradiusof~11km,andareinterpretedastheedge of the transient crater. Assuming a 22-km diameter transient crater, scaling laws predict a ~30 km diameter crater and cen-tralpeakdiameterof8-10km,consistentwiththeseismicimage.Thisindicatesthatpost-impactcollapseprocessesthatcreatedthe ~30-km diameter crystalline crater were unaffected by the much weaker rheology of the overlying sediments.
References
Catchings,R.D.,D.S.Powars,G.S.Gohn,J.W.HortonJr.,M.R.Goldman,andJ.A.Hole(2008),AnatomyoftheChesapeakeBayimpactstructurerevealedbyseismicimaging,DelmarvaPeninsula,Virginia,USA,J. Geophys. Res., 113,B08413.
Lester,W.R.,(2006),StructureoftheChesapeakeBayImpactCraterfromWide-AngleSeismicWaveformTomography,M.S.Thesis,VirginiaTech.
Acknowledgements:ThedatawereacquiredbytheU.S.GeologicalSurveyfundedbytheNationalCooperativeGeologicMappingProgramandusedIRIS-PASSCALseismometers.
Seismic velocity model produced by waveform inversion of 3-16 Hz data.
model of the inner crystalline crater of the Chesapeake bay impact structure as interpreted from the seismic model. The crater is defined at the base of the exmore tsunami breccia.

IRIS CoRe PRoPoSal 2010 | Volume I I | CRuSTal STRuCTuRe | I I -141
Imaging the Seattle Basin to Improve Seismic Hazard AssessmentsAndrew A Delorey (University of Washington), John E Vidale (University of Washington)
MuchofSeattleliesatopadeepsedimentarybasin.TheSeattleBasinamplifiesanddistortstheseismicwavesfromnearbymoderate and large earthquakes in ways that modulate the hazard from earthquakes. Seismic hazard assessments heavily depend uponuppercrustalandnear-surfaceS-wavevelocitymodels,whichhavetraditionallybeenconstructedfromP-wavemodelsusinganempiricalrelationshipbetweenP-waveandS-wavevelocityorbyinterpolatingacrosswidelyspacedobservationsofshallow geologic structures. Improving the accuracy and resolution of basin S-wave models is key to improving seismic hazard assessmentsandpredictionsforgroundshaking.Tomography,withshort-periodRayleighwavesextractedusingnoiseinter-ferometry,canrefineS-wavevelocitymodelsinurbanareaswithdensearraysofshortperiodandbroadbandinstruments.Weapply this technique to the Seattle area to develop a new shallow S-wave model for use in hazard assessment. Continuous data fromtheSeismicHazardsinPugetSound(SHIPS)arrayaswellaspermanentstationsfromthePacificNorthwestSeismographNetwork(PNSN)andEarthscope’sTransportableArray(TA)haveinter-stationdistancesareasshortasafewkilometers.ThisallowsustoextractRayleighwavesbetween2and10secondsperiodthataresensitivetoshallowbasinstructure.Ourresultsshowthatshearwavevelocitiesareabout25%lowerinsomeregionsintheupper3kmthanpreviousestimates.Usingthenewvelocity model we run earthquake simulations using a finite difference code to validate the model, and then to make predictions on the level of ground-shaking for various realistic earthquake scenarios at various locations around the urban area.
Acknowledgements:ThisstudyisfundedbytheNationalEarthquakeHazardsProgram(NEHRP).
Shown are the stations used for this study. The black curves indicate the coast-line of Puget Sound and Seattle is located where stations are clustered in the center of the figure. The uW broadband (circles) and earthscope Transportable array stations (triangles) were used to get background velocity and the SHIPS stations (stars) were used to image the Seattle basin.
Shown are Rayleigh wave phase velocities for periods between 2 and 10 seconds.

II-142 | IRIS CoRe PRoPoSal 2010 | Volume I I | CRuSTal STRuCTuRe
Earthquake Hazard Class Mapping by Parcel in Las Vegas ValleyJohn N. Louie (University of Nevada, Reno), Satish Pullammanappallil (Optim SDS), Aasha Pancha (Optim SDS), Travis West (Optim SDS), Werner Hellmer (Clark County Building Department)
ClarkCounty,NevadaiscompletingtheNation'sveryfirstefforttomapearthquakehazardclasssystematicallythroughanentireurbanarea.Theresultinggeotechnicalshear-velocitymapisalayeraddedtotheCounty'sexistingsoil-hazardsmap.Themap already includes layers such as fault proximity, ground subsidence, and potential for swelling clay soils. The new earth-quake-hazardmaplayerwillbeavailableontheCounty'swebGISinterface.Geotechnicalshearvelocityisabasicbuildingblockin foundation design, and in predictions of potential for ground liquefaction, landslides, and seismic shaking, as a few examples. The map will be used in development and disaster response planning, in addition to its direct use for building code implemen-tationandenforcement.ClarkCountycontractedwiththeNevadaSystemofHigherEducationtoapplytherefractionmicro-tremor geophysical surveying technique, a State of Nevada-owned technology, to the hazard classification of about 500 square milesLasVegasValley.
Theparcelmapincludesalmost9000measurementsthatclassifyparcelsontheNEHRPhazardscale,fromNEHRPAatleasthazardoustoNEHRPEatthemost.NositeinNevadahasyetbeenmeasuredtobelesshazardousthanNEHRPBormorehaz-ardousthanNEHRPD;andthisrepresentstherangeofclassificationsfoundinunincorporatedClarkCounty.ThemeasuredparcelmapshowsaclearlydefinableNEHRPB-CboundaryonthewestsideofLasVegasValley,rarelymorethan300mwide.TheNEHRPC-Dboundaryisontheotherhandmuchmorecomplex.UsingtheparcelmapincomputingshakingintheValleyforscenarioearthquakesiscrucialforobtainingrealisticpredictionsofgroundmotions.ForLasVegastheprincipalearthquakehazard is from the Furnace Creek fault system, capable of M7.5 events. Animations of shaking show the expected strong trap-ping and long shaking durations within basins, as well as diffusion and scattering of energy between the many basins in the region.Despiteaffectingonlytheveryshallowestzoneofmodels(<30m),theVs30geotechnicalshear-velocityfromtheparcelmapshowsclearcorrelationto0.3-HzPGVpredictionsinbasins.Increasingbasinthicknessesfrom0to1.3kmcorrelatewithincreasedPGV,butthebasineffectat0.3Hzsaturatesforbasinthicknessesgreaterthan1.3km;deeperpartsofthebasinshowvarianceanduncertaintyofafactoroftwoinpredictedPGV.
Acknowledgements: Research supported primarily under contract to the Clark County Building Department; also partially by the U.S.GeologicalSurvey(USGS),DepartmentoftheInterior,underUSGSawardnumber08HQGR0015;andbya2006FulbrightSeniorScholarawardtoLouieforworkinNewZealand.Theviewsandconclusionscontainedinthisdocumentarethoseoftheauthorsandshouldnotbeinterpreted as necessarily representing the official policies, either expressed or implied, of the U.S. Government.
Preliminary hazard map of a portion of las Vegas Valley, nevada, prepared from measurements of 1265 sites as of march 2008. (map book 163 – green numbers – was mapped later that year.) a sharp neHRP b-C boundary (green to orange) is visible between map books 176 and 177; the neHRP C-D boundary (orange to red in map book 162) is much more complicated, requiring dense measurements to locate accurately.

IRIS CoRe PRoPoSal 2010 | Volume I I | CRuSTal STRuCTuRe | I I -143
Developing a Database of ENA ground Motions for NgA EastChris Cramer (CERI, University of Memphis)
Afive-yearNextGenerationAttenuation(NGA)Eastprojecttodevelopnewgroundmotionpredictionequationsforstablecontinentalregions(SCRs),includingeasternNorthAmerica(ENA),hasbegunatthePacificEarthquakeEngineeringResearch(PEER)CenterfundedbytheNuclearRegulatoryCommission(NRC),theU.S.GeologicalSurvey(USGS),theElectricPowerResearchInstitute(EPRI),andtheDepartmentofEnergy(DOE).Aspartofapre-projecteffort,theNRChasfundedthetwo-year initial development of an ENA database of ground motions similar to the NGA active-tectonic-regions strong-motion database. This initial effort focused on database design and collection of appropriate M>4 ENA broadband and accelerograph recordstopopulatethedatabase.OngoingworkunderPEERfundingwillfocusonaddingrecordsfromsmallerENAearth-quakes and from other SCRs such as Europe, Australia, and India. This effort to develop a database of ENA ground motions for the NGA East project has used waveform data from GSN and USArray stations.
Acknowledgements:This researchwas supportedunderUSGScooperativeagreement07CRAG0015and is currently sup-portedbyacontractwithPEER.
Red - StationsBlue - Earthquakes
The stations and earthquakes used in the nGa east project so far.
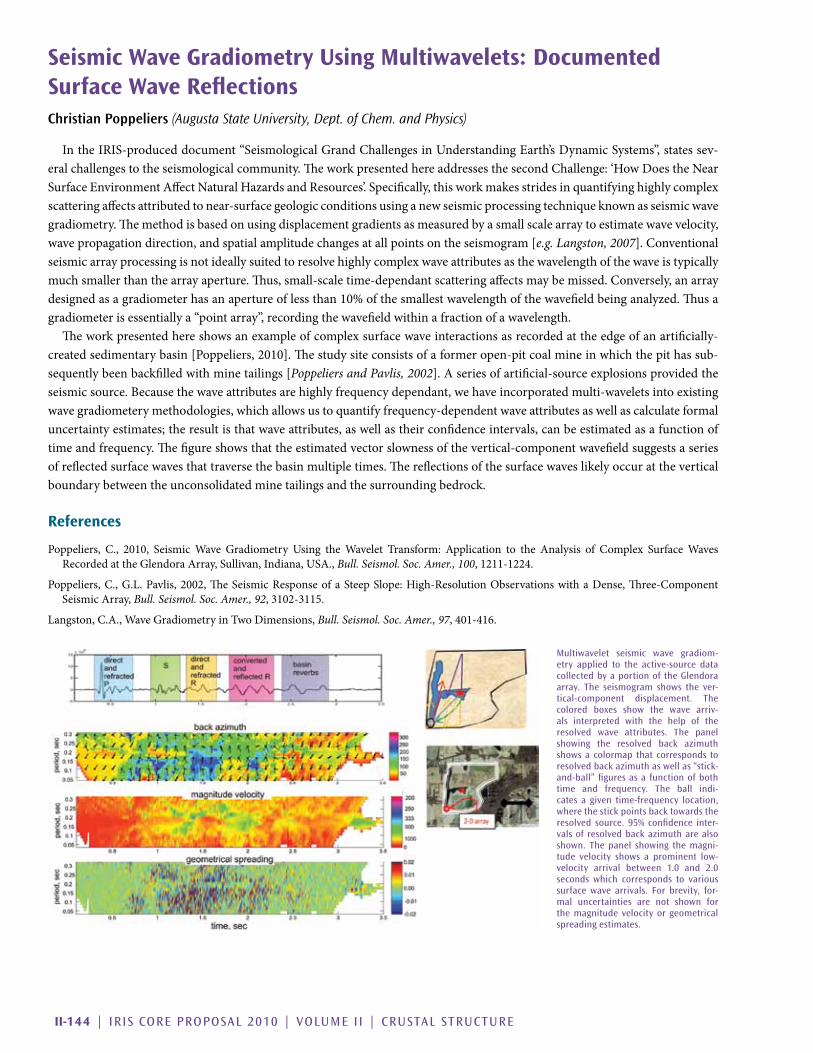
II-144 | IRIS CoRe PRoPoSal 2010 | Volume I I | CRuSTal STRuCTuRe
Seismic wave gradiometry Using Multiwavelets: Documented Surface wave ReflectionsChristian Poppeliers (Augusta State University, Dept. of Chem. and Physics)
In the IRIS-produced document “Seismological Grand Challenges in Understanding Earth’s Dynamic Systems”, states sev-eralchallengestotheseismologicalcommunity.TheworkpresentedhereaddressesthesecondChallenge:‘HowDoestheNearSurfaceEnvironmentAffectNaturalHazardsandResources’.Specifically,thisworkmakesstridesinquantifyinghighlycomplexscattering affects attributed to near-surface geologic conditions using a new seismic processing technique known as seismic wave gradiometry. The method is based on using displacement gradients as measured by a small scale array to estimate wave velocity, wave propagation direction, and spatial amplitude changes at all points on the seismogram [e.g. Langston, 2007].Conventionalseismic array processing is not ideally suited to resolve highly complex wave attributes as the wavelength of the wave is typically much smaller than the array aperture. Thus, small-scale time-dependant scattering affects may be missed. Conversely, an array designedasagradiometerhasanapertureoflessthan10%ofthesmallestwavelengthofthewavefieldbeinganalyzed.Thusagradiometer is essentially a “point array”, recording the wavefield within a fraction of a wavelength.
The work presented here shows an example of complex surface wave interactions as recorded at the edge of an artificially-createdsedimentarybasin[Poppeliers,2010].Thestudysiteconsistsofaformeropen-pitcoalmineinwhichthepithassub-sequently been backfilled with mine tailings [Poppeliers and Pavlis, 2002].Aseriesofartificial-sourceexplosionsprovidedtheseismicsource.Becausethewaveattributesarehighlyfrequencydependant,wehaveincorporatedmulti-waveletsintoexistingwave gradiometery methodologies, which allows us to quantify frequency-dependent wave attributes as well as calculate formal uncertainty estimates; the result is that wave attributes, as well as their confidence intervals, can be estimated as a function of time and frequency. The figure shows that the estimated vector slowness of the vertical-component wavefield suggests a series ofreflectedsurfacewavesthattraversethebasinmultipletimes.Thereflectionsofthesurfacewaveslikelyoccurattheverticalboundary between the unconsolidated mine tailings and the surrounding bedrock.
References
Poppeliers, C., 2010, SeismicWave Gradiometry Using theWavelet Transform: Application to the Analysis of Complex SurfaceWavesRecorded at the Glendora Array, Sullivan, Indiana, USA., Bull. Seismol. Soc. Amer., 100,1211-1224.
Poppeliers,C.,G.L.Pavlis,2002,TheSeismicResponseofaSteepSlope:High-ResolutionObservationswithaDense,Three-ComponentSeismic Array, Bull. Seismol. Soc. Amer., 92,3102-3115.
Langston,C.A.,WaveGradiometryinTwoDimensions,Bull. Seismol. Soc. Amer., 97,401-416.
multiwavelet seismic wave gradiom-etry applied to the active-source data collected by a portion of the Glendora array. The seismogram shows the ver-tical-component displacement. The colored boxes show the wave arriv-als interpreted with the help of the resolved wave attributes. The panel showing the resolved back azimuth shows a colormap that corresponds to resolved back azimuth as well as “stick-and-ball” figures as a function of both time and frequency. The ball indi-cates a given time-frequency location, where the stick points back towards the resolved source. 95% confidence inter-vals of resolved back azimuth are also shown. The panel showing the magni-tude velocity shows a prominent low-velocity arrival between 1.0 and 2.0 seconds which corresponds to various surface wave arrivals. for brevity, for-mal uncertainties are not shown for the magnitude velocity or geometrical spreading estimates.