International traveling tips that all vacationers should know from Getaways Resort Management

Cruise Industry Overview
Table of Contents
Executive Summary
A. Recent Market/Growth Statistics1. Overall Passengers Growth -- North American Cruise Market2. Growth by Length of Cruise -- North American Market3. Average Length of Cruise
B. Cruise Market Potential1. Cruise Market Potential
C. Cruise Demographics & Psychographics1. Demographic Profile2. Compostion of Target Markets3. Recent Cruiser Market Segmentation4. Cruise Prospect Market Segmention
D. Vacations Behavior and Attitudes1. Vacation Planning Criteria2. Use Of Travel Agents3. Cruising Vs. Other Vacations/Satisfaction Expectations
I. Types Of Vacation TakenII.!Cruise Satisfaction-Past CruiseIII. Cruise Perception-ProspectsIV. Destination Sampling
E. Source of Business/Passengers1. North American--By State/Province (USA)2. North American--Rank By State/Province3. Regional Passenger Contribution (2001 vs 1991)4. Regional Contribution By Cruise Length (USA)(2001)
F. Cruise Capacity1. North American Passenger Capacity 20022. Capacity Changes 2002 - 20073. Composite Capacity Changes 1981 - 20074. Geographical Destination/Application5. Estimated Industry Capacity Utilization (1981-2001)
3/25/03 2:26 PMCLIA - Cruise Line International Association
Page 1 of 36http://cruising.org/press/overview/ind_overview.cfm

G. CLIA-As an Association1. Cruise Industry Representation2. Travel Agency Affiliates
H. Other Key Sources of Information on the Cruise Industry1. Books and Pamphlets2. Periodicals/Consumer3. Other Sources
REPORT UPDATES
Regular updates/additions to " " are completed twice each year - Spring and Fall. Based on the typical availability of data, the following is our schedule for updates.
The Cruise Industry - An Overview
Categories/Data Spring Fall
Market Size/Growth (Even Years)nü ü
Market Potential/Prospects (Even Years)n ü
Prior Cruises/Product Evaluation (Even Years)n
ü
Source of Business-Passengersnü
North American Port Embarkationn ü
Cruise Capacitynü ü
CLIA Informationnü ü
Cruising and Travel Agentsnü ü
Other Key Sources of Informationnü ü
Executive Summary
Since 1980, the industry has had an average annual growth rate of 8.4% per annum.The cruise industry is the most exciting growth category in the entire leisure market.
Since 1980, an estimated 82 million passengers have taken a deep-water cruise (2+ days). Of this number, 64% of the total passengers have been generated in the past 10 years. Thirty seven percent of total passengers have been generated in the past five years alone.
The cruise industry is young.
Over the next five years, the market potential for the cruise industry is $85 billion. In 2002, we project that approximately 7.4 million passengers will take a cruise. Taking a cruise is a dream of 50% of all adults with the highest interest being exhibited by the emerging baby-boomer category. To date, approximately 13% of the U.S. population have ever cruised.
The cruise market potential is huge. cumulative
Over the past 10 years, the industry has responded to extensive market and consumer research: research that has guided the addition of new destinations, new ship design The cruise product is incredibly diversified with literally a cruise vacation for everyone.
3/25/03 2:26 PMCLIA - Cruise Line International Association
Page 2 of 36http://cruising.org/press/overview/ind_overview.cfm

concepts, new on-board/on-shore activities, new themes and new cruise lengths to reflect the changing vacation patterns of today's market.
Whether a frequent or first-time cruiser, the cruise experience consistently expectations on a wide range of important vacation attributes. On a comparative basis versus other vacation categories, cruising consistently receives top marks. The on-going challenge for our industry is to convert cruise prospects into new cruisers.
The cruise industry's product delivers unparalleled customer satisfaction.exceeds
Over 85% of cruise passengers agree with this statement. Nearly 50% fully expect to return to the same geographical area/destination for another type of vacation. Cruisers are not exclusively cruisers; rather they are frequent vacationers who cruise as part of their vacation mix.
Cruising is an important vehicle for sampling destination areas to which passengers may return.
Today's array of airlift options and streamlined port processing have opened up cruising as a vacation alternative to more and more individuals. The addition of new North American embarkation ports provides cruise vacationers more options and opportunities to drive versus fly.
The North American cruise market is strong across all 50 states and Canada.
From a capacity standpoint, utilization is consistently around 90%. The Caribbean represents the number one destination with almost 47% of capacity placement. Europe, the Mediterranean, Alaska, Mexico, Trans-Canal, Hawaii and South America follow the Caribbean in popularity.
CLIA Member Lines represent 95% of North American-marketed berths.
Today, it has 23 member lines and approximately 17,000 travel agency affiliates. It's the largest association in terms of North American travel agency affiliate representation.CLIA has become one of the largest and most influential industry associations.
Almost all passengers (est. 90+%) are booked through travel agents. Cruises are profitable to sell and generate a high repeat rate. The most successful and productive agencies are those that place a premium on selling cruises and training their personnel.
Finally, the cruise industry has a very close working relationship with the travel agency community.
NOTE: In this report, North American market designates only U.S. and Canada.
A. Recent Market/Growth Statistics
1. Overall Passenger Growth -- North American Cruise Market
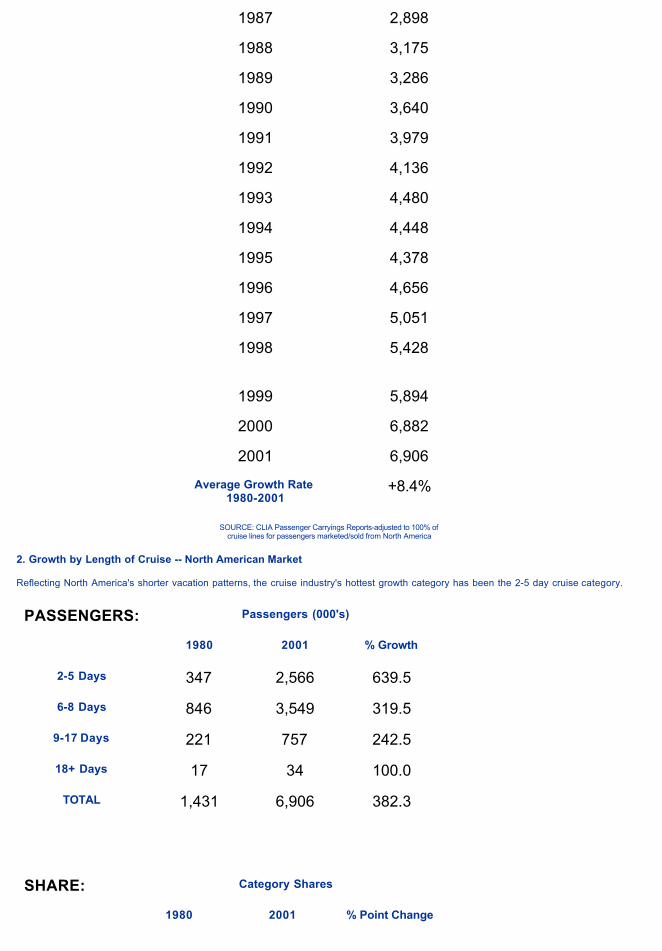
The cruise industry is the most exciting vacation category in the United States and Canada. Its average rate of growth has been far greater than any other category.
ANNUAL PASSENGERS(2 Day or More Market)
THE BIG PICTURE
RECENT GROWTH TRENDS
Annual Passenger
Growth
Actual (000's)
1980 1,431
1981 1,453
1982 1,471
1983 1,755
1984 1,859
1985 2,152
1986 2,624
3/25/03 2:26 PMCLIA - Cruise Line International Association
Page 3 of 36http://cruising.org/press/overview/ind_overview.cfm
1987 2,898
1988 3,175
1989 3,286
1990 3,640
1991 3,979
1992 4,136
1993 4,480
1994 4,448
1995 4,378
1996 4,656
1997 5,051
1998 5,428
1999 5,894
2000 6,882
2001 6,906
Average Growth Rate 1980-2001
+8.4%
SOURCE: CLIA Passenger Carryings Reports-adjusted to 100% of cruise lines for passengers marketed/sold from North America
2. Growth by Length of Cruise -- North American Market
Reflecting North America's shorter vacation patterns, the cruise industry's hottest growth category has been the 2-5 day cruise category.
PASSENGERS: Passengers (000's)
1980 2001 % Growth
2-5 Days 347 2,566 639.5
6-8 Days 846 3,549 319.5
9-17 Days 221 757 242.5
18+ Days 17 34 100.0
TOTAL 1,431 6,906 382.3
SHARE: Category Shares
1980 2001 % Point Change
3/25/03 2:26 PMCLIA - Cruise Line International Association
Page 4 of 36http://cruising.org/press/overview/ind_overview.cfm

2-5 Days 24.3% 37.2% 12.9
6-8 Days 59.1 51.4 -7.7
9-17 Days 15.4 11.0 -4.4
18+ Days 1.2 0.4 -0.8
TOTAL 100.0% 100.0% 0.0+
SOURCE: CLIA Passenger Carryings Reports-adjusted to 100% of cruise lines.CLIA's data does not include one day cruises.
3. Average Length of Cruise
From 1983 through 1991, there was a steady decline in the length of cruise vacations -- a reflection of more capacity being added in the short cruise market.
Average Length of Cruise (Days)
% of Total Passengers in
2-5 Day Category
1981 6.7 29.6%
1982 6.9 25.3
1983 6.9 21.6
1984 6.9 22.3
1985 6.8 26.3
1986 6.4 35.1
1987 6.4 32.8
1988 6.4 32.9
1989 6.4 33.8
1990 6.2 38.3
1991 6.1 37.4
1992 6.2 35.2
1993 6.4 36.7
1994 6.3 38.0
1995 6.5 33.7
1996 6.4 35.9
1997 6.5 33.6
1998 6.7 34.7
1999 6.6 35.8
2000 6.5 36.9
3/25/03 2:26 PMCLIA - Cruise Line International Association
Page 5 of 36http://cruising.org/press/overview/ind_overview.cfm

2001 6.4 37.2
SOURCE: CLIA Passenger Carryings Report.
B. Cruise Market Potential
Consistent with past data, half of the target population reports that they are interested in taking a cruise. Of this group, 43.6 million indicate they definitely/probably will take a cruise over the next 5 years; a 5.2% increase over 1998.
SOURCE: 2000 Market Profile Study2002 Update expected September 2002
Not surprisingly, intent to cruise is highest among recent cruisers (past 5 years). The data also underlines the need to motivate both prospects and non-vacationers to consider cruising as a great vacation opportunity.
3/25/03 2:26 PMCLIA - Cruise Line International Association
Page 6 of 36http://cruising.org/press/overview/ind_overview.cfm

SOURCE: 2000 Cruise Market Profile Study
SOURCE: 2000 Cruise Market Profile Study
C. Cruise Demographics & Psychographics
1. Demographic Profiles
Ever Cruised
Past 5 Year Cruisers
Cruise Prospects
Non-Vacationers
Gender: MaleFemale
49%51%
51%48%
50%49%
50%50%
Age: 25-under 40 years40-59 years
60 years or older
27%42%32%
28%42%30%
43%44%13%
35%43%22%
AverageMedian
51 yrs.51 yrs.
50 yrs.51 yrs.
43 yrs.42 yrs.
47 yrs.47 yrs.
Marital Status: MarriedNot Married
76%24%
78%22%
69%31%
65%35%
3/25/03 2:26 PMCLIA - Cruise Line International Association
Page 7 of 36http://cruising.org/press/overview/ind_overview.cfm

HouseholdComposition:
Have childrenunder 18
Adults only37%63%
35%65%
54%46%
51%49%
Occupants 3 3 3 3
Education: Some College or less
College Graduate or more
42%58%
36%64%
54%46%
76%24%
Household Income:
$20,000-$29,999$30,000-$39,999$40,000-$59,999$60,000-$99,999$100,000 or more
8%12%32%28%20%
5%10%31%30%25%
13%17%31%29%9%
32%26%27%11%4%
Average Median
$72,600$58,500
$79,100$64,500
$60,400$51,800
$44,200$36,900
* Repercentaged without refusal/no answer
2. Composition of Target Markets
Of the target market, 24% are past (ever) cruisers; 13% have cruised in the past five years. Cruise prospects - those who have never cruised but take paid vacations - comprise 49% of the target market.
SOURCE: 2000 Market Profile Study
3. Recent Cruiser Market Segmentation
3/25/03 2:26 PMCLIA - Cruise Line International Association
Page 8 of 36http://cruising.org/press/overview/ind_overview.cfm
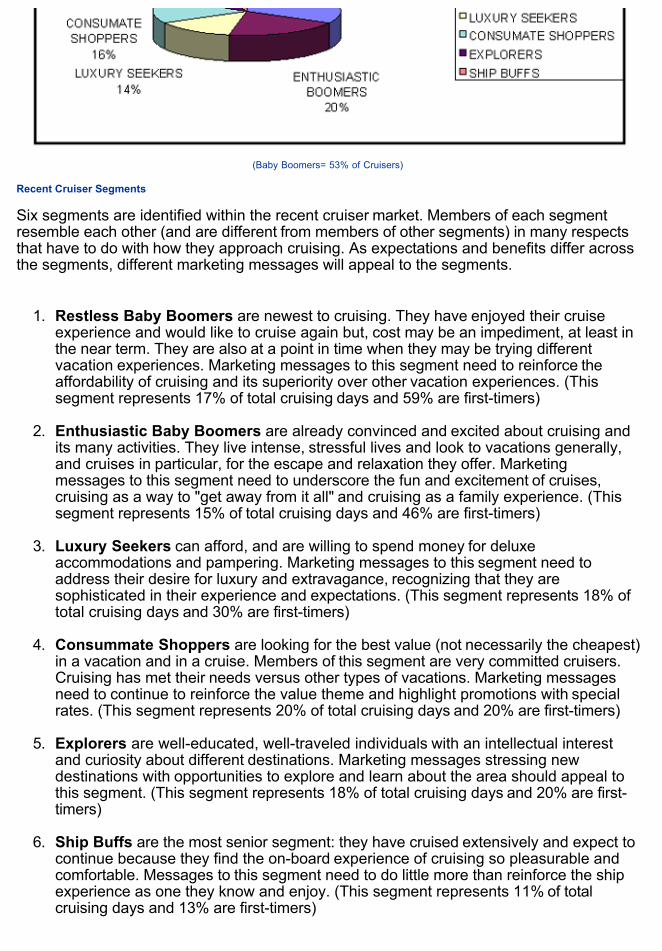
(Baby Boomers= 53% of Cruisers)
Recent Cruiser Segments
Six segments are identified within the recent cruiser market. Members of each segment resemble each other (and are different from members of other segments) in many respects that have to do with how they approach cruising. As expectations and benefits differ acrossthe segments, different marketing messages will appeal to the segments.
1. are newest to cruising. They have enjoyed their cruise experience and would like to cruise again but, cost may be an impediment, at least in the near term. They are also at a point in time when they may be trying different vacation experiences. Marketing messages to this segment need to reinforce the affordability of cruising and its superiority over other vacation experiences. (This segment represents 17% of total cruising days and 59% are first-timers)
Restless Baby Boomers
2. are already convinced and excited about cruising and its many activities. They live intense, stressful lives and look to vacations generally, and cruises in particular, for the escape and relaxation they offer. Marketingmessages to this segment need to underscore the fun and excitement of cruises, cruising as a way to "get away from it all" and cruising as a family experience. (This segment represents 15% of total cruising days and 46% are first-timers)
Enthusiastic Baby Boomers
3. can afford, and are willing to spend money for deluxe accommodations and pampering. Marketing messages to this segment need to address their desire for luxury and extravagance, recognizing that they are sophisticated in their experience and expectations. (This segment represents 18% of total cruising days and 30% are first-timers)
Luxury Seekers
4. are looking for the best value (not necessarily the cheapest) in a vacation and in a cruise. Members of this segment are very committed cruisers. Cruising has met their needs versus other types of vacations. Marketing messages need to continue to reinforce the value theme and highlight promotions with special rates. (This segment represents 20% of total cruising days and 20% are first-timers)
Consummate Shoppers
5. are well-educated, well-traveled individuals with an intellectual interest and curiosity about different destinations. Marketing messages stressing new destinations with opportunities to explore and learn about the area should appeal tothis segment. (This segment represents 18% of total cruising days and 20% are first-timers)
Explorers
6. are the most senior segment: they have cruised extensively and expect to continue because they find the on-board experience of cruising so pleasurable and comfortable. Messages to this segment need to do little more than reinforce the shipexperience as one they know and enjoy. (This segment represents 11% of total cruising days and 13% are first-timers)
Ship Buffs
3/25/03 2:26 PMCLIA - Cruise Line International Association
Page 9 of 36http://cruising.org/press/overview/ind_overview.cfm

4. Cruise Prospect Market Segmentation
Cruise Prospect Market
- By Segment -
Total Prospect Market = 64,272,000
Note: Hot Prospects=Definitely/Probably will take a cruise or air/sea package in next two years
SOURCE: Market Profile and Cruise Prospect Segmentation Study
PROTOTYPICAL DESCRIPTIONS
Family Folks
Our values are basic: we are family oriented, we are practical and down-to-earth people. We tend to be traditional in our outlook; we are notconcerned about keeping up with what's fashionable. We stick with what we know and are comfortable with. We are cautious, and we don't like to experiment or take risks. Our pleasures are the simple things in life.
When it comes to money, we are conservative. We watch our budgets and we don't spend freely. We find we worry about how much we are spending. Our lives are stressful. It's hard to get everything done that needs to be done.
On vacation we go to theme parks more than others. We also go to beach resorts, historic sites and cities, although we visit cities less oftenthan other people. Like everyone else we go sightseeing and shopping on vacation, and we particularly like to go swimming. We are less involved with eating in fancy restaurants, nightlife or gambling.
Want-It-Alls
We consider ourselves to be on our way up. While we may not be particularly successful or wealthy yet, we have high aspirations, so wesometimes spend beyond our current means to get what we want.
We indulge ourselves; we are not concerned about budgets. We believe in living for today and we often do things on the spur of the moment.
Basically, we are satisfied with our lives although we work hard and are under a lot of stress.
We expect a lot from our vacations. Since we are workaholics and our lives are so stressful, we feel we deserve our vacations. We escape when we go on vacation and, for us part of the escape is being in luxurious accommodations, being pampered and having lots to do. During the day we go shopping, at night we eat in expensive restaurants and enjoy the entertainment and nightlife. Even though our incomes are not that high, we are extravagant on vacations and we demand the highest quality in everything.
Many of us are interested in taking a cruise, and a number of us feel we will likely do so in the next couple of years. Our concern about cruises is that the quality might not be top notch. The food, the nightlife, and the accommodations may not meet our very high expectations.
3/25/03 2:26 PMCLIA - Cruise Line International Association
Page 10 of 36http://cruising.org/press/overview/ind_overview.cfm

Adventurers
We love to experiment; we are always ready to try new and different experiences. We are confident and independent-minded. We don't like to follow others, nor do we necessarily do things the way they've been done before. Keeping up with the latest fashions or trends is just notimportant to us.
We don't feel a lot of stress in our lives. We are not worriers; we're not concerned about budgets and we actively pursue our interests without being afraid of taking risks.
We are sophisticated travelers; we've traveled a lot and we are confident about our travel and travel planning.
Our interests are adventurous and exciting vacations. We love to visit unusual places and we often travel internationally. We feel a vacation is a learning experience.
We spend a lot on our vacations; not for luxury, but for the exotic and far away types of destinations we go to. We also like to go on camping trips; we often go hiking or mountain climbing.
We also like to participate in cultural activities on vacation. Golfing and gambling are not vacation activities that appeal to us.
We haven't taken a cruise because we are concerned about the constraints, that is, the inability to do what we want when we want.
Comfortable Spenders
We can afford to spend money and we do. We would never compromise quality to save a few dollars. We don't need to be concerned about budgets or to settle for just the basics.
We've reached a level of success that means we don't have to work as hard as some others and we don't feel we are under a lot of stress.
While we are not risk-takers, we are not particularly cautious either. We stay in fashion, but we don't feel the drive to keep up.
We tend to be sports-oriented and physically active. In our leisure time we attend professional sporting events, or we exercise and participate in sports, like bicycling, golf or tennis.
We take more vacations than others, and we feel comfortable spending money on these vacations. We pay more to stay at the best hotels; after all, we can afford to be extravagant. We enjoy resort vacations and we often travel to foreign countries.
When we are on vacation, we enjoy nightlife and dining in fine restaurants. We also like to gamble. We go to beach resorts and sunbathe.Some of us play golf or tennis. We also like to ski.
Although we have never taken a cruise and prefer resort vacations, we are less concerned than others about the expense of cruising. We wouldn't mind dressing up in the evenings.
Cautious Travelers
We're cautious people. We like to stick with what is familiar to us and we don't like to make changes. We are reluctant to try anything new ordifferent or to do things on the spur of the moment. We are not very confident people; we let others take the lead and we tend to be followers.
We are content with the simpler things in life. We don't pay attention to what is fashionable or trendy. While we're not particularly thrifty orbudget conscious, we don't think that it is worth spending money to try to get higher quality.
We are not physically active. In our leisure time we don't swim, play baseball, go skiing or play tennis as much as others.
We are not very confident travelers. We like to take vacations that are close to home. We prefer familiar kinds of vacations; we have littleinterest in trying anything new and different.
Like everyone else on vacation, we go sightseeing and shopping, but we are less interested in eating in fancy restaurants or enjoying thenightlife. We're also less involved in active pursuits like swimming, hiking, skiing and scuba diving.
Of all the segments, we are the least interested in taking a cruise and the least likely to take one in the next few years. We are somewhatconcerned about getting seasick. Taking a cruise is just something we've never done, and we are very reluctant to experiment with unfamiliar experiences.
Segment Summary Profiles
Share of Prospect Market:
31% of Market
Total segment = 19.92M
Hot Prospects = 5.2M
Family Folks 17% of Market
Total segment = 10.92M
Hot Prospects = 4.0M
Want-It-Alls 12% of Market
Total segment = 16.0M
Hot Prospects = 4.8M
Adventurers
25% of Market
Totalsegment =
16.0M
Hot Prospects =
4.8M
Comfortable Spenders
15% of Market
Total segment = 9.6M
Hot Prospects = 1.3M
Cautious Travelers
3/25/03 2:26 PMCLIA - Cruise Line International Association
Page 11 of 36http://cruising.org/press/overview/ind_overview.cfm

Demographics: 40 yrs. old 38% college grads 89% married $48K average income
42 yrs. old 37% college grads 70% married $53K average income On the way up
44 yrs. old 65% college grads 60% married $56K average income Independent-minded
44 yrs. old 56% college grads 76% married $64K average income Physicallyactive
50 yrs. old 49% college grads 66% married $40K average income Cautious
Psychographics: Family orientedPractical, down to earth Budget-conscious Satisfaction with basics Cautious Happier with simpler things
Workaholic FashionableTrendy
Ready to try newthings Willing to take risks Well-traveled IntellectualCultured
Successful Sports-orientedWell traveled Cultured Fashionable
Not physicallyactive Happier with simpler things
Vacations in Past 3 Years:
Average No. = 3Average length-6 days Average per diem=$115 5% tookinternational vac. 43% stayed at resorts 67% traveled withchildren
Average No. = 3Average length = 9 days Average per diem=$157 21% tookinternational vac. 49% stayed at resorts 38% traveled withchildren
Average No. = 4Average length = 8 days Average per diem=$140 24% tookinternational vac. 42% stayed at resorts 25% traveled withchildren
Average No. = 5Average length = 7 days Average per diem=$154 23% tookinternational vac. 59% stayed at resorts 45% traveled with children
Average No. = 3Average length = 7 days Average per diem=$130 8% tookinternational vac. 42% stayed at resorts 29% traveled with children
VacationActivities:
Swimming dining in fine
restaurants cultural
activities gambling nightlife
Not
Not
Not
Not
Shopping Dining in fine restaurants Nightlife
hikingNot
Cultural activitiesHiking
gambling golfing
Not
Not
Dining in finerestaurants Sunbathing Nightlife Gambling GolfingSkiing Tennis
Fewest activies
Interest to Cruise:
35% Likely in next 5 yrs. 26% Hot prospects
46% Likely in next 5 yrs. 37% Hot prospects
33% Likely in next 5yrs. 24% Hot prospects
39% Likely in next 5 yrs. 30% Hot prospects
19% Likely in next 5 yrs. 14% Hot prospects
Barriers to Cruising:
Expense Not for children
Not highest quality
Lack of freedomNot enough to do
No major barriers
Unfamiliarexperience
D. Vacation Behavior and Attitudes
1. Vacation Planning Criteria
Types of Vacations in Past Three Years (Total Vacationers)
On average, vacationers have taken five vacations in the past three years. While past cruisers have vacationed more often than cruise prospects, even among cruise prospects, the majority have taken more than three vacations over the past three years.
Number of Vacations Total Vacationers Cruise Prospects Past Cruisers
None 7% 7% 7%1-3 34% 38% 26%4-6 35% 35% 36%7 or more 24% 20% 31%
3/25/03 2:26 PMCLIA - Cruise Line International Association
Page 12 of 36http://cruising.org/press/overview/ind_overview.cfm

Mean 5 5 6
The large majority of vacationers, both cruises prospects and past cruisers, has taken vacations that are more than three hours from home and have included a hotel stay. Cruise prospects are less likely than past cruisers to have vacationed at a resort hotel, to have taken a package tour, or to have vacationed internationally.
Length of Typical Vacation (Total Vacationers)
Vacationers typically take seven-day vacations. Past cruisers' typical vacations are slightly longer than cruise prospects' vacations.
Days of Typical Vacation
Total Vacationers
Cruise Prospects
Past Cruisers
1-3 6% 7% 3%4-6 40% 41% 36%7-9 34% 32% 37%10 or more 17% 16% 19% Median 7 6 7
Length of Future Cruise (Total Vacationers)
Vacationers are interested in taking cruises of seven days, on average. Past cruisers are somewhat more interested in longer cruises than are cruise prospects.
Number of DaysTotal
VacationersCruise
ProspectsPast
Cruisers
Less than 7 days 17% 20% 12%7 days 36% 35% 36%More than 7 days 33% 30% 39% Median (in days)
7 7 7
Base: Have taken vacations of three days or more in past three years.
Total Spending on Typical Vacation (Total Vacationers)
3/25/03 2:26 PMCLIA - Cruise Line International Association
Page 13 of 36http://cruising.org/press/overview/ind_overview.cfm

On average, vacationers report spending approximately $1,400 in total on a typical vacation. Cruise prospects spend somewhat less than past cruisers.
Total Spent on VacationsTotal
VacationersCruise
ProspectsPast
Cruisers
Under $500 15% 18% 9%$500 to less than $1,000
35% 36% 31%
$1,000 to less than $1,500
20% 19% 21%
$2,000 or more 16% 14% 21% Mean $1,414 $1,253 $1,741
Past cruisers are willing to spend more on a cruise than cruise prospects. But, even among past cruisers, only 2% say they are willing so spend $500 or more per day.
Most Willing to Spend Per Day for Cruise (Total Vacationers)
Sources of Information on Cruises (Total Vacationers)
Primary sources of information on cruises, for both cruise prospects and past cruisers, are friends, family, and magazines. For cruise prospects, TV and radio advertising are also an important information source.
Sources of InformationTotal
VacationersCruise
ProspectsPast
Cruisers
% % %Friends and acquaintances
74 73 75
Family 63 61 69Magazines 43 43 43TV and radio advertising
43 54 20
Travel Agent 30 16 59Internet 25 22 31Other 3 2 5
Cruises Compared to Other Vacations (Total Vacationers)
Both cruise prospects and past cruisers compare cruises very favorably to other vacations in being all inclusive, visiting several destinations, being pampered, and being luxurious. In comparisons to other vacations, past cruisers are generally more favorable than cruise prospects.
3/25/03 2:26 PMCLIA - Cruise Line International Association
Page 14 of 36http://cruising.org/press/overview/ind_overview.cfm
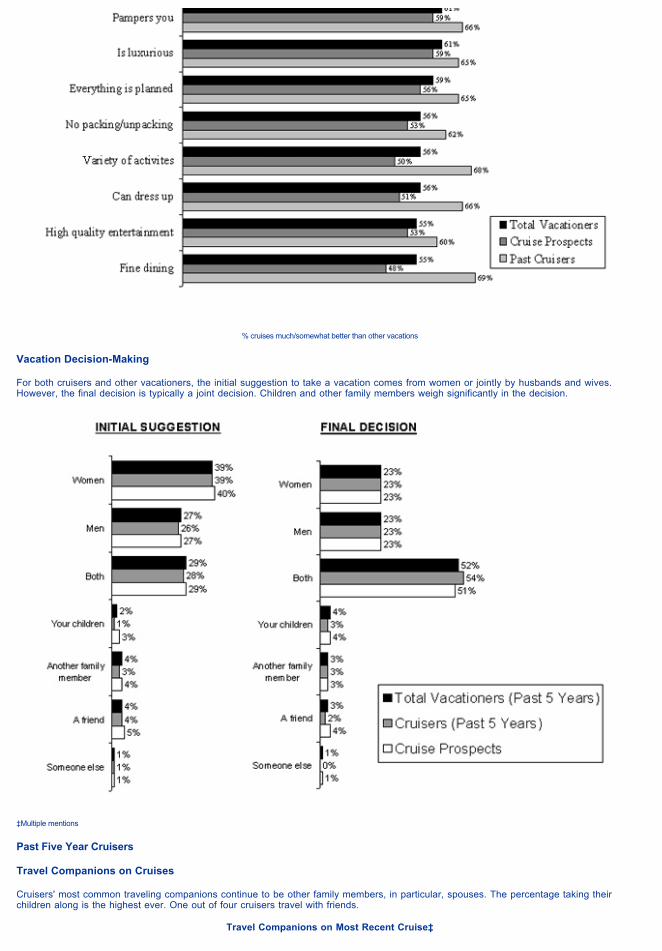
% cruises much/somewhat better than other vacations
Vacation Decision-Making
For both cruisers and other vacationers, the initial suggestion to take a vacation comes from women or jointly by husbands and wives. However, the final decision is typically a joint decision. Children and other family members weigh significantly in the decision.
‡Multiple mentions
Past Five Year Cruisers
Travel Companions on Cruises
Cruisers' most common traveling companions continue to be other family members, in particular, spouses. The percentage taking their children along is the highest ever. One out of four cruisers travel with friends.
Travel Companions on Most Recent Cruise‡
3/25/03 2:26 PMCLIA - Cruise Line International Association
Page 15 of 36http://cruising.org/press/overview/ind_overview.cfm

Used the Internet for Vacation Information (Total Vacationers)
More than half of all vacationers, both cruise prospects and past cruisers, have used the Internet to obtain information on travel destinations, hotels, and airlines.
Used the Internet for Vacation Booking (Total Vacationers)
One out of three vacationers have used the Internet to book airline flights. Hotels, resorts, spas, and other places to stay have been booked on the Internet by 28% of all vacationers.
3/25/03 2:26 PMCLIA - Cruise Line International Association
Page 16 of 36http://cruising.org/press/overview/ind_overview.cfm
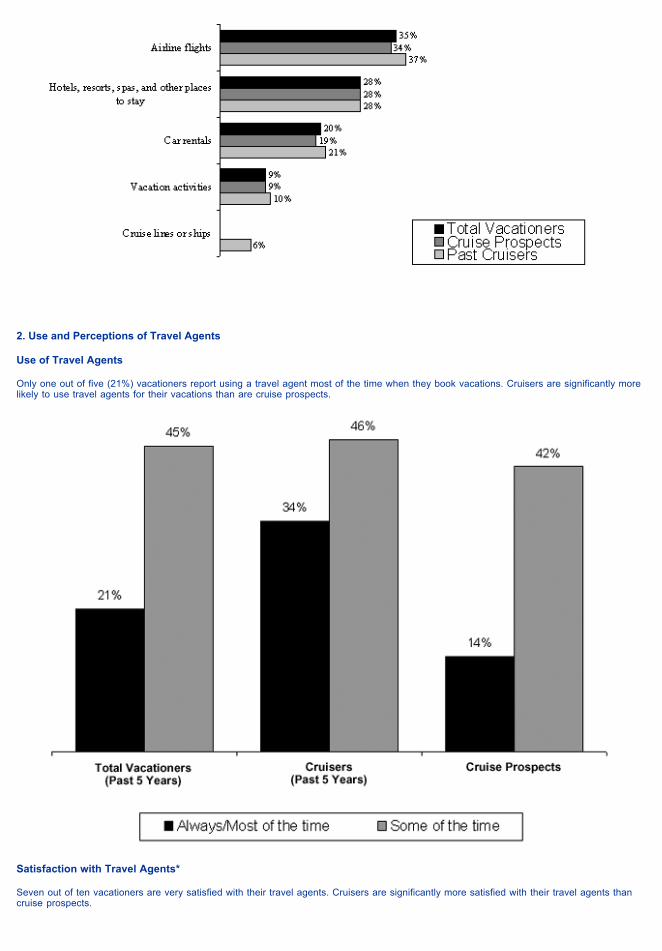
2. Use and Perceptions of Travel Agents
Use of Travel Agents
Only one out of five (21%) vacationers report using a travel agent most of the time when they book vacations. Cruisers are significantly more likely to use travel agents for their vacations than are cruise prospects.
Satisfaction with Travel Agents*
Seven out of ten vacationers are very satisfied with their travel agents. Cruisers are significantly more satisfied with their travel agents than cruise prospects.
3/25/03 2:26 PMCLIA - Cruise Line International Association
Page 17 of 36http://cruising.org/press/overview/ind_overview.cfm

Perceptions of Travel Agents
Vacationers generally believe in the knowledgeability and competency of travel agents, and that travel agents take the hassle out of planning vacations. It is important to vacationers that travel agents have access to email or the Internet.
3. Cruising vs. Other Vacations
I. Types of Vacation Taken
Types of Vacations Taken in Past Five Years
Cruise prospects take a significant cross-section of vacations. They are not a homogeneous group.
II. Cruise Satisfaction - Past Cruisers
Past Cruisers Satisfaction Ratings of Vacations
While on an overall basis, virtually any vacation creates a high level of satisfaction, cruises generate the highest level of "extremely" satisfied vacationers.
3/25/03 2:26 PMCLIA - Cruise Line International Association
Page 18 of 36http://cruising.org/press/overview/ind_overview.cfm

Satisfaction with Vacations Taken in Past 5 Years*- % Extremely Satisfied -
ExtremelySatisfied
%
CruiseVacation House RentalVisit to Friends/RelativesPackage TourResort VacationLand-Based Escorted TourTrip Using Individual ReservationsVacation as Part of a Business Trip
3430292524242319
Past Five Year Cruisers Perceptions of Cruises vs. Other Vacations
Overall, nine out of ten past five year cruisers see cruises as better than or the same as other vacations on almost all dimensions. Cruises are rated best compared to other vacations on being pampered, offering fine dining, and being hassle free.
Rated CruisesBetter
%
Same or Better
%
Being pampered 75 93
Fine dining 74 92
Being hassle free 71 93
Relaxing and getting away from it all 69 91
Chance to visit several destinations 68 88
Being easy to plan and arrange 65 92
Good value for the money 65 91
High quality entertainment 64 88
Variety of activities 64 86
Being luxurious! 62 89
Good way to explore a vacation area you may want to return to
62 85
Being exciting and adventurous 60 85
Romantic getaway 59 86
Being reliable 58 89
Fun vacation 58 87
Being safe 53 90
Comfortable accommodations 51 78
A cultural learning experience 47 79
Participation in sports you enjoy 36 67
Having good activities for children 28 45
III. Cruise Perception - Prospects
Perceptions of Cruises vs. Other Vacations
3/25/03 2:26 PMCLIA - Cruise Line International Association
Page 19 of 36http://cruising.org/press/overview/ind_overview.cfm

Rated CruisesBetter
%
Same or Better
%
Being pampered 65 85
Fine dining 62 87
Being hassle free 44 83
Relaxing and getting away from it all 57 82
Chance to visit several destinations 61 83
Being easy to plan and arrange 45 82
Good value for the money 31 65
High quality entertainment 50 84
Variety of activities 35 69
Being luxurious! 58 84
Good way to explore a vacation area you may want to return to
41 71
Being exciting and adventurous 42 74
Romantic getaway 56 82
Being reliable 33 78
Fun vacation 39 78
Being safe 24 71
Comfortable accommodations 29 70
A cultural learning experience 41 74
Participation in sports you enjoy 19 54
Having good activities for children 25 53
IV. Destination Sampling
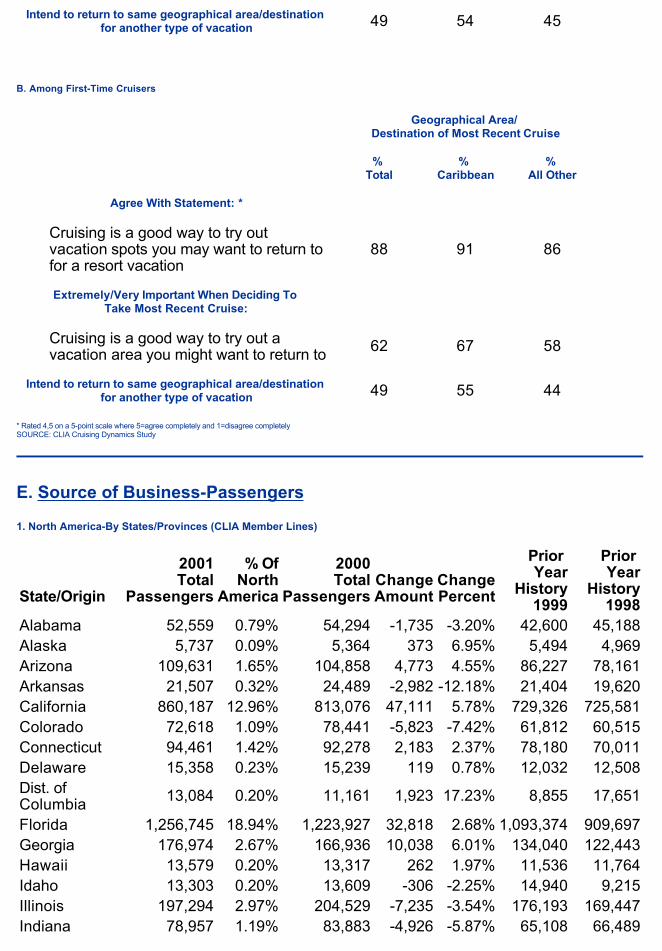
Cruising is seen by the large majority as a good way to sample a geographical area/destination for future vacations (85% of frequent cruisers and 88% of first-time cruisers). In fact, for more than half of all cruisers, an important consideration in choosing their particular cruise was to screen the geographical areas/destinations they visited. And, after sampling the geographical areas/destinations on their recent cruise, half say they will return for another type of vacation.
A. Among Frequent Cruisers
Geographical Area/ Destination of Most Recent Cruise
% Total
% Caribbean
% All Other
Agree With Statement: *
Cruising is a good way to try out vacation spots you may want to return to for a resort vacation
85 86 84
Extremely/Very Important When Deciding To Take Most Recent Cruise:
Cruising is a good way to try out a vacation area you might want to return to
55 56 54
3/25/03 2:26 PMCLIA - Cruise Line International Association
Page 20 of 36http://cruising.org/press/overview/ind_overview.cfm
Intend to return to same geographical area/destination for another type of vacation 49 54 45
B. Among First-Time Cruisers
Geographical Area/ Destination of Most Recent Cruise
% Total
% Caribbean
% All Other
Agree With Statement: *
Cruising is a good way to try out vacation spots you may want to return to for a resort vacation
88 91 86
Extremely/Very Important When Deciding To Take Most Recent Cruise:
Cruising is a good way to try out a vacation area you might want to return to
62 67 58
Intend to return to same geographical area/destination for another type of vacation 49 55 44
* Rated 4,5 on a 5-point scale where 5=agree completely and 1=disagree completelySOURCE: CLIA Cruising Dynamics Study
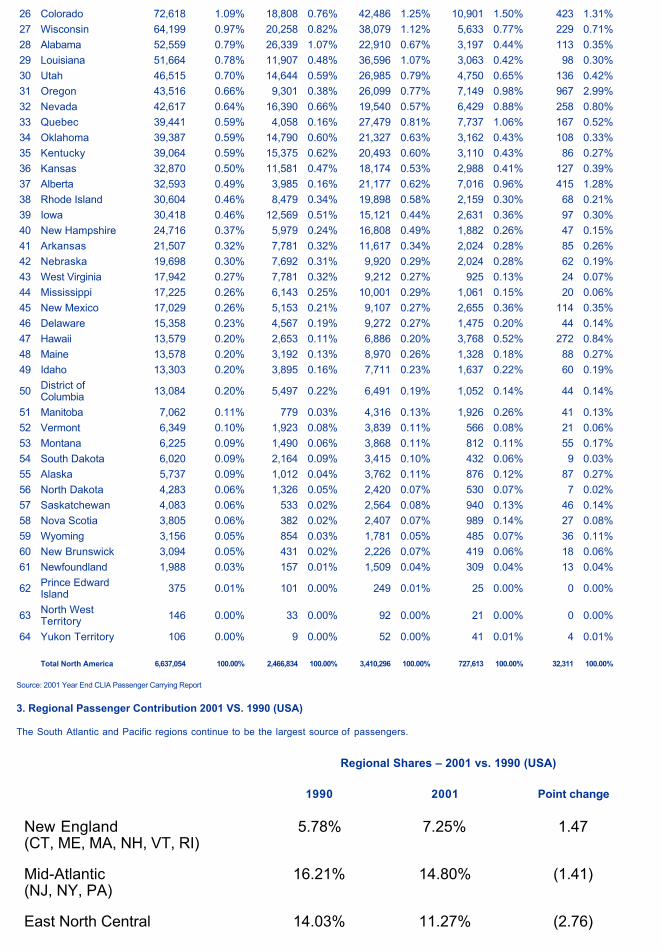
E. Source of Business-Passengers
1.!North America-By States/Provinces (CLIA Member Lines)
State/Origin
2001Total
Passengers
% OfNorth
America
2000Total
PassengersChangeAmount
ChangePercent
Prior Year
History1999
Prior Year
History1998
Alabama 52,559 0.79% 54,294 -1,735 -3.20% 42,600 45,188Alaska 5,737 0.09% 5,364 373 6.95% 5,494 4,969Arizona 109,631 1.65% 104,858 4,773 4.55% 86,227 78,161Arkansas 21,507 0.32% 24,489 -2,982 -12.18% 21,404 19,620California 860,187 12.96% 813,076 47,111 5.78% 729,326 725,581Colorado 72,618 1.09% 78,441 -5,823 -7.42% 61,812 60,515Connecticut 94,461 1.42% 92,278 2,183 2.37% 78,180 70,011Delaware 15,358 0.23% 15,239 119 0.78% 12,032 12,508Dist. of Columbia
13,084 0.20% 11,161 1,923 17.23% 8,855 17,651
Florida 1,256,745 18.94% 1,223,927 32,818 2.68% 1,093,374 909,697Georgia 176,974 2.67% 166,936 10,038 6.01% 134,040 122,443Hawaii 13,579 0.20% 13,317 262 1.97% 11,536 11,764Idaho 13,303 0.20% 13,609 -306 -2.25% 14,940 9,215Illinois 197,294 2.97% 204,529 -7,235 -3.54% 176,193 169,447Indiana 78,957 1.19% 83,883 -4,926 -5.87% 65,108 66,489
3/25/03 2:26 PMCLIA - Cruise Line International Association
Page 21 of 36http://cruising.org/press/overview/ind_overview.cfm

Iowa 30,418 0.46% 32,356 -1,938 -5.99% 27,922 27,987Kansas 32,870 0.50% 32,507 363 1.12% 27,304 26,224Kentucky 39,064 0.59% 40,079 -1,015 -2.53% 31,194 30,587Louisiana 51,664 0.78% 74,984 -23,320 -31.10% 95,215 73,894Maine 13,578 0.20% 13,765 -187 -1.36% 11,771 12,226Maryland 105,385 1.59% 98,731 6,654 6.74% 81,976 74,881Massachusetts 279,463 4.21% 200,219 79,244 39.58% 171,572 172,542Michigan 170,928 2.58% 175,330 -4,402 -2.51% 141,664 137,546Minnesota 85,599 1.29% 82,952 2,647 3.19% 92,805 81,892Mississippi 17,225 0.26% 19,297 -2,072 -10.74% 18,773 15,708Missouri 80,210 1.21% 85,303 -5,093 -5.97% 70,389 76,569Montana 6,225 0.09% 6,542 -317 -4.85% 5,941 6,596Nebraska 19,698 0.30% 22,502 -2,804 -12.46% 17,575 18,544Nevada 42,617 0.64% 40,262 2,355 5.85% 31,035 28,796New Hampshire
24,716 0.37% 23,321 1,395 5.98% 19,016 17,040
New Jersey 251,562 3.79% 252,716 -1,154 -0.46% 199,176 176,812New Mexico 17,029 0.26% 16,009 1,020 6.37% 12,640 12,771New York 416,073 6.27% 433,489 -17,416 -4.02% 472,680 404,023North Carolina 137,623 2.07% 147,487 -9,864 -6.69% 121,989 106,459North Dakota 4,283 0.06% 4,137 146 3.53% 3,628 4,122Ohio 186,696 2.81% 198,161 -11,465 -5.79% 162,659 161,323Oklahoma 39,387 0.59% 38,929 458 1.18% 33,707 33,031Oregon 43,516 0.66% 46,963 -3,447 -7.34% 38,227 40,818Pennsylvania 249,130 3.75% 262,587 -13,457 -5.12% 201,364 192,689South Carolina
81,564 1.23% 76,443 5,121 6.70% 62,843 55,622
South Dakota 6,020 0.09% 5,931 89 1.50% 4,719 4,238Tennessee 80,311 1.21% 78,185 2,126 2.72% 67,441 65,244Texas 294,196 4.43% 276,688 17,508 6.33% 237,776 199,068Utah 46,515 0.70% 45,602 913 2.00% 35,725 33,496Vermont 6,349 0.10% 6,086 263 4.32% 5,090 4,895Virginia 129,086 1.94% 129,612 -526 -0.41% 113,044 109,182Washington 109,063 1.64% 107,016 2,047 1.91% 89,899 83,682West Virginia 17,.942 0.27% 11,299 6,643 58.79% 10,210 9,278Wisconsin 64,199 0.97% 65,566 -1,367 -2.08% 54,842 51,228Wyoming 3,156 0.05% 3,521 -365 -10.37% 2,766 3,056
Total U.S. 6,195,958 93.35% 6,090,647 105,311 1.73% 5,342,103 4,899,694
Puerto Rico 107,903 1.63% 84,464 23,439 27.75% 80,812 85,377
CanadaAlberta 32,593 0.49% 31,582 1,011 3.20% 23,469 24,959British Columbia
100,164 1.51% 101,283 -1,119 -1.10% 85,656 89,059
Manitoba 7,062 0.11% 7,238 -176 -2.43% 5,316 5,398
3/25/03 2:26 PMCLIA - Cruise Line International Association
Page 22 of 36http://cruising.org/press/overview/ind_overview.cfm

New Brunswick
3,094 0.05% 3,030 64 2.11% 2,634 1,998
Newfoundland 1,988 0.03% 1,927 61 3.17% 1,210 1,308Nova Scotia 3,805 0.06% 3,762 43 1.14% 4,188 2,541Ontario 140,336 2.11% 159,385 -19,049 -11.95% 118,296 105,162Prince Edward Island
375 0.01% 572 -197 -34.44% 439 856
Quebec 39,441 0.59% 56,427 -16,986 -30.10% 22,268 21,852Saskatchewan 4,083 0.06% 4,107 -24 -0.58% 3,251 4,808North West Territory
146 0.00% 940 -794 -84.47% 113 175
Yukon Territory
106 0.00% 170 -64 -37.65% 132 160
Total Canada 333,193 5.02% 370,423 -37,230 -10.05% 266,972 258,276
Total North America
6,637,054 100.00% 6,545,534 91,520 1.40% 5,689,887 5,243,347
Foreign 862,371 668,553 21,269 28.99% 647,284 625,345
Total World 7,499,425 7,214,087 112,789 3.96% 6,337,171 5,868,692
Source: 2001 Year End CLIA Passenger Carrying Report
2.!North America-Rank Order By States/Provinces (CLIA Member Lines)
Florida, California, New York, Texas, Massachusetts, New Jersey, Pennsylvania, Illinois, Ohio, and Georgia represent 62.8% of North American passenger contribution.
Comparative Data by Cruise Length
State/ProvinceTotal
Passengers% Of North
America
1 - 5 Day 6 - 8 Day 9 - 17 Day 18 Day Plus
Cruises Amount
% Cruises Amount
% Cruises Amount
% Cruises Amount
%
1 Florida 1,256,745 18.94% 604,322 24.50% 525,500 15.41% 122,808 16.88% 4,115 12.74%
2 California 860,187 12.96% 330,991 13.42% 361,621 10.60% 160,075 22.00% 7,500 23.21%
3 New York 416,073 6.27% 120,990 4.90% 254,404 7.46% 39,247 5.39% 1,432 4.43%
4 Texas 294,196 4.43% 122,388 4.96% 142,372 4.17% 27,571 3.79% 1,865 5.77%
5 Massachusetts 279,463 4.21% 94,772 3.84% 165,709 4.86% 18,523 2.55% 459 1.42%
6 New Jersey 251,562 3.79% 74,770 3.03% 152,722 4.48% 23,394 3.22% 676 2.09%
7 Pennsylvania 249,130 3.75% 80,595 3.27% 146,266 4.29% 21,588 2.97% 681 2.11%
8 Illinois 197,294 2.97% 61,405 2.49% 113,167 3.32% 22,032 3.03% 690 2.14%
9 Ohio 186,696 2.81% 65,503 2.66% 104,539 3.07% 16,135 2.22% 519 1.61%
10 Georgia 176,974 2.67% 100,163 4.06% 65,744 1.93% 10,692 1.47% 375 1.16%
11 Michigan 170,928 2.58% 55,031 2.23% 100,142 2.94% 15,133 2.08% 622 1.93%
12 Ontario 140,336 2.11% 22,197 0.90% 89,563 2.63% 27,080 3.72% 1,496 4.63%
13 North Carolina 137,623 2.07% 74,714 3.03% 54,018 1.58% 8,592 1.18% 299 0.93%
14 Virginia 129,086 1.94% 52,930 2.15% 63,427 1.86% 12,295 1.69% 434 1.34%
15 Arizona 109,631 1.65% 34,690 1.41% 55,712 1.63% 18,107 2.49% 1,122 3.47%
16 Washington 109,063 1.64% 27,885 1.13% 62,515 1.83% 17,244 2.37% 1,419 4.39%
17 Puerto Rico 107,903 1.63% 31,105 1.26% 75,253 2.21% 1,529 0.21% 16 0.05%
18 Maryland 105,385 1.59% 34,743 1.41% 60,211 1.77% 10,036 1.38% 395 1.22%
19 British Columbia 100,164 1.51% 29,060 1.18% 51,221 1.50% 17,816 2.45% 2,067 6.40%
20 Connecticut 94,461 1.42% 25,073 1.02% 61,087 1.79% 7,906 1.09% 395 1.22%
21 Minnesota 85,599 1.29% 20,160 0.82% 57,965 1.70% 7,200 0.99% 274 0.85%
22 South Carolina 81,564 1.23% 51,641 2.09% 24,726 0.73% 5,016 0.69% 181 0.56%
23 Tennessee 80,311 1.21% 35,942 1.46% 38,614 1.13% 5,592 0.77% 163 0.50%
24 Missouri 80,210 1.21% 25,936 1.05% 45,771 1.34% 8,152 1.12% 351 1.09%
25 Indiana 78,957 1.19% 29,817 1.21% 43,168 1.27% 5,723 0.79% 249 0.77%
3/25/03 2:26 PMCLIA - Cruise Line International Association
Page 23 of 36http://cruising.org/press/overview/ind_overview.cfm
26 Colorado 72,618 1.09% 18,808 0.76% 42,486 1.25% 10,901 1.50% 423 1.31%
27 Wisconsin 64,199 0.97% 20,258 0.82% 38,079 1.12% 5,633 0.77% 229 0.71%
28 Alabama 52,559 0.79% 26,339 1.07% 22,910 0.67% 3,197 0.44% 113 0.35%
29 Louisiana 51,664 0.78% 11,907 0.48% 36,596 1.07% 3,063 0.42% 98 0.30%
30 Utah 46,515 0.70% 14,644 0.59% 26,985 0.79% 4,750 0.65% 136 0.42%
31 Oregon 43,516 0.66% 9,301 0.38% 26,099 0.77% 7,149 0.98% 967 2.99%
32 Nevada 42,617 0.64% 16,390 0.66% 19,540 0.57% 6,429 0.88% 258 0.80%
33 Quebec 39,441 0.59% 4,058 0.16% 27,479 0.81% 7,737 1.06% 167 0.52%
34 Oklahoma 39,387 0.59% 14,790 0.60% 21,327 0.63% 3,162 0.43% 108 0.33%
35 Kentucky 39,064 0.59% 15,375 0.62% 20,493 0.60% 3,110 0.43% 86 0.27%
36 Kansas 32,870 0.50% 11,581 0.47% 18,174 0.53% 2,988 0.41% 127 0.39%
37 Alberta 32,593 0.49% 3,985 0.16% 21,177 0.62% 7,016 0.96% 415 1.28%
38 Rhode Island 30,604 0.46% 8,479 0.34% 19,898 0.58% 2,159 0.30% 68 0.21%
39 Iowa 30,418 0.46% 12,569 0.51% 15,121 0.44% 2,631 0.36% 97 0.30%
40 New Hampshire 24,716 0.37% 5,979 0.24% 16,808 0.49% 1,882 0.26% 47 0.15%
41 Arkansas 21,507 0.32% 7,781 0.32% 11,617 0.34% 2,024 0.28% 85 0.26%
42 Nebraska 19,698 0.30% 7,692 0.31% 9,920 0.29% 2,024 0.28% 62 0.19%
43 West Virginia 17,942 0.27% 7,781 0.32% 9,212 0.27% 925 0.13% 24 0.07%
44 Mississippi 17,225 0.26% 6,143 0.25% 10,001 0.29% 1,061 0.15% 20 0.06%
45 New Mexico 17,029 0.26% 5,153 0.21% 9,107 0.27% 2,655 0.36% 114 0.35%
46 Delaware 15,358 0.23% 4,567 0.19% 9,272 0.27% 1,475 0.20% 44 0.14%
47 Hawaii 13,579 0.20% 2,653 0.11% 6,886 0.20% 3,768 0.52% 272 0.84%
48 Maine 13,578 0.20% 3,192 0.13% 8,970 0.26% 1,328 0.18% 88 0.27%
49 Idaho 13,303 0.20% 3,895 0.16% 7,711 0.23% 1,637 0.22% 60 0.19%
50 District of Columbia 13,084 0.20% 5,497 0.22% 6,491 0.19% 1,052 0.14% 44 0.14%
51 Manitoba 7,062 0.11% 779 0.03% 4,316 0.13% 1,926 0.26% 41 0.13%
52 Vermont 6,349 0.10% 1,923 0.08% 3,839 0.11% 566 0.08% 21 0.06%
53 Montana 6,225 0.09% 1,490 0.06% 3,868 0.11% 812 0.11% 55 0.17%
54 South Dakota 6,020 0.09% 2,164 0.09% 3,415 0.10% 432 0.06% 9 0.03%
55 Alaska 5,737 0.09% 1,012 0.04% 3,762 0.11% 876 0.12% 87 0.27%
56 North Dakota 4,283 0.06% 1,326 0.05% 2,420 0.07% 530 0.07% 7 0.02%
57 Saskatchewan 4,083 0.06% 533 0.02% 2,564 0.08% 940 0.13% 46 0.14%
58 Nova Scotia 3,805 0.06% 382 0.02% 2,407 0.07% 989 0.14% 27 0.08%
59 Wyoming 3,156 0.05% 854 0.03% 1,781 0.05% 485 0.07% 36 0.11%
60 New Brunswick 3,094 0.05% 431 0.02% 2,226 0.07% 419 0.06% 18 0.06%
61 Newfoundland 1,988 0.03% 157 0.01% 1,509 0.04% 309 0.04% 13 0.04%
62 Prince Edward Island 375 0.01% 101 0.00% 249 0.01% 25 0.00% 0 0.00%
63 North West Territory 146 0.00% 33 0.00% 92 0.00% 21 0.00% 0 0.00%
64 Yukon Territory 106 0.00% 9 0.00% 52 0.00% 41 0.01% 4 0.01%
Total North America 6,637,054 100.00% 2,466,834 100.00% 3,410,296 100.00% 727,613 100.00% 32,311 100.00%
Source: 2001 Year End CLIA Passenger Carrying Report
3. Regional Passenger Contribution 2001 VS. 1990 (USA)
The South Atlantic and Pacific regions continue to be the largest source of passengers.
Regional Shares – 2001 vs. 1990 (USA)
1990 2001 Point change
New England(CT, ME, MA, NH, VT, RI)
5.78% 7.25% 1.47
Mid-Atlantic (NJ, NY, PA)
16.21% 14.80% (1.41)
East North Central 14.03% 11.27% (2.76)
3/25/03 2:26 PMCLIA - Cruise Line International Association
Page 24 of 36http://cruising.org/press/overview/ind_overview.cfm

(IL, IN, MI, OH, WI)
West North Central (IA, KS, MN, MO, NE, SD)
4.50% 4.18% (0.32)
South Atlantic (DE, DC, FL, GA, MD, NC, SC, VA, WV)
24.16% 31.21% 7.05
East South Central(AL, KY, MS, TN)
2.86% 3.05% 0.19
West South Central (AR, LA, OK, TX)
5.42% 6.56% 1.14
Mountain (AZ, CO, ID, MT, NV, NM, UT, WY)
3.86% 5.02% 1.16
Pacific (AK, CA, HI, OR, WA)
23.18% 16.66% (6.52)
TOTAL 100.0% 100.0% 0.00
SOURCE: 2001 Year End CLIA Passenger Carryings Reports.
4. Regional Contribution by Cruise Length (USA)
Shorter cruises skew towards the South Atlantic Region while longer cruises skew to the Pacific Coast Region.
2001Regional Contribution (%) By Cruise Length (USA)
2-5 Days 6-8 Days 9-17 Days 18+ Days Total Days
New England (CT, ME, MA, NH, VT, RI)
5.87 8.82 4.89 3.85 7.25
Mid-Atlantic (NJ, NY, PA) 11.65 17.67 12.738 9.96 14.80
East North Central (IL, IN, MI, OH, WI) 9.77 12.74 9.77 8.25 11.27
West North Central (IA, KS, MN, MO, NE, ND, SD)
3.42 4.88 3.62 3.31 4.18
South Atlantic (DE, DC, FL, GA, MD, NC, SC, VA, WV)
39.45 26.13 26.13 21.11 31.21
East South Central (AL, KY, MS, TN) 3.53 2.94 1.96 1.36 3.05
West South Central (AR, LA, OK, TX) 6.61 6.77 5.41 7.70 6.56
Mountain
3/25/03 2:26 PMCLIA - Cruise Line International Association
Page 25 of 36http://cruising.org/press/overview/ind_overview.cfm

(AZ, CO, ID, MT, NV, NM, UT, WY)
4.04 5.34 6.92 7.87 5.02
Pacific (AK, CA, HI, OR, WA) 15.66 14.71 28.57 36.59 16.66
TOTAL 100.0% 100.0% 100.0% 100.0% 100.0%
SOURCE: 2001 Year-End CLIA Passenger Carryings Report
F. Cruise Capacity
1. North American Passenger Capacity - 2002
Including 2001 capacity changes, CLIA member lines represent approximately 97.5% of the North American cruise market capacity ( lowers ) and 80.2% of ships.
SUMMARY
# OF LOWERS(OPERATING)
# OF SHIPS(OPERATING)
CLIA MEMBER LINES 169,579 97.5% 134 80.2%
NON-CLIA 4,267 2.5% 33 19.8%
TOTAL 173,846 100.0% 167 100.0%
INDIVIDUAL LINE DETAIL
CRUISE MEMBER LINES NO. OF LOWERS
NO. OF SHIPS
PRIMARY NON-CLIA NO. OF LOWERS
NO. OF SHIPS
American Cruise Line
49 1 American Canadian Cruise Line
444 5
Bora Bora Cruises* 148 2 American West Steamboat Co.
370 2
Carnival Cruise Lines
30,742 15 Classical Cruises 312 4
Celebrity Cruises 14,068 8 Clipper Cruise Line 490 4
Costa Cruise Lines 10,183 8 Club Med 386 1
Crystal Cruises 1,884 2 Europamerica River 1,697 14
Cunard Line, Ltd. 2,459 2 Star Clipper 568 3
Disney Cruise Line 3,508 2 TOTAL 4,267 33
First European 5,122 5
Fred. Olsen Cruise Lines*
1,517 2
Holland America Line
13,348 10
3/25/03 2:26 PMCLIA - Cruise Line International Association
Page 26 of 36http://cruising.org/press/overview/ind_overview.cfm

Mediterranean Shipping Cruises
2,591 3
Norwegian Coastal Voyages
5,603 13
Norwegian Cruise Line
14,682 8
Orient Lines, Inc. 1,881 2
Princess Cruises 18,020 10
Radisson Seven Seas Cruises
2,224 6
Regal Cruises 873 1
Royal Caribbean International
33,042 15
Royal Olympic Cruises
4,145 7
Seabourn Cruise Line
1,382 4
Silversea Cruises 1,356 4
Windstar Cruises 752 4
TOTAL 169,579 134
* New Members Starting 2002.
SOURCE: CLIA 5-Year Capacity Analysis
2. 2002-2006 Capacity Changes
Based on public information, a total of 42 new ships are contracted or planned to be added to the North American fleet from 2002 through the end of 2006.
The following summarizes all the information as of the date of publication. Ships under "contract" are self-explanatory: "Planned" ships have been announced but we have no confirmation of a contract being signed.
2002
ADDITION OR
DELETIONDELIVERY
DATE SHIP NAME#
LOWER
CONTRACT OR
PLANNED
NEW OR
USED
AMERICAN CRUISE LINE A 7/02 AMERICAN GLORY 49 C N
CARNIVAL CRUISE LINE A 2002 CARNIVAL CONQUEST 2,955 C N
CARNIVAL CRUISE LINE A 2002 CARNIVAL LEGEND 2,119 C N
CARNIVAL CRUISE LINE A 2002 CARNIVAL PRIDE 2,119 C N
CELEBRITY CRUISES A 6/02 CONSTELLATION 1,950 C N
COSTA CRUISE LINE A 4/02 COSTA EUROPA 1,494 C U
FIRST EUROPEAN
3/25/03 2:26 PMCLIA - Cruise Line International Association
Page 27 of 36http://cruising.org/press/overview/ind_overview.cfm

CRUISES A 3/02 EUROPEAN STARS 1,500 C N
HOLLAND AMERICA LINE A 12/02 ZUIDERDAM 1,848 C N
HOLLAND AMERICA LINE A 4/02 PRINSENDAM 794 C U
HOLLAND AMERICA LINE D 4/02 WESTERDAM -1,494 C U
NORWEGIAN CRUISE LINE A 2002 NORWEGIAN DAWN 2,240 C N
ORIENT LINES A 2002 OCEAN VOYAGER 650 C U
PRINCESS CRUISES A 2/02 STAR PRINCESS 2,600 C N
PRINCESS CRUISES A 12/02 CORAL PRINCESS 1,950 C N
PRINCESS CRUISES D 4/02 CROWN PRINCESS -1,590 C U
PRINCESS CRUISES D 10/02 OCEAN PRINCESS -1,950 C U
PRINCESS CRUISES D 11/02 PACIFIC PRINCESS -640 C U
ROYAL CARIBBEAN INT'L A 7/02
BRILLIANCE OF THE SEAS 2,100 C N
ROYAL CARIBBEAN INT'L D 3/02 VIKING SERENADE -1,512 C U
ROYAL OLYMPIC CRUISES A 5/02 OLYMPIC EXPLORER 836 C N
SEABOURN CRUISE LINE D 2002 SEABOURN SUN -758 C U
CLIA TOTAL 17,260
2002 GRAND TOTAL 17,260
2003
ADDITION OR
DELETIONDELIVERY
DATE SHIP NAME#
LOWER
CONTRACT OR
PLANNED
NEW OR
USED
AMERICAN CRUISE LINES A 9/03 TBA 117 P N
CARNIVAL CRUISE LINE A 2003 CARNIVAL GLORY 2,955 C N
COSTA CRUISE LINE A 7/03COSTA MEDITERRANEA 2,114 C N
COSTA CRUISE LINE A 12/03 COSTA FORTUNA 2,720 C N
CRYSTAL CRUISES A 6/03 CRYSTAL SERENITY 1,080 C N
CUNARD LINE A 2003 QUEEN MARY 2 2,620 C N
FIRST EUROPEAN A 2003 UNNAMED 1,950 P N
HOLLAND AMERICA LINE A 06/03 OOSTERDAM 1,848 C N
MSC ITALIAN CRUISES A 2003 TBA 1,600 C N
NORWEGIAN CRUISE LINE A 2003 UNNAMED 2,000 P N
3/25/03 2:26 PMCLIA - Cruise Line International Association
Page 28 of 36http://cruising.org/press/overview/ind_overview.cfm

PRINCESS CRUISES A 6/03 ISLAND PRINCESS 1,950 C N
PRINCESS CRUISES A 7/03DIAMOND PRINCESS 2,600 C N
RADISSON SEVEN SEAS A 3/03 VOYAGER 712 C N
ROYAL CARIBBEAN INT'L A 12/03
SERENADE OF THE SEA 2,100 C N
ROYAL CARIBBEAN INT'L. A 03/03
NAVIGATOR OF THE SEA 3,114 C N
CLIA TOTAL 29,480
2003 GRAND TOTAL 29,480
2004 ADDITION OR
DELETION
DELIVERYDATE
SHIP NAME # LOWER
CONTRACT OR
PLANNED
NEW ORUSED
CARNIVAL CRUISE LINE A 2004 CARNIVAL VALOR 2,955 C N
CARNIVAL CRUISE LINE A 2004CARNIVAL MIRACLE 2,119 C N
COSTA CRUISE LINE A 12/04 COSTA MAGICA 2,720 C N
FIRST EUROPEAN CRUISES A 2004 UNNAMED 1,950 P N
HOLLAND AMERICA LINE A 4/04 UNNAMED 1,848 C N
MSC ITALIAN CRUISES A 2004 TBA 1,600 P N
NORWEGIAN CRUISE LINE A 2004 UNNAMED 2,000 P N
PRINCESS CRUISES A 5/04SAPPHIRE PRINCESS 2,600 C N
ROYAL CARIBBEAN, INTL. A 3/04MARINER OF THE SEA 3,114 C N
ROYAL CARIBBEAN, INTL. A 7/04JEWEL OF THE SEA 2,100 C N
CLIA TOTAL 23,006
2004 GRAND TOTAL 23,006
2005 ADDITIONOR
DELETION
DELIVERYDATE
SHIP NAME # LOWER
CONTRACTOR
PLANNED
NEW OR
USED
HOLLAND AMERICA LINE A 10/05 UNNAMED 1,848 C N
NORWEGIAN CRUISE LINE A 2005 UNNAMED 2,000 P N
CLIA TOTAL 3,848
2005 GRAND TOTAL 3,848
3/25/03 2:26 PMCLIA - Cruise Line International Association
Page 29 of 36http://cruising.org/press/overview/ind_overview.cfm

2006 ADDITIONOR
DELETION
DELIVERYDATE
SHIP NAME # LOWER
CONTRACTOR
PLANNED
NEW OR
USED
HOLLAND AMERICA LINE A 5/06 UNNAMED 1,848 P N
NORWEGIAN CRUISE LINE A 2006 UNNAMED 2,000 P N
CLIA TOTAL 3,848
2006 GRAND TOTAL 3,848
3. Composite Capacity Changes 1981-2006
In order to keep capacity in line with North American demand, average capacity rose at a rate of 7.8% from 1981 to 2000. Based on current known information, contracted capacity will be increased at an average rate of 7% over the next six years.
Total North American Industry
Lower Berths % Change
1981 41,073
1982 47,266 +15.80
1983 47,834 +1.20
1984 52,392 +9.53
1985 56,771 +8.36
1986 60,446 +6.47
1987 66,810 +10.53
1988 72,268 +8.17
1989 72,369 +0.17
1990 83,533 +15.39
1991 86,631 +3.71
1992 97,539 +12.10
1993 103,988 +6.62
1994 103,296 -.67
1995 105,171 +1.80
1996 110,292 +4.80
1997 118,399 +7.40
1998 138,373 +17.25
3/25/03 2:26 PMCLIA - Cruise Line International Association
Page 30 of 36http://cruising.org/press/overview/ind_overview.cfm

1999 148,750 +7.50
2000 166,201 +11.73
2001 172,281 +3.70
Average Annual Change (1981-2001)
+7.6
Total North American Industry
Contracted Contracted & Planned
2002-2006 Lower Berths
Percent Change
Lower Berths
Percent Change
2002 189,441 10.0 189,441 10.0
2003 214,854 13.4 218,921 15.6
2004 232,310 8.1 241,927 10.5
2005 234,158 0.8 245,775 1.6
2006 234,158 0.0 249,623 1.6
Average Annual Change (2002-
2006)
6.5
7.9
SOURCE: CLIA Five Year Capacity Reports
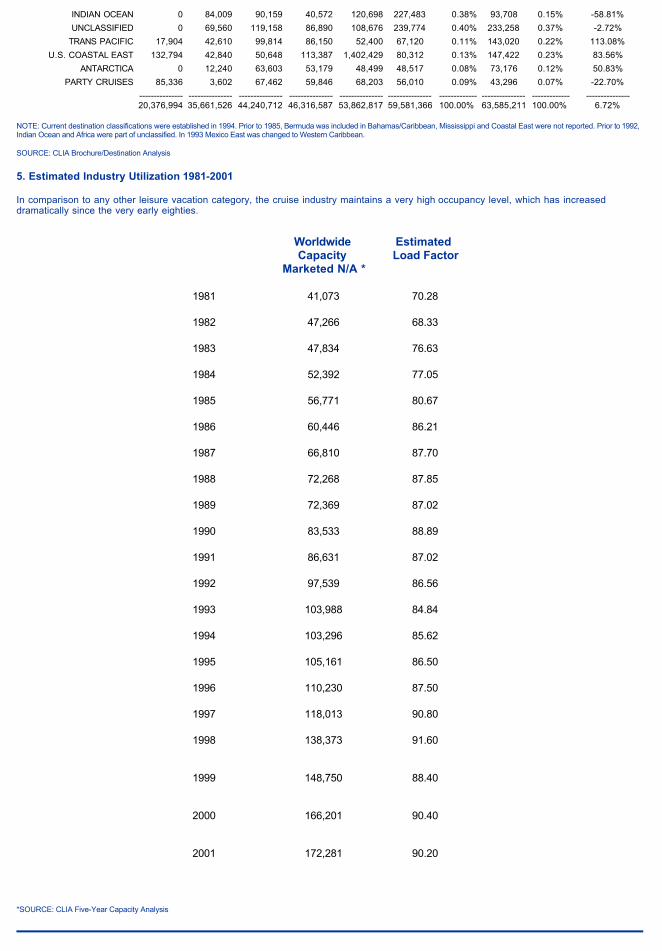
4. Geographical Destination/Application
The Caribbean continues to be the number one destination for capacity placement with a 46.6% share in 2002 (comprised of the Caribbean and the Bahamas). Other leading markets: Europe 21.1% (Europe 10.9% and Mediterranean 10.2%), Alaska 7.9%, Mexico West Coast 5.3%, Trans-Canal 3.3%, Hawaii 2.9% and South America 2.2% . On an overall basis, 2002 beds are up 6.7% versus 2001.
DESTINATION---------------------
1987-------
TOTAL----------
BED-DAYS---------------
1995-------
TOTAL----------
BED-DAYS---------------
1998-------
TOTAL----------
BED-DAYS---------------
1999-------
TOTAL----------
BED-DAYS---------------
2000-------
TOTAL----------
BED-DAYS---------------
2001-------
TOTAL----------
BED-DAYS---------------
2001PCT
------------
2002-------
TOTAL----------
BED-DAYS---------------
2002PCT
------------
2002-VS-2001PCT
CHANGE------------
CARIBBEAN 8,828,791 15,254,551 17,117,659 16,666,328 21,510,142 21,833,347 36.64% 26,741,052 42.06% 22.48%
MEDITERRANEAN 841,051 3,477,729 5,092,530 5,898,948 6,277,064 7,546,816 12.67% 6,497,444 10.22% -13.90%
ALASKA 1,715,197 3,008,146 3,790,816 4,086,620 4,197,332 4,698,538 7.89% 5,052,907 7.95% 7.54%
BAHAMAS 1,922,386 2,761,224 2,891,352 3,060,866 3,200,346 4,698,724 7.89% 2,876,295 4.52% -38.79%
TRANS CANAL 970,191 2,277,201 2,612,788 3,036,208 2,573,444 2,396,424 4.02% 2,092,723 3.29% -12.67%
MEXICO WEST 1,131,462 1,754,312 2,421,126 2,529,106 2,680,934 1,166,756 1.96% 3,386,475 5.33% 190.25%
EUROPE 357,516 1,582,589 3,714,437 3,475,922 3,744,693 4,837,375 8.12% 6,922,608 10.89% 43.11%
BERMUDA 1,141,121 1,094,707 1,094,982 1,482,573 988,391 1,269,952 2.13% 1,226,806 1.93% -3.40%
TRANSATLANTIC 339,388 658,928 725,040 961,213 1,015,625 1,129,669 1.90% 1,005,665 1.58% -10.98%
HAWAII 602,728 601,542 745,216 885,268 857,390 1,557,438 2.61% 1,903,302 2.99% 22.21%
SOUTH PACIFIC 352,983 574,218 369,507 947,382 1,155,217 1,158,004 1.94% 835,454 1.31% -27.86%
SOUTH EAST ASIA 272,592 430,123 157,705 150,107 244,620 429,550 0.72% 346,196 0.54% -19.40%
AFRICA 0 347,432 291,850 184,373 502,773 401,011 0.67% 259,962 0.41% -35.17%
CANADA/NEW ENGLAND 283,714 334,735 527,530 681,689 1,107,689 1,138,975 1.91% 1,150,950 1.81% 1.05%
FAR EAST (ORIENT) 465,608 327,009 218,988 188,038 201,582 215,022 0.36% 360,022 0.57% 67.43%
MISSISSIPPI 231,392 286,228 353,510 353,088 347,140 403,956 0.68% 0 0.00% -100.00%
WORLD 0 272,425 545,242 565,824 414,342 613,046 1.03% 582,314 0.92% -5.01%
SOUTH AMERICA 620,396 255,83 943,392 657,992 825,670 1,422,755 2.39% 1,394,808 2.19% -1.96%
U.S. COASTAL WEST 64,444 108,092 136,198 65,108 217,518 1,944,752 3.26% 216,338 0.34% -88.88%
3/25/03 2:26 PMCLIA - Cruise Line International Association
Page 31 of 36http://cruising.org/press/overview/ind_overview.cfm
INDIAN OCEAN 0 84,009 90,159 40,572 120,698 227,483 0.38% 93,708 0.15% -58.81%
UNCLASSIFIED 0 69,560 119,158 86,890 108,676 239,774 0.40% 233,258 0.37% -2.72%
TRANS PACIFIC 17,904 42,610 99,814 86,150 52,400 67,120 0.11% 143,020 0.22% 113.08%
U.S. COASTAL EAST 132,794 42,840 50,648 113,387 1,402,429 80,312 0.13% 147,422 0.23% 83.56%
ANTARCTICA 0 12,240 63,603 53,179 48,499 48,517 0.08% 73,176 0.12% 50.83%
PARTY CRUISES 85,336 3,602 67,462 59,846 68,203 56,010 0.09% 43,296 0.07% -22.70%
---------------20,376,994
---------------35,661,526
---------------44,240,712
---------------46,316,587
---------------53,862,817
---------------59,581,366
-------------100.00%
---------------63,585,211
-------------100.00%
---------------6.72%
NOTE: Current destination classifications were established in 1994. Prior to 1985, Bermuda was included in Bahamas/Caribbean, Mississippi and Coastal East were not reported. Prior to 1992, Indian Ocean and Africa were part of unclassified. In 1993 Mexico East was changed to Western Caribbean.
SOURCE: CLIA Brochure/Destination Analysis
5. Estimated Industry Utilization 1981-2001
In comparison to any other leisure vacation category, the cruise industry maintains a very high occupancy level, which has increased dramatically since the very early eighties.
Worldwide Capacity
Marketed N/A *
Estimated Load Factor
1981 41,073 70.28
1982 47,266 68.33
1983 47,834 76.63
1984 52,392 77.05
1985 56,771 80.67
1986 60,446 86.21
1987 66,810 87.70
1988 72,268 87.85
1989 72,369 87.02
1990 83,533 88.89
1991 86,631 87.02
1992 97,539 86.56
1993 103,988 84.84
1994 103,296 85.62
1995 105,161 86.50
1996 110,230 87.50
1997 118,013 90.80
1998 138,373 91.60
1999 148,750 88.40
2000 166,201 90.40
2001 172,281 90.20
*SOURCE: CLIA Five-Year Capacity Analysis
3/25/03 2:26 PMCLIA - Cruise Line International Association
Page 32 of 36http://cruising.org/press/overview/ind_overview.cfm

G. CLIA - As an Association
1. CLIA Cruise Industry Representation
CLIA is an association that represents 23 cruise lines that market the most majority of customer originating in from the United States and Canada.
MEMBER LINES
American Cruise Lines
Bora Bora Cruises*
Carnival Cruise Lines
Celebrity Cruises
Costa Cruises
Crystal Cruises
Cunard Line
Disney Cruise Line
First European Cruises
Fred. Olsen Cruise Lines*
Holland America Line
Mediterranean Shipping Cruises
Norwegian Coastal Voyages (Bergen)
Norwegian Cruise Lines
Orient Cruises
Princess Cruises
Radisson Seven Seas Cruise Line
Regal Cruises
Royal Caribbean International
Royal Olympic
Seabourn Cruise Line
Silversea Cruises
Windstar Cruises
3/25/03 2:26 PMCLIA - Cruise Line International Association
Page 33 of 36http://cruising.org/press/overview/ind_overview.cfm

New Members Starting 2002*
2. North American Association of Travel Agent Affiliates
In 2001 CLIA had approximately 18,700 Travel Agency affiliates. The recent reduction in affiliate membership is a reflection of the general consolidation and attrition in the travel agency business. The trend has particularly affected corporate travel and has been accelerated as a result of the airlines reducing / eliminating travel agency base commissions. This is resulting in more travel agencies shifting their focus to cruise and leisure sales and CLIA's membership now reflects an approximate 50/50 percentage of ARC/IATA agencies versus non-ARC/IATA agencies.
Members
% Growthvs.
Prior Year
1972 7,900 5.3
1980 10,900 4.8
1981 11,000 0.9
1982 11,000 0.0
1983 10,700 ( 2.7 )
1984 12,500 16.8
1985 14,887 19.1
1986 15,507 4.2
1987 17,377 12.0
1988 18,620 7.2
1989 19,458 4.5
1990 20,128 3.4
1991 19,952 ( 0.9 )
1992 20,712 3.8
1993 21,463 3.6
1994 22,300 3.9
1995 22,722 1.9
1996 21,519 ( 5.3 )
1997 21,450 ( .6 )
1998 20,665 ( 3.6 )
1999 20,905 1.2
2000 19,895 ( 4.8 )
2001 18,707 ( 5.9 )
SOURCE: CLIA data -- year-end actuals.
3/25/03 2:26 PMCLIA - Cruise Line International Association
Page 34 of 36http://cruising.org/press/overview/ind_overview.cfm

H. Other Key Sources of Information on the Cruise Industry
1. Books and Pamphlets
published by Reed Travel Group, Church Street, Dunstable, Bedfordshire, LU5 4HB, United Kingdom. Four times a year at $237 annually. Phone: (441582) 600111, Fax: (0582) 695230. Extensive listings of ferry services worldwide. To order contact (800) 323-3537.
OAG Cruise & Ferry Guide
published by Cruise Lines International Association, 500 Fifth Avenue, Suite 1407, New York, NY 10110; (212) 921-0066; 700 pages, $50 for CLIA affiliates and $75 for non-CLIA affiliates. The manual is published mainly for the travel agency community as a reference source on CLIA's Member Cruise Lines. This annually updated, clearly organized, comprehensive volume reflects suggestions made by travel agents. In-depth information on cruise ship and their companies includes new, improved data on: dining aboard CLIA vessels, suggestions for on-board tipping and gratuities, summary of credit card policies of individual Member Lines, and lots more. Obtained by sending check or money order directly to Cruise Lines International Association (add $4.00 for postage and handling) or call to order with Visa, MasterCard or American Express.
CLIA Cruise Manual
is CLIA"s cruise industry textbook designed for travel industry professionals and students of travel. This 10-chapter textbook approaches the topic of cruise vacations from the prospective of a working travel professional. Travel agents enrolled in the CLIA Cruise Counsellor Certification training program can earn 30 training credits by completing the textbook's corresponding exam. Cruising: A Guide to The Cruise Line Industry retails for $48.95 - CLIA affiliates pay only $44.06 To order, call 1-800-347-7707. CLIA affiliated travel agencies should mention the promotion code 9DPEM 306A.
CLIA's Cruising: Guide to the Cruise Line Industry
- 11997 edition published yearly by Cruise Industry News, 441 Lexington Avenue, Suite 1209, New York, NY 10017; (212) 986-1025; 400 pages, $450. This annual provides an objective overview and forecasts of the worldwide cruise industry, including supply and demand scenarios, and analysis of each market segment and sailing region. The book also provides expert discussions of relevant subjects and issues as well as analysis of the earnings reports of the leading cruise lines. In addition, the Cruise Industry News Annual profiles all cruise lines around the world and their ships, plus cruise ports, and shipyards. It also features directory listings of the entire cruise lines, ports, shipyards, and supply and service companies. Published since 1988, the Cruise Industry News Annual is mainly subscribed to by industry executives, financial analysts, port and tourism officials, and others on a decision-making level.
Cruise Industry News Annual
by Candyce H. Stapen. Prima Publishing, 400 Hahn Road, Westminster, MD 21157, (800) 726-0600. Includes tips on choosing the right family cruise, advantages of cruising, getting the most for your money and more. 400 pages. Available in bookstores.
Cruise Vacations With Kids
by Juls Zvoncheck. Published by National Publishers, P.O. Box 288, Rapid City, SD 57709. Both a training manual and guide to major cruise lines. Useful appendices.Cruises-Selecting, Selling and Booking
published by Cruise Lines International Association, 500 Fifth Avenue, Suite 1407 New York, NY 10110; (212) 921-0066; pocket size, 25 pages, free. Pamphlet answering most frequently asked questions about cruise vacations, with charts showing worldwide cruise destinations, ship line services for children, active adults, honeymooners, shipboard shopping, singles and shipboard cuisine. Obtained by sending a stamped, self-addressed envelope (55 cents postage) to CLIA.
Cruising: Q & A
By Anne Vipond. Published by Ocean Cruise Guides Ltd., 4844 Cedar Cres. Delta, B.C. V4M 1J8 Phone (604) 948-0594, Fax (604) 948-2779. E-Mail . A comprehensive introduction to cruising for first-timers. How to pick the cruise and ship that's right for you.
The Complete Cruise [email protected]
By Anne Vipond. Published by Ocean Cruise Guides Ltd., 4844 Cedar Cres. Delta, B.C. V4M 1J8 Phone (604) 948-0594, Fax (604) 948-2779. E-Mail .The complete guide to the Caribbean cruise experience. Over 80 maps and 300 photos.
Caribbean by Cruise [email protected]
(Kay Showker) 1-800-243-0495. The Globe Pequot Press P.O. Box 480 Guilford, CT 06437. Profiles, tours, sports, shopping, history and more on the islands from Puerto Rico to the Panama Canal.Caribbean Ports of Call--Southeastern Region:
(Kay Showker) 1-800-243-0495. The Globe Pequot Press P.O. Box 480 Guilford, CT 06437. Profiles, tours, sports, shopping, history and more on the islands from the Bahamas to the Virgin Islands.Caribbean Ports of Call--Northeastern Region:
(Kay Showker) 1-800-243-0495. The Globe Pequot Press P.O. Box 480 Guilford, CT 06437. Profiles, tours, sports, shopping, history and more on the islands from the Bahamas to Columbia.Caribbean Ports of Call--Western Caribbean:
Cruise media Oy, Ltd. 701 Brickell Key Blvd, Suite 1003 Miami, FL 33131. International magazine focusing on the cruise business.Cruise Business Review:
(973) 605-2442. Cruise Reports 25 Washington Street, Morristown, NJ 07960. , . Monthly newsletter features reviews of ships with ratings based on independent surveys of passengers. New and comments about cruises and cruising.
Cruise Reports: [email protected] www.cruisereports.com
(Gloria Israel and Laurence Miller) Seatrade Cruise Academy, Seatrade House, 42 North Station Road, Colchester C01 1RD United Kingdom. Comprehensive dictionary of nautical and business terminology of the cruise industry.Dictionary of the Cruise Industry:
Seatrade Organization, Seatrade House, 42 North Station Rd., Colchester C01 1RB United Kingdom. Quarterly magazine reporting on the business of cruising worldwide.Seatrade Cruise Review:
Cahners Travel Group, 500 Plaza Drive, Secaucus, NJ 07094. Directory of ships, cruise lines and ports of call.The Total Traveler by Ship:
By Anne Vipond. Published by Ocean Cruise Guides Ltd., 4844 Cedar Cres. Delta, B.C. V4M 1J8 Phone (604) 948-0594, Fax (604) 948-2779. E-Mail . The complete guide to the Alaska cruise experience. Includes over 70 maps and over 300 photos.
Alaska By Cruise [email protected]
By Anne Vipond. Published by Ocean Cruise Guides Ltd., 4844 Cedar Cres. Delta, B.C. V4M 1J8 Phone (604) 948-0594, Fax (604) 948-2779. E-Mail . The complete guide to all Mediterranean cruises. Over 100 maps and over 400 photos.
Mediterranean By Cruise [email protected]
3/25/03 2:26 PMCLIA - Cruise Line International Association
Page 35 of 36http://cruising.org/press/overview/ind_overview.cfm

Site designed by / Rampage Interactive Web Services by The Destination Group Digital
;Author, Jim West. This compact collection of cruise wisdom has everything you need to know for a perfect vacation at sea. Jim West has logged many nautical miles as a cruise director and doles out the answers to cruise questions with wit and style. How can you get the best cabin in your price range? The best table in the dining room? The best service from the crew? It's like having your own personal cruise consultant. The Essential Little Cruise Book will help you make the most of your time at sea. Available at local bookstores or by calling, toll free, Cruise Concepts at (888) 867-8600. 117 West St. Paul Street, Springville, IL 61362.
The Essential Little Cruise Book
2. Periodicals/Consumer
, , published by World Ocean & Cruise Liner Society, P.O. Box 92, Stamford, CT 06904; (203) 329-2787. Annual subscription $30.Agent's Cruise Monthly
, published twice a month by Cruise Industry News, 441 Lexington Avenue, Suite 1209, New York, NY 10017; (212) 986-1025. Six pages; $495 a year. Published since 1985, this newsletter provides the inside business news of the industry and is subscribed to by industry executives, financial analysts, port and tourism officials, government agencies, and major travel agency groups.
Cruise Industry News, the Newsletter
, published four times a year by Cruise Industry News, 441 Lexington Avenue, Suite 1209, New York, NY 10017; (212) 986-1025; $30 per year. The magazine's editorial focus covers all aspects of cruise operations; shipbuilding, new ships, cruise companies, ship reviews, on-board services, food and beverage, and ports and destinations. Published since 1991, it's worldwide readership includes cruise line executives, shipboard officers and crew, shipyards, ports, service and supply companies, and travel agents.
Cruise Industry News Quarterly Magazine
, 990 Grover Street, Evanston, IL 60201. Subscription price $23.94, first time $11.97. Color magazine with feature articles about ships and cruising; six issues per year. (847) 491-6440.Cruise Travel
Prepared and published by G.P. Wild (International) Limited, 15 Gander Hill, Haywards Heath, West Sussex, RH16 1QU; +44 (0) 1444 413931. An authoritative quarterly publication covering the economic, marketing and operational aspects of the cruise industry worldwide. Sectorial capacity growth, corporate activities, supply and demand are examined critically with a view to providing an independent, analytical and objective appraisal of the industry together with a guide to its future development. Price $415.00 per four issues 250 pound sterling.
International Cruise Market Monitor
Prepared by Management and Marketing Consultants G.P. Wild (International) Limited and published by Lloyd's of London Press. An authoritative study, published annually, covering the economic, marketing and operational aspects of the cruise industry world-wide. Sectorial capacity growth, corporate activities, supply and demand are examined critically with a view to providing an independent, analytical and objective appraisal of the industry together with a guide to its financial data and fleet details for future development. Subscriptions Dept., Lloyd's of London Press, Sheepen Place, Colchester, Essex, England CO3 3LP. Price $431.00 pounds; 011 44 1206 772277.
Lloyd's Annual Cruise Review
published by Simmons-Boardman Publications Corporation, 1809 Capitol Avenue, Omaha, NE 68102, (800) 895-4389, Fax (402) 346-3670; $119.95 + $9.50 shipping and handling. Extensive listings of maritime vendors, services, associations, and port authorities.
Maritime Services Directory
, published by World Ocean & Cruise Liner Society, P.O. Box 92, Stamford, CT 06904; (203) 329-2787. Single issue price $2.50 or $30 per year. Newsletter published 12 times per year. Profiles of "ship of the month" and other features.Ocean and Cruise News
, Executive Tower One, 9111 Cross Park Drive, Suite D247, Knoxville, TN 37923; (800) 783-4903 or (856) 531-0392. Quarterly Publication, 4 issues at $90.00. Catalog of cruise ship departures listed by major cruising areas and date. Includes prices and itineraries.
Official Steamship Guide International
, published by Bill Panoff,. PPI Group, 4517 NW 31 Avenue, Fort Lauderdale, FL 33309. Phone (954) 377-7777. 1 year subscription (6 issues) at $19.95. 2-year subscription (12 issues) at $29.95. Devoted to the cruise industry and is the number one source of cruise information for the travel savvy cruise consumer. This publication provides in depth cruise ship feature reports, product evaluations and general cruise industry news.
Porthole Cruise Magazine
3. Other Sources
, published by Bill Panoff. PPI Group, 4517 NW 31 Avenue, Fort Lauderdale, FL 33309. Phone (954) 377-7777. A publication exploring industry issues, includes state of the industry reports on marketing, financial information, and integrates information on all aspects of the cruise industry from an operations standpoint. Directed towards cruise line executives and other industry decision-makers.
Porthole Insider
published by Ticket To Adventure, P.O. Box 41005, St. Petersburg, FL 33743-1005, (800) 929-7447 or [email protected]. U.S. $29.95 includes S & H.Buyer's Guide to Cruise Bargains Discount & Deals.
, 5 Edition published by Ticket To Adventure, P.O. Box 41005, St. Petersburg, FL 33743-1005, (800) 929-7447 or [email protected]. Everything you need to know about getting a job on board a cruise ship. Job descriptions, career training, and insider tips to help the job searcher with important information. U.S. $29.95 includes S & H.
How To Get A Job With A Cruise Line th
, 7662 East Gray Road, Suite 101, Scottsdale, AZ 85260, (480) 483-1551. Source for purchase of travel videos with list that includes 300 videos from 35 major cruise lines as well as other travel suppliers. Contact Vacations on Video for further pricing information.
Vacations on Video
, One Singer Street, London EC2A 4LQ, England, +44 (0) 171 250 1500. Covers important aspects of the cruise industry including marketing, passenger services and related equipment, port developments, business developments, regulatory issues and market trends.
Lloyd's Cruise International
3/25/03 2:26 PMCLIA - Cruise Line International Association
Page 36 of 36http://cruising.org/press/overview/ind_overview.cfm