CROWLEY KOTZEBUE DOCK REPLACEMENT PROJECT
55
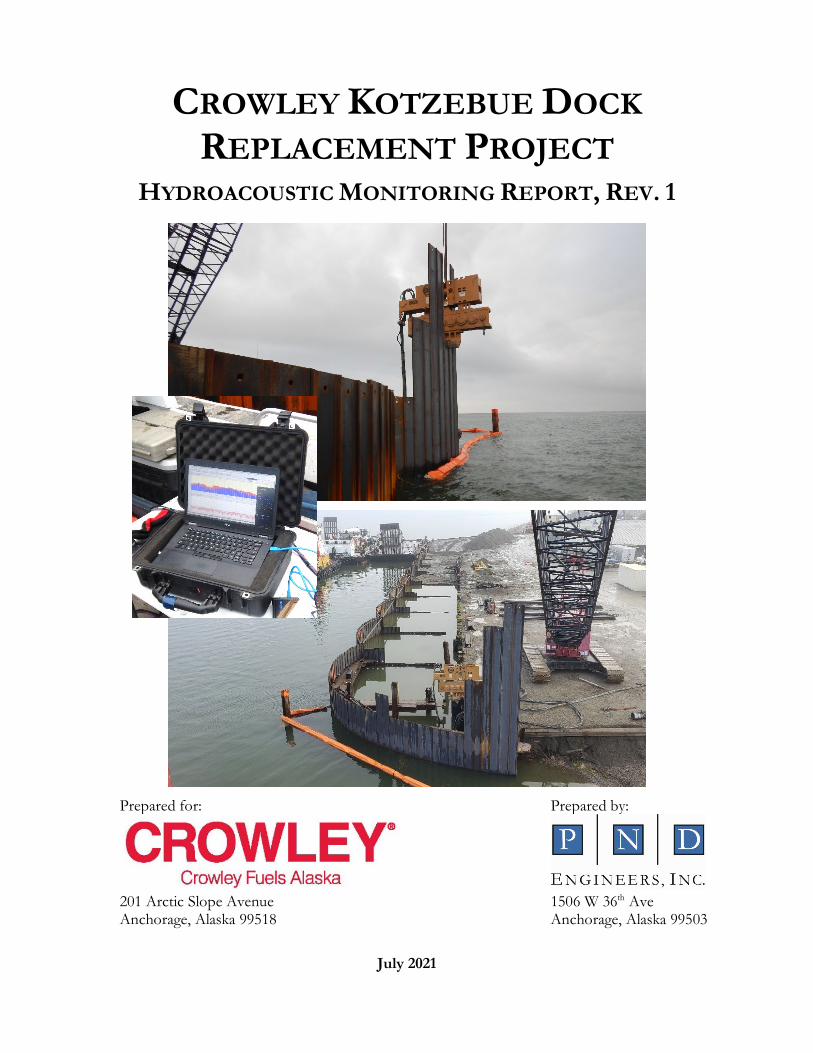
CROWLEY KOTZEBUE DOCK REPLACEMENT PROJECT HYDROACOUSTIC MONITORING REPORT, REV. 1 Prepared for: Prepared by: 201 Arctic Slope Avenue 1506 W 36 th Ave Anchorage, Alaska 99518 Anchorage, Alaska 99503 July 2021
Transcript of CROWLEY KOTZEBUE DOCK REPLACEMENT PROJECT
CROWLEY KOTZEBUE DOCK REPLACEMENT PROJECT
HYDROACOUSTIC MONITORING REPORT, REV. 1
Prepared for: Prepared by:
201 Arctic Slope Avenue 1506 W 36th Ave Anchorage, Alaska 99518 Anchorage, Alaska 99503
July 2021
Crowley Kotzebue Dock Replacement - Hydroacoustic Monitoring Report July 2021
i
EXECUTIVE SUMMARY This report summarizes the hydroacoustic monitoring work accomplished for the driving of 40’ long OPEN CELL SHEET PILE™ (OCSP™) interlocking sheet steel piles for the Crowley Kotzebue Dock Replacement Project in Kotzebue, Alaska. The report includes analysis of background sound levels and noise levels associated with vibratory installation of 35 piles driven between September 12 and September 15, 2020. Data collected during this period is used to assess the range of impacts to marine mammals during project activities.
The sound source verification (SSV) consisted of the measurement of underwater sounds at distances 10 meters (m) to one kilometer (km) from the pile driving site. Hydroacoustic monitoring of construc-tion sound was conducted from boat using an omni-directional hydrophone at 10, 100, 500 and 1,000 m from the driven piles. The signals from the hydrophone were fed into SpectraDAQ-200 Precision Dynamic Signal Acquisition Interface manufactured by SpectraPLUS interfaced directly into a field laptop computer. The hydrophone was placed with a clear acoustic line-of-sight between the pile and the hydrophone.
All underwater sound levels reported in this document are in decibels (dB) referenced to 1 micropascal (re: 1 μPa).
The background sound pressure levels (SPLs) varied from 112 decibels (dB) root-mean-square (RMS) (10 minutes) recorded near the construction site at 4-m depth to 131.9 dB RMS (10 minutes) recorded 1,000 m from the pile driving near the edge of the navigation channel. The average of all background sound levels recorded during this survey was 122.8 dB RMS (10 minutes).
Sound generated by the vibratory pile driving was dominated by the 1,000 – 2,000 Hz frequency range near the source. The vibratory hammer noise at 1,000 m from the construction site was difficult to detect above the noise produced by current and hydrophone motion in the water (self-noise).
The normalized average SPL adjacent to the construction site (10 m) was 158.2 dB RMS, as was the median SPL. The average normalized SPL at 100 m from the pile-driving activities was 144.4 dB RMS. The average normalized SPLs at 500 m and 1,000 m from the source were 128.7 and 125.7 dB RMS.
Crowley Kotzebue Dock Replacement - Hydroacoustic Monitoring Report July 2021
ii
TABLE OF CONTENTS Page
1 Introduction ............................................................................................................................................... 1 2 Underwater Sound Concepts and Terminology ................................................................................... 3 3 Instrumentation and Data Collection Approach ................................................................................. 4
3.1 Passive Acoustic Buoy Deployment ............................................................................................... 5 4 Results......................................................................................................................................................... 6
4.1 Background Sound Levels ............................................................................................................... 6 4.2 Vibratory Sound Levels .................................................................................................................... 7
5 Transmission Loss Calculations............................................................................................................ 12 6 Marine Mammal Impacts ....................................................................................................................... 13
LIST OF FIGURES Page
Figure 1.1. Project Overview ............................................................................................................................ 2 Figure 1.2. APE-200-6 Vibratory Hammer in Action. ................................................................................. 3 Figure 3.1. Hydroacoustic Measurement Locations (yellow crosses) ......................................................... 5 Figure 3.2. Remote Underwater Digital Acoustic Recorder (µRUDAR-mk2™) ..................................... 6 Figure 4.1. Vibratory SPL Statistics (including maximum SPL (blue), average SPL (orange) and average
ambient SPL (gray)) ........................................................................................................................ 9
LIST OF TABLES Page
Table 3-1. Remote Underwater Digital Acoustic Recorder Buoy Deployment Coordinates ................. 5 Table 4-1. Background Sound Level Data Statistics ..................................................................................... 7 Table 4-2. Measured Vibratory Pile Driving Logs & Sound Level Statistics .......................................... 10 Table 4-3. Vibratory Pile Driving Sound Level Statistics Normalized to Planned ................................ 11 Table 5-1. Transmission (TL) and Geometric Spreading Constant Calculated Statistics Normalized to
Planned Distances ......................................................................................................................... 12 Table 6-1. Parameters for underwater noise calculations from IHA ....................................................... 13 Table 6-2. Level A Harassment Isopleths .................................................................................................... 14 Table 6-3. Marine Mammal Sightings and Behavior During Sound Monitoring ................................... 15
LIST OF EQUATIONS Page
Equation 2-1. Calculation of Relative Sound Pressure Level ...................................................................... 3 Equation 4-1. Practical Spreading Model ....................................................................................................... 8 Equation 5-1. Received Sound Model .......................................................................................................... 12
APPENDICES
Appendix A. Background Sound Level Time Series and 1/3rd-Octave Band Frequencies Distribution Appendix B. Vibratory Pile Driving Sound Level Time Series and 1/3rd-Octave Band Frequencies Distribution
Crowley Kotzebue Dock Replacement - Hydroacoustic Monitoring Report July 2021
iii
LIST OF ACRONYMS AND ABBREVIATIONS ADF&G Alaska Department of Fish and Game Crowley Crowley Fuels LLC. CY cubic yards DC direct current dB decibel(s) dB Peak instantaneous peak pressure ft foot(feet) GL geometric spreading constant IHA Incidental Harassment Authorization HTL High Tide Line Hz Hertz km kilometer(s) m meter(s) MLLW mean lower low water MPH mile per hour min minutes OCSP™ OPEN CELL SHEET PILE™ OD outside diameter PND PND Engineers, Inc. PSO protected species observer RL received level RMS root mean square re: reference SL source level SLM sound level meter SPL sound pressure level TL transmission loss USACE U.S. Army Corp of Engineers V volts μPa micropascal(s)
Crowley Kotzebue Dock Replacement - Hydroacoustic Monitoring Report July 2021
1
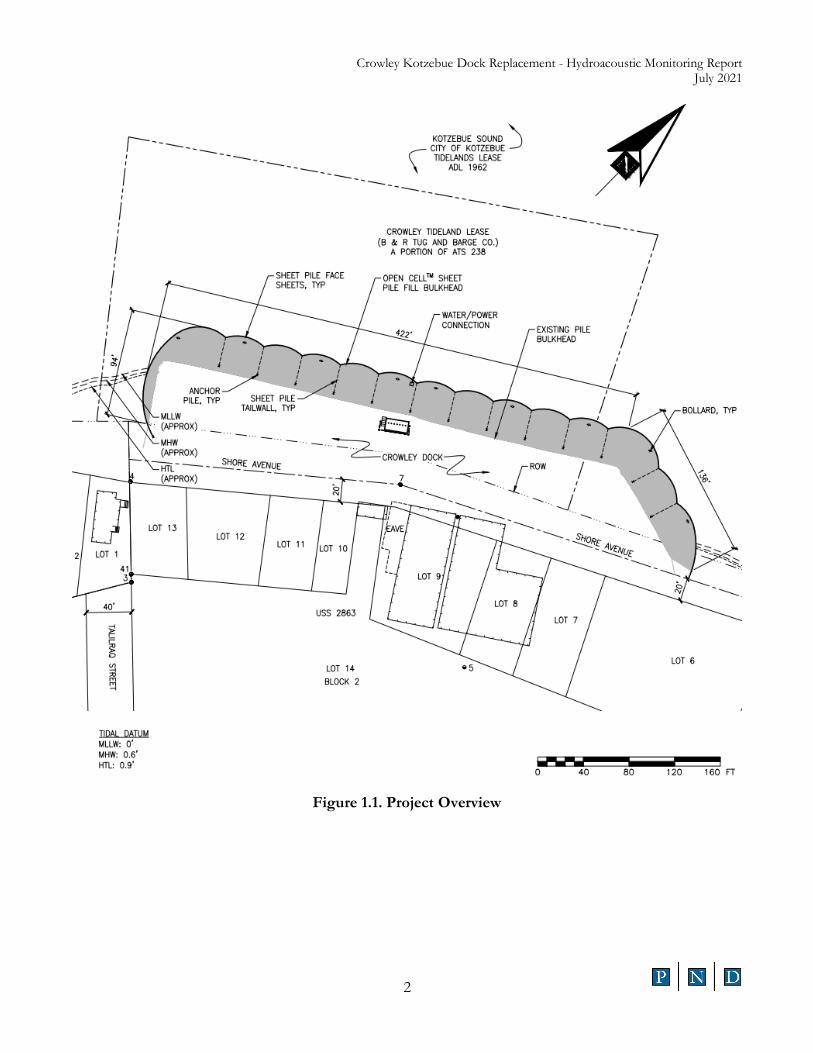
1 INTRODUCTION PND Engineers, Inc., (PND) prepared this report for Crowley Fuels LLC (Crowley), for the Kotzebue Dock Replacement Project (Project) in Kotzebue, Alaska. On September 15, 2020, PND completed hydroacoustic measurements during vibratory pile-driving activities of 35 interlocking steel sheet piles. The report includes analysis of real-time hydroacoustic measurements during vibratory pile-driving activities and background un-derwater noise measurement.
The existing dock is nearing the end of its serviceable life. Over the past several years the dock has experienced multiple areas of structural damage that have required repair. A significant portion of the south end of the dock was reconstructed in 2005. In 2017, an approximately 40-ft section of wall located near the marine fuel header failed; likely caused by scour and the absence of a supporting waler and tie back system for this portion of wall. The new OPEN CELL SHEET PILE™ (OCSP™) bulkhead includes encapsulation of the existing dock with a new wall offset from the face of the existing structure. The project components included nine (9) 24” diameter bollard piles, one hundred seventy (170) 18” diameter steel temporary support piles, fifteen (15) 14” HP steel anchor piles, and a nominally 560’ long OCSP™ dock consisting of 650 interlocking sheet piles (see Figure 1). The piles were driven using vibratory pile-driving techniques.
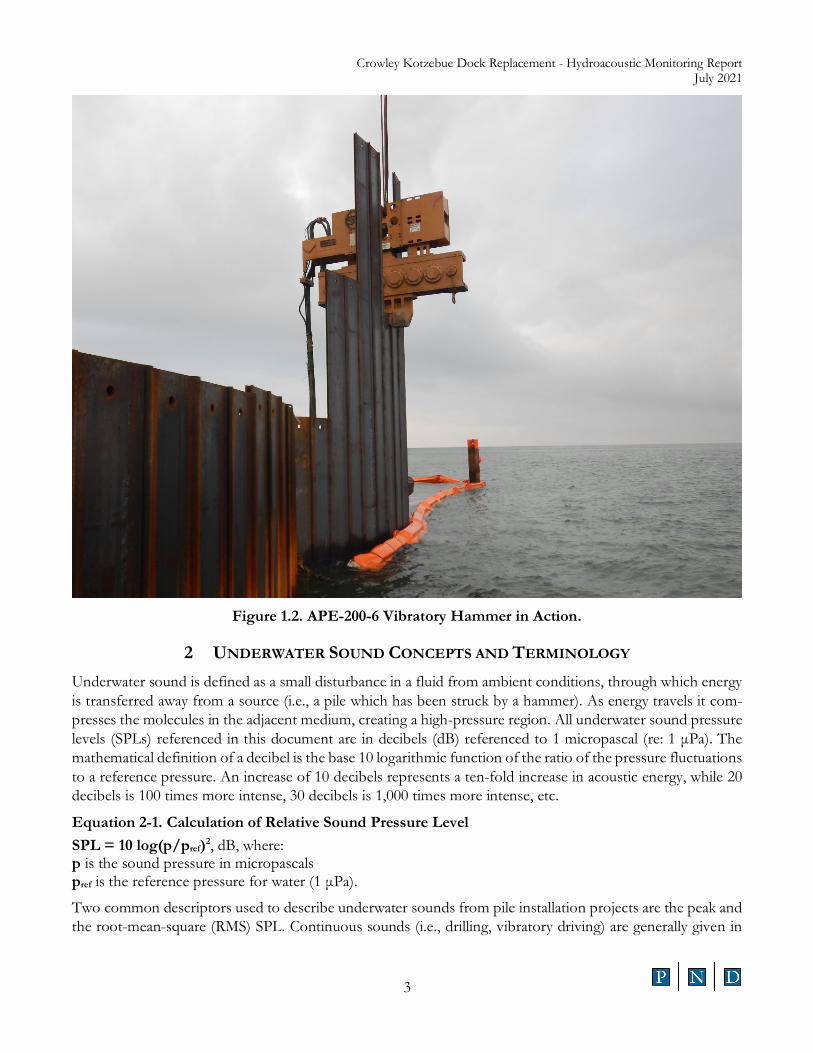
All piles monitored were interlocking steel PS31 or PS27.5 sheet piles with 5/8th-inch-thick webs that were 40 feet in length. Piles were driven approximately 35 feet offshore from the existing dock in water depths of approximately 15 ft. All piles were driven to an elevation of -31 feet mean lower low water (MLLW) with an American Piledriving Equipment (APE) hydraulic vibratory hammer model 200-6, capable of 225 tons of driving force. Substrates in Kotzebue Sound are typically soft, comprised of sandy mud or gravelly mud. Figure 1.2 shows the APE-200-6 vibratory hammer driving interlocking sheet piles for the bulkhead.
The Project provided an opportunity to perform real-time measurements of acoustic energy produced related to steel sheet pile vibratory driving techniques. Species of concern occurring in the project area include hump-back whales, bowhead whales, fin whales, bearded seals, ringed seals, pacific walruses, minke whales, gray whales, killer whales, beluga whales, narwhals, spotted seals and ribbon seals. Project permit requirements required monitoring by protected species observers (PSOs) and shutdown at various radii depending on the anticipated impacts on species observed during each type of construction activity. Measurement of the actual range of acoustic energy will be useful to future projects and mitigation design and for estimating take of marine mammals out of observable range during this project.
This sound source verification (SSV) consisted of the measurement of underwater sounds at distances of 10 m to one km from the pile-driving construction.
In addition to the construction monitoring, Crowley deployed a remote autonomous underwater digital acous-tic recorder to detect the presence of marine mammals within range. This information will be used to supple-ment the direct observations of the PSOs. Data from the autonomous recorder system was provided to the National Marine Fisheries Service (NMFS) for further processing.
Crowley Kotzebue Dock Replacement - Hydroacoustic Monitoring Report July 2021
2
Figure 1.1. Project Overview
Crowley Kotzebue Dock Replacement - Hydroacoustic Monitoring Report July 2021
3
Figure 1.2. APE-200-6 Vibratory Hammer in Action.
2 UNDERWATER SOUND CONCEPTS AND TERMINOLOGY Underwater sound is defined as a small disturbance in a fluid from ambient conditions, through which energy is transferred away from a source (i.e., a pile which has been struck by a hammer). As energy travels it com-presses the molecules in the adjacent medium, creating a high-pressure region. All underwater sound pressure levels (SPLs) referenced in this document are in decibels (dB) referenced to 1 micropascal (re: 1 μPa). The mathematical definition of a decibel is the base 10 logarithmic function of the ratio of the pressure fluctuations to a reference pressure. An increase of 10 decibels represents a ten-fold increase in acoustic energy, while 20 decibels is 100 times more intense, 30 decibels is 1,000 times more intense, etc.
Equation 2-1. Calculation of Relative Sound Pressure Level SPL = 10 log(p/pref)2, dB, where: p is the sound pressure in micropascals pref is the reference pressure for water (1 μPa).
Two common descriptors used to describe underwater sounds from pile installation projects are the peak and the root-mean-square (RMS) SPL. Continuous sounds (i.e., drilling, vibratory driving) are generally given in

Crowley Kotzebue Dock Replacement - Hydroacoustic Monitoring Report July 2021
4
terms of the RMS SPL. The RMS amplitude is a type of average that is determined by squaring all the ampli-tudes over the period of interest, determining the mean of the squared values, and then taking the square root of the mean of the squared values. The RMS SPL is presented in dB (re: 1 μPa). Sound Exposure Level (SEL) is an acoustic metric that provides an indication of the amount of acoustical energy contained in a sound event. Typically, SEL is measured for a single strike and a defined cumulative condition; no SEL are presented for this project as only vibratory driving was performed. Number of strikes were also not recorded for con-tinuous vibratory pile driving.
All underwater SPLs for vibratory driving activities are presented in RMS values as “Fast” averaged (125 milliseconds exponential average).
3 INSTRUMENTATION AND DATA COLLECTION APPROACH All hydroacoustic data was collected from a small working boat using an omni-directional CR1 hydrophone with -199 dB (re: 1V/μPa) transducer sensitivity over a frequency range from 10 Hz to 68 kHz. The CR1 hydrophone has a maximum cable length of 30 m. The hydrophone was connected to the SpectraDAQ-200 Precision Dynamic Signal Acquisition Interface manufactured by SpectraPLUS interfaced directly into a field laptop computer running SpectraPLUS-SC FFT Spectral Analysis System software, developed by Cetacean Re-search Technology in association with Pioneer Hill Software, LLC. Concurrent incoming analog signals are digitized from the hydrophone and the real-time voltage signals are displayed on the computer as SPL and digitally stored for post-processing and analysis. The capacitance of the CR1 hydrophone is documented dur-ing factory calibration and remains fixed as long as the cable is not altered.
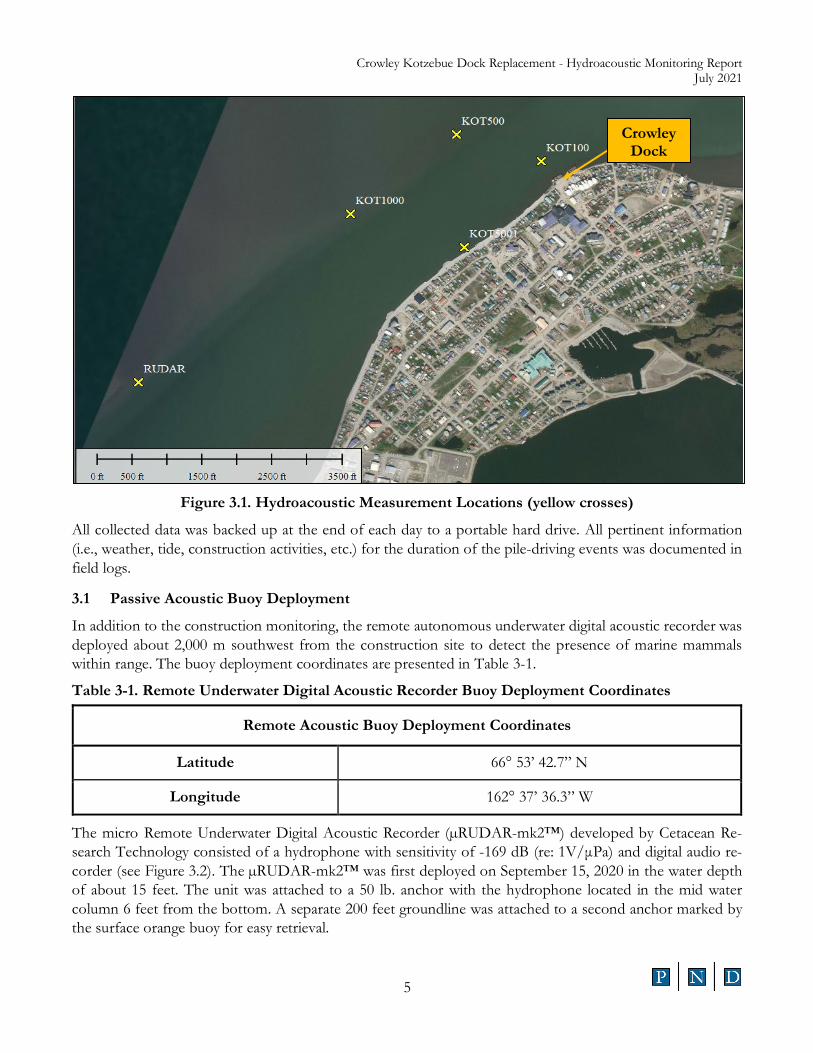
For the first measurements, the hydrophone was placed as close to 10 m as was safely possible from each pile with a clear acoustic line-of-sight between the pile and the hydrophone. Following recording at the 10-m location, additional measurements were taken offshore from the construction site at the following radii: 100 m, 500 m, and 1,000 m. The actual data collection locations are shown in Figure 3.1. The exact distance between the hydrophone and pile was recorded in the monitoring logs and was adjusted depending on safe access within the construction area during driving activities. The underwater sound levels were collected at various depths below the water surface (depending on bathymetry) at the bottom, mid-column, and at the surface.
Prior to and during pile-driving activities, environmental data was gathered, such as water depth, tidal level, wave height, and wind speed and other factors that could contribute to influencing the underwater sound levels (e.g., aircraft, boats, etc.). Additional measurements of background sound levels for baseline comparison were recorded several minutes prior to, or immediately after, each period of pile-driving activity.
Distance from the target pile and the hydrophone was measured using a laser range finder and handheld GPS unit. Ancillary data (e.g., Conductivity, Temperature, and Depth (CTD)) was collected intermittently to record changes in salinity and temperature of the water column.
Background underwater sound levels were collected at least 10 minutes prior to (or immediately after) each pile-driving event in the absence of pile-driving activities to determine background sound levels. However, ancillary construction noise was present the majority of the time that background noise was recorded, includ-ing barge and boat traffic, crane operations, welding, generators, workers walking on templates, and gravel placement.
Crowley Kotzebue Dock Replacement - Hydroacoustic Monitoring Report July 2021
5
Figure 3.1. Hydroacoustic Measurement Locations (yellow crosses)
All collected data was backed up at the end of each day to a portable hard drive. All pertinent information (i.e., weather, tide, construction activities, etc.) for the duration of the pile-driving events was documented in field logs.
3.1 Passive Acoustic Buoy Deployment
In addition to the construction monitoring, the remote autonomous underwater digital acoustic recorder was deployed about 2,000 m southwest from the construction site to detect the presence of marine mammals within range. The buoy deployment coordinates are presented in Table 3-1.
Table 3-1. Remote Underwater Digital Acoustic Recorder Buoy Deployment Coordinates
Remote Acoustic Buoy Deployment Coordinates
Latitude 66° 53’ 42.7” N
Longitude 162° 37’ 36.3” W
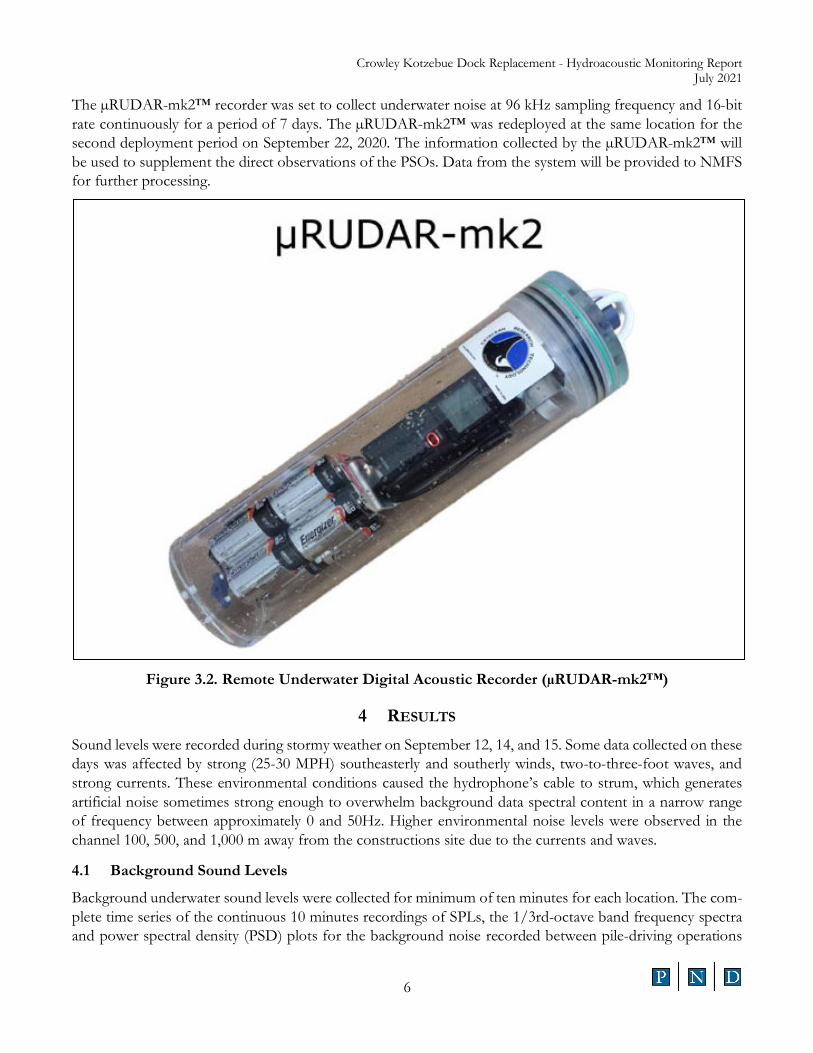
The micro Remote Underwater Digital Acoustic Recorder (µRUDAR-mk2™) developed by Cetacean Re-search Technology consisted of a hydrophone with sensitivity of -169 dB (re: 1V/μPa) and digital audio re-corder (see Figure 3.2). The µRUDAR-mk2™ was first deployed on September 15, 2020 in the water depth of about 15 feet. The unit was attached to a 50 lb. anchor with the hydrophone located in the mid water column 6 feet from the bottom. A separate 200 feet groundline was attached to a second anchor marked by the surface orange buoy for easy retrieval.
Crowley Dock
Crowley Kotzebue Dock Replacement - Hydroacoustic Monitoring Report July 2021
6
The µRUDAR-mk2™ recorder was set to collect underwater noise at 96 kHz sampling frequency and 16-bit rate continuously for a period of 7 days. The µRUDAR-mk2™ was redeployed at the same location for the second deployment period on September 22, 2020. The information collected by the µRUDAR-mk2™ will be used to supplement the direct observations of the PSOs. Data from the system will be provided to NMFS for further processing.
Figure 3.2. Remote Underwater Digital Acoustic Recorder (µRUDAR-mk2™)
4 RESULTS Sound levels were recorded during stormy weather on September 12, 14, and 15. Some data collected on these days was affected by strong (25-30 MPH) southeasterly and southerly winds, two-to-three-foot waves, and strong currents. These environmental conditions caused the hydrophone’s cable to strum, which generates artificial noise sometimes strong enough to overwhelm background data spectral content in a narrow range of frequency between approximately 0 and 50Hz. Higher environmental noise levels were observed in the channel 100, 500, and 1,000 m away from the constructions site due to the currents and waves.
4.1 Background Sound Levels
Background underwater sound levels were collected for minimum of ten minutes for each location. The com-plete time series of the continuous 10 minutes recordings of SPLs, the 1/3rd-octave band frequency spectra and power spectral density (PSD) plots for the background noise recorded between pile-driving operations
Crowley Kotzebue Dock Replacement - Hydroacoustic Monitoring Report July 2021
7
for the various recording locations are provided in Appendix A. The PSD levels are normalized the spectrum to a 1 Hz bandwidth and plotted as RMS SPL (dB re 1 μPa²/Hz). The background underwater SPLs are presented in RMS values as “Fast” averaged (125 milliseconds exponential average). Overall background sound levels were computed over the frequency range of 20Hz to 48 kHz.
Recorded background sound levels between pile-driving events were quite high due to the adverse environ-mental conditions during the data collection. Strong (25-30 MPH) southeasterly and southerly winds, two-to-three-foot waves, and strong currents in the channel caused the hydrophone cable to strum. Waves breaking on the hull of the boat generated strong noises dominated by lower frequency sounds.
Construction noise and vessel traffic was present in the majority of the collected data. Ancillary construction noise was present the majority of the time ambient noise was recorded, including barge and boat traffic, crane operations, welding, generators, workers walking on the templates, and gravel placement. A variety of periodic mechanical sounds were noticeable in the recorded data, these sounds were characterized as noise from en-gines, motors and pumps generated by vessels and tugs loading/unloading near recording locations.
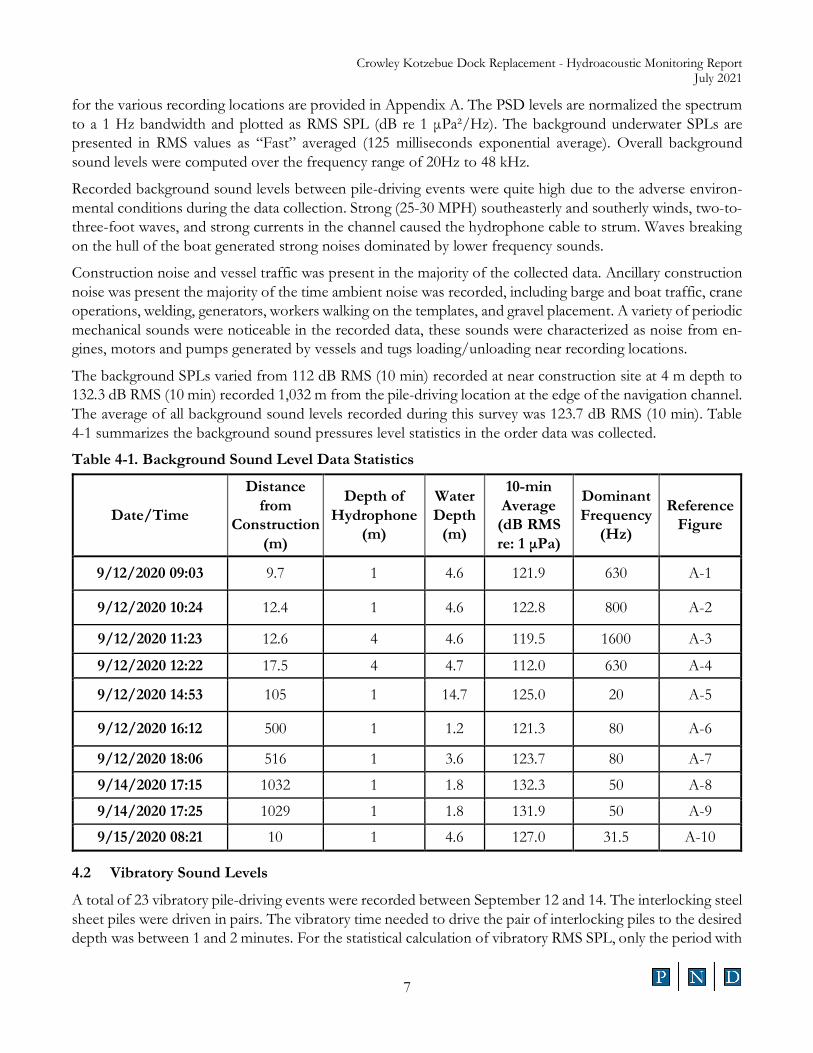
The background SPLs varied from 112 dB RMS (10 min) recorded at near construction site at 4 m depth to 132.3 dB RMS (10 min) recorded 1,032 m from the pile-driving location at the edge of the navigation channel. The average of all background sound levels recorded during this survey was 123.7 dB RMS (10 min). Table 4-1 summarizes the background sound pressures level statistics in the order data was collected.
Table 4-1. Background Sound Level Data Statistics
Date/Time
Distance from
Construction (m)
Depth of Hydrophone
(m)
Water Depth
(m)
10-min Average
(dB RMS re: 1 μPa)
Dominant Frequency
(Hz)
Reference Figure
9/12/2020 09:03 9.7 1 4.6 121.9 630 A-1
9/12/2020 10:24 12.4 1 4.6 122.8 800 A-2
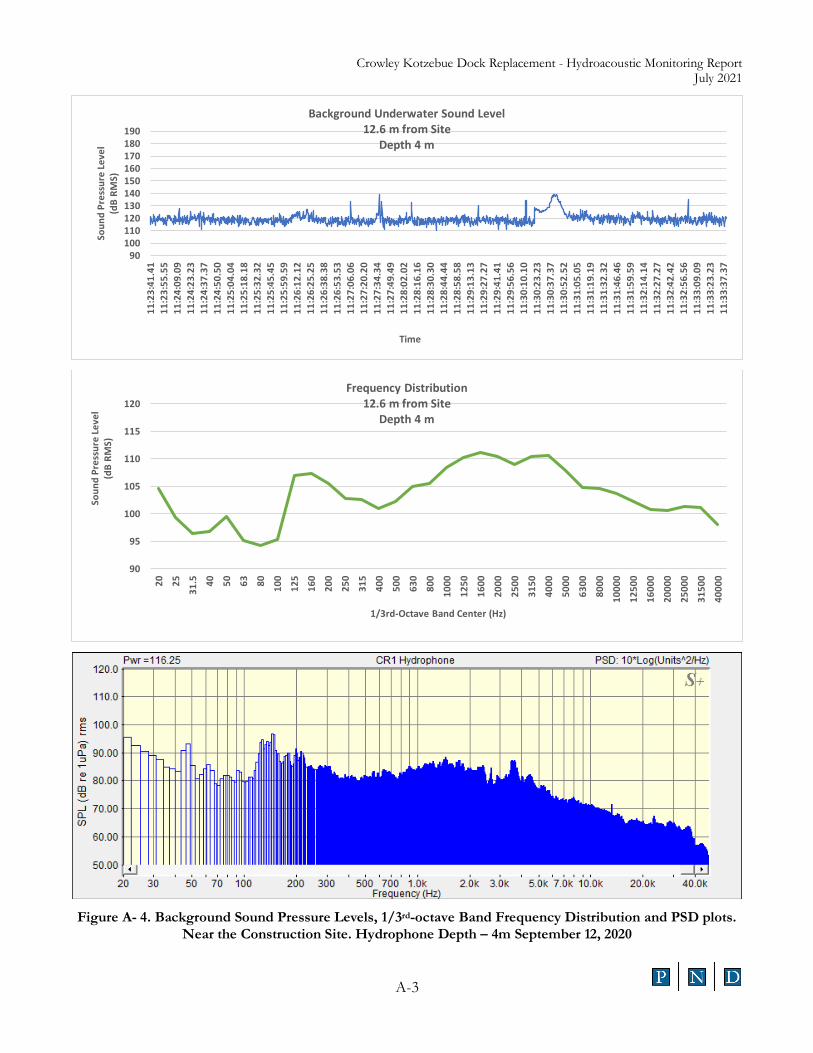
9/12/2020 11:23 12.6 4 4.6 119.5 1600 A-3
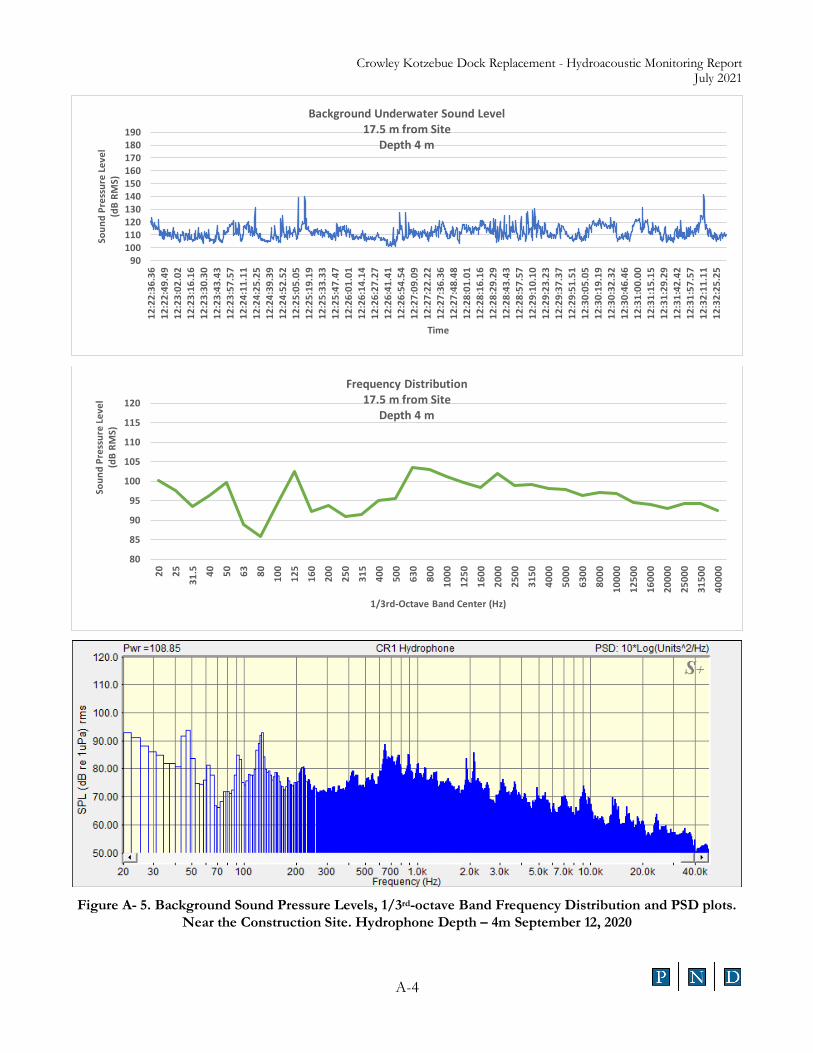
9/12/2020 12:22 17.5 4 4.7 112.0 630 A-4
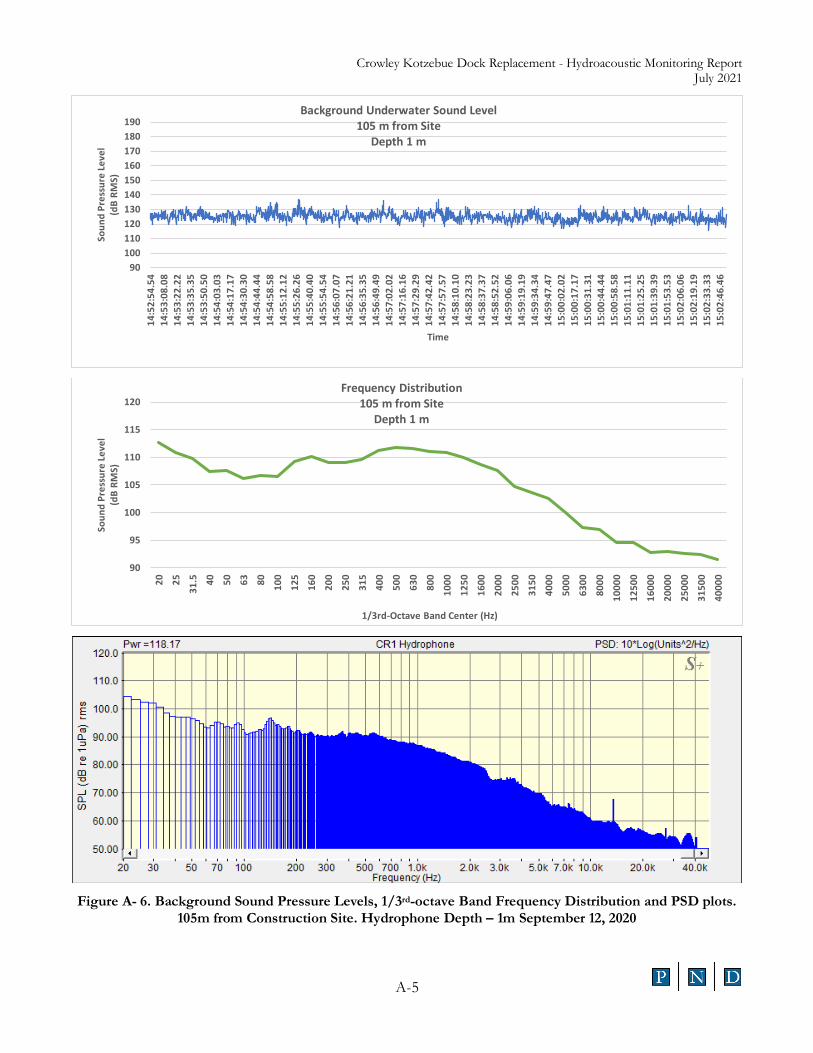
9/12/2020 14:53 105 1 14.7 125.0 20 A-5
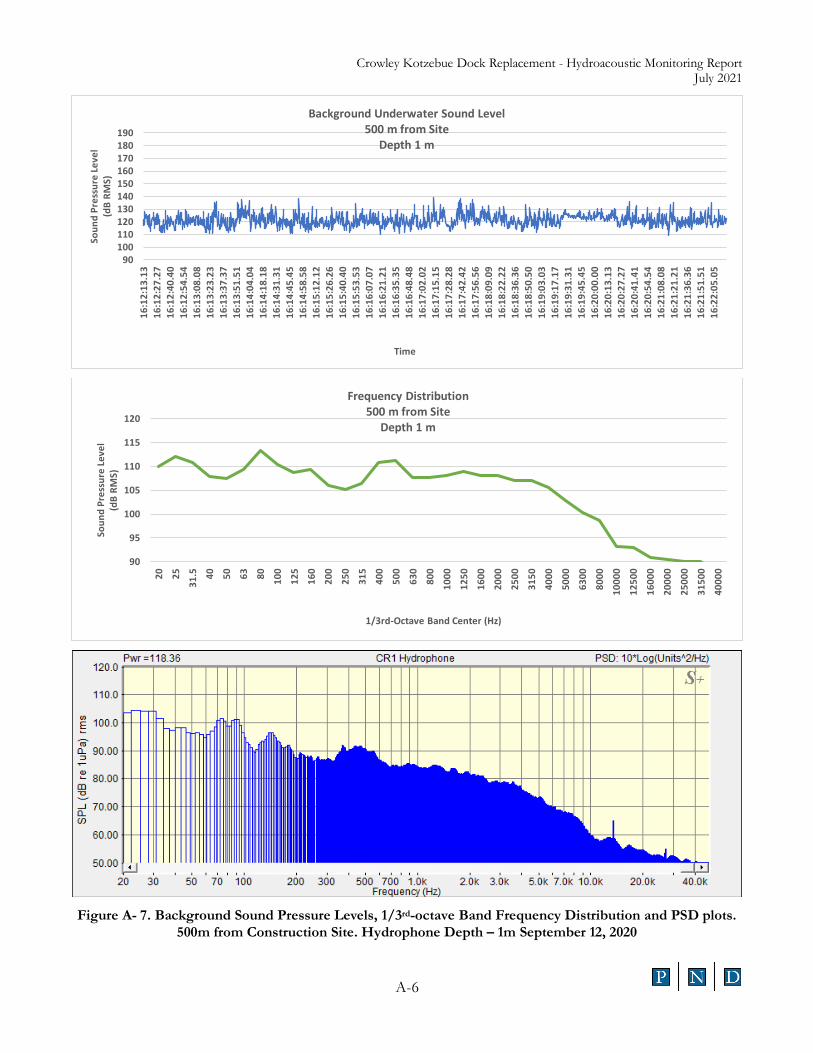
9/12/2020 16:12 500 1 1.2 121.3 80 A-6
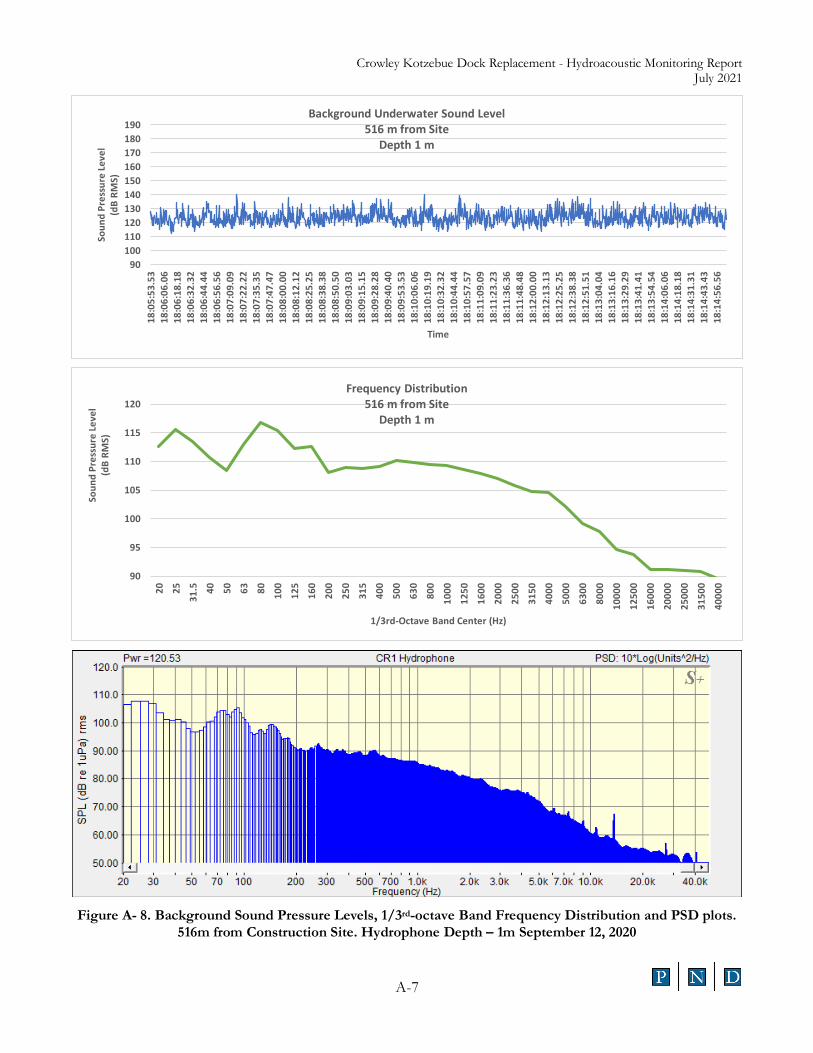
9/12/2020 18:06 516 1 3.6 123.7 80 A-7
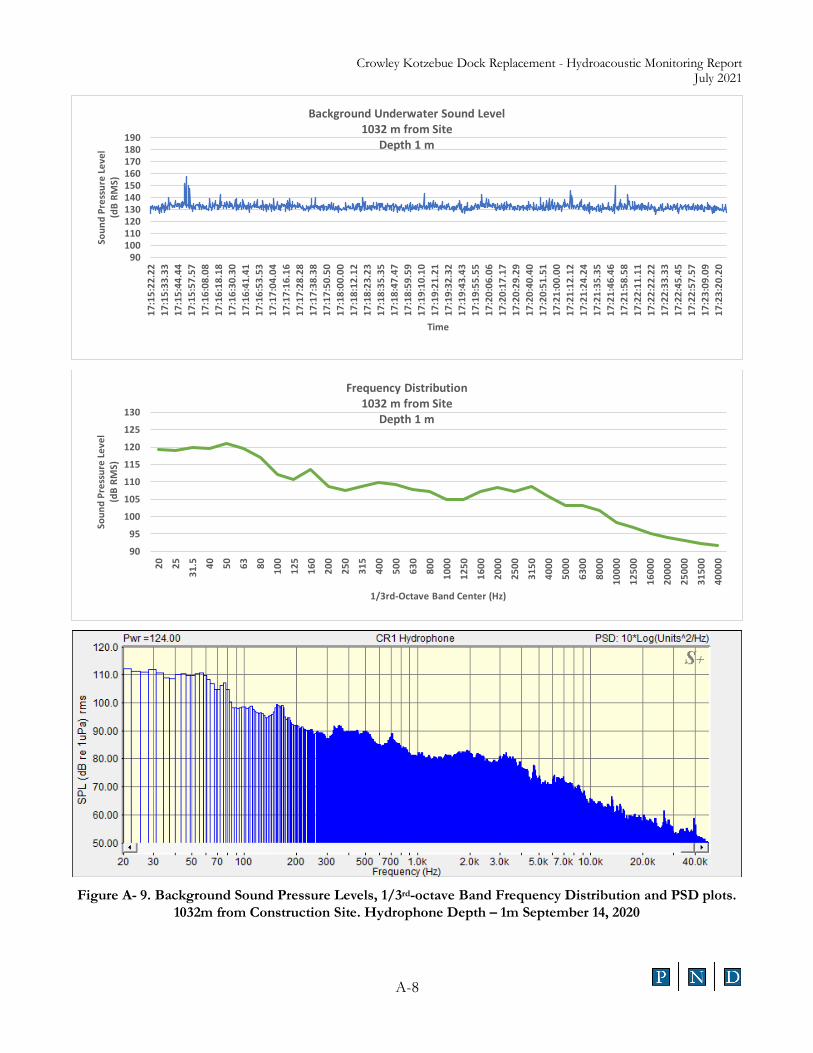
9/14/2020 17:15 1032 1 1.8 132.3 50 A-8
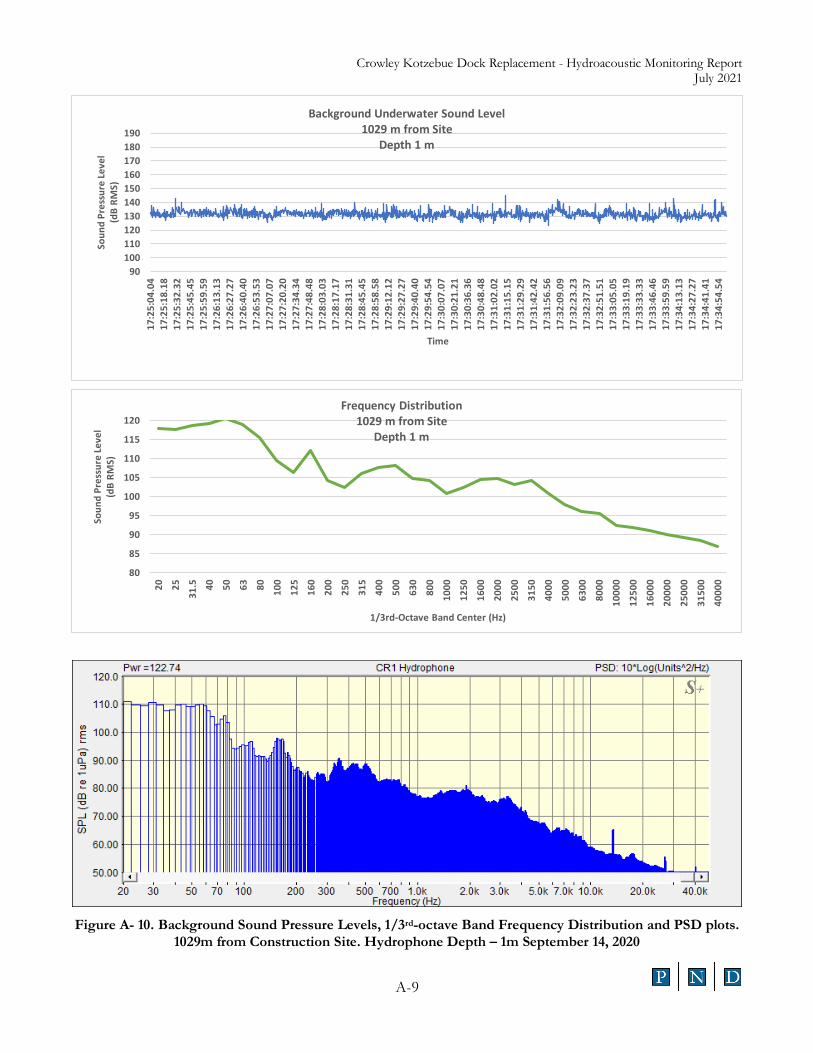
9/14/2020 17:25 1029 1 1.8 131.9 50 A-9
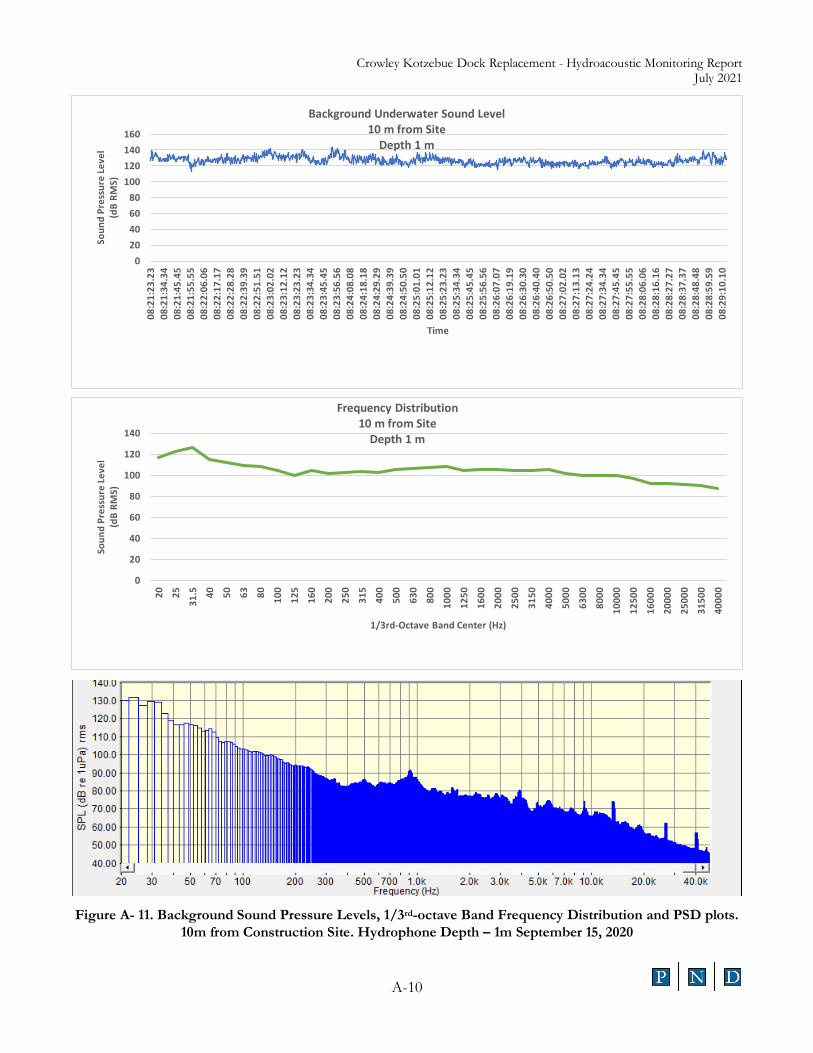
9/15/2020 08:21 10 1 4.6 127.0 31.5 A-10
4.2 Vibratory Sound Levels
A total of 23 vibratory pile-driving events were recorded between September 12 and 14. The interlocking steel sheet piles were driven in pairs. The vibratory time needed to drive the pair of interlocking piles to the desired depth was between 1 and 2 minutes. For the statistical calculation of vibratory RMS SPL, only the period with
Crowley Kotzebue Dock Replacement - Hydroacoustic Monitoring Report July 2021
8
the maximum hammer energy was used. Maximum hammer energy is characterized by removing starts (ramp up of hammer energy) and stops (ramp down of hammer energy) from data being analyzed. All vibratory SPLs given in RMS values are “fast” averaged (125 milliseconds exponential average).
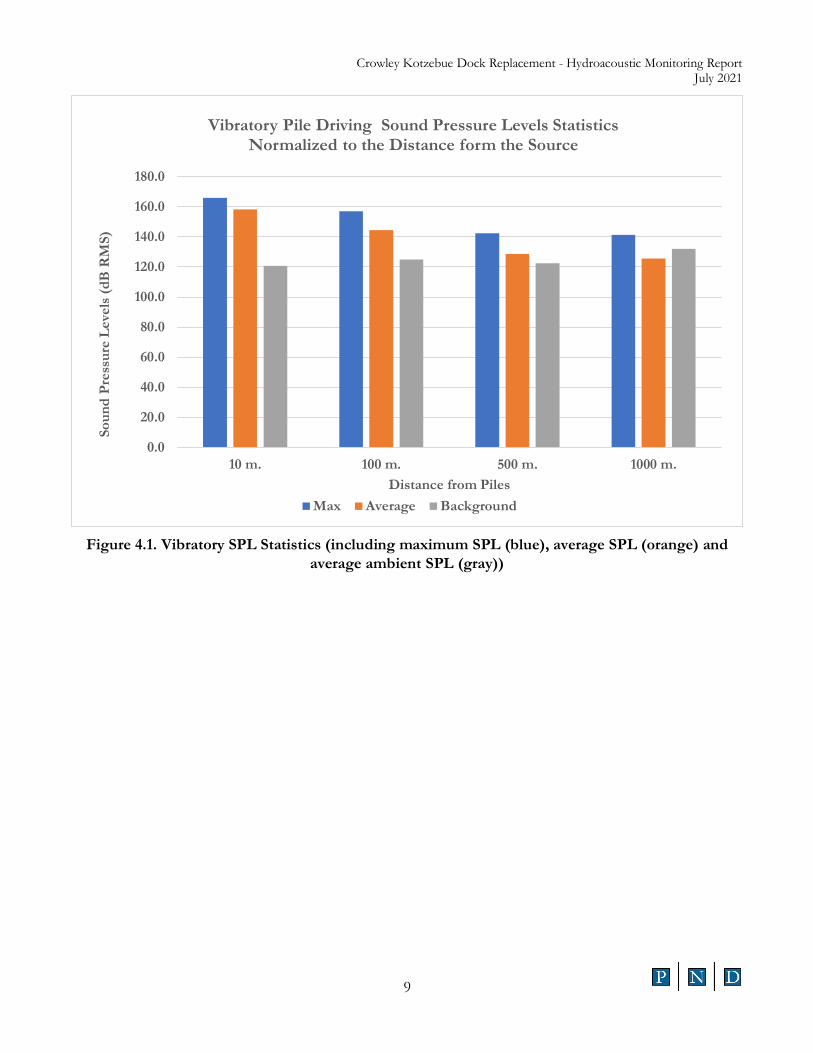
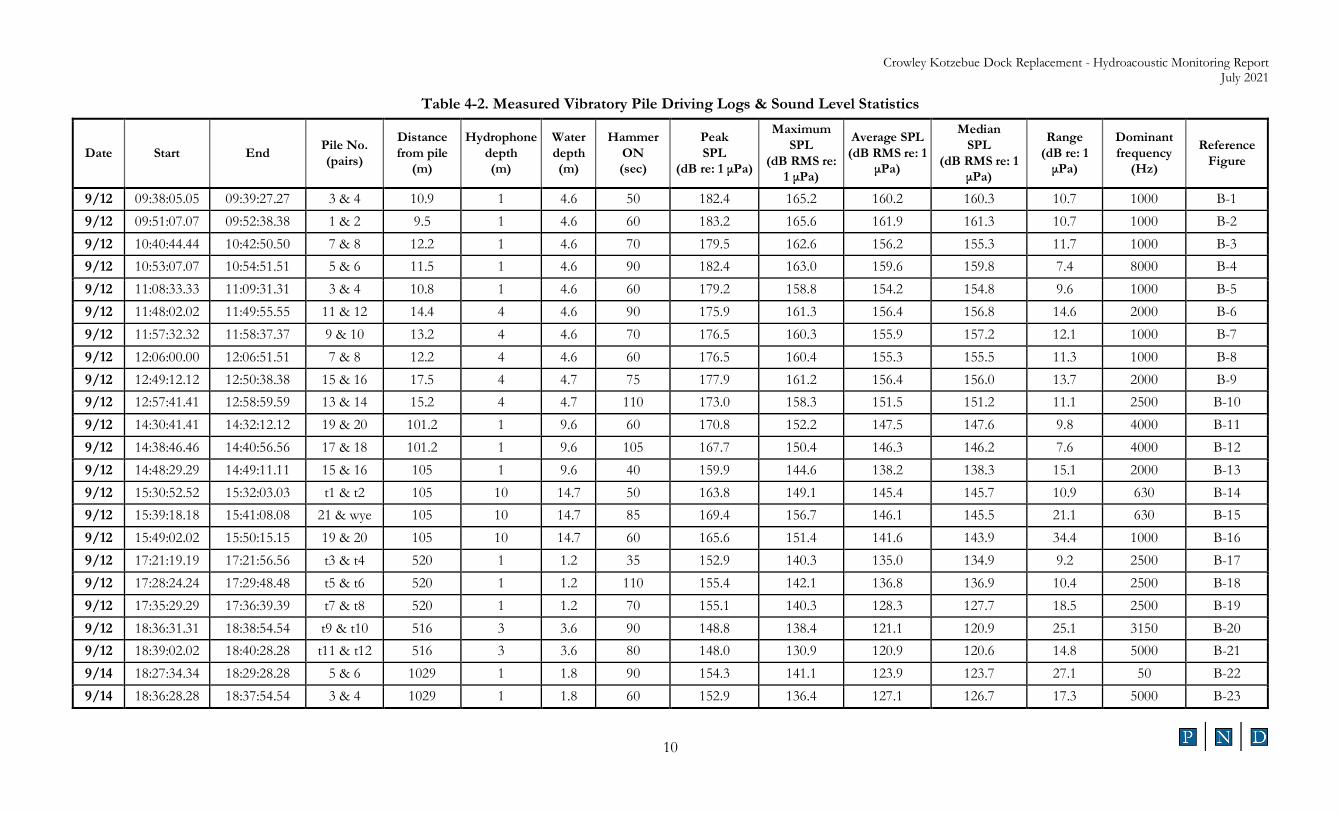
The measured vibratory noise statistics for each pile-driving event are presented in Table 4-2 Maximum RMS pressure levels ranged from 131-166 dB RMS. Sound generated by the vibratory pile driving was dominated around 1,000 – 2,000 Hz frequency range near the source. At greater distances, lower frequencies (perhaps environmental and cable strumming noise) were dominant. The vibratory hammer noise at 1,000 m from the construction site was difficult to detect above the noise produced by current and hydrophone motion in the water (self-noise). The complete time series of the SPL for each pile-driving event, the 1/3rd-octave band frequency spectra and power spectral density (PSD) plots are provided in Appendix B.
The hydroacoustic measurements were performed as safety allowed from the proposed radii (e.g., 10 m, 100 m, 500 m, and 1,000 m between the pile and the hydrophone); however, measurement distances slightly varied from the proposed distances due to the safety and environmental conditions. For the purpose of statistical averaging and for the calculations of transmission loss, the measured data has been normalized to uniform distances using the practical spreading model recommended by the NMFS Northwest Region and Northwest Fisheries Science Center1. Using the practical spreading loss model, transmission loss (TL) in dB units can be defined by:
Equation 4-1. Practical Spreading Model 𝑇𝑇𝑇𝑇 = 15 log (𝑅𝑅2 𝑅𝑅1)⁄ , where: R1 – distances of a known measured sound level R2 – the estimated distance that is required for sound to attenuate (The recommended practical geometric spreading loss constant (GL = 15) is used for these normalizing cal-culations).
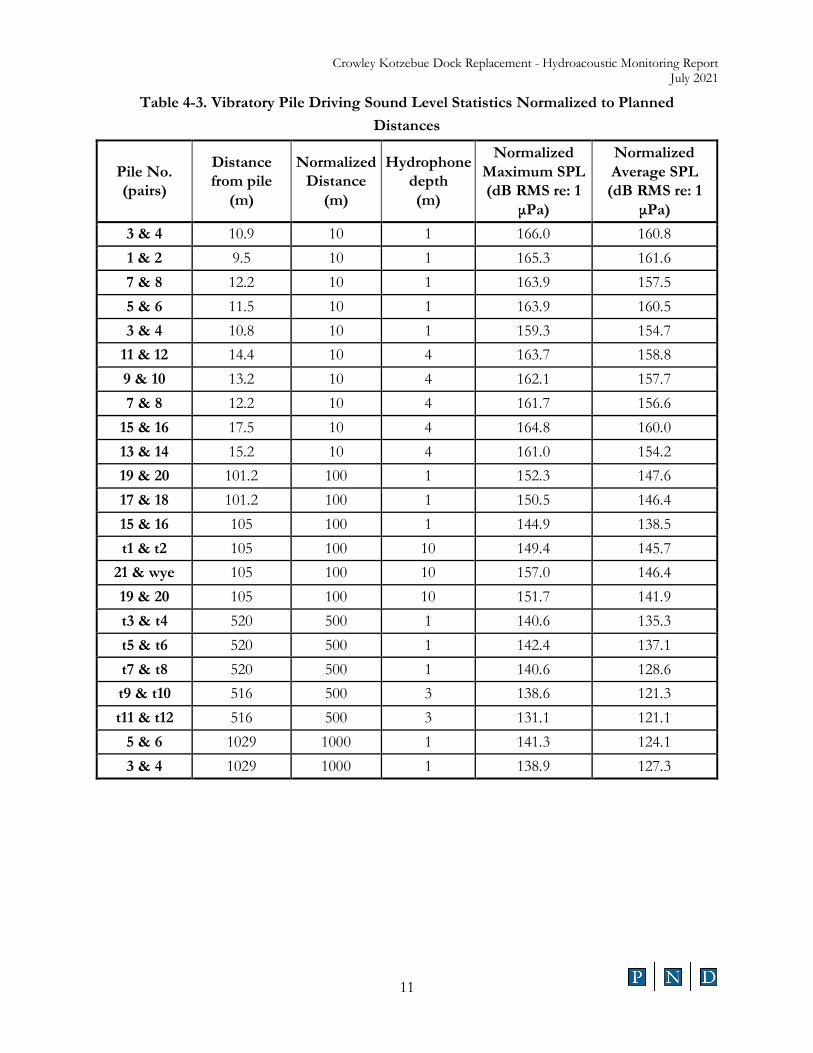
Table 4-3 shows vibratory noise statistics normalized using practical spreading loss model to the uniform distances from the construction site e.g., 10-m, 100-m, 500-m, and 1000-m location.
The normalized average SPL adjacent to the construction site (10 m) was 158.2 dB RMS, as was the median SPL. The average normalized SPL at 100 m from the pile-driving activities was 144.4 dB RMS. The average normalized SPLs at 500 m and 1,000 m from the source were 128.7 and 125.7 dB RMS.
The average vibratory hammer noise at 1,000 m from the source was above the average environmental noise produced by current and hydrophone motion in the water (self-noise).
1 NMFS. 2012. “Sound Propagation Modeling to Characterize Pile Driving Sounds Relevant to Marine Mammals”. Guidance Doc-ument. U.S. Department of Commerce, National Oceanic and Atmospheric Administration, National Marine Fisheries Service, Northwest Region.
Crowley Kotzebue Dock Replacement - Hydroacoustic Monitoring Report July 2021
9
Figure 4.1. Vibratory SPL Statistics (including maximum SPL (blue), average SPL (orange) and
average ambient SPL (gray))
0.0
20.0
40.0
60.0
80.0
100.0
120.0
140.0
160.0
180.0
10 m. 100 m. 500 m. 1000 m.
Soun
d Pr
essu
re L
evel
s (d
B R
MS)
Distance from Piles
Vibratory Pile Driving Sound Pressure Levels StatisticsNormalized to the Distance form the Source
Max Average Background
Crowley Kotzebue Dock Replacement - Hydroacoustic Monitoring Report July 2021
10
Table 4-2. Measured Vibratory Pile Driving Logs & Sound Level Statistics
Date Start End Pile No. (pairs)
Distance from pile
(m)
Hydrophone depth (m)
Water depth (m)
Hammer ON (sec)
Peak SPL
(dB re: 1 μPa)
Maximum SPL
(dB RMS re: 1 μPa)
Average SPL (dB RMS re: 1
μPa)
Median SPL
(dB RMS re: 1 μPa)
Range (dB re: 1
μPa)
Dominant frequency
(Hz)
Reference Figure
9/12 09:38:05.05 09:39:27.27 3 & 4 10.9 1 4.6 50 182.4 165.2 160.2 160.3 10.7 1000 B-1 9/12 09:51:07.07 09:52:38.38 1 & 2 9.5 1 4.6 60 183.2 165.6 161.9 161.3 10.7 1000 B-2 9/12 10:40:44.44 10:42:50.50 7 & 8 12.2 1 4.6 70 179.5 162.6 156.2 155.3 11.7 1000 B-3 9/12 10:53:07.07 10:54:51.51 5 & 6 11.5 1 4.6 90 182.4 163.0 159.6 159.8 7.4 8000 B-4 9/12 11:08:33.33 11:09:31.31 3 & 4 10.8 1 4.6 60 179.2 158.8 154.2 154.8 9.6 1000 B-5 9/12 11:48:02.02 11:49:55.55 11 & 12 14.4 4 4.6 90 175.9 161.3 156.4 156.8 14.6 2000 B-6 9/12 11:57:32.32 11:58:37.37 9 & 10 13.2 4 4.6 70 176.5 160.3 155.9 157.2 12.1 1000 B-7 9/12 12:06:00.00 12:06:51.51 7 & 8 12.2 4 4.6 60 176.5 160.4 155.3 155.5 11.3 1000 B-8 9/12 12:49:12.12 12:50:38.38 15 & 16 17.5 4 4.7 75 177.9 161.2 156.4 156.0 13.7 2000 B-9 9/12 12:57:41.41 12:58:59.59 13 & 14 15.2 4 4.7 110 173.0 158.3 151.5 151.2 11.1 2500 B-10 9/12 14:30:41.41 14:32:12.12 19 & 20 101.2 1 9.6 60 170.8 152.2 147.5 147.6 9.8 4000 B-11 9/12 14:38:46.46 14:40:56.56 17 & 18 101.2 1 9.6 105 167.7 150.4 146.3 146.2 7.6 4000 B-12 9/12 14:48:29.29 14:49:11.11 15 & 16 105 1 9.6 40 159.9 144.6 138.2 138.3 15.1 2000 B-13 9/12 15:30:52.52 15:32:03.03 t1 & t2 105 10 14.7 50 163.8 149.1 145.4 145.7 10.9 630 B-14 9/12 15:39:18.18 15:41:08.08 21 & wye 105 10 14.7 85 169.4 156.7 146.1 145.5 21.1 630 B-15 9/12 15:49:02.02 15:50:15.15 19 & 20 105 10 14.7 60 165.6 151.4 141.6 143.9 34.4 1000 B-16 9/12 17:21:19.19 17:21:56.56 t3 & t4 520 1 1.2 35 152.9 140.3 135.0 134.9 9.2 2500 B-17 9/12 17:28:24.24 17:29:48.48 t5 & t6 520 1 1.2 110 155.4 142.1 136.8 136.9 10.4 2500 B-18 9/12 17:35:29.29 17:36:39.39 t7 & t8 520 1 1.2 70 155.1 140.3 128.3 127.7 18.5 2500 B-19 9/12 18:36:31.31 18:38:54.54 t9 & t10 516 3 3.6 90 148.8 138.4 121.1 120.9 25.1 3150 B-20 9/12 18:39:02.02 18:40:28.28 t11 & t12 516 3 3.6 80 148.0 130.9 120.9 120.6 14.8 5000 B-21 9/14 18:27:34.34 18:29:28.28 5 & 6 1029 1 1.8 90 154.3 141.1 123.9 123.7 27.1 50 B-22 9/14 18:36:28.28 18:37:54.54 3 & 4 1029 1 1.8 60 152.9 136.4 127.1 126.7 17.3 5000 B-23
Crowley Kotzebue Dock Replacement - Hydroacoustic Monitoring Report July 2021
11
Table 4-3. Vibratory Pile Driving Sound Level Statistics Normalized to Planned Distances
Pile No. (pairs)
Distance from pile
(m)
Normalized Distance
(m)
Hydrophone depth (m)
Normalized Maximum SPL (dB RMS re: 1
μPa)
Normalized Average SPL
(dB RMS re: 1 μPa)
3 & 4 10.9 10 1 166.0 160.8 1 & 2 9.5 10 1 165.3 161.6 7 & 8 12.2 10 1 163.9 157.5 5 & 6 11.5 10 1 163.9 160.5 3 & 4 10.8 10 1 159.3 154.7
11 & 12 14.4 10 4 163.7 158.8 9 & 10 13.2 10 4 162.1 157.7 7 & 8 12.2 10 4 161.7 156.6
15 & 16 17.5 10 4 164.8 160.0 13 & 14 15.2 10 4 161.0 154.2 19 & 20 101.2 100 1 152.3 147.6 17 & 18 101.2 100 1 150.5 146.4 15 & 16 105 100 1 144.9 138.5 t1 & t2 105 100 10 149.4 145.7
21 & wye 105 100 10 157.0 146.4 19 & 20 105 100 10 151.7 141.9 t3 & t4 520 500 1 140.6 135.3 t5 & t6 520 500 1 142.4 137.1 t7 & t8 520 500 1 140.6 128.6 t9 & t10 516 500 3 138.6 121.3 t11 & t12 516 500 3 131.1 121.1
5 & 6 1029 1000 1 141.3 124.1 3 & 4 1029 1000 1 138.9 127.3
Crowley Kotzebue Dock Replacement - Hydroacoustic Monitoring Report July 2021
12
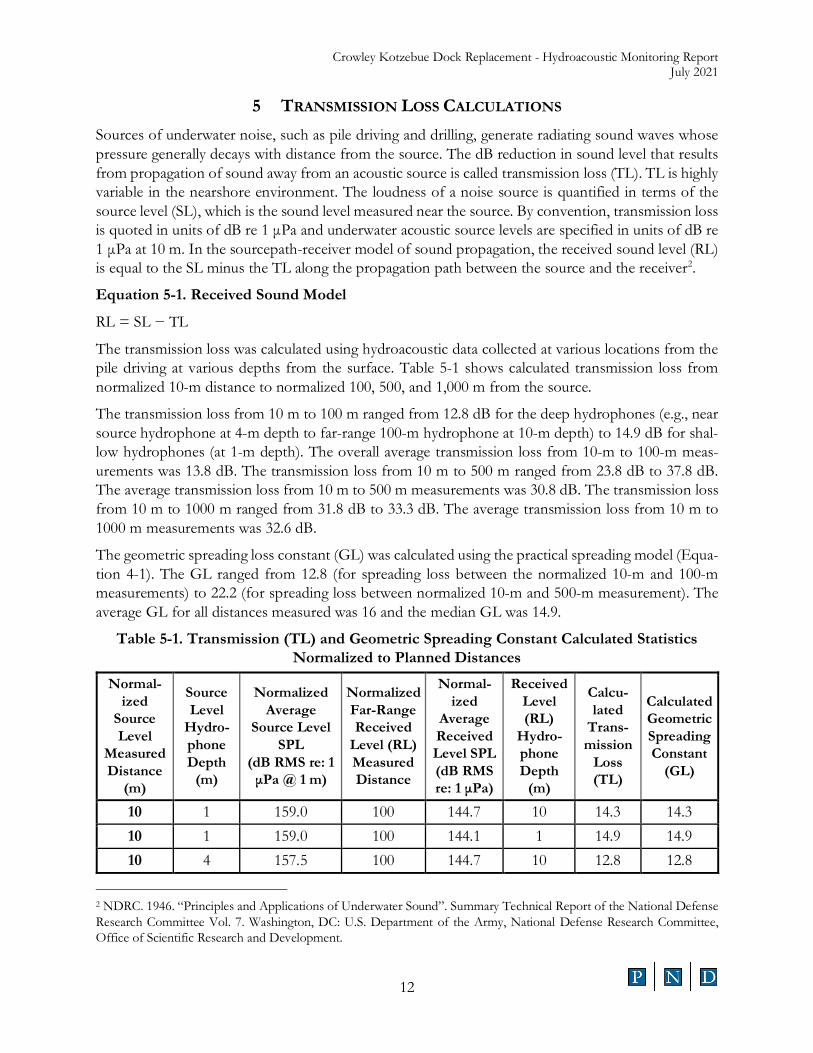
5 TRANSMISSION LOSS CALCULATIONS Sources of underwater noise, such as pile driving and drilling, generate radiating sound waves whose pressure generally decays with distance from the source. The dB reduction in sound level that results from propagation of sound away from an acoustic source is called transmission loss (TL). TL is highly variable in the nearshore environment. The loudness of a noise source is quantified in terms of the source level (SL), which is the sound level measured near the source. By convention, transmission loss is quoted in units of dB re 1 μPa and underwater acoustic source levels are specified in units of dB re 1 μPa at 10 m. In the sourcepath-receiver model of sound propagation, the received sound level (RL) is equal to the SL minus the TL along the propagation path between the source and the receiver2.
Equation 5-1. Received Sound Model
RL = SL − TL
The transmission loss was calculated using hydroacoustic data collected at various locations from the pile driving at various depths from the surface. Table 5-1 shows calculated transmission loss from normalized 10-m distance to normalized 100, 500, and 1,000 m from the source.
The transmission loss from 10 m to 100 m ranged from 12.8 dB for the deep hydrophones (e.g., near source hydrophone at 4-m depth to far-range 100-m hydrophone at 10-m depth) to 14.9 dB for shal-low hydrophones (at 1-m depth). The overall average transmission loss from 10-m to 100-m meas-urements was 13.8 dB. The transmission loss from 10 m to 500 m ranged from 23.8 dB to 37.8 dB. The average transmission loss from 10 m to 500 m measurements was 30.8 dB. The transmission loss from 10 m to 1000 m ranged from 31.8 dB to 33.3 dB. The average transmission loss from 10 m to 1000 m measurements was 32.6 dB.
The geometric spreading loss constant (GL) was calculated using the practical spreading model (Equa-tion 4-1). The GL ranged from 12.8 (for spreading loss between the normalized 10-m and 100-m measurements) to 22.2 (for spreading loss between normalized 10-m and 500-m measurement). The average GL for all distances measured was 16 and the median GL was 14.9.
Table 5-1. Transmission (TL) and Geometric Spreading Constant Calculated Statistics Normalized to Planned Distances
Normal-ized
Source Level
Measured Distance
(m)
Source Level
Hydro-phone Depth
(m)
Normalized Average
Source Level SPL
(dB RMS re: 1 μPa @ 1 m)
Normalized Far-Range Received
Level (RL) Measured Distance
Normal-ized
Average Received Level SPL (dB RMS re: 1 μPa)
Received Level (RL)
Hydro-phone Depth
(m)
Calcu-lated
Trans-mission
Loss (TL)
Calculated Geometric Spreading Constant
(GL)
10 1 159.0 100 144.7 10 14.3 14.3 10 1 159.0 100 144.1 1 14.9 14.9 10 4 157.5 100 144.7 10 12.8 12.8
2 NDRC. 1946. “Principles and Applications of Underwater Sound”. Summary Technical Report of the National Defense Research Committee Vol. 7. Washington, DC: U.S. Department of the Army, National Defense Research Committee, Office of Scientific Research and Development.
Crowley Kotzebue Dock Replacement - Hydroacoustic Monitoring Report July 2021
13
10 4 157.5 100 144.1 1 13.3 13.3 10 1 159.0 500 121.2 3 37.8 22.2 10 1 159.0 500 133.6 1 25.4 14.9 10 4 157.5 500 121.2 3 36.3 21.3 10 4 157.5 500 133.6 1 23.8 14.0 10 1 159.0 1000 125.7 1 33.3 16.7 10 4 157.5 1000 125.7 1 31.8 15.9
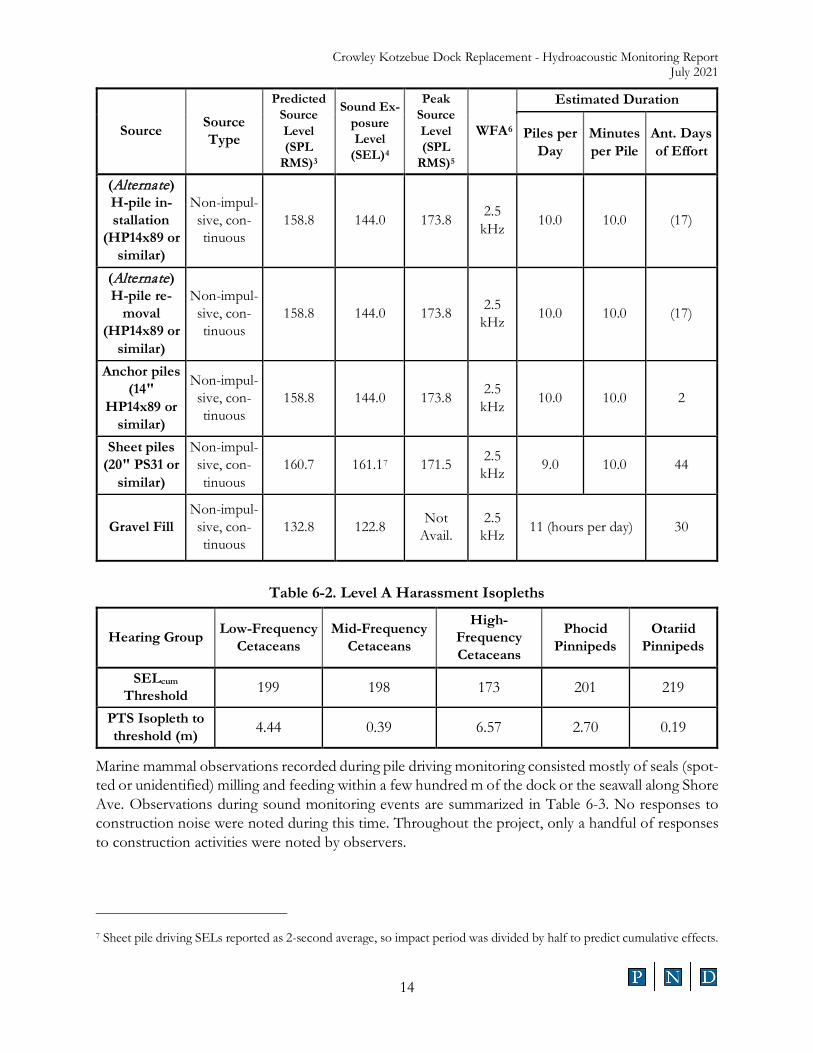
6 MARINE MAMMAL IMPACTS Sound source levels were lower than predicted during pre-project planning and permitting efforts. Using NMFS’ spreading model for predicting impact isopleths the median measured source level of 158.2 dB RMS, construction noise would attenuate to the median measured background noise level of 123.3 dB within 2,200 m (although this may be conservative, based on the nearly background levels recorded at 1,000 m from construction). Construction noise would attenuate to the NMFS regulatory threshold of 120 dB within just over 3,520 m. Using the median measured GL, these distances would be 2,376 m and 3,660 m.
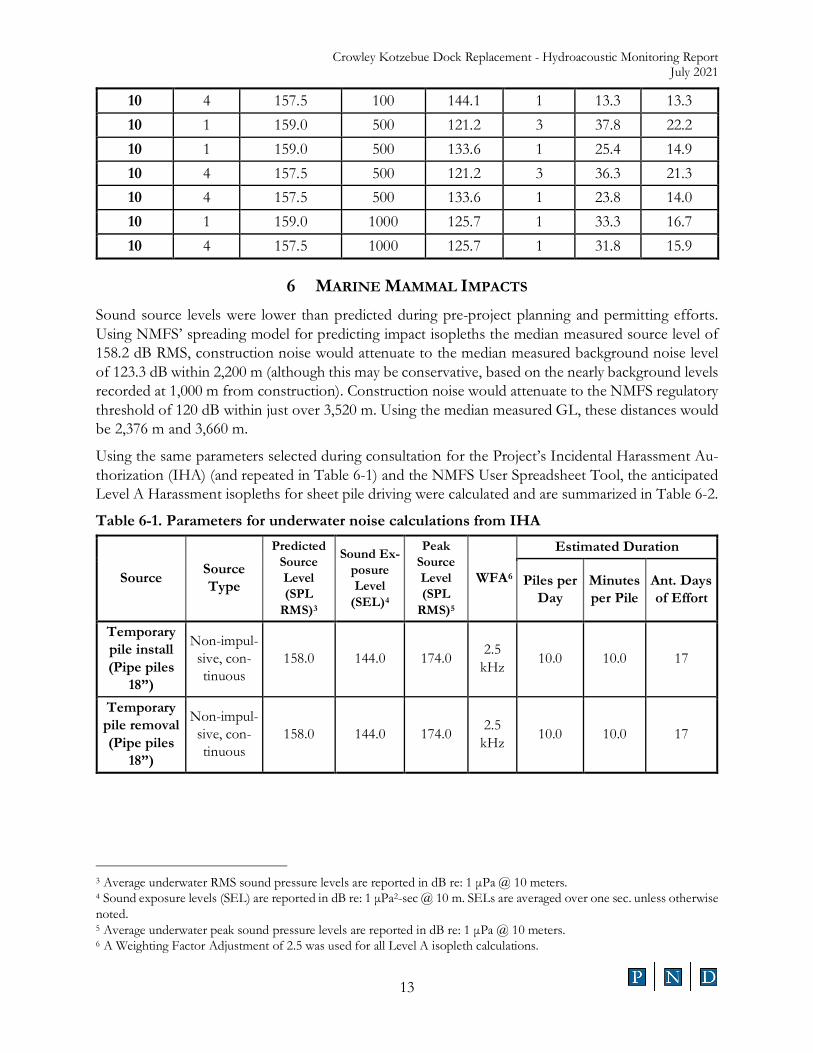
Using the same parameters selected during consultation for the Project’s Incidental Harassment Au-thorization (IHA) (and repeated in Table 6-1) and the NMFS User Spreadsheet Tool, the anticipated Level A Harassment isopleths for sheet pile driving were calculated and are summarized in Table 6-2.
Table 6-1. Parameters for underwater noise calculations from IHA
Source Source Type
Predicted Source Level (SPL
RMS)3
Sound Ex-posure Level
(SEL)4
Peak Source Level (SPL
RMS)5
WFA6
Estimated Duration
Piles per Day
Minutes per Pile
Ant. Days of Effort
Temporary pile install (Pipe piles
18”)
Non-impul-sive, con-tinuous
158.0 144.0 174.0 2.5 kHz 10.0 10.0 17
Temporary pile removal (Pipe piles
18”)
Non-impul-sive, con-tinuous
158.0 144.0 174.0 2.5 kHz 10.0 10.0 17
3 Average underwater RMS sound pressure levels are reported in dB re: 1 μPa @ 10 meters. 4 Sound exposure levels (SEL) are reported in dB re: 1 μPa2-sec @ 10 m. SELs are averaged over one sec. unless otherwise noted. 5 Average underwater peak sound pressure levels are reported in dB re: 1 μPa @ 10 meters. 6 A Weighting Factor Adjustment of 2.5 was used for all Level A isopleth calculations.
Crowley Kotzebue Dock Replacement - Hydroacoustic Monitoring Report July 2021
14
Source Source Type
Predicted Source Level (SPL
RMS)3
Sound Ex-posure Level
(SEL)4
Peak Source Level (SPL
RMS)5
WFA6
Estimated Duration
Piles per Day
Minutes per Pile
Ant. Days of Effort
(Alternate) H-pile in-stallation
(HP14x89 or similar)
Non-impul-sive, con-tinuous
158.8 144.0 173.8 2.5 kHz 10.0 10.0 (17)
(Alternate) H-pile re-
moval (HP14x89 or
similar)
Non-impul-sive, con-tinuous
158.8 144.0 173.8 2.5 kHz 10.0 10.0 (17)
Anchor piles (14"
HP14x89 or similar)
Non-impul-sive, con-tinuous
158.8 144.0 173.8 2.5 kHz 10.0 10.0 2
Sheet piles (20" PS31 or
similar)
Non-impul-sive, con-tinuous
160.7 161.17 171.5 2.5 kHz 9.0 10.0 44
Gravel Fill Non-impul-sive, con-tinuous
132.8 122.8 Not Avail.
2.5 kHz 11 (hours per day) 30
Table 6-2. Level A Harassment Isopleths
Hearing Group Low-Frequency Cetaceans
Mid-Frequency Cetaceans
High-Frequency Cetaceans
Phocid Pinnipeds
Otariid Pinnipeds
SELcum Threshold 199 198 173 201 219
PTS Isopleth to threshold (m) 4.44 0.39 6.57 2.70 0.19
Marine mammal observations recorded during pile driving monitoring consisted mostly of seals (spot-ted or unidentified) milling and feeding within a few hundred m of the dock or the seawall along Shore Ave. Observations during sound monitoring events are summarized in Table 6-3. No responses to construction noise were noted during this time. Throughout the project, only a handful of responses to construction activities were noted by observers.
7 Sheet pile driving SELs reported as 2-second average, so impact period was divided by half to predict cumulative effects.
Crowley Kotzebue Dock Replacement - Hydroacoustic Monitoring Report July 2021
15
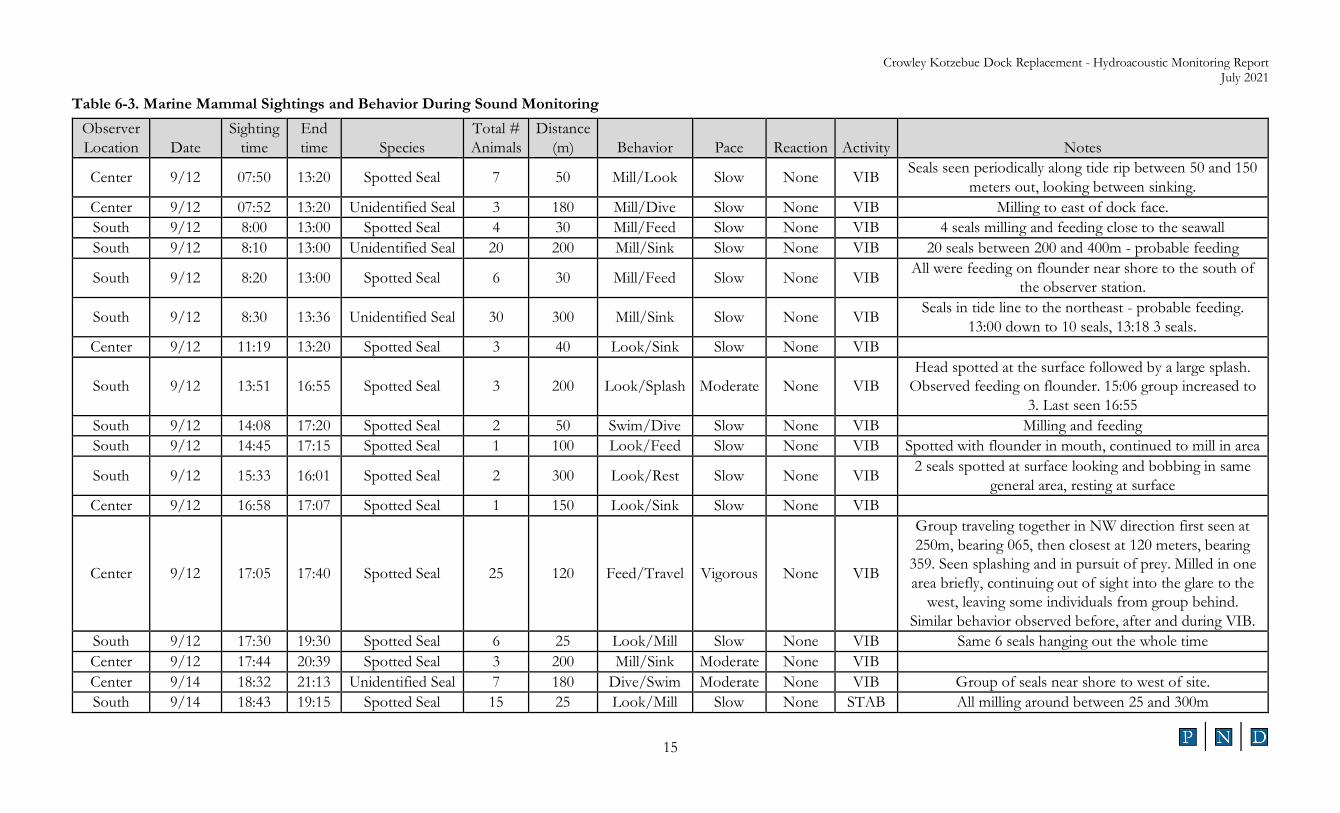
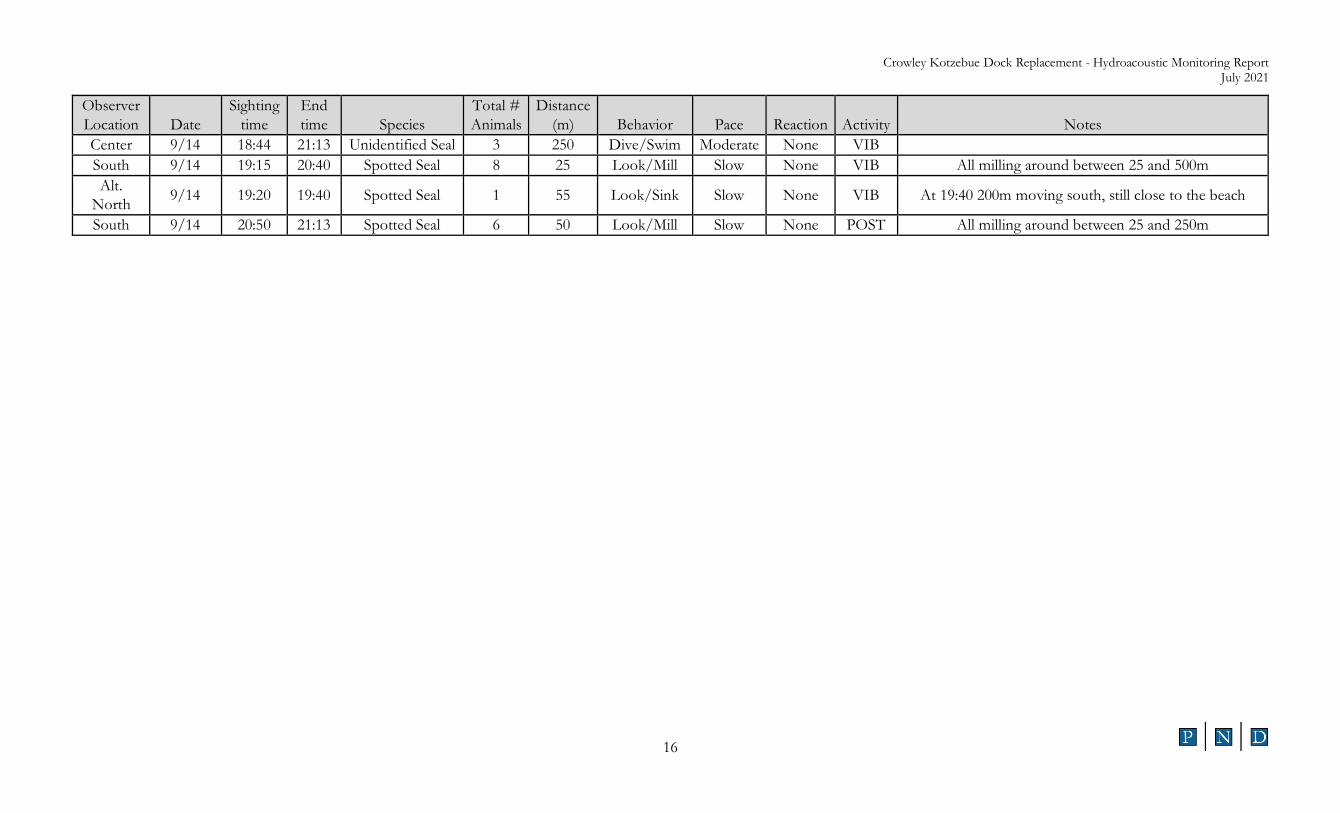
Table 6-3. Marine Mammal Sightings and Behavior During Sound Monitoring Observer Location Date
Sighting time
End time Species
Total # Animals
Distance (m) Behavior Pace Reaction Activity Notes
Center 9/12 07:50 13:20 Spotted Seal 7 50 Mill/Look Slow None VIB Seals seen periodically along tide rip between 50 and 150 meters out, looking between sinking.
Center 9/12 07:52 13:20 Unidentified Seal 3 180 Mill/Dive Slow None VIB Milling to east of dock face. South 9/12 8:00 13:00 Spotted Seal 4 30 Mill/Feed Slow None VIB 4 seals milling and feeding close to the seawall South 9/12 8:10 13:00 Unidentified Seal 20 200 Mill/Sink Slow None VIB 20 seals between 200 and 400m - probable feeding
South 9/12 8:20 13:00 Spotted Seal 6 30 Mill/Feed Slow None VIB All were feeding on flounder near shore to the south of the observer station.
South 9/12 8:30 13:36 Unidentified Seal 30 300 Mill/Sink Slow None VIB Seals in tide line to the northeast - probable feeding. 13:00 down to 10 seals, 13:18 3 seals.
Center 9/12 11:19 13:20 Spotted Seal 3 40 Look/Sink Slow None VIB
South 9/12 13:51 16:55 Spotted Seal 3 200 Look/Splash Moderate None VIB Head spotted at the surface followed by a large splash.
Observed feeding on flounder. 15:06 group increased to 3. Last seen 16:55
South 9/12 14:08 17:20 Spotted Seal 2 50 Swim/Dive Slow None VIB Milling and feeding South 9/12 14:45 17:15 Spotted Seal 1 100 Look/Feed Slow None VIB Spotted with flounder in mouth, continued to mill in area
South 9/12 15:33 16:01 Spotted Seal 2 300 Look/Rest Slow None VIB 2 seals spotted at surface looking and bobbing in same general area, resting at surface
Center 9/12 16:58 17:07 Spotted Seal 1 150 Look/Sink Slow None VIB
Center 9/12 17:05 17:40 Spotted Seal 25 120 Feed/Travel Vigorous None VIB
Group traveling together in NW direction first seen at 250m, bearing 065, then closest at 120 meters, bearing
359. Seen splashing and in pursuit of prey. Milled in one area briefly, continuing out of sight into the glare to the
west, leaving some individuals from group behind. Similar behavior observed before, after and during VIB.
South 9/12 17:30 19:30 Spotted Seal 6 25 Look/Mill Slow None VIB Same 6 seals hanging out the whole time Center 9/12 17:44 20:39 Spotted Seal 3 200 Mill/Sink Moderate None VIB Center 9/14 18:32 21:13 Unidentified Seal 7 180 Dive/Swim Moderate None VIB Group of seals near shore to west of site. South 9/14 18:43 19:15 Spotted Seal 15 25 Look/Mill Slow None STAB All milling around between 25 and 300m
Crowley Kotzebue Dock Replacement - Hydroacoustic Monitoring Report July 2021
16
Observer Location Date
Sighting time
End time Species
Total # Animals
Distance (m) Behavior Pace Reaction Activity Notes
Center 9/14 18:44 21:13 Unidentified Seal 3 250 Dive/Swim Moderate None VIB South 9/14 19:15 20:40 Spotted Seal 8 25 Look/Mill Slow None VIB All milling around between 25 and 500m Alt.
North 9/14 19:20 19:40 Spotted Seal 1 55 Look/Sink Slow None VIB At 19:40 200m moving south, still close to the beach
South 9/14 20:50 21:13 Spotted Seal 6 50 Look/Mill Slow None POST All milling around between 25 and 250m
Appendix A
APPENDIX A
Background Sound Level Time Series
1/3rd-Octave Band Frequencies Distribution
and Power Spectral Density

Crowley Kotzebue Dock Replacement - Hydroacoustic Monitoring Report July 2021
A-1
Figure A- 2. Background Sound Pressure Levels, 1/3rd-octave Band Frequency Distribution and PSD plots.
Near the Construction Site. Hydrophone Depth – 1m September 12, 2020
90100110120130140150160170180
09:0
3:04
.04
09:0
3:31
.31
09:0
3:59
.59
09:0
4:28
.28
09:0
4:56
.56
09:0
5:24
.24
09:0
5:51
.51
09:0
6:17
.17
09:0
6:46
.46
09:0
7:15
.15
09:0
7:44
.44
09:0
8:13
.13
09:0
8:40
.40
09:0
9:07
.07
09:0
9:34
.34
09:1
0:01
.01
09:1
0:28
.28
09:1
0:56
.56
09:1
1:22
.22
09:1
1:51
.51
09:1
2:19
.19
09:1
2:48
.48
09:1
3:16
.16
09:1
3:44
.44
09:1
4:11
.11
09:1
4:39
.39
09:1
5:07
.07
09:1
5:35
.35
09:1
6:02
.02
09:1
6:30
.30
09:1
6:58
.58
09:1
7:25
.25
09:1
7:53
.53
09:1
8:20
.20
09:1
8:49
.49
09:1
9:17
.17
09:1
9:46
.46
09:2
0:14
.14
09:2
0:42
.42
09:2
1:10
.10
09:2
1:38
.38
09:2
2:06
.06
09:2
2:34
.34
09:2
3:02
.02
09:2
3:31
.31
Soun
d Pr
essu
re L
evel
(dB
RMS)
Time
Background Underwater Sound Level9.7 m from Site
Depth 1 m
90
100
110
120
20 25
31.5 40 50 63 80 100
125
160
200
250
315
400
500
630
800
1000
1250
1600
2000
2500
3150
4000
5000
6300
8000
1000
0
1250
0
1600
0
2000
0
2500
0
3150
0
4000
0
Soun
d Pr
essu
re L
evel
(dB
RMS)
1/3rd-Octave Band Center (Hz)
Frequency Distribution9.7 m from Site
Depth 1 m

Crowley Kotzebue Dock Replacement - Hydroacoustic Monitoring Report July 2021
A-2
Figure A- 3. Background Sound Pressure Levels, 1/3rd-octave Band Frequency Distribution and PSD plots.
Near the Construction Site. Hydrophone Depth – 1m September 12, 2020
90100110120130140150160170180190
10:2
4:46
.46
10:2
5:00
.00
10:2
5:13
.13
10:2
5:26
.26
10:2
5:40
.40
10:2
5:53
.53
10:2
6:06
.06
10:2
6:18
.18
10:2
6:31
.31
10:2
6:43
.43
10:2
6:57
.57
10:2
7:10
.10
10:2
7:23
.23
10:2
7:36
.36
10:2
7:49
.49
10:2
8:02
.02
10:2
8:16
.16
10:2
8:29
.29
10:2
8:43
.43
10:2
8:56
.56
10:2
9:09
.09
10:2
9:23
.23
10:2
9:35
.35
10:2
9:49
.49
10:3
0:02
.02
10:3
0:15
.15
10:3
0:27
.27
10:3
0:41
.41
10:3
0:53
.53
10:3
1:06
.06
10:3
1:19
.19
10:3
1:32
.32
10:3
1:44
.44
10:3
1:58
.58
10:3
2:10
.10
10:3
2:24
.24
10:3
2:36
.36
10:3
2:50
.50
10:3
3:02
.02
10:3
3:15
.15
10:3
3:29
.29
10:3
3:42
.42
10:3
3:55
.55
10:3
4:08
.08
10:3
4:21
.21
10:3
4:34
.34
Soun
d Pr
essu
re L
evel
(dB
RMS)
Time
Background Underwater Sound Level12.4 m from Site
Depth 1 m
90
95
100
105
110
115
120
20 25
31.5 40 50 63 80 100
125
160
200
250
315
400
500
630
800
1000
1250
1600
2000
2500
3150
4000
5000
6300
8000
1000
0
1250
0
1600
0
2000
0
2500
0
3150
0
4000
0
Soun
d Pr
essu
re L
evel
(d
B RM
S)
1/3rd-Octave Band Center (Hz)
Frequency Distribution12.4 m from Site
Depth 1 m
Crowley Kotzebue Dock Replacement - Hydroacoustic Monitoring Report July 2021
A-3
Figure A- 4. Background Sound Pressure Levels, 1/3rd-octave Band Frequency Distribution and PSD plots.
Near the Construction Site. Hydrophone Depth – 4m September 12, 2020
90100110120130140150160170180190
11:2
3:41
.41
11:2
3:55
.55
11:2
4:09
.09
11:2
4:23
.23
11:2
4:37
.37
11:2
4:50
.50
11:2
5:04
.04
11:2
5:18
.18
11:2
5:32
.32
11:2
5:45
.45
11:2
5:59
.59
11:2
6:12
.12
11:2
6:25
.25
11:2
6:38
.38
11:2
6:53
.53
11:2
7:06
.06
11:2
7:20
.20
11:2
7:34
.34
11:2
7:49
.49
11:2
8:02
.02
11:2
8:16
.16
11:2
8:30
.30
11:2
8:44
.44
11:2
8:58
.58
11:2
9:13
.13
11:2
9:27
.27
11:2
9:41
.41
11:2
9:56
.56
11:3
0:10
.10
11:3
0:23
.23
11:3
0:37
.37
11:3
0:52
.52
11:3
1:05
.05
11:3
1:19
.19
11:3
1:32
.32
11:3
1:46
.46
11:3
1:59
.59
11:3
2:14
.14
11:3
2:27
.27
11:3
2:42
.42
11:3
2:56
.56
11:3
3:09
.09
11:3
3:23
.23
11:3
3:37
.37
Soun
d Pr
essu
re L
evel
(d
B RM
S)
Time
Background Underwater Sound Level12.6 m from Site
Depth 4 m
90
95
100
105
110
115
120
20 25
31.5 40 50 63 80 100
125
160
200
250
315
400
500
630
800
1000
1250
1600
2000
2500
3150
4000
5000
6300
8000
1000
0
1250
0
1600
0
2000
0
2500
0
3150
0
4000
0
Soun
d Pr
essu
re L
evel
(d
B RM
S)
1/3rd-Octave Band Center (Hz)
Frequency Distribution12.6 m from Site
Depth 4 m
Crowley Kotzebue Dock Replacement - Hydroacoustic Monitoring Report July 2021
A-4
Figure A- 5. Background Sound Pressure Levels, 1/3rd-octave Band Frequency Distribution and PSD plots.
Near the Construction Site. Hydrophone Depth – 4m September 12, 2020
90100110120130140150160170180190
12:2
2:36
.36
12:2
2:49
.49
12:2
3:02
.02
12:2
3:16
.16
12:2
3:30
.30
12:2
3:43
.43
12:2
3:57
.57
12:2
4:11
.11
12:2
4:25
.25
12:2
4:39
.39
12:2
4:52
.52
12:2
5:05
.05
12:2
5:19
.19
12:2
5:33
.33
12:2
5:47
.47
12:2
6:01
.01
12:2
6:14
.14
12:2
6:27
.27
12:2
6:41
.41
12:2
6:54
.54
12:2
7:09
.09
12:2
7:22
.22
12:2
7:36
.36
12:2
7:48
.48
12:2
8:01
.01
12:2
8:16
.16
12:2
8:29
.29
12:2
8:43
.43
12:2
8:57
.57
12:2
9:10
.10
12:2
9:23
.23
12:2
9:37
.37
12:2
9:51
.51
12:3
0:05
.05
12:3
0:19
.19
12:3
0:32
.32
12:3
0:46
.46
12:3
1:00
.00
12:3
1:15
.15
12:3
1:29
.29
12:3
1:42
.42
12:3
1:57
.57
12:3
2:11
.11
12:3
2:25
.25
Soun
d Pr
essu
re L
evel
(d
B RM
S)
Time
Background Underwater Sound Level17.5 m from Site
Depth 4 m
80
85
90
95
100
105
110
115
120
20 25
31.5 40 50 63 80 100
125
160
200
250
315
400
500
630
800
1000
1250
1600
2000
2500
3150
4000
5000
6300
8000
1000
0
1250
0
1600
0
2000
0
2500
0
3150
0
4000
0
Soun
d Pr
essu
re L
evel
(d
B RM
S)
1/3rd-Octave Band Center (Hz)
Frequency Distribution17.5 m from Site
Depth 4 m
Crowley Kotzebue Dock Replacement - Hydroacoustic Monitoring Report July 2021
A-5
Figure A- 6. Background Sound Pressure Levels, 1/3rd-octave Band Frequency Distribution and PSD plots.
105m from Construction Site. Hydrophone Depth – 1m September 12, 2020
90100110120130140150160170180190
14:5
2:54
.54
14:5
3:08
.08
14:5
3:22
.22
14:5
3:35
.35
14:5
3:50
.50
14:5
4:03
.03
14:5
4:17
.17
14:5
4:30
.30
14:5
4:44
.44
14:5
4:58
.58
14:5
5:12
.12
14:5
5:26
.26
14:5
5:40
.40
14:5
5:54
.54
14:5
6:07
.07
14:5
6:21
.21
14:5
6:35
.35
14:5
6:49
.49
14:5
7:02
.02
14:5
7:16
.16
14:5
7:29
.29
14:5
7:42
.42
14:5
7:57
.57
14:5
8:10
.10
14:5
8:23
.23
14:5
8:37
.37
14:5
8:52
.52
14:5
9:06
.06
14:5
9:19
.19
14:5
9:34
.34
14:5
9:47
.47
15:0
0:02
.02
15:0
0:17
.17
15:0
0:31
.31
15:0
0:44
.44
15:0
0:58
.58
15:0
1:11
.11
15:0
1:25
.25
15:0
1:39
.39
15:0
1:53
.53
15:0
2:06
.06
15:0
2:19
.19
15:0
2:33
.33
15:0
2:46
.46
Soun
d Pr
essu
re L
evel
(d
B RM
S)
Time
Background Underwater Sound Level105 m from Site
Depth 1 m
90
95
100
105
110
115
120
20 25
31.5 40 50 63 80 100
125
160
200
250
315
400
500
630
800
1000
1250
1600
2000
2500
3150
4000
5000
6300
8000
1000
0
1250
0
1600
0
2000
0
2500
0
3150
0
4000
0
Soun
d Pr
essu
re L
evel
(d
B RM
S)
1/3rd-Octave Band Center (Hz)
Frequency Distribution105 m from Site
Depth 1 m
Crowley Kotzebue Dock Replacement - Hydroacoustic Monitoring Report July 2021
A-6
Figure A- 7. Background Sound Pressure Levels, 1/3rd-octave Band Frequency Distribution and PSD plots.
500m from Construction Site. Hydrophone Depth – 1m September 12, 2020
90100110120130140150160170180190
16:1
2:13
.13
16:1
2:27
.27
16:1
2:40
.40
16:1
2:54
.54
16:1
3:08
.08
16:1
3:23
.23
16:1
3:37
.37
16:1
3:51
.51
16:1
4:04
.04
16:1
4:18
.18
16:1
4:31
.31
16:1
4:45
.45
16:1
4:58
.58
16:1
5:12
.12
16:1
5:26
.26
16:1
5:40
.40
16:1
5:53
.53
16:1
6:07
.07
16:1
6:21
.21
16:1
6:35
.35
16:1
6:48
.48
16:1
7:02
.02
16:1
7:15
.15
16:1
7:28
.28
16:1
7:42
.42
16:1
7:56
.56
16:1
8:09
.09
16:1
8:22
.22
16:1
8:36
.36
16:1
8:50
.50
16:1
9:03
.03
16:1
9:17
.17
16:1
9:31
.31
16:1
9:45
.45
16:2
0:00
.00
16:2
0:13
.13
16:2
0:27
.27
16:2
0:41
.41
16:2
0:54
.54
16:2
1:08
.08
16:2
1:21
.21
16:2
1:36
.36
16:2
1:51
.51
16:2
2:05
.05
Soun
d Pr
essu
re L
evel
(d
B RM
S)
Time
Background Underwater Sound Level500 m from Site
Depth 1 m
90
95
100
105
110
115
120
20 25
31.5 40 50 63 80 100
125
160
200
250
315
400
500
630
800
1000
1250
1600
2000
2500
3150
4000
5000
6300
8000
1000
0
1250
0
1600
0
2000
0
2500
0
3150
0
4000
0
Soun
d Pr
essu
re L
evel
(d
B RM
S)
1/3rd-Octave Band Center (Hz)
Frequency Distribution500 m from Site
Depth 1 m
Crowley Kotzebue Dock Replacement - Hydroacoustic Monitoring Report July 2021
A-7
Figure A- 8. Background Sound Pressure Levels, 1/3rd-octave Band Frequency Distribution and PSD plots.
516m from Construction Site. Hydrophone Depth – 1m September 12, 2020
90100110120130140150160170180190
18:0
5:53
.53
18:0
6:06
.06
18:0
6:18
.18
18:0
6:32
.32
18:0
6:44
.44
18:0
6:56
.56
18:0
7:09
.09
18:0
7:22
.22
18:0
7:35
.35
18:0
7:47
.47
18:0
8:00
.00
18:0
8:12
.12
18:0
8:25
.25
18:0
8:38
.38
18:0
8:50
.50
18:0
9:03
.03
18:0
9:15
.15
18:0
9:28
.28
18:0
9:40
.40
18:0
9:53
.53
18:1
0:06
.06
18:1
0:19
.19
18:1
0:32
.32
18:1
0:44
.44
18:1
0:57
.57
18:1
1:09
.09
18:1
1:23
.23
18:1
1:36
.36
18:1
1:48
.48
18:1
2:00
.00
18:1
2:13
.13
18:1
2:25
.25
18:1
2:38
.38
18:1
2:51
.51
18:1
3:04
.04
18:1
3:16
.16
18:1
3:29
.29
18:1
3:41
.41
18:1
3:54
.54
18:1
4:06
.06
18:1
4:18
.18
18:1
4:31
.31
18:1
4:43
.43
18:1
4:56
.56
Soun
d Pr
essu
re L
evel
(d
B RM
S)
Time
Background Underwater Sound Level516 m from Site
Depth 1 m
90
95
100
105
110
115
120
20 25
31.5 40 50 63 80 100
125
160
200
250
315
400
500
630
800
1000
1250
1600
2000
2500
3150
4000
5000
6300
8000
1000
0
1250
0
1600
0
2000
0
2500
0
3150
0
4000
0
Soun
d Pr
essu
re L
evel
(d
B RM
S)
1/3rd-Octave Band Center (Hz)
Frequency Distribution516 m from Site
Depth 1 m
Crowley Kotzebue Dock Replacement - Hydroacoustic Monitoring Report July 2021
A-8
Figure A- 9. Background Sound Pressure Levels, 1/3rd-octave Band Frequency Distribution and PSD plots.
1032m from Construction Site. Hydrophone Depth – 1m September 14, 2020
90100110120130140150160170180190
17:1
5:22
.22
17:1
5:33
.33
17:1
5:44
.44
17:1
5:57
.57
17:1
6:08
.08
17:1
6:18
.18
17:1
6:30
.30
17:1
6:41
.41
17:1
6:53
.53
17:1
7:04
.04
17:1
7:16
.16
17:1
7:28
.28
17:1
7:38
.38
17:1
7:50
.50
17:1
8:00
.00
17:1
8:12
.12
17:1
8:23
.23
17:1
8:35
.35
17:1
8:47
.47
17:1
8:59
.59
17:1
9:10
.10
17:1
9:21
.21
17:1
9:32
.32
17:1
9:43
.43
17:1
9:55
.55
17:2
0:06
.06
17:2
0:17
.17
17:2
0:29
.29
17:2
0:40
.40
17:2
0:51
.51
17:2
1:00
.00
17:2
1:12
.12
17:2
1:24
.24
17:2
1:35
.35
17:2
1:46
.46
17:2
1:58
.58
17:2
2:11
.11
17:2
2:22
.22
17:2
2:33
.33
17:2
2:45
.45
17:2
2:57
.57
17:2
3:09
.09
17:2
3:20
.20
Soun
d Pr
essu
re L
evel
(d
B RM
S)
Time
Background Underwater Sound Level1032 m from Site
Depth 1 m
90
95
100
105
110
115
120
125
130
20 25
31.5 40 50 63 80 100
125
160
200
250
315
400
500
630
800
1000
1250
1600
2000
2500
3150
4000
5000
6300
8000
1000
0
1250
0
1600
0
2000
0
2500
0
3150
0
4000
0
Soun
d Pr
essu
re L
evel
(d
B RM
S)
1/3rd-Octave Band Center (Hz)
Frequency Distribution1032 m from Site
Depth 1 m
Crowley Kotzebue Dock Replacement - Hydroacoustic Monitoring Report July 2021
A-9
Figure A- 10. Background Sound Pressure Levels, 1/3rd-octave Band Frequency Distribution and PSD plots.
1029m from Construction Site. Hydrophone Depth – 1m September 14, 2020
90100110120130140150160170180190
17:2
5:04
.04
17:2
5:18
.18
17:2
5:32
.32
17:2
5:45
.45
17:2
5:59
.59
17:2
6:13
.13
17:2
6:27
.27
17:2
6:40
.40
17:2
6:53
.53
17:2
7:07
.07
17:2
7:20
.20
17:2
7:34
.34
17:2
7:48
.48
17:2
8:03
.03
17:2
8:17
.17
17:2
8:31
.31
17:2
8:45
.45
17:2
8:58
.58
17:2
9:12
.12
17:2
9:27
.27
17:2
9:40
.40
17:2
9:54
.54
17:3
0:07
.07
17:3
0:21
.21
17:3
0:36
.36
17:3
0:48
.48
17:3
1:02
.02
17:3
1:15
.15
17:3
1:29
.29
17:3
1:42
.42
17:3
1:56
.56
17:3
2:09
.09
17:3
2:23
.23
17:3
2:37
.37
17:3
2:51
.51
17:3
3:05
.05
17:3
3:19
.19
17:3
3:33
.33
17:3
3:46
.46
17:3
3:59
.59
17:3
4:13
.13
17:3
4:27
.27
17:3
4:41
.41
17:3
4:54
.54
Soun
d Pr
essu
re L
evel
(d
B RM
S)
Time
Background Underwater Sound Level1029 m from Site
Depth 1 m
80
85
90
95
100
105
110
115
120
20 25
31.5 40 50 63 80 100
125
160
200
250
315
400
500
630
800
1000
1250
1600
2000
2500
3150
4000
5000
6300
8000
1000
0
1250
0
1600
0
2000
0
2500
0
3150
0
4000
0
Soun
d Pr
essu
re L
evel
(d
B RM
S)
1/3rd-Octave Band Center (Hz)
Frequency Distribution1029 m from Site
Depth 1 m
Crowley Kotzebue Dock Replacement - Hydroacoustic Monitoring Report July 2021
A-10
Figure A- 11. Background Sound Pressure Levels, 1/3rd-octave Band Frequency Distribution and PSD plots.
10m from Construction Site. Hydrophone Depth – 1m September 15, 2020
020406080
100120140160
08:2
1:23
.23
08:2
1:34
.34
08:2
1:45
.45
08:2
1:55
.55
08:2
2:06
.06
08:2
2:17
.17
08:2
2:28
.28
08:2
2:39
.39
08:2
2:51
.51
08:2
3:02
.02
08:2
3:12
.12
08:2
3:23
.23
08:2
3:34
.34
08:2
3:45
.45
08:2
3:56
.56
08:2
4:08
.08
08:2
4:18
.18
08:2
4:29
.29
08:2
4:39
.39
08:2
4:50
.50
08:2
5:01
.01
08:2
5:12
.12
08:2
5:23
.23
08:2
5:34
.34
08:2
5:45
.45
08:2
5:56
.56
08:2
6:07
.07
08:2
6:19
.19
08:2
6:30
.30
08:2
6:40
.40
08:2
6:50
.50
08:2
7:02
.02
08:2
7:13
.13
08:2
7:24
.24
08:2
7:34
.34
08:2
7:45
.45
08:2
7:55
.55
08:2
8:06
.06
08:2
8:16
.16
08:2
8:27
.27
08:2
8:37
.37
08:2
8:48
.48
08:2
8:59
.59
08:2
9:10
.10
Soun
d Pr
essu
re L
evel
(d
B RM
S)
Time
Background Underwater Sound Level10 m from Site
Depth 1 m
0
20
40
60
80
100
120
140
20 25
31.5 40 50 63 80 100
125
160
200
250
315
400
500
630
800
1000
1250
1600
2000
2500
3150
4000
5000
6300
8000
1000
0
1250
0
1600
0
2000
0
2500
0
3150
0
4000
0
Soun
d Pr
essu
re L
evel
(d
B RM
S)
1/3rd-Octave Band Center (Hz)
Frequency Distribution10 m from Site
Depth 1 m
Appendix B
APPENDIX B
Vibratory Pile Driving
Sound Level Time Series
1/3rd-Octave Band Frequencies Distribution
and Power Spectral Density

Crowley Kotzebue Dock Replacement - Hydroacoustic Monitoring Report July 2021
B-1
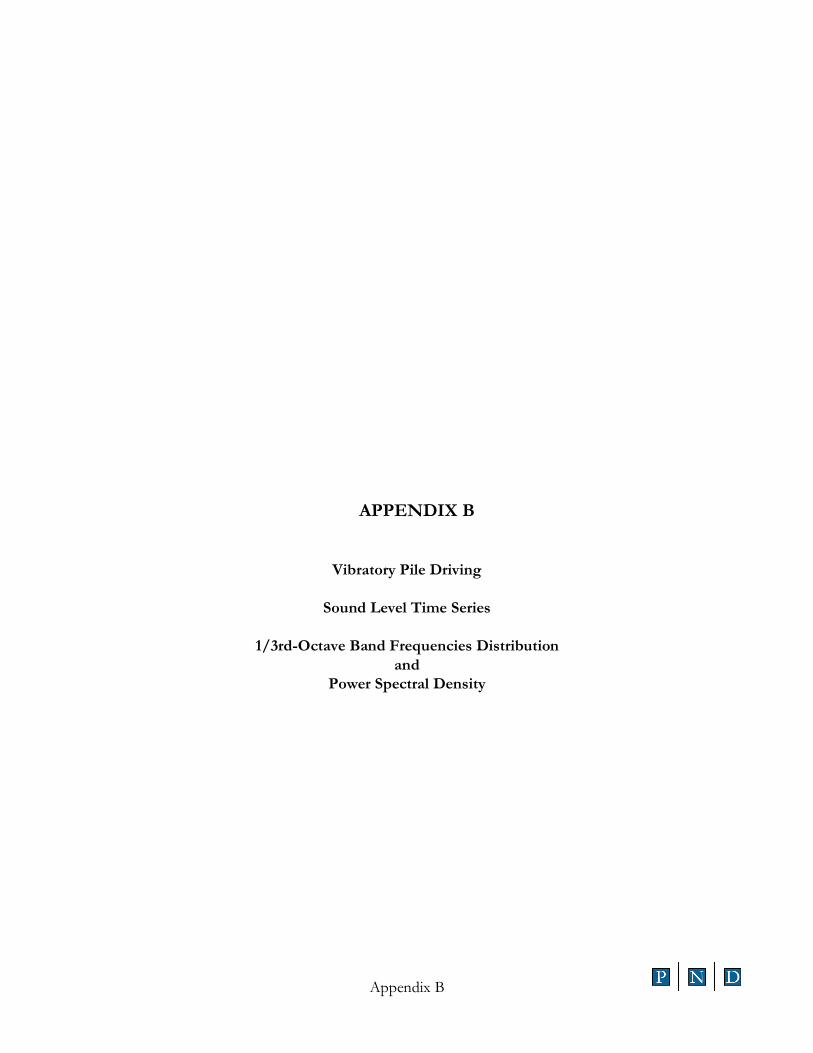
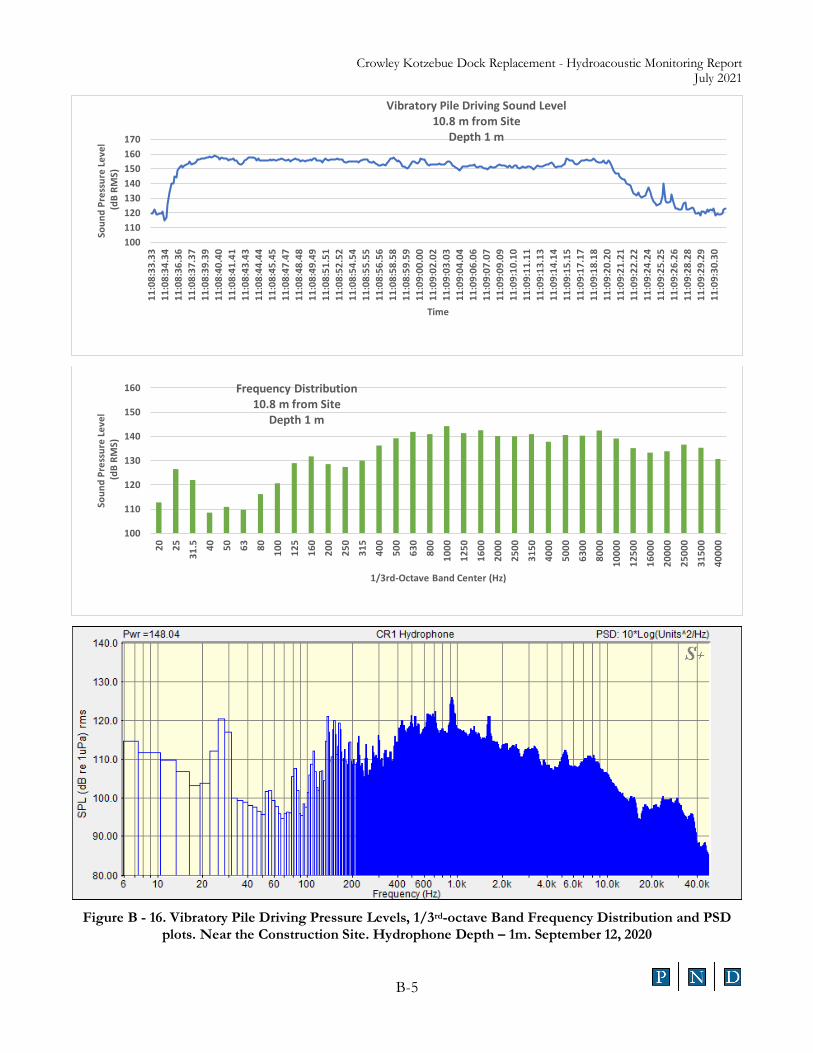
Figure B - 12. Vibratory Pile Driving Pressure Levels, 1/3rd-octave Band Frequency Distribution and PSD
plots. Near the Construction Site. Hydrophone Depth – 1m. September 12, 2020
100
110
120
130
140
150
160
17009
:38:
05.0
509
:38:
07.0
709
:38:
09.0
909
:38:
10.1
009
:38:
12.1
209
:38:
14.1
409
:38:
16.1
609
:38:
18.1
809
:38:
20.2
009
:38:
22.2
209
:38:
24.2
409
:38:
25.2
509
:38:
27.2
709
:38:
29.2
909
:38:
31.3
109
:38:
33.3
309
:38:
35.3
509
:38:
37.3
709
:38:
39.3
909
:38:
41.4
109
:38:
42.4
209
:38:
44.4
409
:38:
46.4
609
:38:
48.4
809
:38:
50.5
009
:38:
52.5
209
:38:
54.5
409
:38:
56.5
609
:38:
57.5
709
:38:
59.5
909
:39:
01.0
109
:39:
03.0
309
:39:
05.0
509
:39:
07.0
709
:39:
09.0
909
:39:
11.1
109
:39:
12.1
209
:39:
14.1
409
:39:
16.1
609
:39:
18.1
809
:39:
20.2
009
:39:
22.2
209
:39:
24.2
409
:39:
26.2
6
Soun
d Pr
essu
re L
evel
(d
B RM
S)
Time
Vibratory Pile DrivingSound Level
10.9 m from SiteDepth 1 m
100
110
120
130
140
150
160
20 25
31.5 40 50 63 80 100
125
160
200
250
315
400
500
630
800
1000
1250
1600
2000
2500
3150
4000
5000
6300
8000
1000
0
1250
0
1600
0
2000
0
2500
0
3150
0
4000
0
Soun
d Pr
essu
re L
evel
(dB
RMS)
1/3rd-Octave Band Center (Hz)
Frequency Distribution10.9 m from Site
Depth 1 m
Crowley Kotzebue Dock Replacement - Hydroacoustic Monitoring Report July 2021
B-2
Figure B - 13. Vibratory Pile Driving Pressure Levels, 1/3rd-octave Band Frequency Distribution and PSD
plots. Near the Construction Site. Hydrophone Depth – 1m. September 12, 2020
100
110
120
130
140
150
160
170
09:5
1:07
.07
09:5
1:09
.09
09:5
1:12
.12
09:5
1:14
.14
09:5
1:16
.16
09:5
1:18
.18
09:5
1:21
.21
09:5
1:23
.23
09:5
1:25
.25
09:5
1:27
.27
09:5
1:29
.29
09:5
1:32
.32
09:5
1:34
.34
09:5
1:36
.36
09:5
1:38
.38
09:5
1:40
.40
09:5
1:43
.43
09:5
1:45
.45
09:5
1:47
.47
09:5
1:49
.49
09:5
1:52
.52
09:5
1:54
.54
09:5
1:56
.56
09:5
1:58
.58
09:5
2:00
.00
09:5
2:03
.03
09:5
2:05
.05
09:5
2:07
.07
09:5
2:09
.09
09:5
2:12
.12
09:5
2:14
.14
09:5
2:16
.16
09:5
2:18
.18
09:5
2:20
.20
09:5
2:23
.23
09:5
2:25
.25
09:5
2:27
.27
09:5
2:29
.29
09:5
2:32
.32
09:5
2:34
.34
09:5
2:36
.36
09:5
2:38
.38
Soun
d Pr
essu
re L
evel
(dB
RMS)
Time
Vibratory Pile DrivingSound Level
9.5 m from SiteDepth 1 m
100
110
120
130
140
150
160
20 25
31.5 40 50 63 80 100
125
160
200
250
315
400
500
630
800
1000
1250
1600
2000
2500
3150
4000
5000
6300
8000
1000
0
1250
0
1600
0
2000
0
2500
0
3150
0
4000
0
Soun
d Pr
essu
re L
evel
(dB
RMS)
1/3rd-Octave Band Center (Hz)
Frequency Distribution9.5 m from Site
Depth 1 m
Crowley Kotzebue Dock Replacement - Hydroacoustic Monitoring Report July 2021
B-3
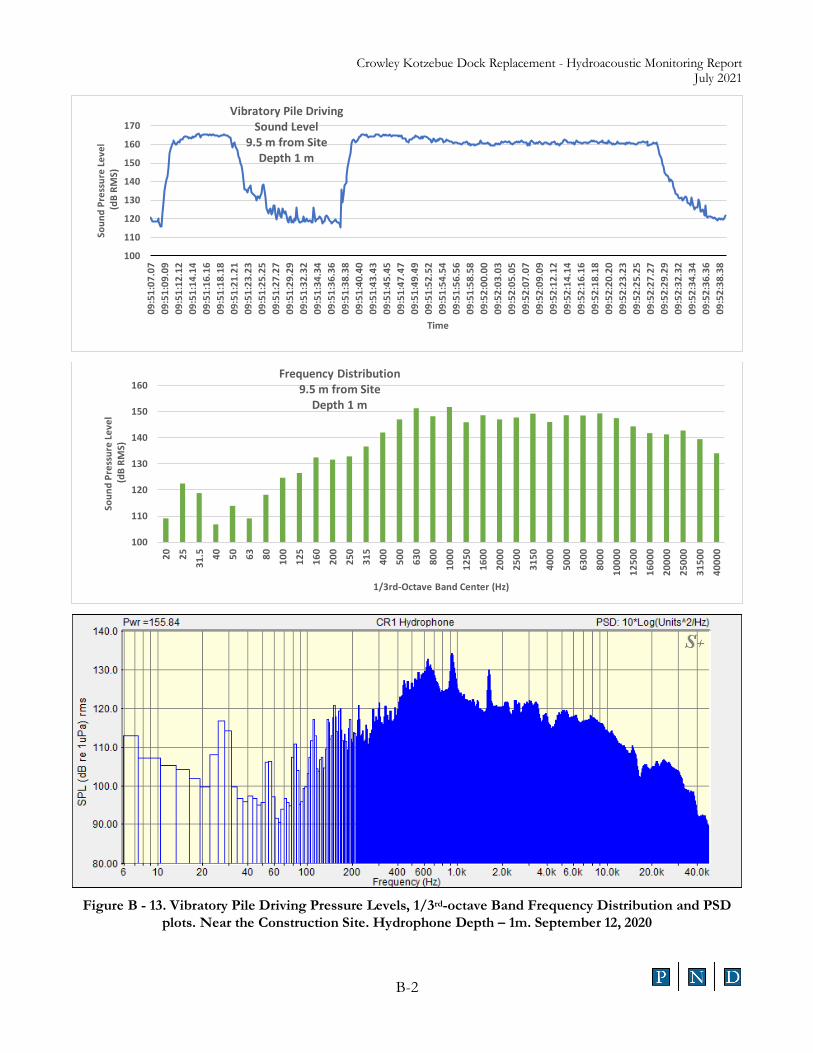
Figure B - 14. Vibratory Pile Driving Pressure Levels, 1/3rd-octave Band Frequency Distribution and PSD
plots. Near the Construction Site. Hydrophone Depth – 1m. September 12, 2020
100110120130140150160170
10:4
0:44
.44
10:4
0:47
.47
10:4
0:50
.50
10:4
0:53
.53
10:4
0:56
.56
10:4
0:59
.59
10:4
1:02
.02
10:4
1:05
.05
10:4
1:08
.08
10:4
1:11
.11
10:4
1:14
.14
10:4
1:17
.17
10:4
1:21
.21
10:4
1:24
.24
10:4
1:27
.27
10:4
1:30
.30
10:4
1:33
.33
10:4
1:36
.36
10:4
1:39
.39
10:4
1:42
.42
10:4
1:45
.45
10:4
1:48
.48
10:4
1:51
.51
10:4
1:54
.54
10:4
1:57
.57
10:4
2:00
.00
10:4
2:04
.04
10:4
2:07
.07
10:4
2:10
.10
10:4
2:13
.13
10:4
2:16
.16
10:4
2:19
.19
10:4
2:22
.22
10:4
2:25
.25
10:4
2:28
.28
10:4
2:31
.31
10:4
2:34
.34
10:4
2:37
.37
10:4
2:40
.40
10:4
2:44
.44
10:4
2:47
.47
10:4
2:50
.50
Soun
d Pr
essu
re L
evel
(dB
RMS)
Time
Vibratory Pile Driving Sound Level
12.2 m from SiteDepth 1 m
100
110
120
130
140
150
160
20 25
31.5 40 50 63 80 100
125
160
200
250
315
400
500
630
800
1000
1250
1600
2000
2500
3150
4000
5000
6300
8000
1000
0
1250
0
1600
0
2000
0
2500
0
3150
0
4000
0
Soun
d Pr
essu
re L
evel
(dB
RMS)
1/3rd-Octave Band Center (Hz)
Frequency Distribution12.2 m from Site
Depth 1 m
Crowley Kotzebue Dock Replacement - Hydroacoustic Monitoring Report July 2021
B-4
Figure B - 15. Vibratory Pile Driving Pressure Levels, 1/3rd-octave Band Frequency Distribution and PSD
plots. Near the Construction Site. Hydrophone Depth – 1m. September 12, 2020
100
110
120
130
140
150
160
170
10:5
3:07
.07
10:5
3:10
.10
10:5
3:12
.12
10:5
3:14
.14
10:5
3:17
.17
10:5
3:19
.19
10:5
3:22
.22
10:5
3:24
.24
10:5
3:26
.26
10:5
3:29
.29
10:5
3:31
.31
10:5
3:34
.34
10:5
3:36
.36
10:5
3:38
.38
10:5
3:41
.41
10:5
3:43
.43
10:5
3:46
.46
10:5
3:48
.48
10:5
3:50
.50
10:5
3:53
.53
10:5
3:55
.55
10:5
3:57
.57
10:5
4:00
.00
10:5
4:02
.02
10:5
4:05
.05
10:5
4:07
.07
10:5
4:09
.09
10:5
4:12
.12
10:5
4:14
.14
10:5
4:17
.17
10:5
4:19
.19
10:5
4:21
.21
10:5
4:24
.24
10:5
4:26
.26
10:5
4:29
.29
10:5
4:31
.31
10:5
4:33
.33
10:5
4:36
.36
10:5
4:38
.38
10:5
4:41
.41
10:5
4:43
.43
10:5
4:45
.45
10:5
4:48
.48
10:5
4:50
.50
Soun
d Pr
essu
re L
evel
(dB
RMS)
Time
Vibratory Pile Driving Sound Level
11.5 m from SiteDepth 1 m
100
110
120
130
140
150
160
20 25
31.5 40 50 63 80 100
125
160
200
250
315
400
500
630
800
1000
1250
1600
2000
2500
3150
4000
5000
6300
8000
1000
0
1250
0
1600
0
2000
0
2500
0
3150
0
4000
0
Soun
d Pr
essu
re L
evel
(dB
RMS)
1/3rd-Octave Band Center (Hz)
Frequency Distribution11.5 m from Site
Depth 1 m
Crowley Kotzebue Dock Replacement - Hydroacoustic Monitoring Report July 2021
B-5
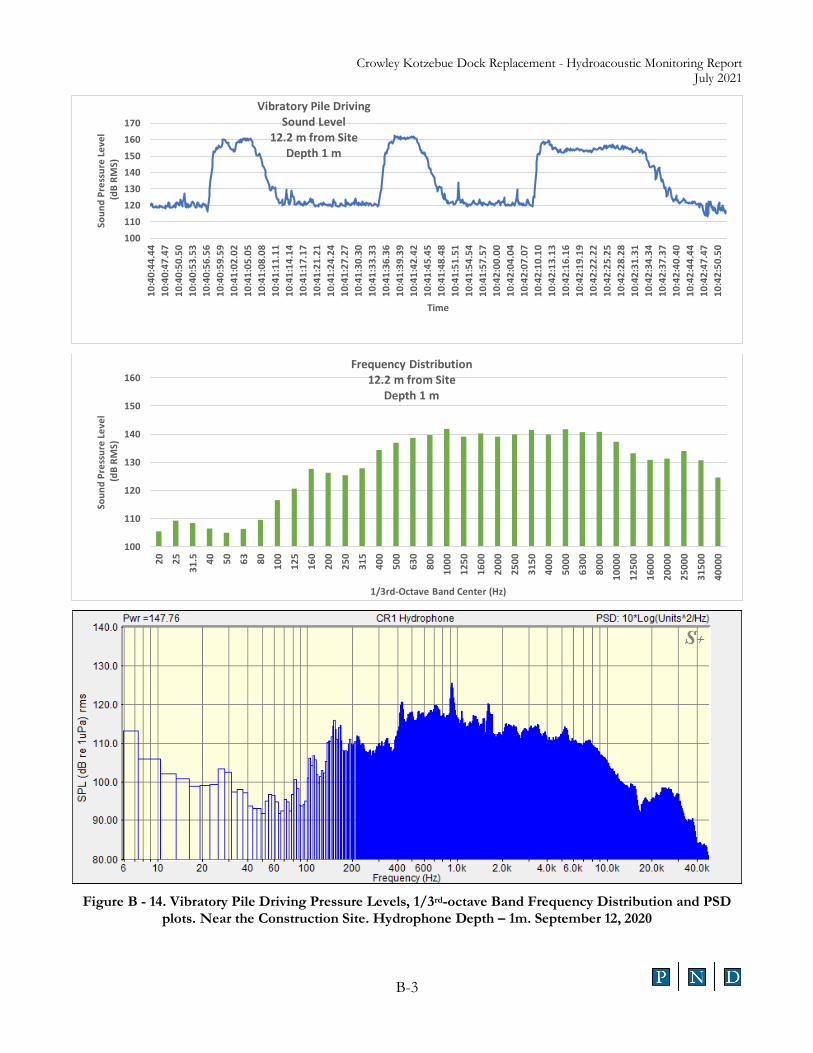
Figure B - 16. Vibratory Pile Driving Pressure Levels, 1/3rd-octave Band Frequency Distribution and PSD
plots. Near the Construction Site. Hydrophone Depth – 1m. September 12, 2020
100110120130140150160170
11:0
8:33
.33
11:0
8:34
.34
11:0
8:36
.36
11:0
8:37
.37
11:0
8:39
.39
11:0
8:40
.40
11:0
8:41
.41
11:0
8:43
.43
11:0
8:44
.44
11:0
8:45
.45
11:0
8:47
.47
11:0
8:48
.48
11:0
8:49
.49
11:0
8:51
.51
11:0
8:52
.52
11:0
8:54
.54
11:0
8:55
.55
11:0
8:56
.56
11:0
8:58
.58
11:0
8:59
.59
11:0
9:00
.00
11:0
9:02
.02
11:0
9:03
.03
11:0
9:04
.04
11:0
9:06
.06
11:0
9:07
.07
11:0
9:09
.09
11:0
9:10
.10
11:0
9:11
.11
11:0
9:13
.13
11:0
9:14
.14
11:0
9:15
.15
11:0
9:17
.17
11:0
9:18
.18
11:0
9:20
.20
11:0
9:21
.21
11:0
9:22
.22
11:0
9:24
.24
11:0
9:25
.25
11:0
9:26
.26
11:0
9:28
.28
11:0
9:29
.29
11:0
9:30
.30
Soun
d Pr
essu
re L
evel
(dB
RMS)
Time
Vibratory Pile Driving Sound Level10.8 m from Site
Depth 1 m
100
110
120
130
140
150
160
20 25
31.5 40 50 63 80 100
125
160
200
250
315
400
500
630
800
1000
1250
1600
2000
2500
3150
4000
5000
6300
8000
1000
0
1250
0
1600
0
2000
0
2500
0
3150
0
4000
0
Soun
d Pr
essu
re L
evel
(dB
RMS)
1/3rd-Octave Band Center (Hz)
Frequency Distribution10.8 m from Site
Depth 1 m
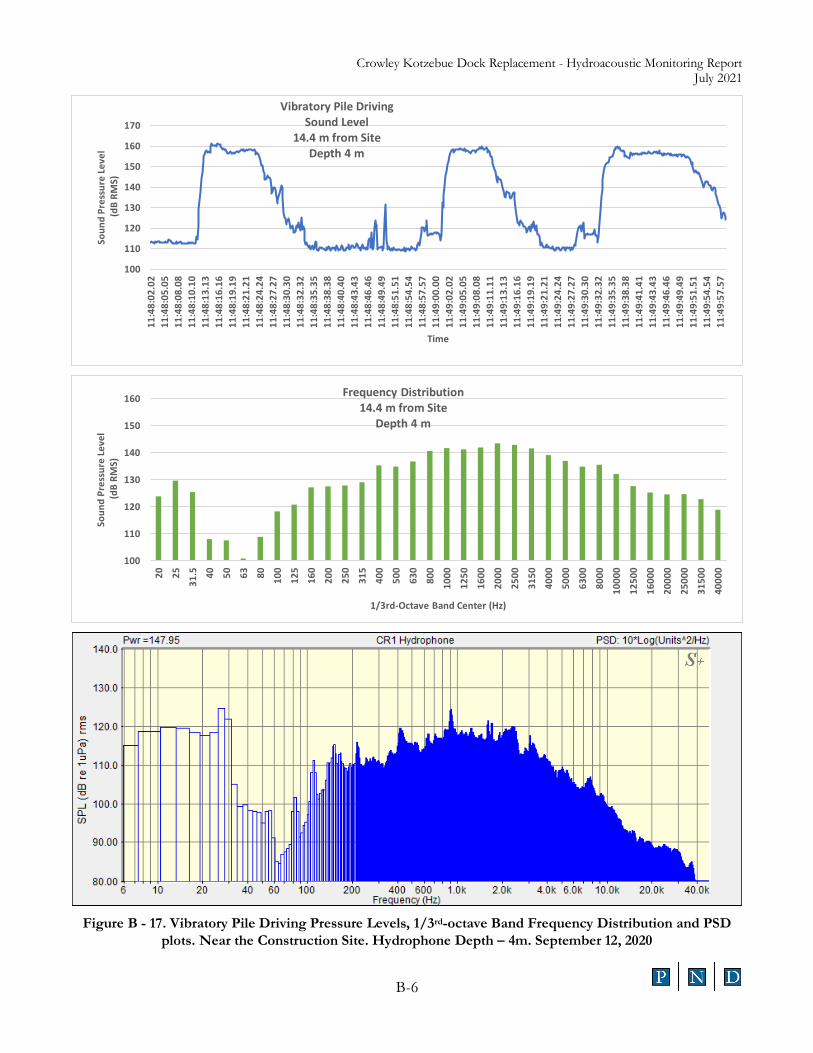
Crowley Kotzebue Dock Replacement - Hydroacoustic Monitoring Report July 2021
B-6
Figure B - 17. Vibratory Pile Driving Pressure Levels, 1/3rd-octave Band Frequency Distribution and PSD
plots. Near the Construction Site. Hydrophone Depth – 4m. September 12, 2020
100
110
120
130
140
150
160
170
11:4
8:02
.02
11:4
8:05
.05
11:4
8:08
.08
11:4
8:10
.10
11:4
8:13
.13
11:4
8:16
.16
11:4
8:19
.19
11:4
8:21
.21
11:4
8:24
.24
11:4
8:27
.27
11:4
8:30
.30
11:4
8:32
.32
11:4
8:35
.35
11:4
8:38
.38
11:4
8:40
.40
11:4
8:43
.43
11:4
8:46
.46
11:4
8:49
.49
11:4
8:51
.51
11:4
8:54
.54
11:4
8:57
.57
11:4
9:00
.00
11:4
9:02
.02
11:4
9:05
.05
11:4
9:08
.08
11:4
9:11
.11
11:4
9:13
.13
11:4
9:16
.16
11:4
9:19
.19
11:4
9:21
.21
11:4
9:24
.24
11:4
9:27
.27
11:4
9:30
.30
11:4
9:32
.32
11:4
9:35
.35
11:4
9:38
.38
11:4
9:41
.41
11:4
9:43
.43
11:4
9:46
.46
11:4
9:49
.49
11:4
9:51
.51
11:4
9:54
.54
11:4
9:57
.57
Soun
d Pr
essu
re L
evel
(dB
RMS)
Time
Vibratory Pile Driving Sound Level
14.4 m from SiteDepth 4 m
100
110
120
130
140
150
160
20 25
31.5 40 50 63 80 100
125
160
200
250
315
400
500
630
800
1000
1250
1600
2000
2500
3150
4000
5000
6300
8000
1000
0
1250
0
1600
0
2000
0
2500
0
3150
0
4000
0
Soun
d Pr
essu
re L
evel
(dB
RMS)
1/3rd-Octave Band Center (Hz)
Frequency Distribution14.4 m from Site
Depth 4 m
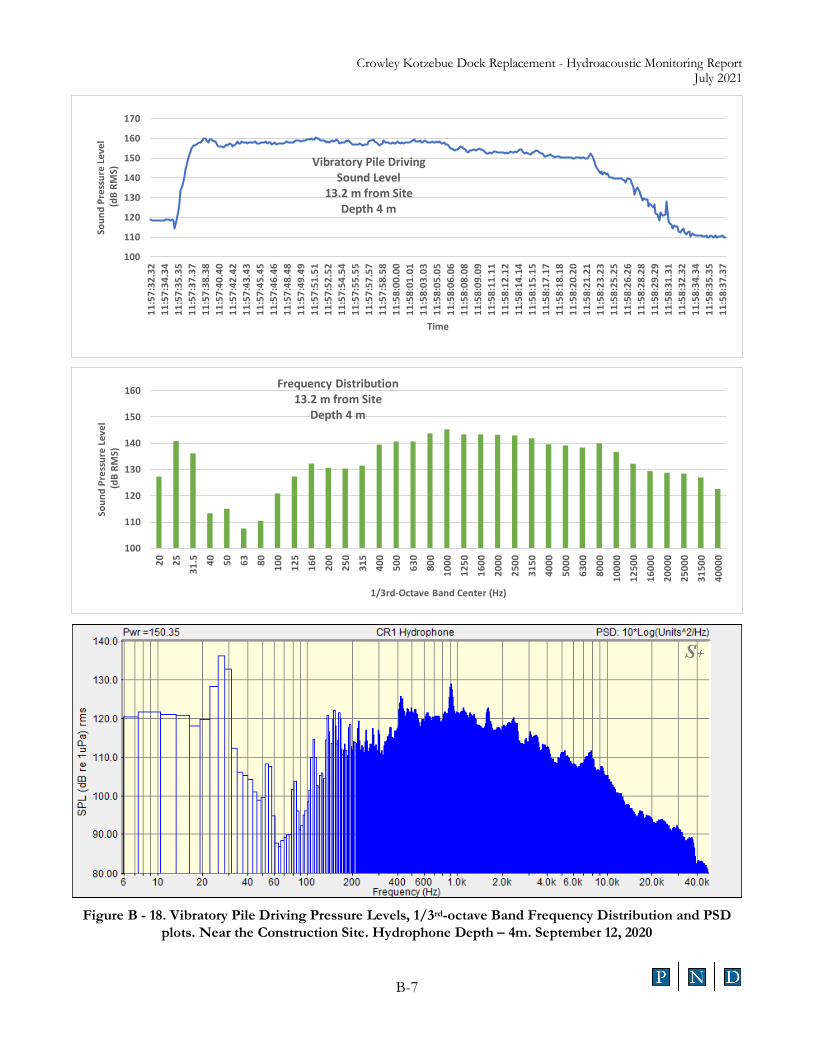
Crowley Kotzebue Dock Replacement - Hydroacoustic Monitoring Report July 2021
B-7
Figure B - 18. Vibratory Pile Driving Pressure Levels, 1/3rd-octave Band Frequency Distribution and PSD
plots. Near the Construction Site. Hydrophone Depth – 4m. September 12, 2020
100
110
120
130
140
150
160
170
11:5
7:32
.32
11:5
7:34
.34
11:5
7:35
.35
11:5
7:37
.37
11:5
7:38
.38
11:5
7:40
.40
11:5
7:42
.42
11:5
7:43
.43
11:5
7:45
.45
11:5
7:46
.46
11:5
7:48
.48
11:5
7:49
.49
11:5
7:51
.51
11:5
7:52
.52
11:5
7:54
.54
11:5
7:55
.55
11:5
7:57
.57
11:5
7:58
.58
11:5
8:00
.00
11:5
8:01
.01
11:5
8:03
.03
11:5
8:05
.05
11:5
8:06
.06
11:5
8:08
.08
11:5
8:09
.09
11:5
8:11
.11
11:5
8:12
.12
11:5
8:14
.14
11:5
8:15
.15
11:5
8:17
.17
11:5
8:18
.18
11:5
8:20
.20
11:5
8:21
.21
11:5
8:23
.23
11:5
8:25
.25
11:5
8:26
.26
11:5
8:28
.28
11:5
8:29
.29
11:5
8:31
.31
11:5
8:32
.32
11:5
8:34
.34
11:5
8:35
.35
11:5
8:37
.37
Soun
d Pr
essu
re L
evel
(dB
RMS)
Time
Vibratory Pile Driving Sound Level
13.2 m from SiteDepth 4 m
100
110
120
130
140
150
160
20 25
31.5 40 50 63 80 100
125
160
200
250
315
400
500
630
800
1000
1250
1600
2000
2500
3150
4000
5000
6300
8000
1000
0
1250
0
1600
0
2000
0
2500
0
3150
0
4000
0
Soun
d Pr
essu
re L
evel
(dB
RMS)
1/3rd-Octave Band Center (Hz)
Frequency Distribution13.2 m from Site
Depth 4 m
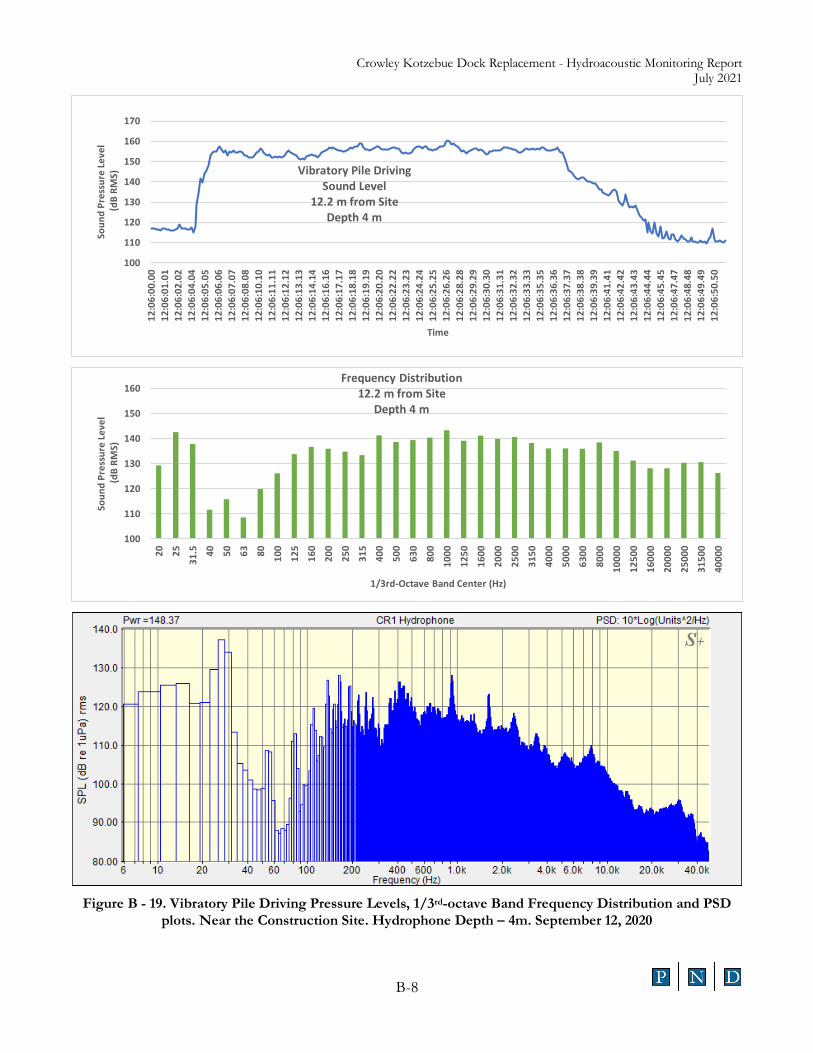
Crowley Kotzebue Dock Replacement - Hydroacoustic Monitoring Report July 2021
B-8
Figure B - 19. Vibratory Pile Driving Pressure Levels, 1/3rd-octave Band Frequency Distribution and PSD
plots. Near the Construction Site. Hydrophone Depth – 4m. September 12, 2020
100
110
120
130
140
150
160
170
12:0
6:00
.00
12:0
6:01
.01
12:0
6:02
.02
12:0
6:04
.04
12:0
6:05
.05
12:0
6:06
.06
12:0
6:07
.07
12:0
6:08
.08
12:0
6:10
.10
12:0
6:11
.11
12:0
6:12
.12
12:0
6:13
.13
12:0
6:14
.14
12:0
6:16
.16
12:0
6:17
.17
12:0
6:18
.18
12:0
6:19
.19
12:0
6:20
.20
12:0
6:22
.22
12:0
6:23
.23
12:0
6:24
.24
12:0
6:25
.25
12:0
6:26
.26
12:0
6:28
.28
12:0
6:29
.29
12:0
6:30
.30
12:0
6:31
.31
12:0
6:32
.32
12:0
6:33
.33
12:0
6:35
.35
12:0
6:36
.36
12:0
6:37
.37
12:0
6:38
.38
12:0
6:39
.39
12:0
6:41
.41
12:0
6:42
.42
12:0
6:43
.43
12:0
6:44
.44
12:0
6:45
.45
12:0
6:47
.47
12:0
6:48
.48
12:0
6:49
.49
12:0
6:50
.50
Soun
d Pr
essu
re L
evel
(dB
RMS)
Time
Vibratory Pile Driving Sound Level
12.2 m from SiteDepth 4 m
100
110
120
130
140
150
160
20 25
31.5 40 50 63 80 100
125
160
200
250
315
400
500
630
800
1000
1250
1600
2000
2500
3150
4000
5000
6300
8000
1000
0
1250
0
1600
0
2000
0
2500
0
3150
0
4000
0
Soun
d Pr
essu
re L
evel
(dB
RMS)
1/3rd-Octave Band Center (Hz)
Frequency Distribution12.2 m from Site
Depth 4 m
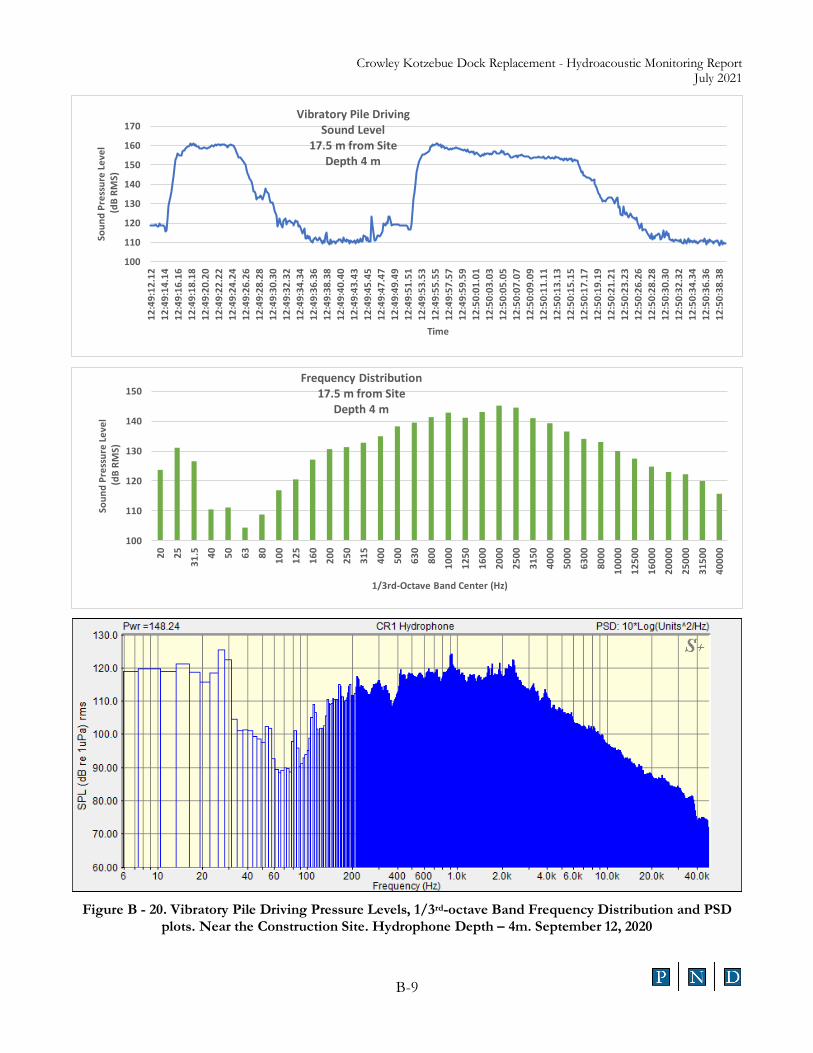
Crowley Kotzebue Dock Replacement - Hydroacoustic Monitoring Report July 2021
B-9
Figure B - 20. Vibratory Pile Driving Pressure Levels, 1/3rd-octave Band Frequency Distribution and PSD
plots. Near the Construction Site. Hydrophone Depth – 4m. September 12, 2020
100
110
120
130
140
150
160
170
12:4
9:12
.12
12:4
9:14
.14
12:4
9:16
.16
12:4
9:18
.18
12:4
9:20
.20
12:4
9:22
.22
12:4
9:24
.24
12:4
9:26
.26
12:4
9:28
.28
12:4
9:30
.30
12:4
9:32
.32
12:4
9:34
.34
12:4
9:36
.36
12:4
9:38
.38
12:4
9:40
.40
12:4
9:43
.43
12:4
9:45
.45
12:4
9:47
.47
12:4
9:49
.49
12:4
9:51
.51
12:4
9:53
.53
12:4
9:55
.55
12:4
9:57
.57
12:4
9:59
.59
12:5
0:01
.01
12:5
0:03
.03
12:5
0:05
.05
12:5
0:07
.07
12:5
0:09
.09
12:5
0:11
.11
12:5
0:13
.13
12:5
0:15
.15
12:5
0:17
.17
12:5
0:19
.19
12:5
0:21
.21
12:5
0:23
.23
12:5
0:26
.26
12:5
0:28
.28
12:5
0:30
.30
12:5
0:32
.32
12:5
0:34
.34
12:5
0:36
.36
12:5
0:38
.38
Soun
d Pr
essu
re L
evel
(dB
RMS)
Time
Vibratory Pile Driving Sound Level
17.5 m from SiteDepth 4 m
100
110
120
130
140
150
20 25
31.5 40 50 63 80 100
125
160
200
250
315
400
500
630
800
1000
1250
1600
2000
2500
3150
4000
5000
6300
8000
1000
0
1250
0
1600
0
2000
0
2500
0
3150
0
4000
0
Soun
d Pr
essu
re L
evel
(dB
RMS)
1/3rd-Octave Band Center (Hz)
Frequency Distribution17.5 m from Site
Depth 4 m

Crowley Kotzebue Dock Replacement - Hydroacoustic Monitoring Report July 2021
B-10
Figure B - 21. Vibratory Pile Driving Pressure Levels, 1/3rd-octave Band Frequency Distribution and PSD
plots. Near the Construction Site. Hydrophone Depth – 4m. September 12, 2020
100
110
120
130
140
150
160
170
12:5
7:41
.41
12:5
7:43
.43
12:5
7:44
.44
12:5
7:46
.46
12:5
7:48
.48
12:5
7:50
.50
12:5
7:52
.52
12:5
7:54
.54
12:5
7:56
.56
12:5
7:58
.58
12:5
7:59
.59
12:5
8:01
.01
12:5
8:03
.03
12:5
8:05
.05
12:5
8:07
.07
12:5
8:09
.09
12:5
8:11
.11
12:5
8:13
.13
12:5
8:15
.15
12:5
8:16
.16
12:5
8:18
.18
12:5
8:20
.20
12:5
8:22
.22
12:5
8:24
.24
12:5
8:26
.26
12:5
8:28
.28
12:5
8:30
.30
12:5
8:31
.31
12:5
8:33
.33
12:5
8:35
.35
12:5
8:37
.37
12:5
8:39
.39
12:5
8:41
.41
12:5
8:43
.43
12:5
8:45
.45
12:5
8:46
.46
12:5
8:48
.48
12:5
8:50
.50
12:5
8:52
.52
12:5
8:54
.54
12:5
8:56
.56
12:5
8:58
.58
12:5
9:00
.00
Soun
d Pr
essu
re L
evel
(dB
RMS)
Time
Vibratory Pile Driving Sound Level
15.2 m from SiteDepth 4 m
100
110
120
130
140
150
160
20 25
31.5 40 50 63 80 100
125
160
200
250
315
400
500
630
800
1000
1250
1600
2000
2500
3150
4000
5000
6300
8000
1000
0
1250
0
1600
0
2000
0
2500
0
3150
0
4000
0
Soun
d Pr
essu
re L
evel
(dB
RMS)
1/3rd-Octave Band Center (Hz)
Frequency Distribution15.2 m from Site
Depth 4 m
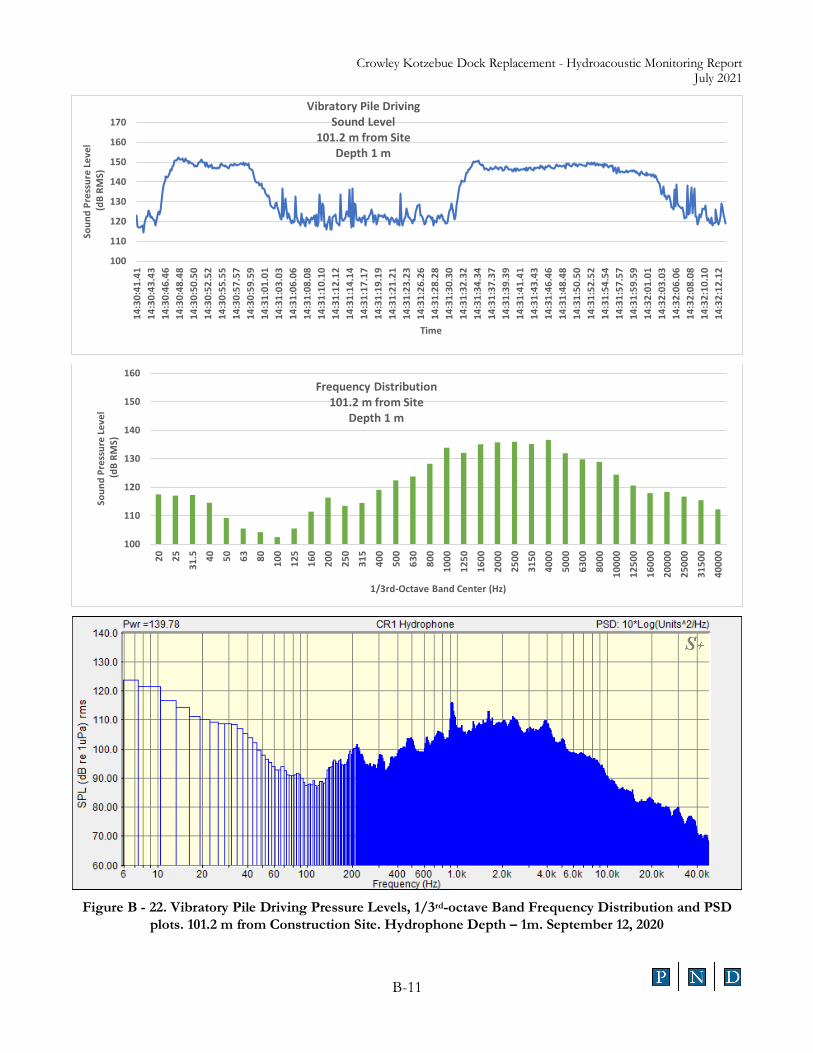
Crowley Kotzebue Dock Replacement - Hydroacoustic Monitoring Report July 2021
B-11
Figure B - 22. Vibratory Pile Driving Pressure Levels, 1/3rd-octave Band Frequency Distribution and PSD
plots. 101.2 m from Construction Site. Hydrophone Depth – 1m. September 12, 2020
100
110
120
130
140
150
160
17014
:30:
41.4
114
:30:
43.4
314
:30:
46.4
614
:30:
48.4
814
:30:
50.5
014
:30:
52.5
214
:30:
55.5
514
:30:
57.5
714
:30:
59.5
914
:31:
01.0
114
:31:
03.0
314
:31:
06.0
614
:31:
08.0
814
:31:
10.1
014
:31:
12.1
214
:31:
14.1
414
:31:
17.1
714
:31:
19.1
914
:31:
21.2
114
:31:
23.2
314
:31:
26.2
614
:31:
28.2
814
:31:
30.3
014
:31:
32.3
214
:31:
34.3
414
:31:
37.3
714
:31:
39.3
914
:31:
41.4
114
:31:
43.4
314
:31:
46.4
614
:31:
48.4
814
:31:
50.5
014
:31:
52.5
214
:31:
54.5
414
:31:
57.5
714
:31:
59.5
914
:32:
01.0
114
:32:
03.0
314
:32:
06.0
614
:32:
08.0
814
:32:
10.1
014
:32:
12.1
2
Soun
d Pr
essu
re L
evel
(dB
RMS)
Time
Vibratory Pile Driving Sound Level
101.2 m from SiteDepth 1 m
100
110
120
130
140
150
160
20 25
31.5 40 50 63 80 100
125
160
200
250
315
400
500
630
800
1000
1250
1600
2000
2500
3150
4000
5000
6300
8000
1000
0
1250
0
1600
0
2000
0
2500
0
3150
0
4000
0
Soun
d Pr
essu
re L
evel
(dB
RMS)
1/3rd-Octave Band Center (Hz)
Frequency Distribution101.2 m from Site
Depth 1 m
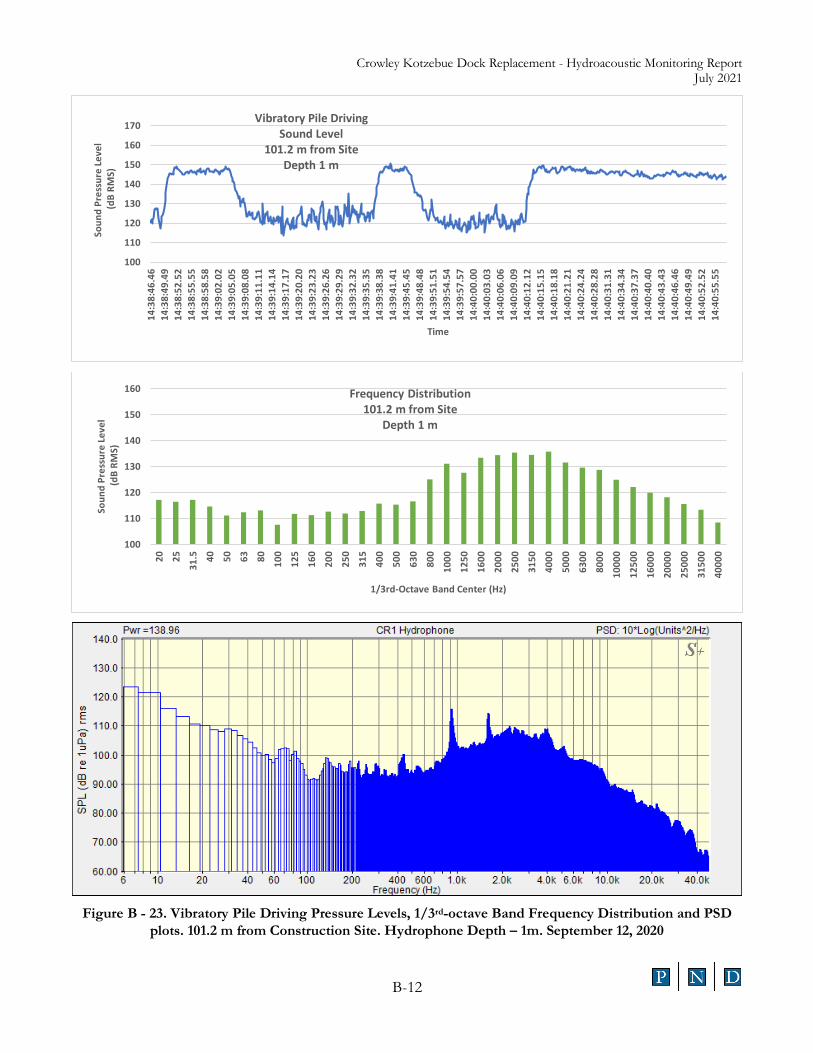
Crowley Kotzebue Dock Replacement - Hydroacoustic Monitoring Report July 2021
B-12
Figure B - 23. Vibratory Pile Driving Pressure Levels, 1/3rd-octave Band Frequency Distribution and PSD
plots. 101.2 m from Construction Site. Hydrophone Depth – 1m. September 12, 2020
100
110
120
130
140
150
160
170
14:3
8:46
.46
14:3
8:49
.49
14:3
8:52
.52
14:3
8:55
.55
14:3
8:58
.58
14:3
9:02
.02
14:3
9:05
.05
14:3
9:08
.08
14:3
9:11
.11
14:3
9:14
.14
14:3
9:17
.17
14:3
9:20
.20
14:3
9:23
.23
14:3
9:26
.26
14:3
9:29
.29
14:3
9:32
.32
14:3
9:35
.35
14:3
9:38
.38
14:3
9:41
.41
14:3
9:45
.45
14:3
9:48
.48
14:3
9:51
.51
14:3
9:54
.54
14:3
9:57
.57
14:4
0:00
.00
14:4
0:03
.03
14:4
0:06
.06
14:4
0:09
.09
14:4
0:12
.12
14:4
0:15
.15
14:4
0:18
.18
14:4
0:21
.21
14:4
0:24
.24
14:4
0:28
.28
14:4
0:31
.31
14:4
0:34
.34
14:4
0:37
.37
14:4
0:40
.40
14:4
0:43
.43
14:4
0:46
.46
14:4
0:49
.49
14:4
0:52
.52
14:4
0:55
.55
Soun
d Pr
essu
re L
evel
(dB
RMS)
Time
Vibratory Pile Driving Sound Level
101.2 m from SiteDepth 1 m
100
110
120
130
140
150
160
20 25
31.5 40 50 63 80 100
125
160
200
250
315
400
500
630
800
1000
1250
1600
2000
2500
3150
4000
5000
6300
8000
1000
0
1250
0
1600
0
2000
0
2500
0
3150
0
4000
0
Soun
d Pr
essu
re L
evel
(dB
RMS)
1/3rd-Octave Band Center (Hz)
Frequency Distribution101.2 m from Site
Depth 1 m

Crowley Kotzebue Dock Replacement - Hydroacoustic Monitoring Report July 2021
B-13
Figure B - 24. Vibratory Pile Driving Pressure Levels, 1/3rd-octave Band Frequency Distribution and PSD
plots. 105 m from Construction Site. Hydrophone Depth – 1 m September 12, 2020
100
110
120
130
140
150
160
170
14:4
8:29
.29
14:4
8:30
.30
14:4
8:31
.31
14:4
8:32
.32
14:4
8:33
.33
14:4
8:34
.34
14:4
8:35
.35
14:4
8:36
.36
14:4
8:37
.37
14:4
8:38
.38
14:4
8:39
.39
14:4
8:40
.40
14:4
8:41
.41
14:4
8:42
.42
14:4
8:43
.43
14:4
8:44
.44
14:4
8:45
.45
14:4
8:47
.47
14:4
8:48
.48
14:4
8:49
.49
14:4
8:50
.50
14:4
8:51
.51
14:4
8:52
.52
14:4
8:53
.53
14:4
8:54
.54
14:4
8:55
.55
14:4
8:56
.56
14:4
8:57
.57
14:4
8:58
.58
14:4
8:59
.59
14:4
9:00
.00
14:4
9:01
.01
14:4
9:02
.02
14:4
9:03
.03
14:4
9:04
.04
14:4
9:05
.05
14:4
9:06
.06
14:4
9:07
.07
14:4
9:08
.08
14:4
9:09
.09
14:4
9:10
.10
14:4
9:11
.11
Soun
d Pr
essu
re L
evel
(dB
RMS)
Time
Vibratory Pile Driving Sound Level 105 m from SiteDepth 1 m
100
110
120
130
140
150
160
20 25
31.5 40 50 63 80 100
125
160
200
250
315
400
500
630
800
1000
1250
1600
2000
2500
3150
4000
5000
6300
8000
1000
0
1250
0
1600
0
2000
0
2500
0
3150
0
4000
0
Soun
d Pr
essu
re L
evel
(dB
RMS)
1/3rd-Octave Band Center (Hz)
Frequency Distribution105 m from Site
Depth 1 m
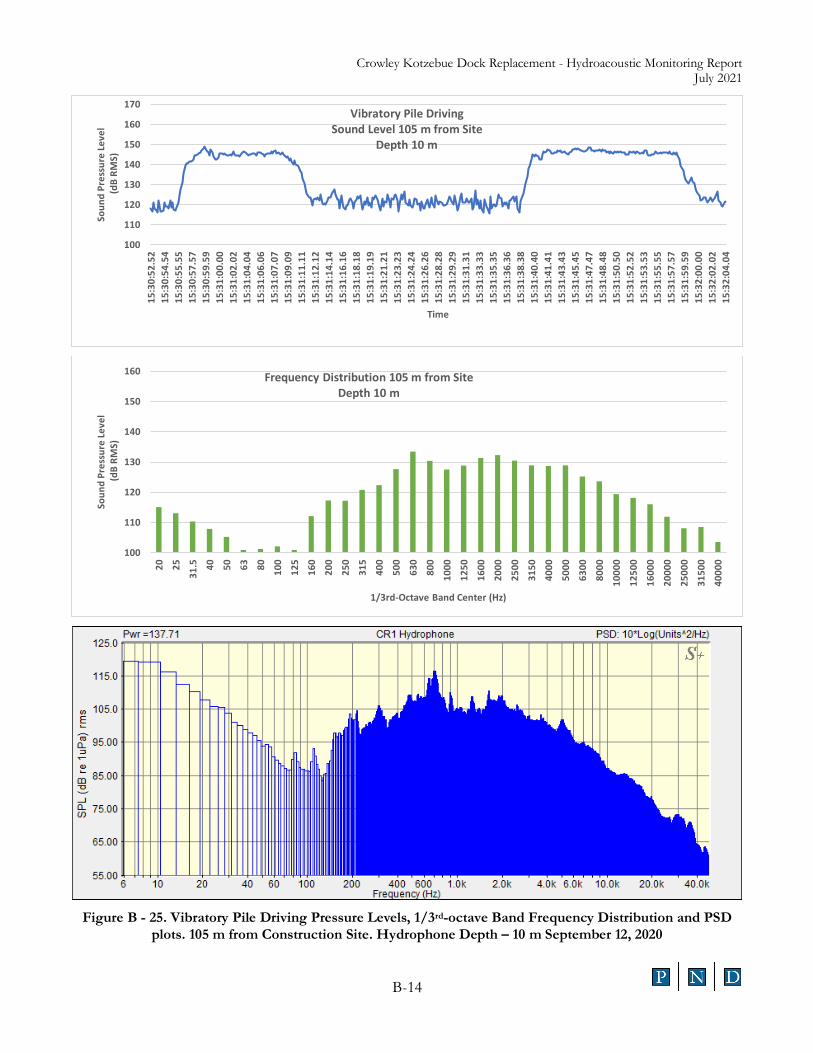
Crowley Kotzebue Dock Replacement - Hydroacoustic Monitoring Report July 2021
B-14
Figure B - 25. Vibratory Pile Driving Pressure Levels, 1/3rd-octave Band Frequency Distribution and PSD
plots. 105 m from Construction Site. Hydrophone Depth – 10 m September 12, 2020
100
110
120
130
140
150
160
170
15:3
0:52
.52
15:3
0:54
.54
15:3
0:55
.55
15:3
0:57
.57
15:3
0:59
.59
15:3
1:00
.00
15:3
1:02
.02
15:3
1:04
.04
15:3
1:06
.06
15:3
1:07
.07
15:3
1:09
.09
15:3
1:11
.11
15:3
1:12
.12
15:3
1:14
.14
15:3
1:16
.16
15:3
1:18
.18
15:3
1:19
.19
15:3
1:21
.21
15:3
1:23
.23
15:3
1:24
.24
15:3
1:26
.26
15:3
1:28
.28
15:3
1:29
.29
15:3
1:31
.31
15:3
1:33
.33
15:3
1:35
.35
15:3
1:36
.36
15:3
1:38
.38
15:3
1:40
.40
15:3
1:41
.41
15:3
1:43
.43
15:3
1:45
.45
15:3
1:47
.47
15:3
1:48
.48
15:3
1:50
.50
15:3
1:52
.52
15:3
1:53
.53
15:3
1:55
.55
15:3
1:57
.57
15:3
1:59
.59
15:3
2:00
.00
15:3
2:02
.02
15:3
2:04
.04
Soun
d Pr
essu
re L
evel
(dB
RMS)
Time
Vibratory Pile Driving Sound Level 105 m from Site
Depth 10 m
100
110
120
130
140
150
160
20 25
31.5 40 50 63 80 100
125
160
200
250
315
400
500
630
800
1000
1250
1600
2000
2500
3150
4000
5000
6300
8000
1000
0
1250
0
1600
0
2000
0
2500
0
3150
0
4000
0
Soun
d Pr
essu
re L
evel
(dB
RMS)
1/3rd-Octave Band Center (Hz)
Frequency Distribution 105 m from SiteDepth 10 m
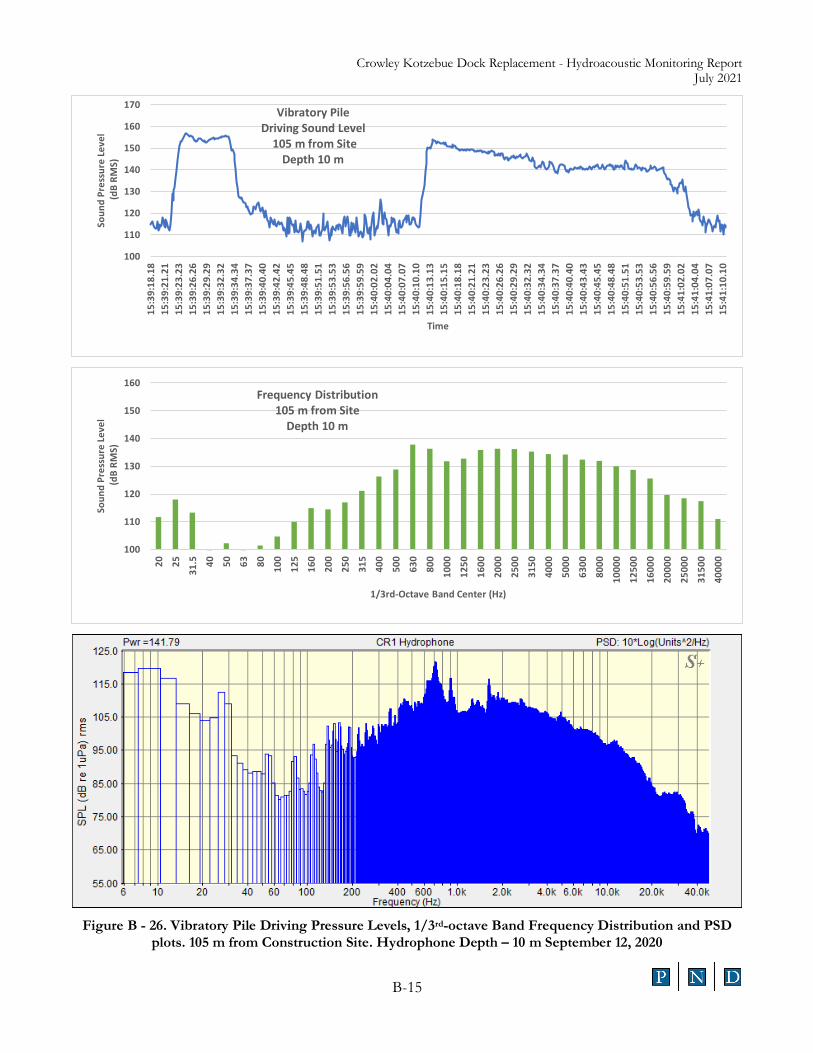
Crowley Kotzebue Dock Replacement - Hydroacoustic Monitoring Report July 2021
B-15
Figure B - 26. Vibratory Pile Driving Pressure Levels, 1/3rd-octave Band Frequency Distribution and PSD
plots. 105 m from Construction Site. Hydrophone Depth – 10 m September 12, 2020
100
110
120
130
140
150
160
170
15:3
9:18
.18
15:3
9:21
.21
15:3
9:23
.23
15:3
9:26
.26
15:3
9:29
.29
15:3
9:32
.32
15:3
9:34
.34
15:3
9:37
.37
15:3
9:40
.40
15:3
9:42
.42
15:3
9:45
.45
15:3
9:48
.48
15:3
9:51
.51
15:3
9:53
.53
15:3
9:56
.56
15:3
9:59
.59
15:4
0:02
.02
15:4
0:04
.04
15:4
0:07
.07
15:4
0:10
.10
15:4
0:13
.13
15:4
0:15
.15
15:4
0:18
.18
15:4
0:21
.21
15:4
0:23
.23
15:4
0:26
.26
15:4
0:29
.29
15:4
0:32
.32
15:4
0:34
.34
15:4
0:37
.37
15:4
0:40
.40
15:4
0:43
.43
15:4
0:45
.45
15:4
0:48
.48
15:4
0:51
.51
15:4
0:53
.53
15:4
0:56
.56
15:4
0:59
.59
15:4
1:02
.02
15:4
1:04
.04
15:4
1:07
.07
15:4
1:10
.10
Soun
d Pr
essu
re L
evel
(dB
RMS)
Time
Vibratory Pile Driving Sound Level
105 m from SiteDepth 10 m
100
110
120
130
140
150
160
20 25
31.5 40 50 63 80 100
125
160
200
250
315
400
500
630
800
1000
1250
1600
2000
2500
3150
4000
5000
6300
8000
1000
0
1250
0
1600
0
2000
0
2500
0
3150
0
4000
0
Soun
d Pr
essu
re L
evel
(dB
RMS)
1/3rd-Octave Band Center (Hz)
Frequency Distribution105 m from Site
Depth 10 m
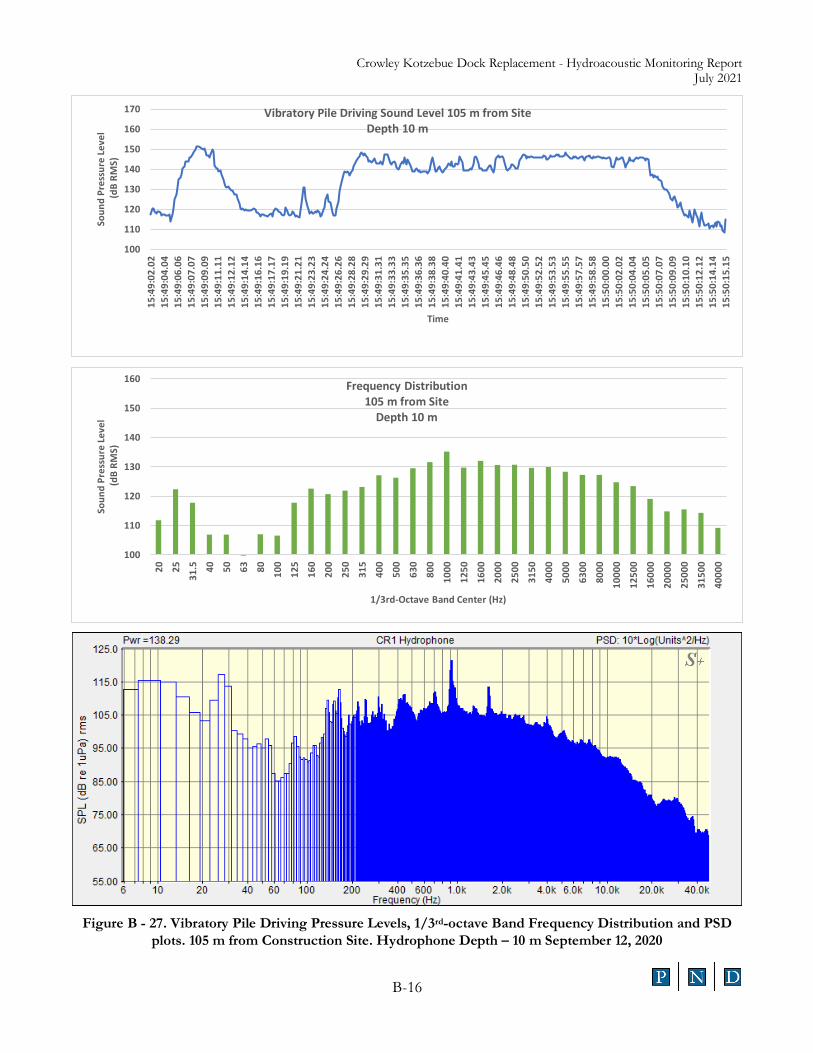
Crowley Kotzebue Dock Replacement - Hydroacoustic Monitoring Report July 2021
B-16
Figure B - 27. Vibratory Pile Driving Pressure Levels, 1/3rd-octave Band Frequency Distribution and PSD
plots. 105 m from Construction Site. Hydrophone Depth – 10 m September 12, 2020
100
110
120
130
140
150
160
170
15:4
9:02
.02
15:4
9:04
.04
15:4
9:06
.06
15:4
9:07
.07
15:4
9:09
.09
15:4
9:11
.11
15:4
9:12
.12
15:4
9:14
.14
15:4
9:16
.16
15:4
9:17
.17
15:4
9:19
.19
15:4
9:21
.21
15:4
9:23
.23
15:4
9:24
.24
15:4
9:26
.26
15:4
9:28
.28
15:4
9:29
.29
15:4
9:31
.31
15:4
9:33
.33
15:4
9:35
.35
15:4
9:36
.36
15:4
9:38
.38
15:4
9:40
.40
15:4
9:41
.41
15:4
9:43
.43
15:4
9:45
.45
15:4
9:46
.46
15:4
9:48
.48
15:4
9:50
.50
15:4
9:52
.52
15:4
9:53
.53
15:4
9:55
.55
15:4
9:57
.57
15:4
9:58
.58
15:5
0:00
.00
15:5
0:02
.02
15:5
0:04
.04
15:5
0:05
.05
15:5
0:07
.07
15:5
0:09
.09
15:5
0:10
.10
15:5
0:12
.12
15:5
0:14
.14
15:5
0:15
.15
Soun
d Pr
essu
re L
evel
(dB
RMS)
Time
Vibratory Pile Driving Sound Level 105 m from SiteDepth 10 m
100
110
120
130
140
150
160
20 25
31.5 40 50 63 80 100
125
160
200
250
315
400
500
630
800
1000
1250
1600
2000
2500
3150
4000
5000
6300
8000
1000
0
1250
0
1600
0
2000
0
2500
0
3150
0
4000
0
Soun
d Pr
essu
re L
evel
(dB
RMS)
1/3rd-Octave Band Center (Hz)
Frequency Distribution105 m from Site
Depth 10 m
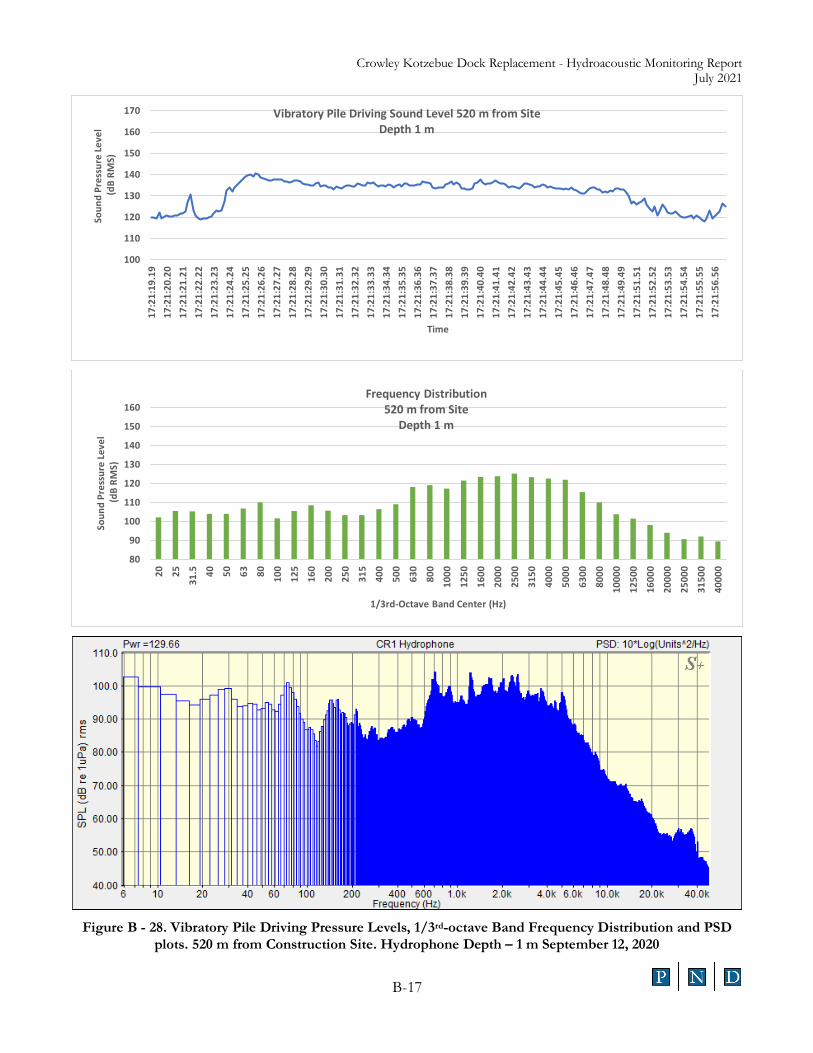
Crowley Kotzebue Dock Replacement - Hydroacoustic Monitoring Report July 2021
B-17
Figure B - 28. Vibratory Pile Driving Pressure Levels, 1/3rd-octave Band Frequency Distribution and PSD
plots. 520 m from Construction Site. Hydrophone Depth – 1 m September 12, 2020
100
110
120
130
140
150
160
170
17:2
1:19
.19
17:2
1:20
.20
17:2
1:21
.21
17:2
1:22
.22
17:2
1:23
.23
17:2
1:24
.24
17:2
1:25
.25
17:2
1:26
.26
17:2
1:27
.27
17:2
1:28
.28
17:2
1:29
.29
17:2
1:30
.30
17:2
1:31
.31
17:2
1:32
.32
17:2
1:33
.33
17:2
1:34
.34
17:2
1:35
.35
17:2
1:36
.36
17:2
1:37
.37
17:2
1:38
.38
17:2
1:39
.39
17:2
1:40
.40
17:2
1:41
.41
17:2
1:42
.42
17:2
1:43
.43
17:2
1:44
.44
17:2
1:45
.45
17:2
1:46
.46
17:2
1:47
.47
17:2
1:48
.48
17:2
1:49
.49
17:2
1:51
.51
17:2
1:52
.52
17:2
1:53
.53
17:2
1:54
.54
17:2
1:55
.55
17:2
1:56
.56
Soun
d Pr
essu
re L
evel
(dB
RMS)
Time
Vibratory Pile Driving Sound Level 520 m from SiteDepth 1 m
80
90
100
110
120
130
140
150
160
20 25
31.5 40 50 63 80 100
125
160
200
250
315
400
500
630
800
1000
1250
1600
2000
2500
3150
4000
5000
6300
8000
1000
0
1250
0
1600
0
2000
0
2500
0
3150
0
4000
0
Soun
d Pr
essu
re L
evel
(dB
RMS)
1/3rd-Octave Band Center (Hz)
Frequency Distribution520 m from Site
Depth 1 m
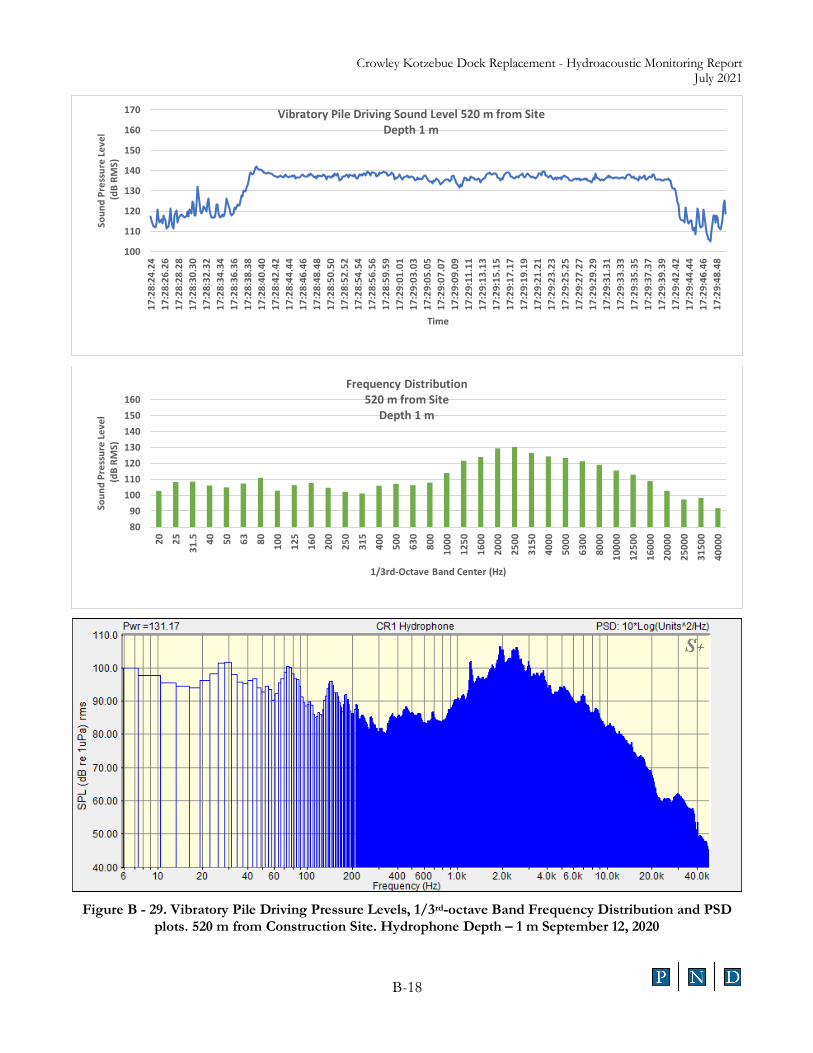
Crowley Kotzebue Dock Replacement - Hydroacoustic Monitoring Report July 2021
B-18
Figure B - 29. Vibratory Pile Driving Pressure Levels, 1/3rd-octave Band Frequency Distribution and PSD
plots. 520 m from Construction Site. Hydrophone Depth – 1 m September 12, 2020
100
110
120
130
140
150
160
170
17:2
8:24
.24
17:2
8:26
.26
17:2
8:28
.28
17:2
8:30
.30
17:2
8:32
.32
17:2
8:34
.34
17:2
8:36
.36
17:2
8:38
.38
17:2
8:40
.40
17:2
8:42
.42
17:2
8:44
.44
17:2
8:46
.46
17:2
8:48
.48
17:2
8:50
.50
17:2
8:52
.52
17:2
8:54
.54
17:2
8:56
.56
17:2
8:59
.59
17:2
9:01
.01
17:2
9:03
.03
17:2
9:05
.05
17:2
9:07
.07
17:2
9:09
.09
17:2
9:11
.11
17:2
9:13
.13
17:2
9:15
.15
17:2
9:17
.17
17:2
9:19
.19
17:2
9:21
.21
17:2
9:23
.23
17:2
9:25
.25
17:2
9:27
.27
17:2
9:29
.29
17:2
9:31
.31
17:2
9:33
.33
17:2
9:35
.35
17:2
9:37
.37
17:2
9:39
.39
17:2
9:42
.42
17:2
9:44
.44
17:2
9:46
.46
17:2
9:48
.48
Soun
d Pr
essu
re L
evel
(dB
RMS)
Time
Vibratory Pile Driving Sound Level 520 m from SiteDepth 1 m
8090
100110120130140150160
20 25
31.5 40 50 63 80 100
125
160
200
250
315
400
500
630
800
1000
1250
1600
2000
2500
3150
4000
5000
6300
8000
1000
0
1250
0
1600
0
2000
0
2500
0
3150
0
4000
0
Soun
d Pr
essu
re L
evel
(dB
RMS)
1/3rd-Octave Band Center (Hz)
Frequency Distribution520 m from Site
Depth 1 m
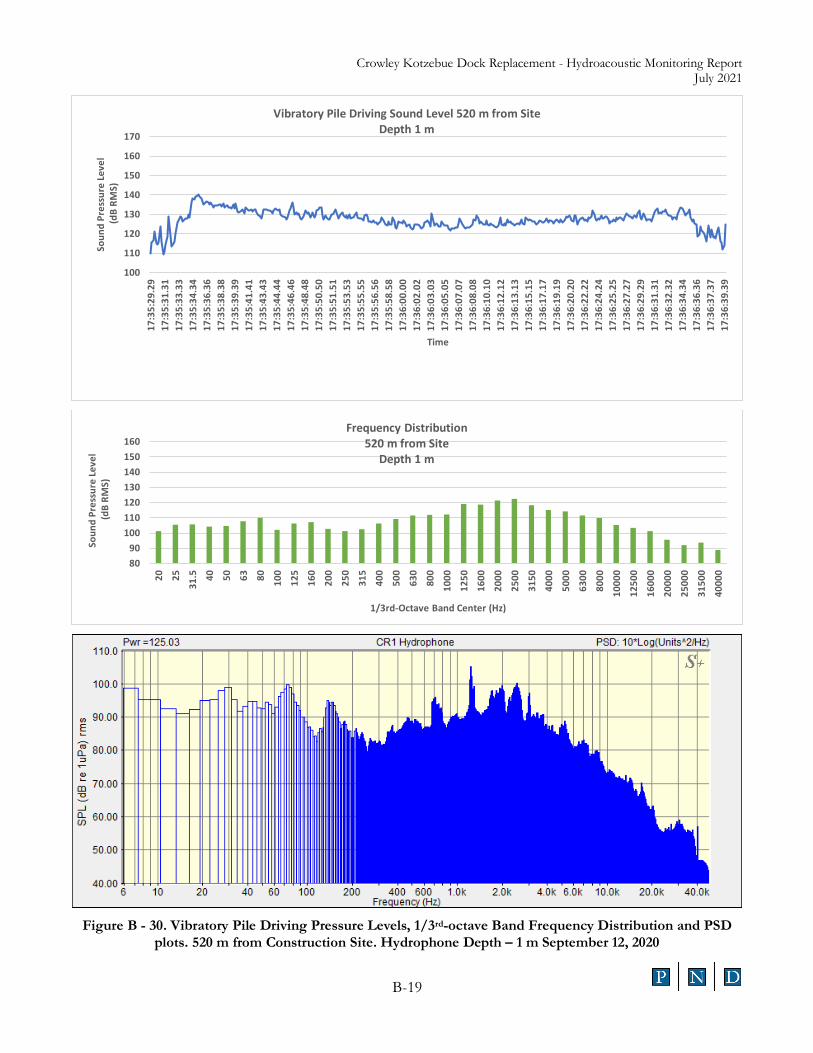
Crowley Kotzebue Dock Replacement - Hydroacoustic Monitoring Report July 2021
B-19
Figure B - 30. Vibratory Pile Driving Pressure Levels, 1/3rd-octave Band Frequency Distribution and PSD
plots. 520 m from Construction Site. Hydrophone Depth – 1 m September 12, 2020
100
110
120
130
140
150
160
17017
:35:
29.2
917
:35:
31.3
117
:35:
33.3
317
:35:
34.3
417
:35:
36.3
617
:35:
38.3
817
:35:
39.3
917
:35:
41.4
117
:35:
43.4
317
:35:
44.4
417
:35:
46.4
617
:35:
48.4
817
:35:
50.5
017
:35:
51.5
117
:35:
53.5
317
:35:
55.5
517
:35:
56.5
617
:35:
58.5
817
:36:
00.0
017
:36:
02.0
217
:36:
03.0
317
:36:
05.0
517
:36:
07.0
717
:36:
08.0
817
:36:
10.1
017
:36:
12.1
217
:36:
13.1
317
:36:
15.1
517
:36:
17.1
717
:36:
19.1
917
:36:
20.2
017
:36:
22.2
217
:36:
24.2
417
:36:
25.2
517
:36:
27.2
717
:36:
29.2
917
:36:
31.3
117
:36:
32.3
217
:36:
34.3
417
:36:
36.3
617
:36:
37.3
717
:36:
39.3
9
Soun
d Pr
essu
re L
evel
(dB
RMS)
Time
Vibratory Pile Driving Sound Level 520 m from SiteDepth 1 m
8090
100110120130140150160
20 25
31.5 40 50 63 80 100
125
160
200
250
315
400
500
630
800
1000
1250
1600
2000
2500
3150
4000
5000
6300
8000
1000
0
1250
0
1600
0
2000
0
2500
0
3150
0
4000
0
Soun
d Pr
essu
re L
evel
(dB
RMS)
1/3rd-Octave Band Center (Hz)
Frequency Distribution520 m from Site
Depth 1 m
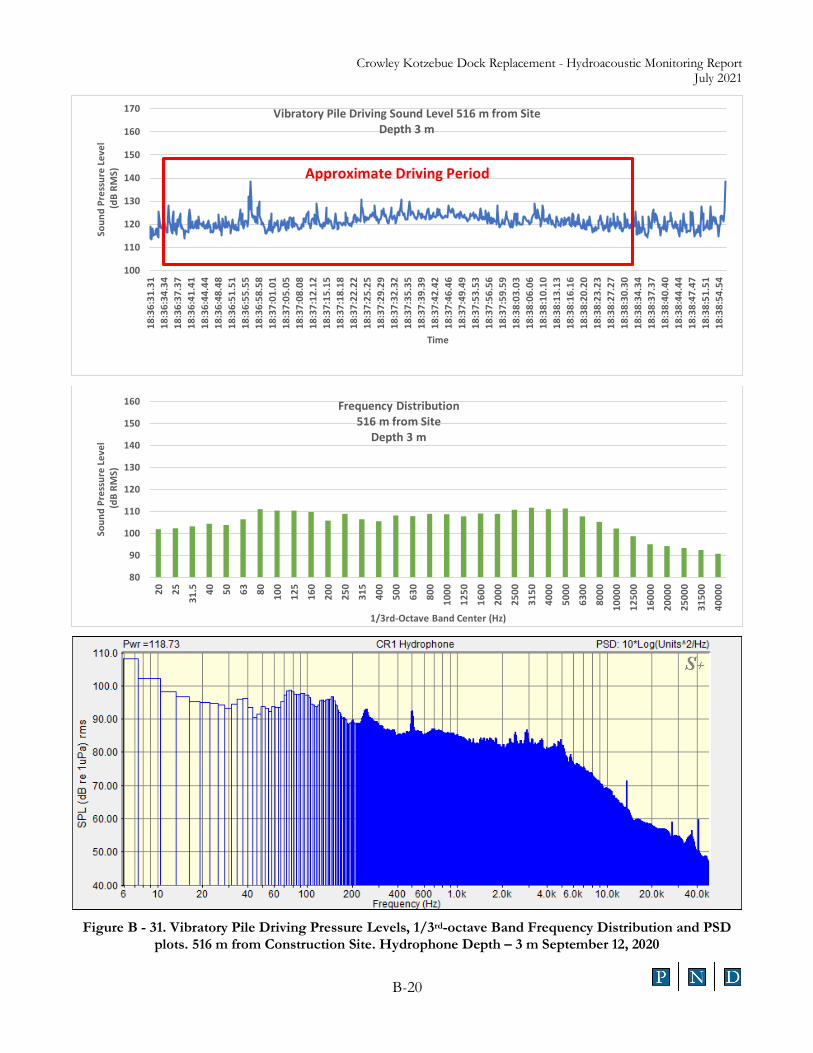
Crowley Kotzebue Dock Replacement - Hydroacoustic Monitoring Report July 2021
B-20
Figure B - 31. Vibratory Pile Driving Pressure Levels, 1/3rd-octave Band Frequency Distribution and PSD
plots. 516 m from Construction Site. Hydrophone Depth – 3 m September 12, 2020
100
110
120
130
140
150
160
170
18:3
6:31
.31
18:3
6:34
.34
18:3
6:37
.37
18:3
6:41
.41
18:3
6:44
.44
18:3
6:48
.48
18:3
6:51
.51
18:3
6:55
.55
18:3
6:58
.58
18:3
7:01
.01
18:3
7:05
.05
18:3
7:08
.08
18:3
7:12
.12
18:3
7:15
.15
18:3
7:18
.18
18:3
7:22
.22
18:3
7:25
.25
18:3
7:29
.29
18:3
7:32
.32
18:3
7:35
.35
18:3
7:39
.39
18:3
7:42
.42
18:3
7:46
.46
18:3
7:49
.49
18:3
7:53
.53
18:3
7:56
.56
18:3
7:59
.59
18:3
8:03
.03
18:3
8:06
.06
18:3
8:10
.10
18:3
8:13
.13
18:3
8:16
.16
18:3
8:20
.20
18:3
8:23
.23
18:3
8:27
.27
18:3
8:30
.30
18:3
8:34
.34
18:3
8:37
.37
18:3
8:40
.40
18:3
8:44
.44
18:3
8:47
.47
18:3
8:51
.51
18:3
8:54
.54
Soun
d Pr
essu
re L
evel
(dB
RMS)
Time
Vibratory Pile Driving Sound Level 516 m from SiteDepth 3 m
Approximate Driving Period
80
90
100
110
120
130
140
150
160
20 25
31.5 40 50 63 80 100
125
160
200
250
315
400
500
630
800
1000
1250
1600
2000
2500
3150
4000
5000
6300
8000
1000
0
1250
0
1600
0
2000
0
2500
0
3150
0
4000
0
Soun
d Pr
essu
re L
evel
(dB
RMS)
1/3rd-Octave Band Center (Hz)
Frequency Distribution516 m from Site
Depth 3 m
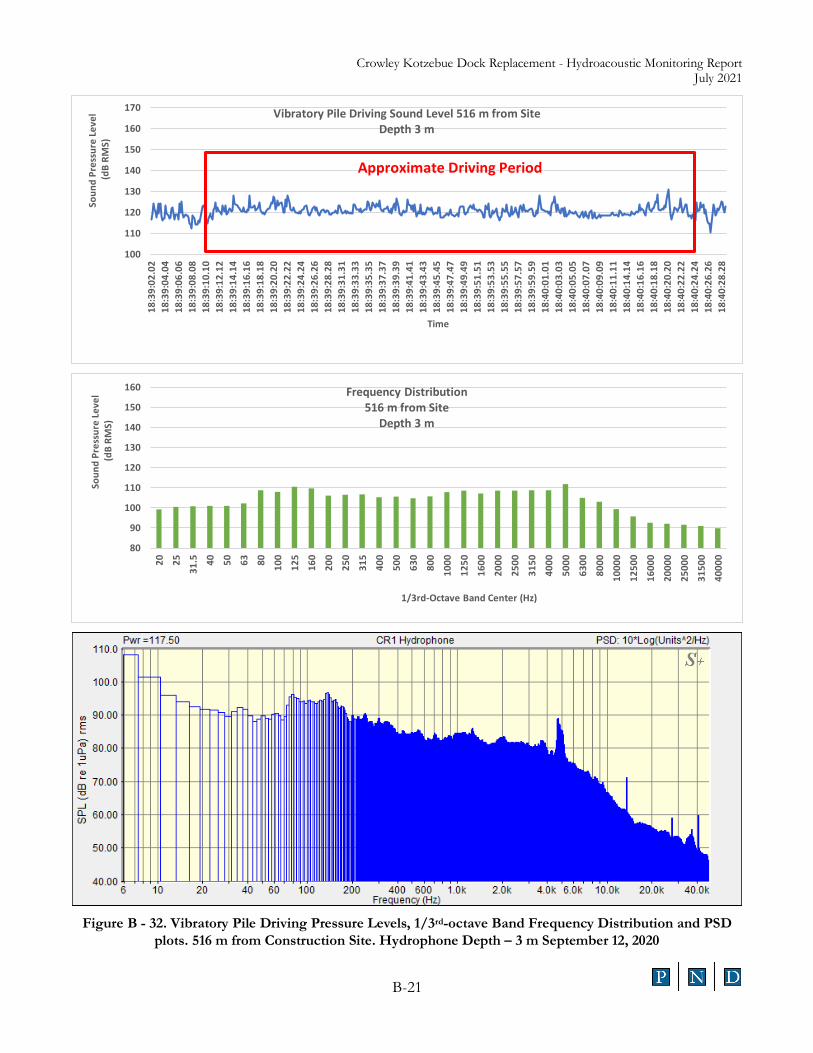
Crowley Kotzebue Dock Replacement - Hydroacoustic Monitoring Report July 2021
B-21
Figure B - 32. Vibratory Pile Driving Pressure Levels, 1/3rd-octave Band Frequency Distribution and PSD
plots. 516 m from Construction Site. Hydrophone Depth – 3 m September 12, 2020
100
110
120
130
140
150
160
170
18:3
9:02
.02
18:3
9:04
.04
18:3
9:06
.06
18:3
9:08
.08
18:3
9:10
.10
18:3
9:12
.12
18:3
9:14
.14
18:3
9:16
.16
18:3
9:18
.18
18:3
9:20
.20
18:3
9:22
.22
18:3
9:24
.24
18:3
9:26
.26
18:3
9:28
.28
18:3
9:31
.31
18:3
9:33
.33
18:3
9:35
.35
18:3
9:37
.37
18:3
9:39
.39
18:3
9:41
.41
18:3
9:43
.43
18:3
9:45
.45
18:3
9:47
.47
18:3
9:49
.49
18:3
9:51
.51
18:3
9:53
.53
18:3
9:55
.55
18:3
9:57
.57
18:3
9:59
.59
18:4
0:01
.01
18:4
0:03
.03
18:4
0:05
.05
18:4
0:07
.07
18:4
0:09
.09
18:4
0:11
.11
18:4
0:14
.14
18:4
0:16
.16
18:4
0:18
.18
18:4
0:20
.20
18:4
0:22
.22
18:4
0:24
.24
18:4
0:26
.26
18:4
0:28
.28
Soun
d Pr
essu
re L
evel
(dB
RMS)
Time
Vibratory Pile Driving Sound Level 516 m from SiteDepth 3 m
Approximate Driving Period
80
90
100
110
120
130
140
150
160
20 25
31.5 40 50 63 80 100
125
160
200
250
315
400
500
630
800
1000
1250
1600
2000
2500
3150
4000
5000
6300
8000
1000
0
1250
0
1600
0
2000
0
2500
0
3150
0
4000
0
Soun
d Pr
essu
re L
evel
(dB
RMS)
1/3rd-Octave Band Center (Hz)
Frequency Distribution516 m from Site
Depth 3 m
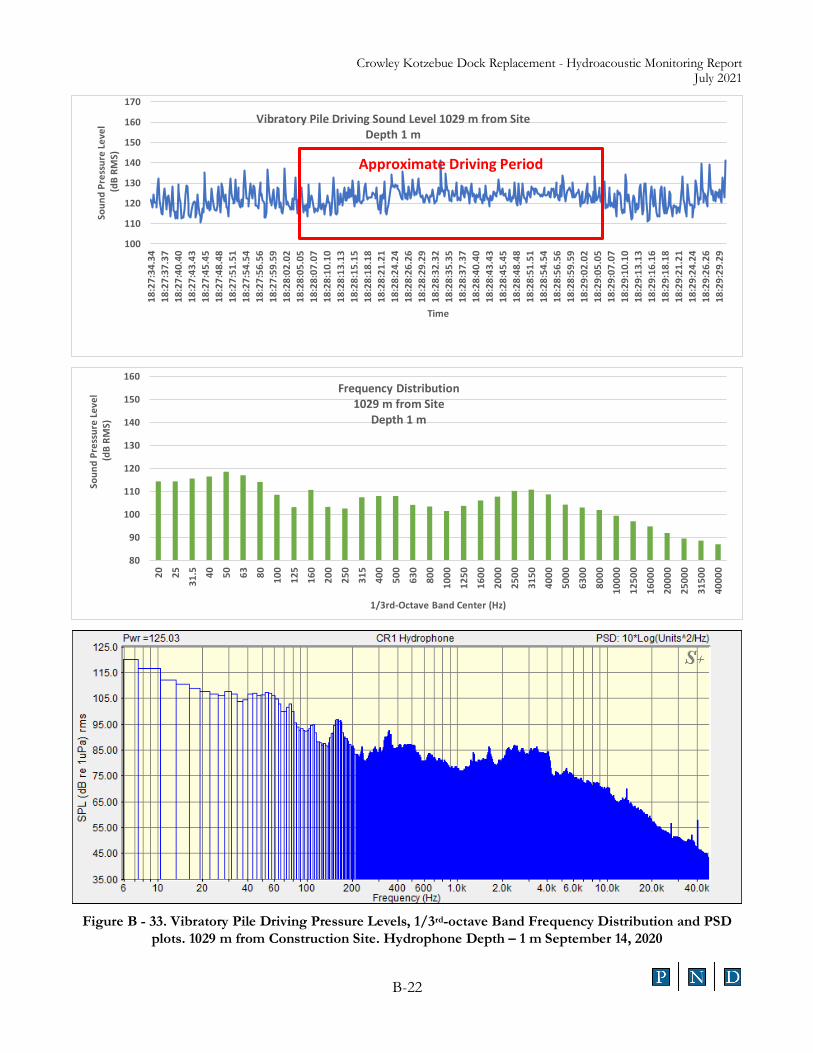
Crowley Kotzebue Dock Replacement - Hydroacoustic Monitoring Report July 2021
B-22
Figure B - 33. Vibratory Pile Driving Pressure Levels, 1/3rd-octave Band Frequency Distribution and PSD
plots. 1029 m from Construction Site. Hydrophone Depth – 1 m September 14, 2020
100
110
120
130
140
150
160
170
18:2
7:34
.34
18:2
7:37
.37
18:2
7:40
.40
18:2
7:43
.43
18:2
7:45
.45
18:2
7:48
.48
18:2
7:51
.51
18:2
7:54
.54
18:2
7:56
.56
18:2
7:59
.59
18:2
8:02
.02
18:2
8:05
.05
18:2
8:07
.07
18:2
8:10
.10
18:2
8:13
.13
18:2
8:15
.15
18:2
8:18
.18
18:2
8:21
.21
18:2
8:24
.24
18:2
8:26
.26
18:2
8:29
.29
18:2
8:32
.32
18:2
8:35
.35
18:2
8:37
.37
18:2
8:40
.40
18:2
8:43
.43
18:2
8:45
.45
18:2
8:48
.48
18:2
8:51
.51
18:2
8:54
.54
18:2
8:56
.56
18:2
8:59
.59
18:2
9:02
.02
18:2
9:05
.05
18:2
9:07
.07
18:2
9:10
.10
18:2
9:13
.13
18:2
9:16
.16
18:2
9:18
.18
18:2
9:21
.21
18:2
9:24
.24
18:2
9:26
.26
18:2
9:29
.29
Soun
d Pr
essu
re L
evel
(dB
RMS)
Time
Vibratory Pile Driving Sound Level 1029 m from SiteDepth 1 m
Approximate Driving Period
80
90
100
110
120
130
140
150
160
20 25
31.5 40 50 63 80 100
125
160
200
250
315
400
500
630
800
1000
1250
1600
2000
2500
3150
4000
5000
6300
8000
1000
0
1250
0
1600
0
2000
0
2500
0
3150
0
4000
0
Soun
d Pr
essu
re L
evel
(dB
RMS)
1/3rd-Octave Band Center (Hz)
Frequency Distribution1029 m from Site
Depth 1 m

Crowley Kotzebue Dock Replacement - Hydroacoustic Monitoring Report July 2021
B-23
Figure B - 34. Vibratory Pile Driving Pressure Levels, 1/3rd-octave Band Frequency Distribution and PSD
plots. 1029 m from Construction Site. Hydrophone Depth – 1 m September 14, 2020
100
110
120
130
140
150
160
170
18:3
6:28
.28
18:3
6:30
.30
18:3
6:32
.32
18:3
6:34
.34
18:3
6:36
.36
18:3
6:38
.38
18:3
6:40
.40
18:3
6:42
.42
18:3
6:44
.44
18:3
6:46
.46
18:3
6:48
.48
18:3
6:50
.50
18:3
6:52
.52
18:3
6:54
.54
18:3
6:56
.56
18:3
6:58
.58
18:3
7:00
.00
18:3
7:03
.03
18:3
7:05
.05
18:3
7:07
.07
18:3
7:09
.09
18:3
7:11
.11
18:3
7:13
.13
18:3
7:15
.15
18:3
7:17
.17
18:3
7:19
.19
18:3
7:21
.21
18:3
7:23
.23
18:3
7:25
.25
18:3
7:27
.27
18:3
7:29
.29
18:3
7:31
.31
18:3
7:33
.33
18:3
7:35
.35
18:3
7:37
.37
18:3
7:39
.39
18:3
7:41
.41
18:3
7:43
.43
18:3
7:46
.46
18:3
7:48
.48
18:3
7:50
.50
18:3
7:52
.52
18:3
7:54
.54
Soun
d Pr
essu
re L
evel
(dB
RMS)
Time
Vibratory Pile Driving Sound Level 1029 m from SiteDepth 1 m
Approximate Driving Period
80
90
100
110
120
130
140
150
160
20 25
31.5 40 50 63 80 100
125
160
200
250
315
400
500
630
800
1000
1250
1600
2000
2500
3150
4000
5000
6300
8000
1000
0
1250
0
1600
0
2000
0
2500
0
3150
0
4000
0
Soun
d Pr
essu
re L
evel
(dB
RMS)
1/3rd-Octave Band Center (Hz)
Frequency Distribution1029 m from Site
Depth 1 m