Crop Insurance and Processing Vegetables: Farmer Practices and Net Returns Paul D. Mitchell Ag and...
49
Crop Insurance and Crop Insurance and Processing Vegetables: Processing Vegetables: Farmer Practices and Net Farmer Practices and Net Returns Returns Paul D. Mitchell Paul D. Mitchell Ag and Applied Economics, UW- Ag and Applied Economics, UW- Madison Madison 608.265.6514 608.265.6514 [email protected] [email protected] Central WI Processing Crops Central WI Processing Crops Meeting Meeting Hancock, WI Hancock, WI March 14, 2007, March 14, 2007,
-
Upload
gervais-watts -
Category
Documents
-
view
221 -
download
2
Transcript of Crop Insurance and Processing Vegetables: Farmer Practices and Net Returns Paul D. Mitchell Ag and...
Crop Insurance and Crop Insurance and Processing Vegetables: Processing Vegetables:
Farmer Practices and Net Farmer Practices and Net ReturnsReturns
Paul D. MitchellPaul D. Mitchell
Ag and Applied Economics, UW-MadisonAg and Applied Economics, UW-Madison
608.265.6514608.265.6514 [email protected]@wisc.edu
Central WI Processing Crops MeetingCentral WI Processing Crops Meeting
Hancock, WIHancock, WI March 14, 2007, March 14, 2007,
Extension Web Page:Extension Web Page:
www.aae.wisc.edu/mitchell/www.aae.wisc.edu/mitchell/extension.htmextension.htm
Goal TodayGoal Today
Use easily available USDA-RMA data for Use easily available USDA-RMA data for processing crops to examineprocessing crops to examine Farmer Practices with crop insuranceFarmer Practices with crop insurance Performance in terms of Net ReturnsPerformance in terms of Net Returns
Make basic recommendations regarding Make basic recommendations regarding using crop insurance for processing using crop insurance for processing corpscorps

Crop Insurance in WICrop Insurance in WI USDA’s Risk Management Agency (RMA) USDA’s Risk Management Agency (RMA)
manages federal crop insurance programmanages federal crop insurance program RMA “endorses” policies: makes subsidies RMA “endorses” policies: makes subsidies
available for companies and farmersavailable for companies and farmers Without RMA endorsement/subsidy, few Without RMA endorsement/subsidy, few
crop insurance policies would be availablecrop insurance policies would be available Every company sells the same Every company sells the same federalfederal crop crop
insurance policies for the same priceinsurance policies for the same price What crops are insurable in WI?What crops are insurable in WI?

Crop Crop Policy Policy CropCrop PolicyPolicy
ApplesApples GYCGYC Green Green PeasPeas
GYCGYC
BarleyBarley APHAPH PotatoesPotatoes GYCGYC
CabbageCabbage GYCGYC Snap Snap BeansBeans
GYCGYC
CranberriesCranberries APHAPH Sweet Sweet CornCorn
APH, GRP, APH, GRP, GRIPGRIP
CornCorn APH, CRC, APH, CRC, GRP, GRIPGRP, GRIP
Hybrid Seed Hybrid Seed CornCorn
GRP, GRIP, GRP, GRIP, Dollar PlanDollar Plan
NurseryNursery Dollar PlanDollar Plan OatsOats APHAPH
Dry BeansDry Beans APHAPH MintMint APHAPH
Forage Forage ProductionProduction
APH, GRPAPH, GRP SoybeansSoybeans APH, CRC, APH, CRC, GRP, GRIPGRP, GRIP
Forage Forage SeedingSeeding
Dollar PlanDollar Plan TobaccoTobacco Guaranteed Guaranteed ProductionProduction
SorghumSorghum APH, CRCAPH, CRC WheatWheat APH CRCAPH CRC
How GYC Crop Insurance How GYC Crop Insurance WorksWorks
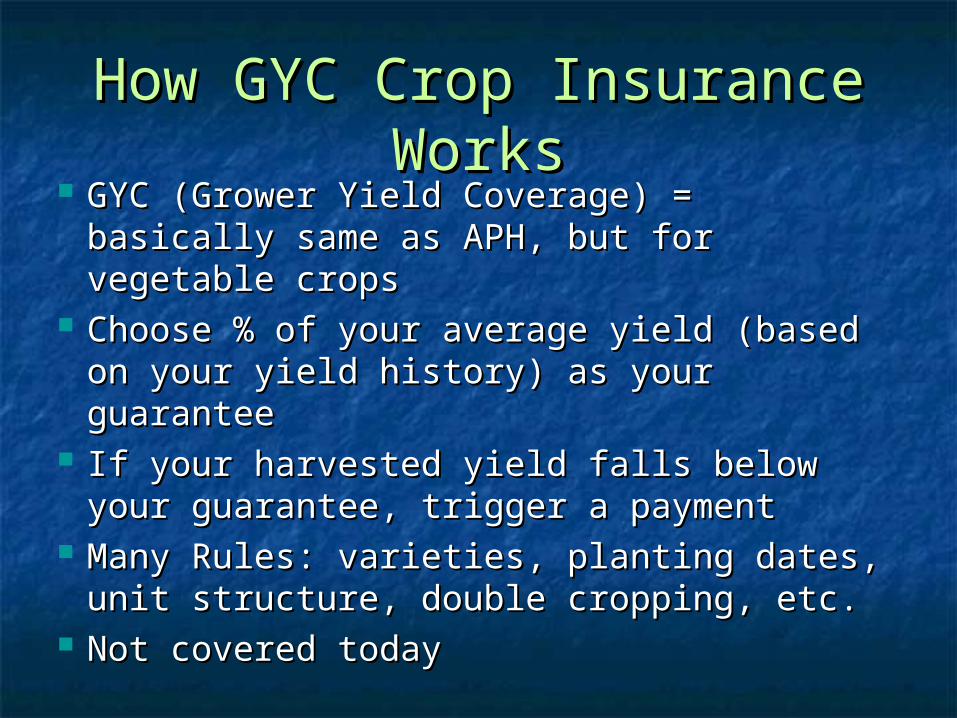
GYC (Grower Yield Coverage) = GYC (Grower Yield Coverage) = basically same as APH, but for basically same as APH, but for vegetable cropsvegetable crops
Choose % of your average yield (based Choose % of your average yield (based on your yield history) as your guaranteeon your yield history) as your guarantee
If your harvested yield falls below your If your harvested yield falls below your guarantee, trigger a paymentguarantee, trigger a payment
Many Rules: varieties, planting dates, Many Rules: varieties, planting dates, unit structure, double cropping, etc. unit structure, double cropping, etc.
Not covered todayNot covered today
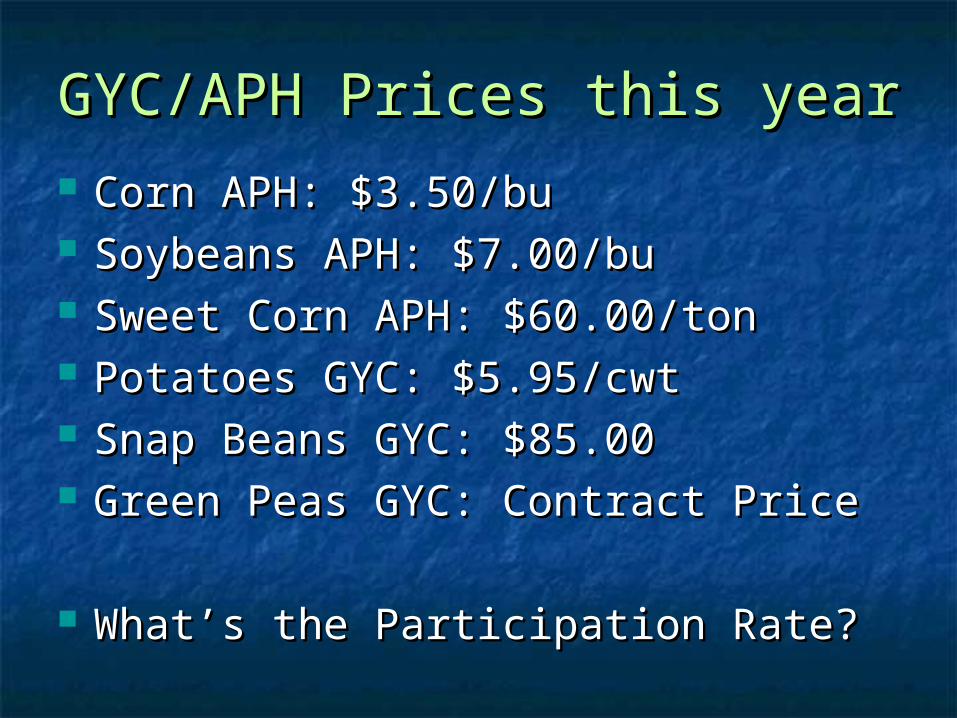
GYC/APH Prices this yearGYC/APH Prices this year Corn APH: $3.50/buCorn APH: $3.50/bu Soybeans APH: $7.00/buSoybeans APH: $7.00/bu Sweet Corn APH: $60.00/tonSweet Corn APH: $60.00/ton Potatoes GYC: $5.95/cwtPotatoes GYC: $5.95/cwt Snap Beans GYC: $85.00Snap Beans GYC: $85.00 Green Peas GYC: Contract PriceGreen Peas GYC: Contract Price
What’s the Participation Rate?What’s the Participation Rate?
0%
10%
20%
30%
40%
50%
60%
70%
80%
90%
100%
2000 2001 2002 2003 2004 2005 2006
Year
% A
cres
Insu
red
Apples
Corn
Cranberries
Green Peas
Oats
Potatoes
Snap Beans
Soybeans
Sweet Corn
Wheat

0%
10%
20%
30%
40%
50%
60%
70%
80%
2000 2001 2002 2003 2004 2005 2006
Year
% A
cres
Insu
red
Corn
Green Peas
Potatoes
Snap Beans
Soybeans
Sweet Corn
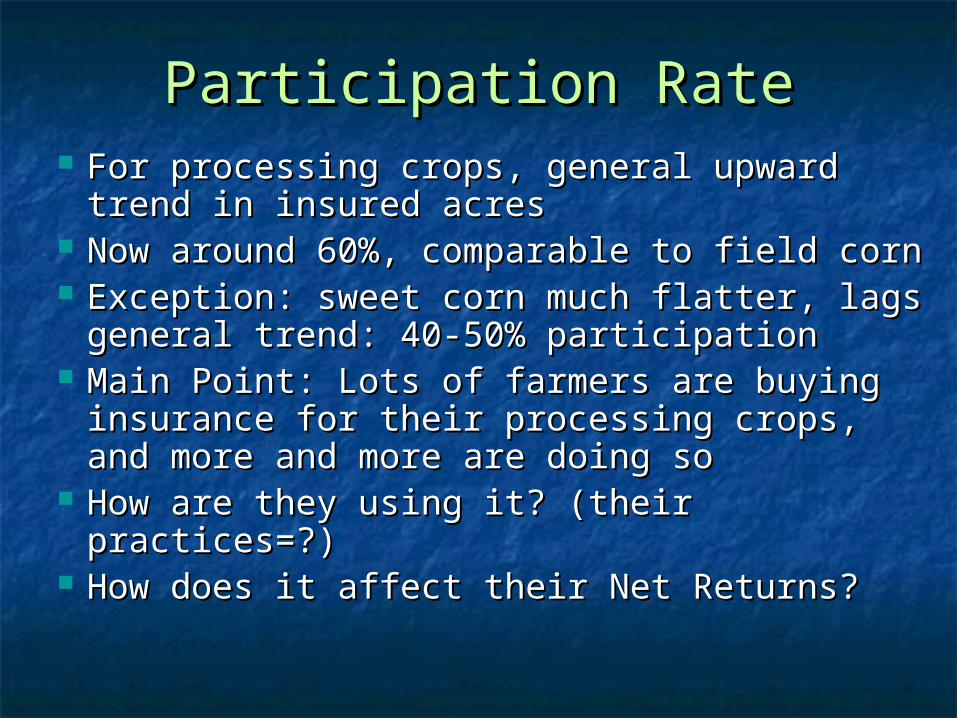
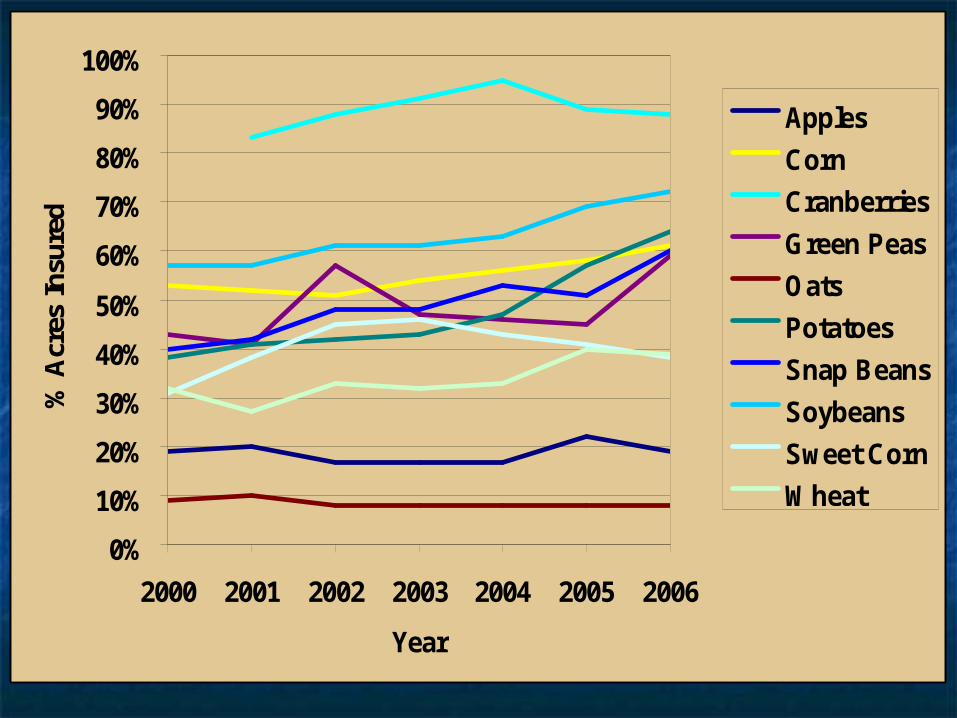
Participation RateParticipation Rate For processing crops, general upward For processing crops, general upward
trend in insured acrestrend in insured acres Now around 60%, comparable to field Now around 60%, comparable to field
corncorn Exception: sweet corn much flatter, lags Exception: sweet corn much flatter, lags
general trend: 40-50% participationgeneral trend: 40-50% participation Main Point: Lots of farmers are buying Main Point: Lots of farmers are buying
insurance for their processing crops, and insurance for their processing crops, and more and more are doing somore and more are doing so
How are they using it? (their practices=?)How are they using it? (their practices=?) How does it affect their Net Returns?How does it affect their Net Returns?
RMA DataRMA Data
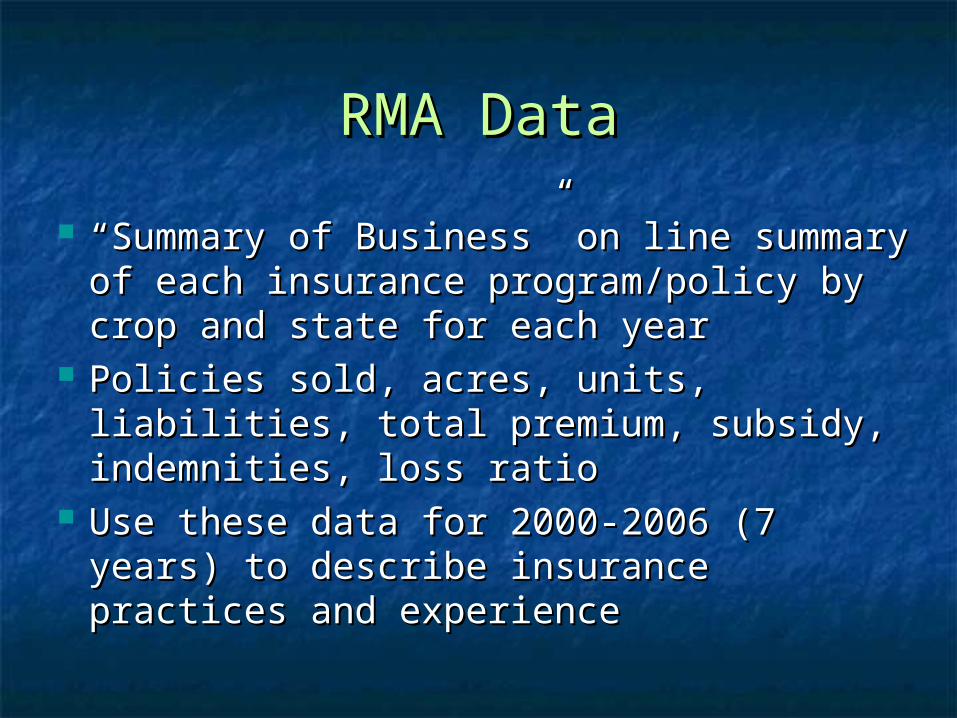
““Summary of Business” on line summary Summary of Business” on line summary of each insurance program/policy by crop of each insurance program/policy by crop and state for each yearand state for each year
Policies sold, acres, units, liabilities, total Policies sold, acres, units, liabilities, total premium, subsidy, indemnities, loss ratiopremium, subsidy, indemnities, loss ratio
Use these data for 2000-2006 (7 years) Use these data for 2000-2006 (7 years) to describe insurance practices and to describe insurance practices and experienceexperience
Cat vs. Buy Up CoverageCat vs. Buy Up Coverage
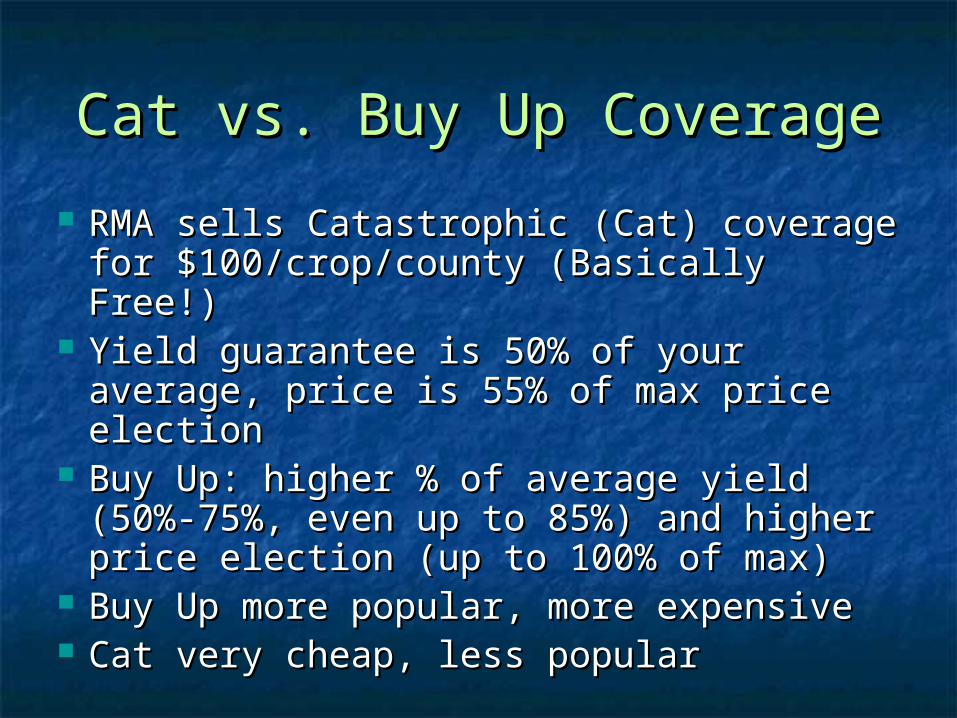
RMA sells Catastrophic (Cat) coverage RMA sells Catastrophic (Cat) coverage for $100/crop/county (Basically Free!)for $100/crop/county (Basically Free!)
Yield guarantee is 50% of your Yield guarantee is 50% of your average, price is 55% of max price average, price is 55% of max price electionelection
Buy Up: higher % of average yield Buy Up: higher % of average yield (50%-75%, even up to 85%) and higher (50%-75%, even up to 85%) and higher price election (up to 100% of max)price election (up to 100% of max)
Buy Up more popular, more expensiveBuy Up more popular, more expensive Cat very cheap, less popularCat very cheap, less popular

0%
10%
20%
30%
40%
50%
60%
70%
80%
90%
100%
2000 2001 2002 2003 2004 2005 2006
Year
% P
olic
ies
in B
uy U
p
Green Peas
Potatoes
Snap Beans
Sweet Corn
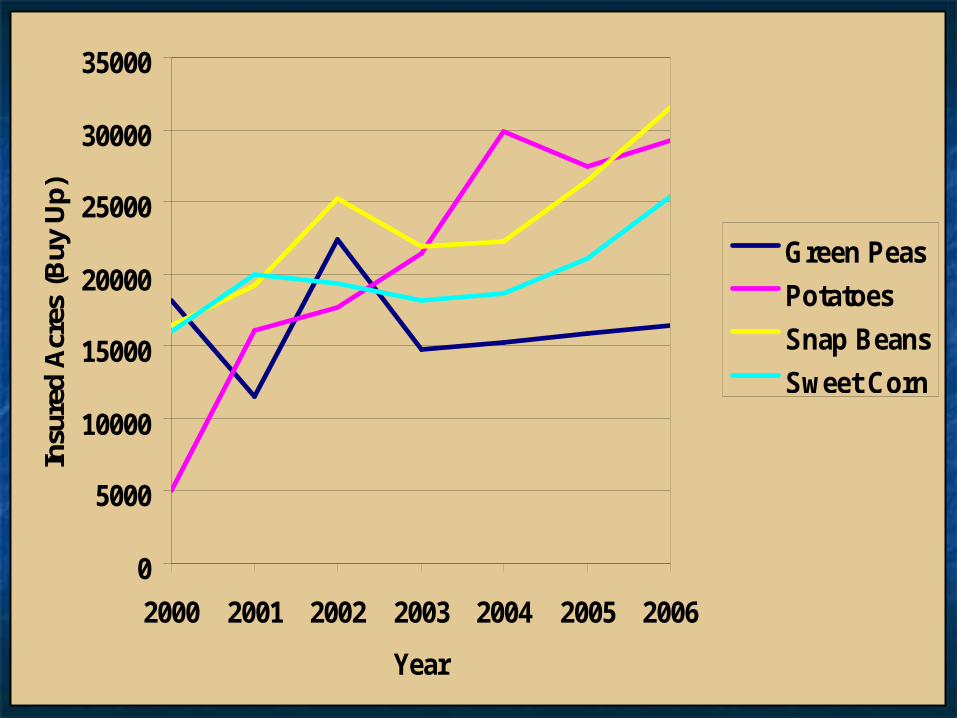
0
5000
10000
15000
20000
25000
30000
35000
2000 2001 2002 2003 2004 2005 2006
Year
Insu
red
Acr
es (
Buy
Up)
Green Peas
Potatoes
Snap Beans
Sweet Corn

0%
10%
20%
30%
40%
50%
60%
70%
80%
90%
100%
2000 2001 2002 2003 2004 2005 2006
Year
% In
sure
d A
cres
in B
uy U
p
Green Peas
Potatoes
Snap Beans
Sweet Corn

Average Buy Up over 2000-Average Buy Up over 2000-20062006
CropCrop AcresAcres % Acres% Acres % % PoliciesPolicies
Green PeasGreen Peas 16,35016,350 85%85% 89%89%
PotatoesPotatoes 20,95820,958 57%57% 55%55%
Snap Snap BeansBeans
23,30223,302 62%62% 71%71%
Sweet Sweet CornCorn
19,79619,796 57%57% 74%74%

Buy Up Coverage in 2006Buy Up Coverage in 2006
CropCrop AcresAcres % Acres% Acres % % PoliciesPolicies
Green PeasGreen Peas 16,45316,453 88%88% 96%96%
PotatoesPotatoes 29,18429,184 69%69% 66%66%
Snap Snap BeansBeans
31,51531,515 71%71% 80%80%
Sweet Sweet CornCorn
25,43525,435 71%71% 81%81%

Summary Buy Up vs. CatSummary Buy Up vs. Cat Most farmers use Buy Up coverageMost farmers use Buy Up coverage Use of Buy Up coverage is increasingUse of Buy Up coverage is increasing % Acres vs % Policies shows more % Acres vs % Policies shows more
smaller farmers use Buy Up, but not smaller farmers use Buy Up, but not by muchby much Exception: Potatoes is reverseException: Potatoes is reverse
Green Peas almost all Buy up Green Peas almost all Buy up 96% policies in 200696% policies in 2006
Potatoes lowest use of Buy UpPotatoes lowest use of Buy Up 66% policies in 200666% policies in 2006

Unit StructureUnit Structure
Must define the insured unit of landMust define the insured unit of land Yield guarantee is at the unit levelYield guarantee is at the unit level Yield from the whole unit must fall below Yield from the whole unit must fall below
your guarantee to trigger an indemnityyour guarantee to trigger an indemnity Basic Unit: all acres of crop in one unitBasic Unit: all acres of crop in one unit Optional Unit: break basic unit into smaller Optional Unit: break basic unit into smaller
fields, following RMA rulesfields, following RMA rules Use as many Optional Units as Use as many Optional Units as
possiblepossible

0.0
1.0
2.0
3.0
4.0
5.0
6.0
2000 2001 2002 2003 2004 2005 2006
Year
Ave
rage
Num
ber
Uni
ts p
er P
olic
y
Green Peas
Potatoes
Snap Beans
Sweet Corn
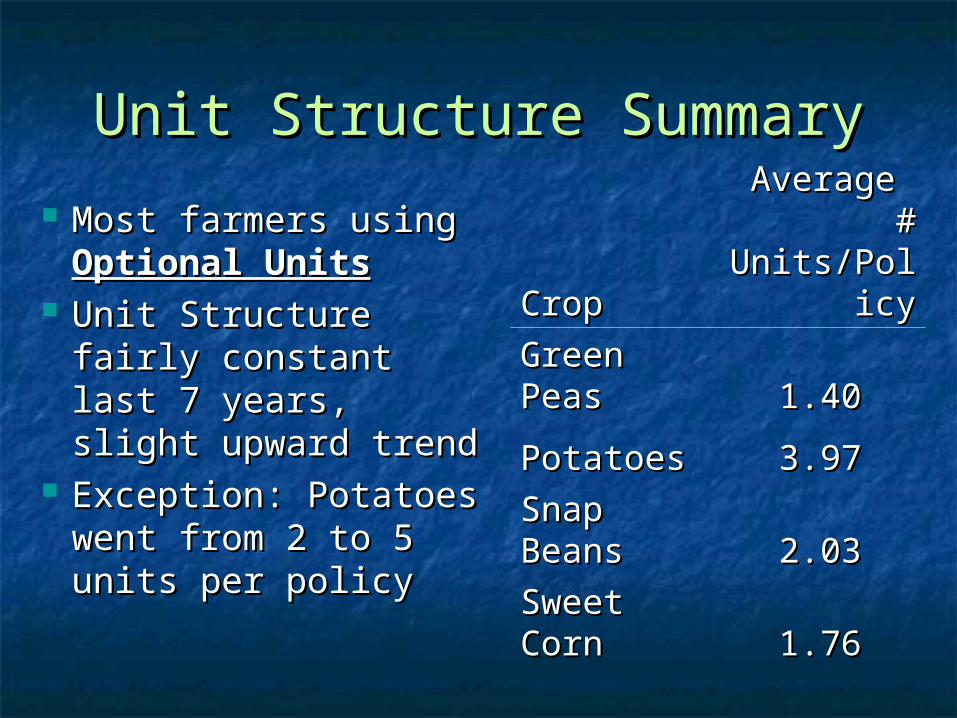
Unit Structure SummaryUnit Structure Summary
Most farmers using Most farmers using Optional UnitsOptional Units
Unit Structure fairly Unit Structure fairly constant last 7 constant last 7 years, slight years, slight upward trend upward trend
Exception: Potatoes Exception: Potatoes went from 2 to 5 went from 2 to 5 units per policy units per policy
CropCrop
Average Average # #
Units/PolicUnits/Policyy
Green Green PeasPeas 1.401.40
PotatoesPotatoes 3.973.97
Snap Snap BeansBeans 2.032.03
Sweet Sweet CornCorn 1.761.76

Summary of Farmer Summary of Farmer PracticesPractices
Most farmers use crop insurance for their Most farmers use crop insurance for their processing vegetables and more are doing soprocessing vegetables and more are doing so
Most use Buy Up coverage or are switching Most use Buy Up coverage or are switching from Cat to Buy Up coveragefrom Cat to Buy Up coverage
Many farmers use Optional Units, especially Many farmers use Optional Units, especially for potatoes (snap beans to some extent)for potatoes (snap beans to some extent)
Most farmers keeping constant unit structure Most farmers keeping constant unit structure (not switching), except for potatoes(not switching), except for potatoes
Practices for potatoes are in transitionPractices for potatoes are in transition

Double CroppingDouble Cropping
RMA has a standing policy not to insure RMA has a standing policy not to insure second crop in a double crop rotationsecond crop in a double crop rotation
Corn planted following an early hay cutting Corn planted following an early hay cutting is not insurableis not insurable
Soybeans following early peas or snap Soybeans following early peas or snap beans are not insurablebeans are not insurable
Does this double crop restriction limit Does this double crop restriction limit buying crop insurance for processing buying crop insurance for processing crops?crops?
You tell me!You tell me!
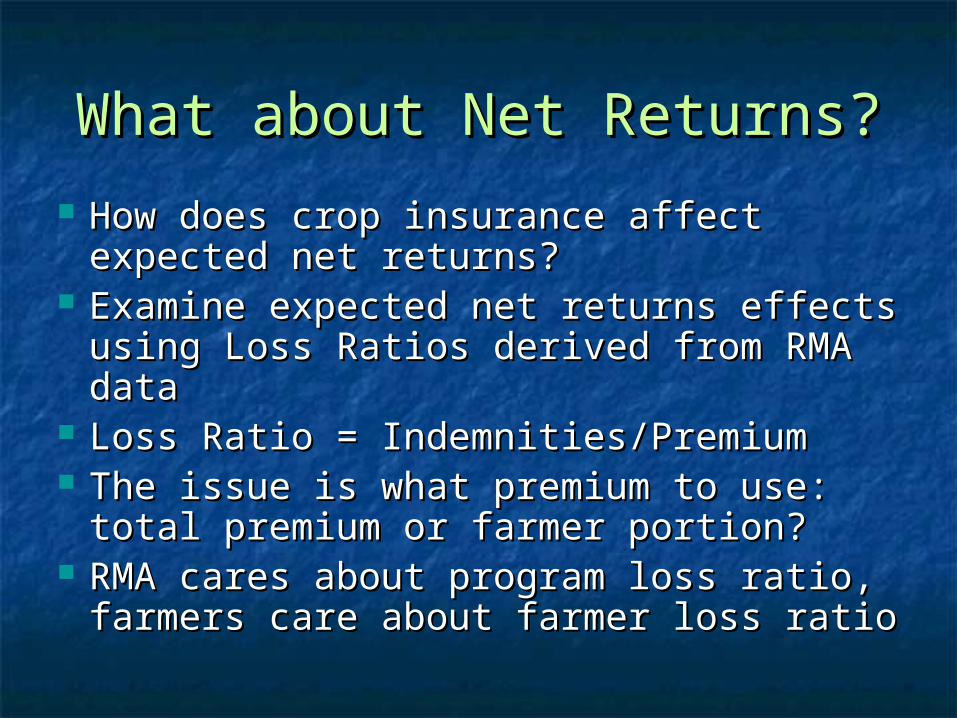
What about Net Returns?What about Net Returns?
How does crop insurance affect How does crop insurance affect expected net returns?expected net returns?
Examine expected net returns effects Examine expected net returns effects using Loss Ratios derived from RMA using Loss Ratios derived from RMA datadata
Loss Ratio = Indemnities/PremiumLoss Ratio = Indemnities/Premium The issue is what premium to use: The issue is what premium to use:
total premium or farmer portion?total premium or farmer portion? RMA cares about program loss ratio, RMA cares about program loss ratio,
farmers care about farmer loss ratiofarmers care about farmer loss ratio

Loss RatioLoss Ratio Simple way to see how the insurance Simple way to see how the insurance
affects farmer net returnsaffects farmer net returns Do farmers on average make or lose Do farmers on average make or lose
money with the crops insurance?money with the crops insurance? Jumps around between years: high in Jumps around between years: high in
bad years, low in good yearsbad years, low in good years Note: RMA subsidizes premiums and Note: RMA subsidizes premiums and
program loss ratio includes that program loss ratio includes that subsidy as part of the total premium subsidy as part of the total premium collectedcollected
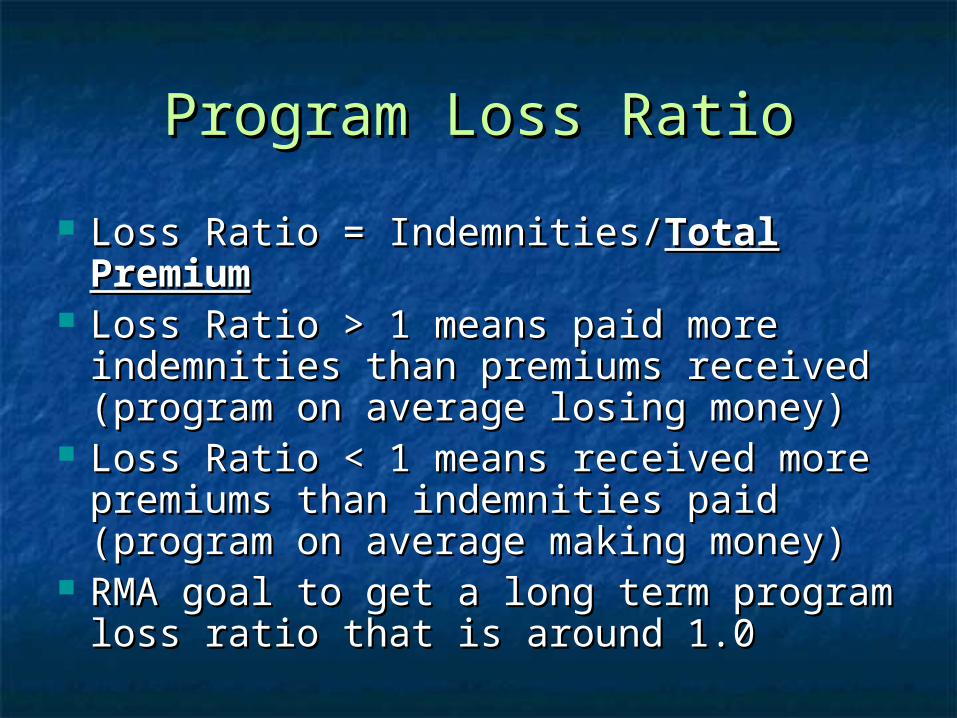
Program Loss RatioProgram Loss Ratio
Loss Ratio = Indemnities/Loss Ratio = Indemnities/TotalTotal PremiumPremium
Loss Ratio > 1 means paid more Loss Ratio > 1 means paid more indemnities than premiums received indemnities than premiums received (program on average losing money)(program on average losing money)
Loss Ratio < 1 means received more Loss Ratio < 1 means received more premiums than indemnities paid premiums than indemnities paid (program on average making money)(program on average making money)
RMA goal to get a long term program RMA goal to get a long term program loss ratio that is around 1.0loss ratio that is around 1.0

0.00
0.50
1.00
1.50
2.00
2.50
3.00
3.50
4.00
2000 2001 2002 2003 2004 2005 2006
Year
Pro
gram
Los
s R
atio
Green Peas
Potatoes
Snap Beans
Sweet Corn
Corn
Soybeans
Wheat

0.00
0.10
0.20
0.30
0.40
0.50
0.60
0.70
2000 2001 2002 2003 2004 2005 2006
Year
Pro
gram
Los
s R
atio
Green Peas
Potatoes
Snap Beans
Sweet Corn
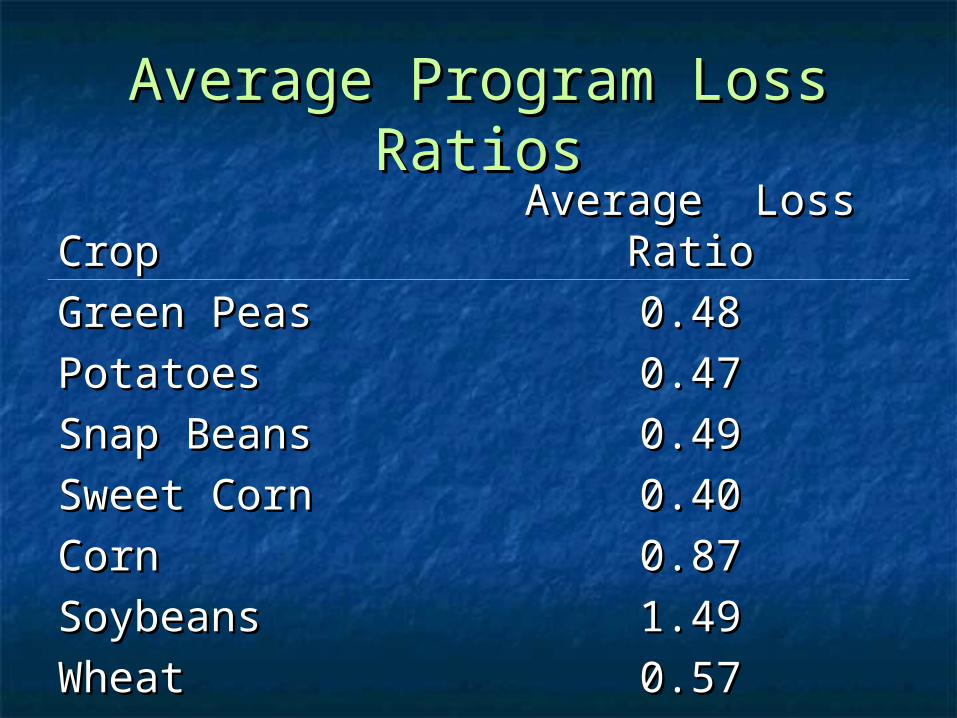
Average Program Loss Average Program Loss RatiosRatios
CropCropAverage Loss Average Loss
RatioRatio
Green PeasGreen Peas 0.480.48
PotatoesPotatoes 0.470.47
Snap BeansSnap Beans 0.490.49
Sweet CornSweet Corn 0.400.40
CornCorn 0.870.87
SoybeansSoybeans 1.491.49
WheatWheat 0.570.57

Program Loss Ratio Program Loss Ratio SummarySummary
Over the last Over the last 7 years7 years Grain crops had higher loss ratios than Grain crops had higher loss ratios than
processing vegetables (closer to 1.0)processing vegetables (closer to 1.0) Processing VegetablesProcessing Vegetables
On average, about twice as much total On average, about twice as much total premium collected as indemnities paidpremium collected as indemnities paid
Upward trendUpward trend (it’s getting better)(it’s getting better) RMA has room for improvement to get RMA has room for improvement to get
1.01.0

0.00
0.50
1.00
1.50
2.00
2.50
3.00
2000 2001 2002 2003 2004 2005 2006
Year
Pro
gram
Los
s R
ato
(Buy
Up)
Green Peas
Potatoes
Snap Beans
Sweet Corn

Buy Up Program Loss RatiosBuy Up Program Loss Ratios Higher on average than total program Higher on average than total program
loss ratio (better for farmers)loss ratio (better for farmers) RMA has internal premiums for Cat too lowRMA has internal premiums for Cat too low RMA has better (relatively lower) premiums RMA has better (relatively lower) premiums
for higher coverage levelsfor higher coverage levels Flat trend for Green Peas, Snap Beans, Flat trend for Green Peas, Snap Beans,
and Sweet Corn (0.65-0.81)and Sweet Corn (0.65-0.81) What’s going on with Potatoes?What’s going on with Potatoes?
String of better and better years?String of better and better years? Farmers with better land buying insurance?Farmers with better land buying insurance? Premiums increasing?Premiums increasing?
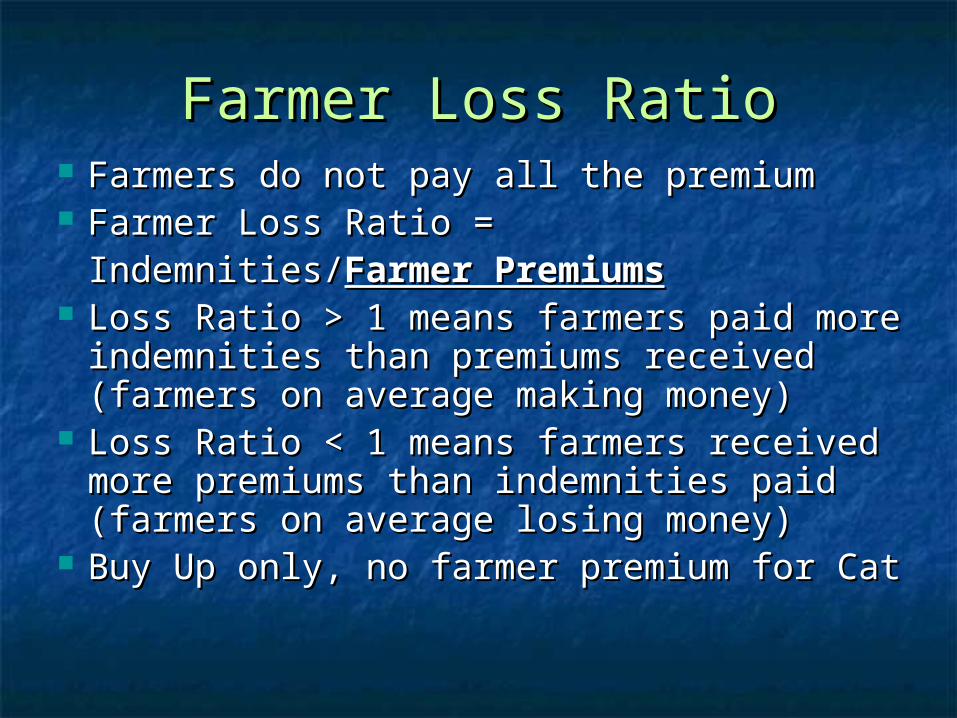
Farmer Loss RatioFarmer Loss Ratio Farmers do not pay all the premiumFarmers do not pay all the premium Farmer Loss Ratio = Farmer Loss Ratio =
Indemnities/Indemnities/Farmer PremiumsFarmer Premiums Loss Ratio > 1 means farmers paid more Loss Ratio > 1 means farmers paid more
indemnities than premiums received indemnities than premiums received (farmers on average making money)(farmers on average making money)
Loss Ratio < 1 means farmers received Loss Ratio < 1 means farmers received more premiums than indemnities paid more premiums than indemnities paid (farmers on average losing money)(farmers on average losing money)
Buy Up only, no farmer premium for CatBuy Up only, no farmer premium for Cat

0.00
0.50
1.00
1.50
2.00
2.50
3.00
3.50
4.00
4.50
5.00
2000 2001 2002 2003 2004 2005 2006
Year
Farm
er L
oss
Rat
io (
Buy
Up)
Green Peas
Potatoes
Snap Beans
Sweet Corn

Average Farmer Loss Ratio (Buy Average Farmer Loss Ratio (Buy Up)Up)
CropCropAverage Loss Average Loss
RatioRatio
Green PeasGreen Peas 1.701.70
PotatoesPotatoes 2.722.72
Snap BeansSnap Beans 1.811.81
Sweet CornSweet Corn 1.531.53
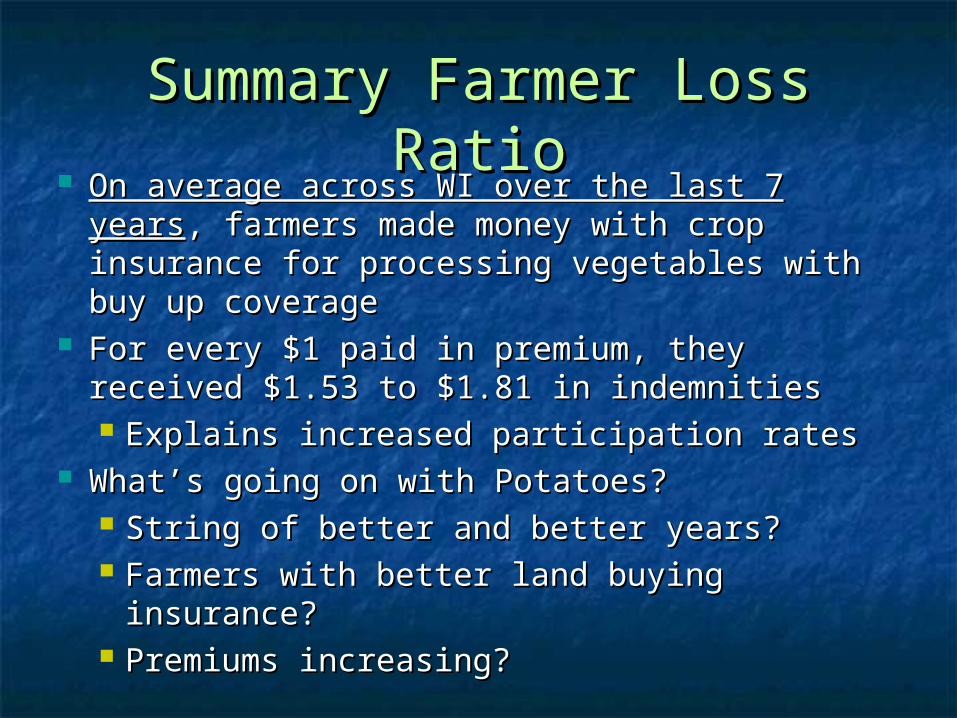
Summary Farmer Loss RatioSummary Farmer Loss Ratio On average across WI over the last 7 yearsOn average across WI over the last 7 years, ,
farmers made money with crop insurance for farmers made money with crop insurance for processing vegetables with buy up coverageprocessing vegetables with buy up coverage
For every $1 paid in premium, they received For every $1 paid in premium, they received $1.53 to $1.81 in indemnities$1.53 to $1.81 in indemnities Explains increased participation ratesExplains increased participation rates
What’s going on with Potatoes?What’s going on with Potatoes? String of better and better years?String of better and better years? Farmers with better land buying insurance?Farmers with better land buying insurance? Premiums increasing?Premiums increasing?

Note: It’s a 7-Year State Note: It’s a 7-Year State Average, Average,
Not a GuaranteeNot a Guarantee This loss ratio analysis is the average This loss ratio analysis is the average
for all policies in Wisconsin by cropfor all policies in Wisconsin by crop Some years it will be higher, some Some years it will be higher, some
years lower, this the 7-year averageyears lower, this the 7-year average Some counties have low loss ratios and Some counties have low loss ratios and
some counties have high loss ratiossome counties have high loss ratios Data by county exist, but it’s a big fileData by county exist, but it’s a big file Some farmers have low loss ratios, Some farmers have low loss ratios,
some have high ones—each farmer is some have high ones—each farmer is differentdifferent
Probability of Receiving Probability of Receiving IndemnitiesIndemnities
Can use the RMA data to find out how Can use the RMA data to find out how many policies and how many units many policies and how many units received indemnitiesreceived indemnities
Rough empirical estimate of the Rough empirical estimate of the probability of receiving an indemnityprobability of receiving an indemnity
Can examine by Buy Up vs. Cat Can examine by Buy Up vs. Cat coveragecoverage
Again, it will be a state wide estimateAgain, it will be a state wide estimate

0%
10%
20%
30%
40%
50%
60%
2000 2001 2002 2003 2004 2005 2006
Year
% P
olic
ies
Inde
m >
0 (
Buy
Up)
Green Peas
Potatoes
Snap Beans
Sweet Corn
0%
5%
10%
15%
20%
25%
2000 2001 2002 2003 2004 2005 2006
Year
% P
olic
ies
Inde
m >
0 (
Cat
)
Green Peas
Potatoes
Snap Beans
Sweet Corn

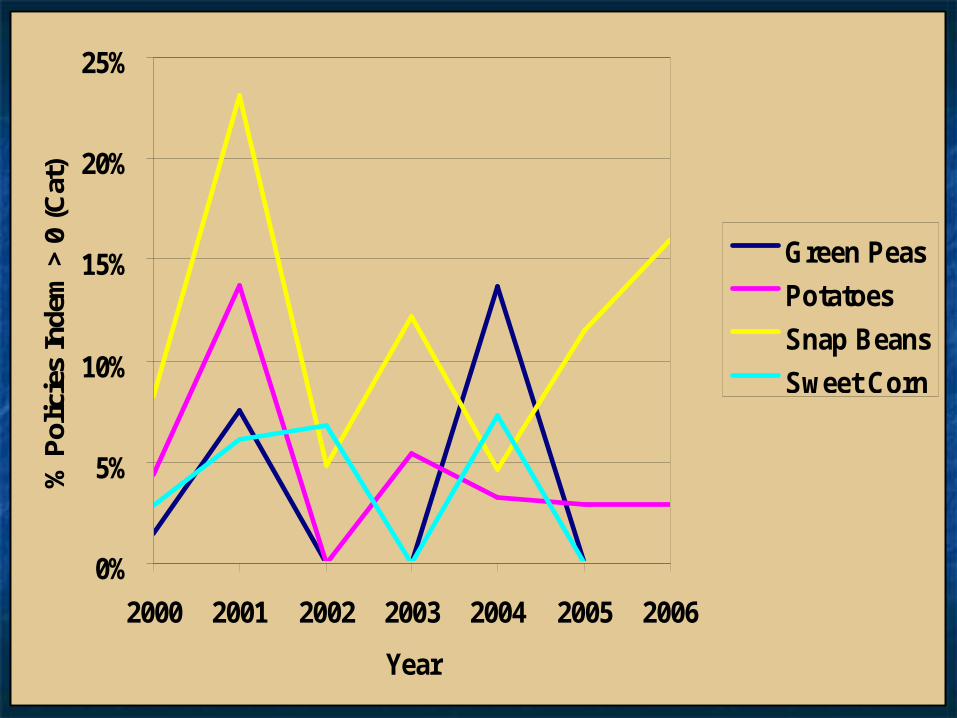
Probability Pay IndemnityProbability Pay Indemnity
% Policies Pay% Policies Pay
CropCrop Buy UpBuy Up CatCat
Green PeasGreen Peas 27%27% 3%3%
PotatoesPotatoes 37%37% 5%5%
Snap BeansSnap Beans 33%33% 11%11%
Sweet CornSweet Corn 18%18% 3%3%
Summary of ProbabilitiesSummary of Probabilities
No real trend for cropsNo real trend for crops Potato buy up has a downward trendPotato buy up has a downward trend
Cat policies rarely pay: 3-5% (< 1 in 20)Cat policies rarely pay: 3-5% (< 1 in 20) Snap Beans = 11% (over 1 in 10)Snap Beans = 11% (over 1 in 10)
Buy Up policies pay 27%-37%Buy Up policies pay 27%-37%
Roughly range between 1 in 4 to 1 Roughly range between 1 in 4 to 1 in 3in 3 Sweet Corn = 18% (less then 1 in 5)Sweet Corn = 18% (less then 1 in 5)

Summary of Net Returns Summary of Net Returns EffectsEffects
Program loss ratios too low in WI for Program loss ratios too low in WI for processing crops (premiums too high)processing crops (premiums too high) Only 7 years, will be awhile before RMA Only 7 years, will be awhile before RMA
actsacts Farmer loss ratios over 1.0, so farmers Farmer loss ratios over 1.0, so farmers
on average making money with the on average making money with the insuranceinsurance For every $1 paid in premium, they For every $1 paid in premium, they
received $1.53 to $1.81 in indemnitiesreceived $1.53 to $1.81 in indemnities Potatoes are in transition or strange historyPotatoes are in transition or strange history
In any given year, 20% to 35% of Buy In any given year, 20% to 35% of Buy Up policies pay, 5-10% Cat policies payUp policies pay, 5-10% Cat policies pay

Conclusions: GYC (APH) Crop Conclusions: GYC (APH) Crop Insurance for VegetablesInsurance for Vegetables
Crop insurance, especially Buy Up coverage, Crop insurance, especially Buy Up coverage, likely valuable for many/most WI processing likely valuable for many/most WI processing vegetable farmersvegetable farmers
Consider at least Cat: $100/crop/countyConsider at least Cat: $100/crop/county Use as many Optional units as possibleUse as many Optional units as possible Insurance has risk management Insurance has risk management
benefitsbenefits, not just increase average net , not just increase average net returns, also reduces returns variability with returns, also reduces returns variability with yield flooryield floor
March 15March 15thth final day to purchase crop final day to purchase crop insuranceinsurance
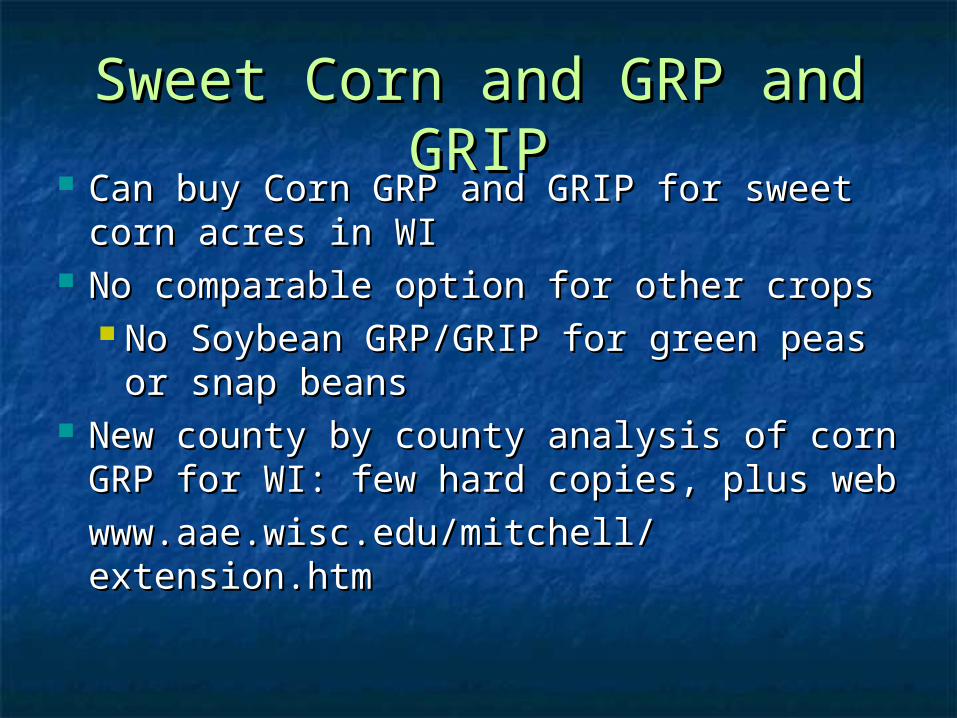
Sweet Corn and GRP and Sweet Corn and GRP and GRIPGRIP
Can buy Corn GRP and GRIP for sweet Can buy Corn GRP and GRIP for sweet corn acres in WIcorn acres in WI
No comparable option for other cropsNo comparable option for other crops No Soybean GRP/GRIP for green peas No Soybean GRP/GRIP for green peas
or snap beansor snap beans New county by county analysis of corn New county by county analysis of corn
GRP for WI: few hard copies, plus web GRP for WI: few hard copies, plus web
www.aae.wisc.edu/mitchell/www.aae.wisc.edu/mitchell/extension.htmextension.htm
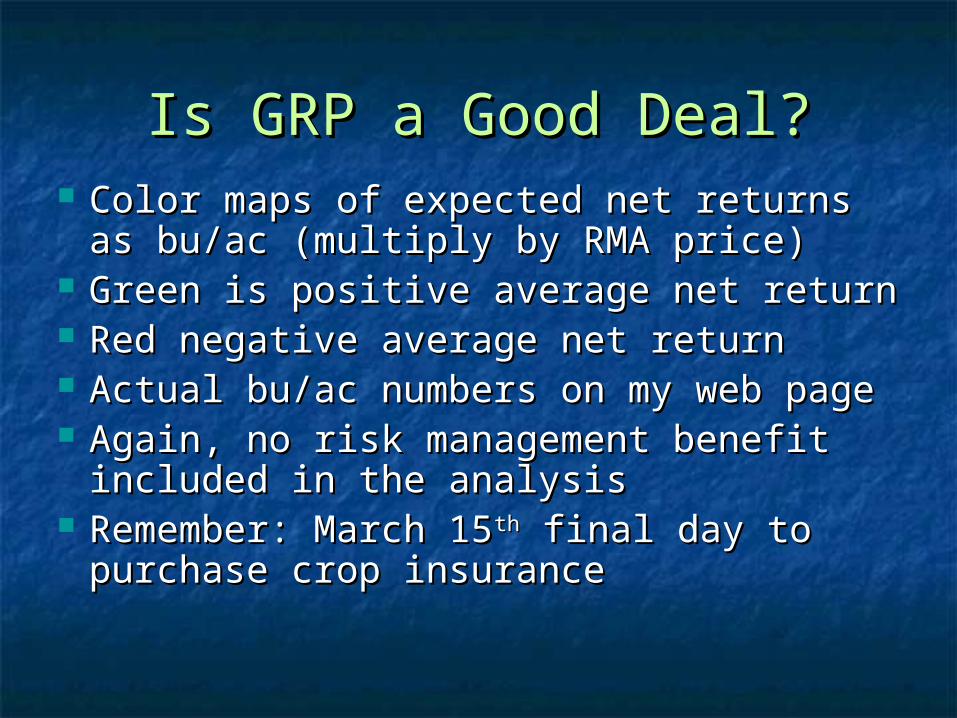
Is GRP a Good Deal?Is GRP a Good Deal? Color maps of expected net returns as Color maps of expected net returns as
bu/ac (multiply by RMA price)bu/ac (multiply by RMA price) Green is positive average net returnGreen is positive average net return Red negative average net returnRed negative average net return Actual bu/ac numbers on my web pageActual bu/ac numbers on my web page Again, no risk management benefit Again, no risk management benefit
included in the analysisincluded in the analysis Remember: March 15Remember: March 15thth final day to final day to
purchase crop insurancepurchase crop insurance

> 1 bu/ac 0 to 1 bu/ac –1 to 0 bu/ac –2 to –1 bu/ac < –2 bu/ac
Expected Returns (bu/ac) toGRP Harvested Acres Option
Corn

> 1 bu/ac 0 to 1 bu/ac –1 to 0 bu/ac –2 to –1 bu/ac < –2 bu/ac
Expected Returns (bu/ac) toGRP Planted Acres Option
Corn
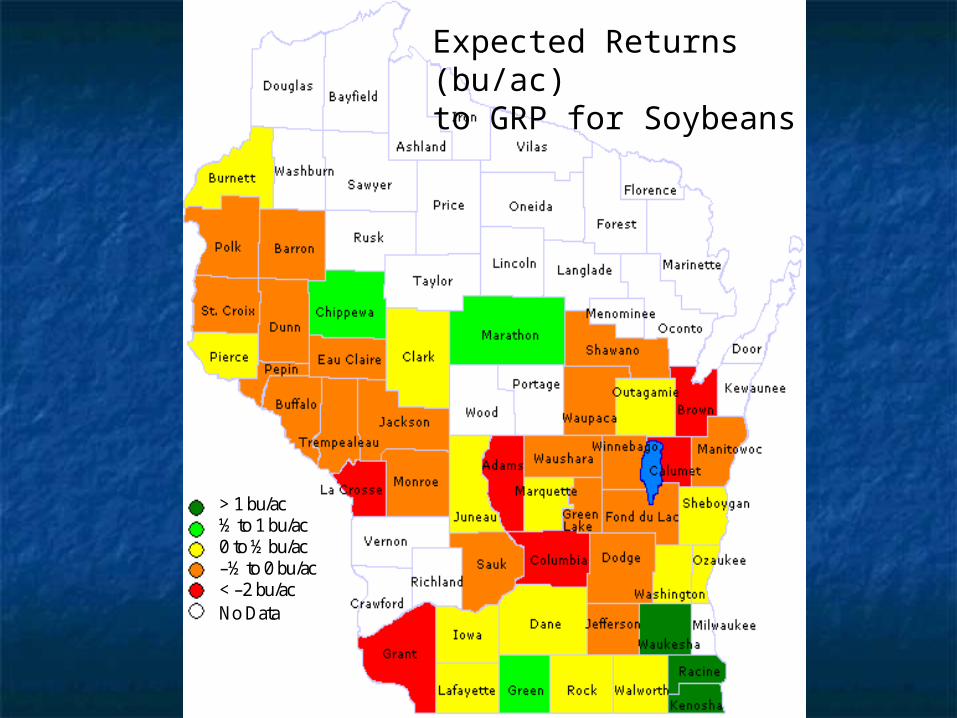
> 1 bu/ac ½ to 1 bu/ac 0 to ½ bu/ac –½ to 0 bu/ac < –2 bu/ac No Data
Expected Returns (bu/ac)to GRP for Soybeans

Questions?Questions?
Paul D. MitchellPaul D. Mitchell
UW-Madison Ag & Applied EconomicsUW-Madison Ag & Applied Economics
Office: (608) 265-6514Office: (608) 265-6514
Cell: (608) 320-1162Cell: (608) 320-1162
Email: [email protected]: [email protected]
Extension Web Page:Extension Web Page:
www.aae.wisc.edu/mitchell/extension.htmwww.aae.wisc.edu/mitchell/extension.htm


![fzhuang356, yin.lig@wisc.edu arXiv:2005.10411v1 [cs.CV] 21 ... · fzhuang356, yin.lig@wisc.edu Abstract We present an interpretable deep model for fine-grained visual recognition.](https://static.fdocuments.us/doc/165x107/601d6d0ea2ce7f135c48f0d5/fzhuang356-yinligwiscedu-arxiv200510411v1-cscv-21-fzhuang356-yinligwiscedu.jpg)