Critical factors for the replication of mumps virus in primary chicken embryo fibroblasts defined by...
9
BIOTECHNOLOGICAL PRODUCTS AND PROCESS ENGINEERING Critical factors for the replication of mumps virus in primary chicken embryo fibroblasts defined by the use of design of experiments (DoE) Maja Markusic & Nediljko Pavlović & Maja Šantak & Gorana Marić & Ljerka Kotarski & Dubravko Forcic Received: 9 July 2012 / Revised: 22 August 2012 / Accepted: 26 August 2012 / Published online: 21 September 2012 # Springer-Verlag 2012 Abstract Live attenuated vaccines against mumps virus (MuV) have been traditionally produced by passaging the virus in the embryonated chicken eggs or primary chicken embryo fibroblasts (CEFs). Virus propagation on these cell substrates enables successful virus attenu- ation and retains it sufficiently antigenic to induce last- ing protective immunity in humans. The aim of this study was to identify critical factors for MuV replication in primary CEFs grown on a small-scale level in order to explore possibilities for improvements in the virus replication and yield. The effect of differently prepared cells, culturing conditions, and infection conditions on virus yield was estimated by employing statistical de- sign of experiments (DoE) methodology. Our results show that the preparation of primary CEFs and the way of their infection substantially impact virus yield and are critical for efficient MuV replication. These process parameters should be considered in further pro- cess optimization. We also demonstrate the applicability of DoE in optimization of virus replication as a crucial step in obtaining high virus yields. Keywords Mumps virus . Primary chicken embryo fibroblasts . Design of experiments . Replication . Yield Introduction Mumps virus (MuV) is an enveloped, non-segmented, nega- tive stranded RNA virus from the Paramyxoviridae family and causes an acute, systemic infection involving glandular, lymphoid, and nervous tissues. Prior to the introduction of live attenuated virus vaccines, MuV was a leading cause of the virus-induced central nervous system disease (Carbone and Wolinsky 2001). Since the late 1960s, as the usage of live attenuated MuV vaccines became widespread, the number of mumps cases dramatically declined. Nowadays, the most often used vaccine strains are Jeryl Lynn, RIT 4385, UrabeAM9, L-Zagreb, and Leningrad-3 (World Health Organization (WHO) 2007). The majority of MuV vaccines have been traditionally produced by passaging the virus in the embryonated chicken eggs or primary chicken embryo fibroblasts (CEFs) (Beck et al. 1989). This propagation results in successful virus attenuation rendering the virus avirulent but sufficiently antigenic to induce lasting protective immu- nity. Rarely, human diploid cell lines (e.g., MRC-5 and KMB17) have been employed for production of live attenu- ated MuV vaccines (Glück et al. 1986; Sassani et al. 1991). Major successes in the control of many other viral diseases such as poliomyelitis, measles, and rubella were made possi- ble through the wide use of vaccines prepared in primary cell cultures (WHO 1998). Except being representative of normal tissues, primary cell cultures have the following advantages for vaccine production: they need simple media and bovine serum for preparation, they possess a broad susceptibility to M. Markusic (*) : M. Šantak : D. Forcic Molecular Biomedicine Unit, Institute of Immunology, Rockefellerova 10, 10000, Zagreb, Croatia e-mail: [email protected] N. Pavlović Research and Development Department, Institute of Immunology, Rockefellerova 10, 10000, Zagreb, Croatia G. Marić : L. Kotarski Vaccine Production Unit, Institute of Immunology, Rockefellerova 5, 10000, Zagreb, Croatia Present Address: N. Pavlović Kutrilin TPV, Radnička 173p, 10000, Zagreb, Croatia Appl Microbiol Biotechnol (2013) 97:1533–1541 DOI 10.1007/s00253-012-4394-4
Transcript of Critical factors for the replication of mumps virus in primary chicken embryo fibroblasts defined by...

BIOTECHNOLOGICAL PRODUCTS AND PROCESS ENGINEERING
Critical factors for the replication of mumps virus in primarychicken embryo fibroblasts defined by the use of designof experiments (DoE)
Maja Markusic & Nediljko Pavlović & Maja Šantak &
Gorana Marić & Ljerka Kotarski & Dubravko Forcic
Received: 9 July 2012 /Revised: 22 August 2012 /Accepted: 26 August 2012 /Published online: 21 September 2012# Springer-Verlag 2012
Abstract Live attenuated vaccines against mumps virus(MuV) have been traditionally produced by passaging thevirus in the embryonated chicken eggs or primarychicken embryo fibroblasts (CEFs). Virus propagationon these cell substrates enables successful virus attenu-ation and retains it sufficiently antigenic to induce last-ing protective immunity in humans. The aim of thisstudy was to identify critical factors for MuV replicationin primary CEFs grown on a small-scale level in orderto explore possibilities for improvements in the virusreplication and yield. The effect of differently preparedcells, culturing conditions, and infection conditions onvirus yield was estimated by employing statistical de-sign of experiments (DoE) methodology. Our resultsshow that the preparation of primary CEFs and theway of their infection substantially impact virus yieldand are critical for efficient MuV replication. Theseprocess parameters should be considered in further pro-cess optimization. We also demonstrate the applicability
of DoE in optimization of virus replication as a crucialstep in obtaining high virus yields.
Keywords Mumps virus . Primary chicken embryofibroblasts . Design of experiments . Replication . Yield
Introduction
Mumps virus (MuV) is an enveloped, non-segmented, nega-tive stranded RNA virus from the Paramyxoviridae familyand causes an acute, systemic infection involving glandular,lymphoid, and nervous tissues. Prior to the introduction of liveattenuated virus vaccines, MuV was a leading cause ofthe virus-induced central nervous system disease(Carbone and Wolinsky 2001). Since the late 1960s, asthe usage of live attenuated MuV vaccines becamewidespread, the number of mumps cases dramaticallydeclined. Nowadays, the most often used vaccine strainsare Jeryl Lynn, RIT 4385, UrabeAM9, L-Zagreb, andLeningrad-3 (World Health Organization (WHO) 2007).The majority of MuV vaccines have been traditionallyproduced by passaging the virus in the embryonatedchicken eggs or primary chicken embryo fibroblasts(CEFs) (Beck et al. 1989). This propagation results insuccessful virus attenuation rendering the virus avirulentbut sufficiently antigenic to induce lasting protective immu-nity. Rarely, human diploid cell lines (e.g., MRC-5 andKMB17) have been employed for production of live attenu-ated MuV vaccines (Glück et al. 1986; Sassani et al. 1991).
Major successes in the control of many other viral diseasessuch as poliomyelitis, measles, and rubella were made possi-ble through the wide use of vaccines prepared in primary cellcultures (WHO 1998). Except being representative of normaltissues, primary cell cultures have the following advantagesfor vaccine production: they need simple media and bovineserum for preparation, they possess a broad susceptibility to
M. Markusic (*) :M. Šantak :D. ForcicMolecular Biomedicine Unit, Institute of Immunology,Rockefellerova 10,10000, Zagreb, Croatiae-mail: [email protected]
N. PavlovićResearch and Development Department, Institute of Immunology,Rockefellerova 10,10000, Zagreb, Croatia
G. Marić : L. KotarskiVaccine Production Unit, Institute of Immunology,Rockefellerova 5,10000, Zagreb, Croatia
Present Address:N. PavlovićKutrilin TPV,Radnička 173p,10000, Zagreb, Croatia
Appl Microbiol Biotechnol (2013) 97:1533–1541DOI 10.1007/s00253-012-4394-4
different viruses, they can be grown in bioreactors using themicrocarrier method, and they give safe and effective products(WHO 1998). On the other hand, they are heterogeneous innature and therefore poorly characterized, easily contaminat-ed, and can show batch-to-batch variability. Despite theadvantages of using certified specific pathogen-free (SPF)egg-derived CEFs to produce live attenuated MuV vaccine,it is frequently found that the low titre virus vaccine produc-tion is economically costly (Monath 1999). Performing anoptimization of virus replication, a crucial step in vaccineproduction, could be a helpful strategy in order to overcomethis drawback.
The aim of this study was to identify critical factorsfor MuV replication in primary CEFs grown on a small-scale level in order to explore possibilities for improve-ments in the production of MuV vaccine. The effect ofdifferently prepared cells, culturing conditions, and in-fection conditions on virus yield was estimated byemploying statistical design of experiments (DoE) meth-odology. DoE is a systematic approach to investigate asystem or a process that allows simultaneous examina-tion of different variables in a reduced number ofexperiments (Eriksson et al. 2000). It involves a designof structured tests in which planned changes are madeto the input process variables and assesses the effects ofthese changes on a predefined output variable. Ensuringrapid generation of valid and reliable data, DoE hasfound extensive application in screening studies, optimi-zation, or modeling in the production of biopharmaceuticals ordevelopment of different bioprocesses (Mandenius andBrundin 2008).
Our results show that the procedure by which primaryCEFs are processed as well as infection method substantial-ly impact the yield of virus produced in these cells. We alsodemonstrate the applicability of DoE in improving vaccineproduction.
Materials and methods
Virus
For the assessment of virus growth, we used an exper-imental seed of MuV vaccine strain L-Zagreb producedby the Institute of Immunology Inc. Virus titre wasdeterminated by 50 % cell culture infective dose assay(CCID50 assay) in Vero cells as described in Forcic etal. (2010).
Preparation of primary CEFs
The CEFs were prepared using 11-day-old chick embryosderived from SPF eggs (Charles River, Biovo, Mohács, HU)
according to two protocols, both in compliance withWHO requests (WHO 1994). In the first protocol (P2),embryo's head, viscera, and limbs were first removed.The remaining tissue was homogenized and washedthree times with minimum essential medium withHank's salts (MEM-H) (AppliChem, Darmstadt, GE)containing 50 μL/mL of neomycin (N) (Gibco,Invitrogen Corporation, Carlsbad, CA). The tissue wastrypsinized three times for 15 min at 37 °C and thetrypsin was neutralized with MEM-H(N) supplementedwith 10 % fetal calf serum (FCS). The cells were thencentrifuged, resuspended in fresh MEM-H(N) containing10 % FCS, and filtered.
The second protocol (P1) did not remove embryo's limbs,trypsinization was performed once for 30 min at 35 °C, andcells were filtered without previous centrifugation. Each pro-tocol was performed using sterile filtered and heat-inactivatedFCS from two suppliers, Gibco (Invitrogen Corporation,Carlsbad, CA) and Morgate (Morgate Biotech, Bulimba,Australia).
Determination of cell viability
The CEFs were seeded at two densities (0.1×10⁵ or1.2×105 cells/cm2) in six-well plates in 3 mL ofMEM-H(N) supplemented with 2 or 10 % FCS (Gibcoor Morgate) according to experiment specification(Tables 1 and 2). The plates were incubated at 33 or37 °C with 5 % CO2. After 24 h of incubation, theculture medium was removed and cells were incubatedin fresh medium for the next 48 to 72 h.
At 24, 48, 72, and 96 h after cell seeding, the countof viable cells was determinated by the trypan bluestaining method for each experiment. One hundredmicroliters of cell suspension was mixed with 900 μLof 0.4 % trypan blue solution (Sigma Chemical Co, St.Louis, MO) and viable, unstained cells were countedon the Neubauer hemacytometer. The population
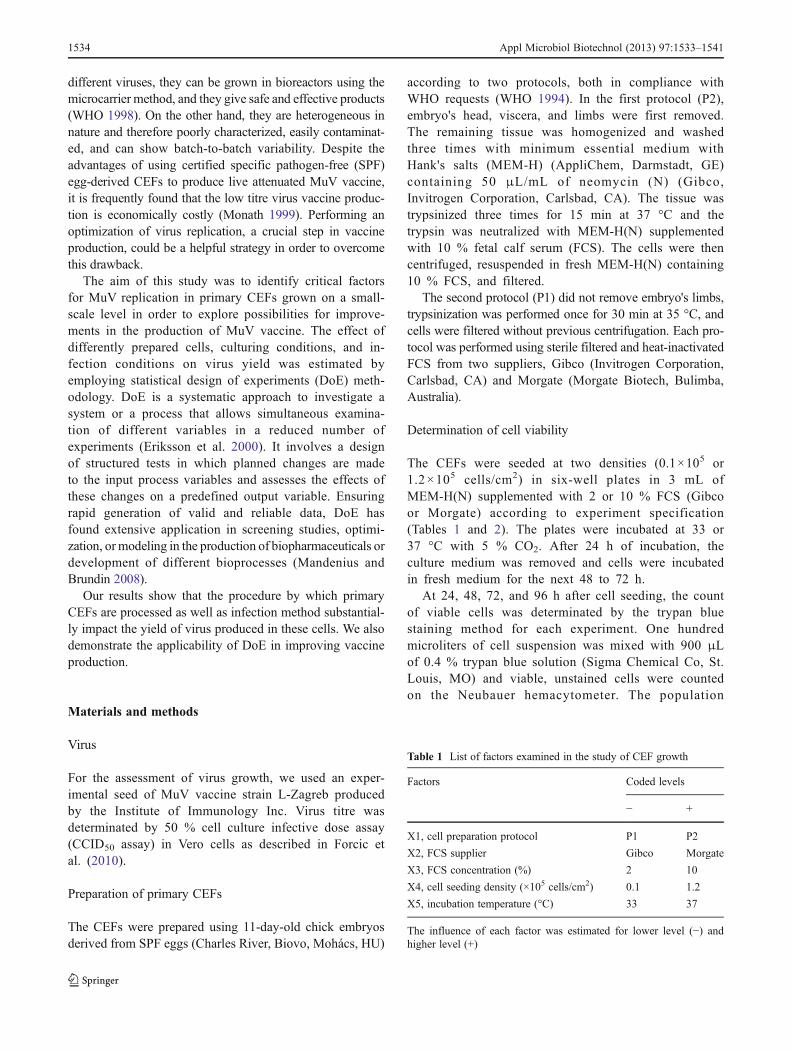
Table 1 List of factors examined in the study of CEF growth
Factors Coded levels
− +
X1, cell preparation protocol P1 P2
X2, FCS supplier Gibco Morgate
X3, FCS concentration (%) 2 10
X4, cell seeding density (×105 cells/cm2) 0.1 1.2
X5, incubation temperature (°C) 33 37
The influence of each factor was estimated for lower level (−) andhigher level (+)
1534 Appl Microbiol Biotechnol (2013) 97:1533–1541

doubling (PD) within a single passage was estimatedusing formula
PD ¼ 3:33� logN
N0
� �ð1Þ
where N is a number of viable cells in the well at thetime of counting and N0 is a number of attached cells24 h after seeding (Schaeffer 1990).
At same time points after cell seeding, the 3-(4,5-dimethylthiazol-2-yl)-2,5-diphenyltetrazolium bromide(MTT) assay was performed. Cell media were removedand 450 μL of fresh media was added together with50 μL of MTT (Sigma Chemical Co, St Louis, MO) inphosphate-buffered saline (5 mg/mL). Four hours fol-lowing incubation of cells at specified temperature (33or 37 °C), the media were removed. Formazan crystalswere solubilized by the addition of 500 μL of dimethylsulfoxide (Sigma Chemical Co, St Louis, MO) for10 min at room temperature. One hundred microlitersof purple suspension from each well was transferred toone well in 96-well microtitre plate and color intensitywas quantified spectrophotometrically at 560 nm.
Infection of CEFs
CEFs were infected in a monolayer (method A) or in sus-pension (method B) as depicted in Fig. 1. Collected virusharvests were centrifuged at 1,361×g for 7 min and the virusinfectivity in the supernatant was stabilized by the additionof sorbitol to a final concentration of 5 %. The virus harvests
were then stored at −80 °C until they were taken for titredetermination.
Estimation of main effects and statistical analysis
Estimation of main effects and their interactions was performedby “StatSoft, Inc. Statistica 6.1” according to the formula
EX ¼ 2P
Yþ
n� 2
PY�
nð2Þ
where x stands for factors 1–5 (in the study of cell growth) orfactors 1–3 (in the study of virus replication), n is a number ofexperiments (16 in the study of cell growth or 8 in the study of
virus replication),Yþis a response value obtained for factor set
on its (+) level and Y�is a response value obtained for the
same factor set on its (−) level.Analysis of estimated effects was first performed
graphically with half-normal diagram. A z value usedfor its construction was calculated using formulas
z ¼ norminvðx;m; sÞ ð3Þ
x ¼ 3nþ 3r � 1ð Þ6nþ 1ð Þ ð4Þ
where norminv (x, m, s) is an inverse cumulative nor-mal distribution function and arguments x is probability,m is mean (m00), and s is standard deviation of distribution
Table 2 Fractional factorial de-sign (25−1) used for assessmentof CEF growth and obtainedresults (PD and relative absor-bance) for cells 72 h afterseeding
PD population doublingsaPopulation doublings within asingle passage; a ratio of a cellnumber at 72 h after seeding andcell number at 24 h after seeding(see “Materials and methods”)bFold increase in absorbance(λ0560 nm) against blank wellscontaining medium only
Experiment number Coded levels Results
X1 X2 X3 X4 X5 PDa Relative absorbanceb
1 − − − − + 0.365 34.4
2 + − − − − 0.311 10.3
3 − + − − − −0.059 13.2
4 + + − − + −0.362 17.1
5 − − + − − −0.947 8.3
6 + − + − + 0.196 14.4
7 − + + − + 0.873 18.6
8 + + + − − −0.625 5.9
9 − − − + − 0.235 78.6
10 + − − + + 1.348 120.6
11 − + − + + 1.351 135.5
12 + + − + − 0.205 84.9
13 − − + + + 1.365 138.2
14 + − + + − −0.205 85.1
15 − + + + − −0.239 139
16 + + + + + 0.926 170.7
Appl Microbiol Biotechnol (2013) 97:1533–1541 1535

(s01). For probability (x) calculation, n stands for the totalnumber of effects and r represents ordinal number of certaineffect when effects are sorted by absolute values, from thelowest to the highest.
For estimation of statistical significance of effects, astandard error (SE)e was calculated from negligible interac-tions using Dong's algorithm (Vander Heyden et al. 2001)based on following formulas
s0 ¼ 1:5� median EXj j ð5Þfor initial estimation of standard error,
EXj j � 2:5� s0 ð6Þfor selection of negligible effects,
SEð Þe ¼ffiffiffiffiffiffiffiffiffiffiffiffiffiffiffiffiffiffiP
EnXð Þ2
Nn
sð7Þ
for calculation of (SE)e, whereP
EnX
� �2is the sum of
squares of negligible effects which fulfill the selection cri-teria and Nn is their number.
For identification of statistically significant effects, at value for each main effect was calculated using for-mula
t ¼ EXj jSEð Þe
: ð8Þ
Absolute values of effects and corresponding t valueswere then compared with critical values tCrit and ECrit whichwere calculated using formulas
tCrit ¼ TINV ða;DFÞ ð9Þ
ECrit ¼ tCrit SEð Þe ð10Þwhere α stands for the level of significance (α00.05) andDF for degrees of freedom. The effect was consideredstatistically significant for chosen level of significance α ifEXj j > ECrit or t>tCrit.
Incubation for 72 hours
Incubation for 48 hoursafter serum removal
Incubation for 24 hoursafter serum removal
Incubation for 48 hoursafter serum removal
Incubation for 24 hoursafter serum removal
Incubation for 48 hours
Incubation for 24 hours
P2(experiments 1 and 5)
P1(experiments 2 and 6)
- exchanging media
Infection method A Infection method B
- removing media and infection with MuV at MOI 0.03
- virus adsorption for 1 h at 32°C and 0% CO2
- adding MEM-H(N)+2% FCS up to 30 mL- incubation at 32°C and 0% CO2
- removing media- removing serum by triple washing with MEM-
H(0)- adding 30 mL of MEM-H(0)- incubation at 32°C and 0% CO2
- collecting first harvest in experiments 1and 2- adding 30 mL of MEM-H(0)- incubation at 32°C and 0% CO2
- collecting further harvests in experiments 1 and2 every 24 hours
- collecting first harvest in experiments 5 and 6- adding 30 mL of MEM-H(0)- incubation at 32°C and 0% CO2
- collecting further harvests in experiments 5 and 6 every 48 hours
P1(experiments 4 and 8)
P2(experiments 3 and 7)
- incubation at 35°C and 0% CO2
- removing media- removing serum by triple washing with MEM-
H(0)- adding 30 mL of MEM-H(0)- incubation at 32°C and 0% CO2
- collecting first harvest in experiments 3 and 4 - adding 30 mL of MEM-H(0)- incubation at 32°C and 0% CO2
- collecting further harvests in experiments 3 and4 every 24 hours
- collecting first harvest in experiments 7 and 8 - adding 30 mL of MEM-H(0)- incubation at 32°C and 0% CO2
- collecting further harvests in experiments 7 and 8 every 48 hours
-cell seeding at density 1x10⁵ cells/cm2
in 30 mL of MEM-H(N)+10% FCS at 37°C and 0% CO2
-cell seeding at density 1.5x10⁵ cells/cm2
+infection with MuV at MOI 0.03
in 30 mL of MEM-H(N)+10% FCS at 37°C and 0% CO2
Fig. 1 Two methods used forinfection of CEFs with MuV
1536 Appl Microbiol Biotechnol (2013) 97:1533–1541

Calculation of maximal process capacity and productivity
For the calculation of maximal capacity of virus productionCmax (kilo dose/T-flask) and maximal productivity Pmax
(kilo dose/day/T-flask), the following formulas were used:
Cmax ¼ Anti log THPAnti log 3:7
ð11Þ
Pmax ¼ Cmax � 24
tð12Þ
where THP stands for the total virus titre in a harvest pool(CCID50), 3.7 log CCID50 represents one virus dose, and t isa cumulative time from the beginning of infection to the lastharvest.
Results
Identification of critical factors for growth of primary CEFs
In order to identify critical parameters for replication ofMuV in CEFs, we first assessed the influence of differentcell preparation protocols and incubation conditions on cellgrowth. The following parameters for establishment of via-ble CEF culture were examined: cell preparation protocol(X1), FCS of two different suppliers (X2), FCS concentra-tion (X3), cell seeding density (X4), and temperature for cellincubation (X5). Each factor was evaluated at two levels,higher and lower, which were marked with + and −, respec-tively (Table 1). A fractional factorial design (25−1) wasapplied to enable concurrent study of these five factors inonly 16 experiments (Table 2) instead of 32 experimentsrequired to examine all possible factor combinations.According to this design, the main effects of factors cannotbe confounded with interactions of two or three factors,possibly only with interaction of four or more factors whichare less likely to happen (NIST/SEMATECH 2012).
For each combination of factors, the cells were seeded inthree wells of a six-well cell culture plate. The cells werevisually inspected 24, 48, 72, and 96 h after seeding andwere collected at each time point for determination of thenumber of viable cells. The cell number at each time pointwas further used for estimation of PD within a single pas-sage for each experiment which then served as a responsevariable (Table 2). Additionally, to exclude potential errorsof individual read-outs of cell number, more sensitive andquantitative MTT assay was employed. In MTT assay, ab-sorbance intensity measured for each experiment reflectedcell activity. Because 80–90 % of the cell monolayer con-fluence is a prerequisite for virus inoculation for which thesecells will be used, only PD values and absorbance readings
obtained for cells at 72 and 96 h after seeding (when the celllayers were confluent enough) were considered as relevantresponse variables (Table 2).
To identify which factors are critical for cell growth, themain effect of each factor was first estimated by StatSoft,Inc. Statistica 6.1 software. The significance of calculatedeffects was analyzed using half-normal probability plot(Fig. 2a). Generally, unimportant effects and interactionscluster along the line, while significant effects and interac-tions lie outside the line of randomness on a half-normalprobability plot. It can be seen that factors X4 (cell seedingdensity) and X5 (incubation temperature) have positiveeffects on cell growth as they lie far off the line whichrepresents half-normality or unimportant factors and arewell-displaced from zero (Fig. 2a; effects on PD at 72 hafter cell seeding is shown). The statistical significance ofeffects was determinated by Student's t test giving p valuesof 0.018 and 0.002 (for effects on PD) and 0.000 and 0.017(for effects on absorbance) for X4 and X5, respectively(Table 3). A positive effect of factor on response variableindicates that an increase in the levels of that factor leads toan increase in response variable and vice versa. Here, itmeans that seeding cells at higher density (1.2×10⁵ cells/cm2) and incubating them at 37 °C would improve theirquality, with respect to cell viability and growth, and there-fore make them a better cell substrate for virus inoculation.
In addition, the statistical significance of observed out-laying effects was analyzed by employing Dong's algorithmwhich showed that absolute values of both effects (of factorX4 and X5) are higher than ECrit confirming their positiveeffect on cell growth (Fig. 2). Cell preparation protocol(X1), serum supplier (X2), and serum concentration (X3)did not have significant influence on cell growth. The com-parable results were obtained for effects on cell growthmeasured at 96 h after cell seeding (not shown).
Assessment of MuV replication in CEFs
In a second part of our study, we assessed MuV replication inCEFs. A full factorial design (23) was employed in order toinvestigate an influence of three factors on virus replication:cell preparation protocol (X1), infection method (X2), andtime interval between consecutive virus harvests (X3).Again, each factor was examined at two levels resulting ineight experiments (Table 4). For the reliability of results, theentire study was repeated four times. The optimal conditionsfor establishment of a viable primary CEF culture regardingcell seeding density and temperature of incubation were used(see “Materials and methods”). Although cell preparationprotocol (X1) was not crucial for successful cell growth, itwas here taken in account assuming that uniformity of cellculture would be important for efficient virus replication. Fiveharvests were collected for each experiment. The virus titre
Appl Microbiol Biotechnol (2013) 97:1533–1541 1537

was determined in a harvest pool for each experiment and wassubsequently used for calculation of maximal process produc-tivity represented as a number of virus kilo doses per day andper 75 cm2 T-flask (Table 5).
The effect of each factor on the titre in a harvest pool andmaximal process productivity was estimated following thesame procedure as described for the study of cell growth.The absolute values of main effects and interactions wereplotted against their half-normal values on a half-normalprobability plot. The factors X1 (cell preparation protocol)and X2 (infection method) were shown to have positiveeffect on MuV replication because they were being dis-placed off the line of randomness (Fig. 3a). The statisticalsignificance was again determinated by Student's t test giv-ing p values of 0.003 and 0.017 for X1 and X2, respectively
(Table 6). These results indicate that using factors X1 andX2 at their higher levels, meaning cell preparation protocol2 (P2) and infection in suspension (method B), would great-ly improve virus replication in CEFs and process productiv-ity. Similarly, Dong's statistics confirmed that both of thesefactors are critical for virus replication as absolute values ofboth effects were higher than ECrit (Fig. 3). On the otherhand, factor X3 (harvest time interval) did not show anyimportant influence giving p value of 0.720 (Table 6) andabsolute effect lower than ECrit (Fig. 3).
To adduce more clearly the space for improvements interms of process capacity and productivity, maximal capac-ities obtained for each experiment were plotted againstcorresponding maximal productivities (Fig. 4). It can beseen that by performing infection with factors X1 and X2
Table 3 Estimated main effectson cell growth at 72 h afterseeding (PD and absorbance in-crease) and corresponding tstatistics
Significant effect with p value<0.05 is shown in bold
Factors PD Relative absorbance
Effect t value p Effect t value p
X1, cell preparation protocol −0.144 0.625 0.546 −7.098 −0.724 0.486
X2, FCS supplier −0.075 0.325 0.752 11.845 1.208 0.255
X3, FCS concentration (%) −0.256 1.114 0.291 10.697 1.091 0.301
X4, cell seeding density (×105 cells/cm2) 0.654 2.841 0.018 103.804 10.588 0.000
X5, incubation temperature (°C) 0.923 4.010 0.002 28.022 2.858 0.017
Absolute Effect |Ex|
0.0 0.2 0.4 0.6 0.8 1.0
X5 = Incubation temperature
X4 = Cell seeding density
X3 = FCS concentration
X1 = Cell preparation protocol
X2 = FCS supplier Negative effectPositive effect
ECrit = 0.513; =0.05
Z-value
0.0 0.5 1.0 1.5 2.0 2.5
Abs
olut
e ef
fect
IExI
0.0
0.2
0.4
0.6
0.8
1.0Main effectsInteractions
X4
X5
ECrit = 0.513; =0.05
a
b
Fig. 2 a Half-normal probabil-ity plot for five factors investi-gated in the study of cell growthby fractional factorial design. Astraight line is drawn throughthe nonsignificant effects. bPareto plot with absolute valueof main effect for each factor(Ex) presented by horizontalcolumns. ECrit value for 0.05level of significance is shownby a dashed line
1538 Appl Microbiol Biotechnol (2013) 97:1533–1541

set at their higher levels (experiments 4 and 8), 50–70-foldincrease in capacity and productivity is obtained comparedto results obtained with the same factors set on their lowerlevels (experiments 1 and 5).
Discussion
The common procedure for production of live attenuatedMuV vaccine as well as many other viral vaccines such asmeasles virus, Japanese encephalitis virus, rabies virus, yel-low fever virus, influenza virus, or modified vaccinia virusAnkara vaccine has been using primary CEFs as a cellsubstrate (Escoffier and Gerlier 1999; Freire et al. 2005;Mayr et al. 1975). Viability of these cells and their ability tosupport virus replication is a crucial factor for economicallysustainable vaccine production which should be optimized inorder to give high and robust virus yield.
In this study, we applied the DoE methodology to deter-mine critical parameters for MuV replication in primaryCEF culture. The advantage of this approach over conven-tional method which examines effect of one variable at atime is simultaneous assessing the influence of several dif-ferent variables on certain process in a reduced number of
experiments. Our study was divided in two research areas:identification of critical factors for establishment of primaryCEF culture and then for virus growth in primary CEFculture. A different DoE format was applied for each re-search area.
Five factors that might affect cell growth were examinedin fractional factorial design consisting of 16 experiments. Atemperature for cell incubation as well as cell seeding den-sity were shown to be critical for cell growth measured bytrypan blue exclusion method and MTT assay (Fig. 2). Ourresults show that incubating cells at 37 °C at concentrationof 1.2×10⁵cells/cm2 is convenient way for obtaining con-fluent monolayers of primary CEFs. Interestingly, two pro-tocols for cell preparation differing in trypsin treatment,limb removal, and centrifugation step did not exert signifi-cant effect on cell growth. However, cell cultures obtainedby these protocols could be easily distinguished by theirmorphology and uniformity of a cell layer (not shown).Cell preparation protocol 1 resulted in more heterogeneouscell layer which could influence virus replication. Thisobservation prompted us to include both procedures in as-sessment of virus growth.
Full factorial design consisting of eight experiments wasemployed for estimating effects of three potentially criticalfactors on MuV replication in primary CEFs. Confirming ourhypothesis, cell preparation protocol had statistically signifi-cant effect on virus yield and method leading to more homog-enous cell culture (P2) was shown to be better option for virusreplication (Fig. 3). This result indicates that differences in theprocedure for preparation of CEFs strongly impact virus rep-lication and should therefore be carefully optimized in order toobtain robust and high virus yields. Although infection on acell layer is most commonly used method for growing viruses,infection in a cell suspension was also evaluated. Confirmingobservations of Smorodintsev et al. (1965), our results showedthat infecting cells in suspension (method B) has a positive
Table 4 List of factors examined in the study of MuV replication inCEFs
Factors Coded levels
− +
X1, cell preparation protocol P1 P2
X2, infection method A B
X3, harvest time interval (h) 24 48
The influence of each factor was estimated for lower level (−) andhigher level (+)
Table 5 Full factorial design (23) matrix used for assessment of MuV replication in CEFs
Experiment number Coded levels Titre in harvest pool (logCCID50/mL)a Productivity (kilo dose/T-flask/day)a
X1 X2 X3
1 − − − 5.855±0.078 0.339±0.069
2 + − − 7.292±0.062 9.058±1.266
3 − + − 6.991±0.053 4.568±0.562
4 + + − 7.647±0.106 22.385±6.411
5 − − + 5.697±0.136 0.153±0.051
6 + − + 7.392±0.105 7.198±1.619
7 − + + 7.170±0.053 4.185±0.499
8 + + + 7.567±0.092 10.781±2.368
Results obtained for each experiment are expressed as virus titre in harvest pool and process productivitya A mean value from four blocks of experiments±SE is shown
Appl Microbiol Biotechnol (2013) 97:1533–1541 1539

effect on virus yield compared to infection on a cell layer. Inexperiments which included cell preparation protocol 2 andinfection in suspension, virus titres in a harvest pool werehigher than 7 logCCID50/mL (7.65 and 7.57 logCCID50/mLfor experiments 4 and 8, respectively) while up to 2 log lowertitre was obtained in experiments performed with cell prepa-ration protocol 1 and infection on a cell layer (5.86 and 5.70logCCID50/mL for experiments 1 and 5, respectively). Theseresults demonstrate that primary CEFs can efficiently supportMuV replication yielding even higher titres than described forvarious continuous cell lines (<6.3 logPFU/mL) (Afzal et al.2005) or human diploid cells (<6.25 logCCID50/mL) (Sassaniet al. 1991; Liang et al. 2010). Additionally, the process
productivity was calculated for one T-flask per day for eachexperimental option and the values clearly showed that byapplying cell preparation protocol 2 and infection in suspen-sion, 50–70-fold increase in productivity could be obtained(Fig. 4). Our results suggest that the current MuV vaccine
Z-value
0.0 0.5 1.0 1.5 2.0
Abs
olut
e E
ffect
IE
xI
(k
dose
/day
)
0
2
4
6
8
10
12
14
16Main effectsInteractions X1
X2
ECrit = 5.646; = 0.05
Absolute Effect |Ex| (k dose/day)
0 2 4 6 8 10 12 14 16
X3=Harvest time interval
X2*X3
X1*X3
X1*X2*X3
X1*X2
X2=Infection Method
X1=Cell Preparation Protocol
Positive EffectNegative Effect
ECrit = 5.646; =0.05
a
b
Fig. 3 a Half-normal probabil-ity plot for three factors inves-tigated in the study of virusreplication by full factorial de-sign. A straight line is drawnthrough the nonsignificanteffects. b Pareto plot with ab-solute value of main effect foreach factor (Ex) presented byhorizontal columns. ECrit valuefor 0.05 level of significance isshown by a dashed line
Table 6 Estimated main effects on process productivity andcorresponding t statistics
Factors Productivity (kilo dose/T-flask/day)
Effect t value p
X1, cell preparation protocol 13.741 6.757 0.003
X2, infection method 8.038 3.952 0.017
X3, harvest time interval (h) −0.784 0.385 0.720
Significant effect with p value <0.05 is shown in bold
Maximal capacity [ k dose/T-flask ]
1 10 100 Max
imal
pro
duct
ivity
[ k
dose
/ T
-fla
sk/d
ay ]
0.1
1
10
1
5
3
6
4
8
2
7
Fig. 4 Mean maximal productivity versus mean maximal capacity forone 75 cm2 T-flask obtained with different combinations of experi-mental conditions (1–8); SE for four independent studies is shown byhorizontal and vertical bars
1540 Appl Microbiol Biotechnol (2013) 97:1533–1541

production in CEFs can be improved by increasing virus titre(productivity) and hence cost-effectiveness.
In conclusion, by defining critical process factors for MuVreplication in CEFs using DoE approach, we show that MuVyields can be greatly improved. Determination of these param-eters represents the basis for process optimization that couldlead to productivity increase and consequently reduction ofcosts in production of live attenuated MuV vaccine.
Acknowledgments This work was supported by the Ministry ofScience, Education and Sports of the Republic of Croatia, grant number021-0212432-3123 (to M.Š.).
Conflict of interest The authors declare that they have no conflict ofinterest.
References
Afzal MA, Dussupt V, Minor PD, Pipkin PA, Fleck R, Hockley DJ,Stacey GN (2005) Assessment of mumps virus growth on variouscontinuous cell lines by virological, immunological, molecularand morphological investigations. J Virol Methods 126:149–156
Beck M, Welsz-Malecek R, Mesko-Prejac M, Radman V, Juzbasic M,Rajninger-Miholic M, Prislin-Musklic M, Dobrovsak-Sourek V,Smerdel S, Stainer DW (1989) Mumps vaccine L-Zagreb, pre-pared in chick fibroblasts. I. Production and field trials. J BiolStand 17:85–90
Carbone KM, Wolinsky JS (2001) Mumps virus. In: Knipe DM,Howley PM (eds) Fields-virology, 4th edn. Lippincott-Raven,Philadelphia, pp 1381–1400
Eriksson L, Johansson E, Kettaneh-Wold N, Wikström C, Wold S(2000) Design of experiments, principles and applications. Ume-trics AB, Stockholm
Escoffier C, Gerlier D (1999) Infection of chicken embryonic fibro-blasts by measles virus: adaptation at the virus entry level. J Virol73:5220–5224
Forcic D, Košutić-Gulija T, Šantak M, Jug R, Ivancic-Jelecki J,Markusic M, Mažuran M (2010) Comparisons of mumps viruspotency estimates obtained by 50% cell culture infective dose assayand plaque assay. Vaccine 28:1887–1892
Freire MS, Mann GF, Marchevsky RS, Yamamura AM, Almeida LF,Jabor AV, Malachias JM, Coutinho ES, Galler R (2005) Produc-tion of yellow fever 17DD vaccine virus in primary culture ofchicken embryo fibroblasts: yields, thermo and genetic stability,attenuation and immunogenicity. Vaccine 23:2501–2512
Glück R, Hoskins JM, Wegmann A, Just M, Germanier R (1986)Rubini, a new live attenuated mumps vaccine virus strain forhuman diploid cells. Dev Biol Stand 65:29–35
Liang Y, Ma S, Liu L, Zhao H, Wang L, Jiang L, Xie Z, Dong C, Li Q(2010) Identification and development of a promising novelmumps vaccine candidate strain. Microbes Infect 12:1178–1187
Mandenius CF, Brundin A (2008) Bioprocess optimization usingdesign-of-experiments methodology. Biotechnol Prog24:1191–1203
Mayr A, Hochstein-Mintzel V, Stickl H (1975) Abstammung, eigen-schaften und verwendung des attenuierten vaccinia-stammesMVA [Passage history, properties, and applicability of the atten-uated vaccinia virus strain MVA]. Infection 3:6–14
Monath TP (1999) Yellow fever. In: Plotkin SA, Orenstein WA (eds)Vaccines, 3rd edn. Saunders, New York, pp 815–998
NIST/SEMATECH e-Handbook of Statistical Methods (2012). http://www.itl.nist.gov/div898/handbook/index.htm. Accessed 12Apr 2012
Sassani A, Mirchamsy H, Shafyi A, Ahourai P, Razavi J, Gholami MR,Mohammadi A, Ezzi A, Rahmani M, Fateh G (1991) Develop-ment of a new live attenuated mumps virus vaccine in humandiploid cells. Biologicals 19:203–211
Schaeffer WI (1990) Terminology associated with cell, tissue, andorgan culture, molecular biology, and molecular genetics. Tissueculture association terminology committee. In Vitro Cell Dev Biol26:97–101
Smorodinstev AA, Luzyanina TY, Mikutskaya BA (1965) Data on theefficiency of live mumps vaccine from chick embryo cell cultures.Acta Virol 9:240–247
Vander Heyden Y, Nijhuis A, Smeyers-Verbeke J, Vandeginste BG,Massart DL (2001) Guidance for robustness/ruggedness tests inmethod validation. J Pharm Biomed Anal 24:723–753
World Health Organization (1994) Requirements for measles, mumpsand rubella vaccines and combined vaccine (live). WHO Techni-cal Report Series 840
World Health Organization (1998) Requirements for the use of animalcells as in vitro substrates for the production of biological. WHOTechnical Report Series 878
World Health Organization (2007) Outbreak news: mumps virusvaccines. Wkly Epidemiol Rec 7:51–60
Appl Microbiol Biotechnol (2013) 97:1533–1541 1541