Critical Evaluation of Advertising Effect on the Consumer .... Prity Saxena Sikandrabad.pdfCritical...
14
International Journal of Trade & Commerce-IIARTC July-December 2017, Volume 6, No. 2 pp. 396-410 © SGSR. (www.sgsrjournals.co.in) All rights reserved UGC Approved Journal in Social Science Category; Journal No. 48636 COSMOS (Germany) JIF: 5.135; ISRA JIF: 4.816; NAAS Rating 3.55; ISI JIF: 3.721 *Corresponding Author Critical Evaluation of Advertising Effect on the Consumer Behaviour towards Passengers Cars Abstract This paper explores the consumer behaviour towards passenger cars in Moradabad Region. The scope of the study is limited to certain advertising effect on important consumer behavioural aspects like information search and evaluation, brand preference and brand loyalty and factors of motivation. Understanding the customer’s satisfaction of the product will help the automobile manufacturer in developing their products to meet customer’s needs and designing the proper marketing programs and strategy. Keywords: Consumer Behaviour, Automobile Industry, Purchase decision, Brand choice. PAPER/ARTICLE INFO RECEIVED ON: 17/07/2017 ACCEPTED ON: 17/08/2017 Preeti Saxena a Neha Garh b a, b Department of Commerce, JS (P.G.) College, Sikandrabad, Dist. Bulandshahar. Email Id: [email protected] Reference to this paper should be made as follows: Preeti Saxena, Neha Garg (2017), “Critical Evaluation of Advertising Effect on the Consumer Behaviour towards Passengers Cars”, Int. J. of Trade and Commerce- IIARTC, Vol. 6, No. 2, pp. 396-410
Transcript of Critical Evaluation of Advertising Effect on the Consumer .... Prity Saxena Sikandrabad.pdfCritical...

International Journal of Trade & Commerce-IIARTC July-December 2017, Volume 6, No. 2 pp. 396-410 © SGSR. (www.sgsrjournals.co.in) All rights reserved
UGC Approved Journal in Social Science Category; Journal No. 48636 COSMOS (Germany) JIF: 5.135; ISRA JIF: 4.816; NAAS Rating 3.55; ISI JIF: 3.721
*Corresponding Author
Critical Evaluation of Advertising Effect on the Consumer Behaviour towards Passengers Cars
Abstract
This paper explores the consumer behaviour towards passenger cars in Moradabad Region. The scope of the study is limited to certain advertising effect on important consumer behavioural aspects like information search and evaluation, brand preference and brand loyalty and factors of motivation. Understanding the customer’s satisfaction of the product will help the automobile manufacturer in developing their products to meet customer’s needs and designing the proper marketing programs and strategy. Keywords: Consumer Behaviour, Automobile Industry, Purchase decision, Brand choice.
PAPER/ARTICLE INFO RECEIVED ON: 17/07/2017 ACCEPTED ON: 17/08/2017
Preeti Saxenaa Neha Garhb
a, bDepartment of Commerce, JS (P.G.) College, Sikandrabad, Dist. Bulandshahar. Email Id: [email protected]
Reference to this paper should be made as follows:
Preeti Saxena, Neha Garg
(2017), “Critical Evaluation of Advertising Effect on the Consumer Behaviour towards Passengers Cars”, Int. J. of Trade and Commerce-IIARTC, Vol. 6, No. 2, pp. 396-410

Critical Evaluation of Advertising Effect on the Consumer Behaviour towards Passengers Cars
Preeti Saxena, Neha Garg
-397-
UGC (Ministry of HRD, Govt. of India) Approved Journal in Social Science Category; Journal No. 48636
1. INTRODUCTION Today the automobile industry is one of the growing and profit generating industry. Due to easy finance available in the market and increase in the disposable income of the people, sales of the passenger cars have increased. As the competition is increasing day by day, new players are entering into the market with their new innovation to attract the potential buyers in the market. The buying behaviour of customer can be studied by knowing their perception about the cars in the market. Basically it is the need to find out what customer expects and what is being offered to them. When a customer is satisfied with the product or service, he recommends that product and service to another prospective customer. According to recent reports, India overtook Brazil and became the sixth largest passenger vehicle producer in the world (beating such old and new auto makers countries such as Belgium, United Kingdom, Italy, Canada, Mexico, Russia, Spain, France and Brazil), grew 16 to 18 percent to sell more than four million units in the period August 2016-August 2017 shown in Table 1.
Table No. 1: Car Manufacturer Charts Manufacturer Aug
16 Sep 16 Oct 16 Nov 16 Dec 16 Jan 17 Feb 17 Mar 17 Apr 17 May 17 Jun 17 Jul 17 Aug 17 %
Share
Maruti 116868 134762 123679 126220 106388 133768 120599 127695 144081 130248 93057 153298 151270 52.14 Hyundai 41967 41216 47566 37545 39201 42017 42327 44757 44758 42007 37562 43007 47103 16.24 Mahindra 17115 19158 23181 12389 15716 19152 18972 23068 17802 18735 15020 18331 17609 6.07 Honda 13651 14773 15069 7928 9920 15529 14565 18950 14480 11278 12804 17085 17365 5.99 Tata 13024 14620 16412 12730 10846 12906 12277 15433 12827 10855 11176 14933 14340 4.94 Toyota 12801 12067 11651 11309 12747 10336 11543 13796 12964 10914 1973 17758 12017 4.14 Renault 12972 12143 12409 9604 11244 8787 11190 12188 9545 8639 6840 8961 9585 3.30 Ford 8548 9018 7508 6876 5566 7995 8338 8700 7618 6742 6149 8418 7777 2.68 Volkswagen 4447 3929 5534 4014 4348 4060 3965 4792 3673 3231 3870 4753 4159 1.43 Datsun 4767 3970 4702 2987 2535 3239 3609 4141 3076 2544 3377 3478 3701 1.28 Jeep 935 2020 0.70 Skoda 1208 1216 1468 860 1042 1220 1206 1695 1372 1064 1018 1417 1756 0.61 Nissan 1151 987 1404 985 1177 1103 1198 1168 1141 1163 1204 882 1080 0.37 Fiat 651 602 646 266 390 288 319 353 292 340 210 185 239 0.08 HM-Mitsubishi
70 68 37 30 69 52 24 63 0.02
Chevorlet 1801 2101 3001 2808 3020 1808 1809 1318 883 361 672 565 18 0.01 Total 251041 270630 274230 236521 224177 262238 251917 278123 274564 248145 194932 294006 290102 100.00
Source:http://www.team-bhp.com/forum/indian-car-scene/190073-august-2017-indian-car-sales-figures-analysis.html Top Five Automobile Manufactures in India are: 1. Maruti Suzuki Pvt. Ltd. 2. Hyundai Motor India 3. Ford India Ltd. 4. Honda Motor India Pvt. Ltd. 5. Tata Motors Pvt. Ltd. In India, there are about sixteen manufacturers in passenger car segment. Top Automobile (Passenger Vehicle) Companies in India by market share from August 2016 to August 2017 as per India Car Sales Figure Analysis is shown in Table 1. Some of the facts about these top players are summarized as: 1. Maruti Suzuki (52.14% Market Share): Customers lovingly call it as the

Critical Evaluation of Advertising Effect on the Consumer Behaviour towards Passengers Cars
Preeti Saxena, Neha Garg
-398-
UGC (Ministry of HRD, Govt. of India) Approved Journal in Social Science Category; Journal No. 48636
people’s car; since last three decades Maruti Suzuki has refined the way towards plying on roads by people. 2. Hyundai Motors India Limited (16.24% Market Share): The main feature of this manufacturer is the position in car export market. Also it is the second largest manufacturer of cars in India. 3. Mahindra & Mahindra (6.07% Market Share): It is ranked amongst the top three in passenger segment, a leader in commercial vehicle. The latest entry in the Indian Automobile Passenger Vehicle segment is Jeep. Out of Top five model sold in the month of September 2017, four are from the number one car manufacturer Maruti. These are Dzire 34305 units, Alto 23830 units, Baleno 16238 units, WagonR 14649 units and only the fifth entrant in the list is i10Grand with 14099 units. The main factor behind the growth of the Indian Automobile Passenger Vehicle segment is availability of finance that influences buying behaviour of passenger car customers in our country. As per the most recent market information accessible on the Indian auto market, it is estimated that roughly 10% - 20% of all cars purchased are bought on a cash transaction basis & the remaining 80% to 90% are funded by an assortment of means of financing such as automobile loans, car hire, operating leases and so forth. Obviously the means of funding preferred by the majority Indian auto owners is a car loan, although car leasing is also becoming the funding means of choice for the corporate sector.
3. REVIEW OF LITERATURE
Vandana Gupta & Others (2017), studied Indian Automobile passenger car market is witnessed by the presence of many national and multi-national manufactures post liberalization 1991. The objective of their study is to investigate those differentiating parameter and effect of reference group that influence the consumer buying behaviour of car owners within the city of Delhi/NCR. The primary data was collected from 197 respondents, located in Delhi/NCR region using convenience sampling. They revealed the strong influence of attributes like price, fuel efficiency on the buying decision of the consumer and importance of reference group.
Sangeeta Gupta (2013) reveals that the reference group plays an important role in influencing the car purchase decision. This group which includes family, friends and relatives is a significant source of information and influence. Some of the other factors which influence the purchase decision are promotional offers and fuel efficiency. As per the study, the three attributes – fuel efficiency, price and powerful engine are considered most important by the customers. With the changing market dynamics, information available on the internet also appears in the list of influencers in the car purchase decision.
Arpita Srivastava and Mitu Matta (2014), explored the consumer behaviour towards passenger cars in Delhi NCR. The scope of the study is limited to certain important behavioural aspects like information search and evaluation, brand preference and brand loyalty and factors of motivation. Understanding the customer’s satisfaction of the product will help the automobile manufacturer in developing their products to meet customer’s needs and designing the proper marketing programs and strategy.
Davy Lerouge & Luk Warlop (2006) in their article proposes that many buying decisions require predictions of another person's product attitudes. Yet, consumer’s decisions require

Critical Evaluation of Advertising Effect on the Consumer Behaviour towards Passengers Cars
Preeti Saxena, Neha Garg
-399-
UGC (Ministry of HRD, Govt. of India) Approved Journal in Social Science Category; Journal No. 48636
predictions of another person's product attitudes. Yet, consumers are often inaccurate predictors, even for familiar others.
Balakrishnan Menon, and Jagathy Raj (2012) revealed that many car manufacturers launching their product in the Kerala state, their study definitely benefit the stakeholders of car manufacturers, dealers, financing agencies, to formalize and strategize their policies towards an effective marketing strategy. The eight parameters developed and the model which was conceptualized was tested through an extensive research and quantitative analysis, to establish its acceptability.
Jacob & Khan (2010), reported in their studies that there was considerable proportion of modern women car buyers, which has increased three fold in the Dominant partial least square factors of consumer purchase behaviour of passenger cars recent years. Companies have started to dig deep into the Indian women’s psyche and attention for details. Marketers may need to look at the needs of women customers, who are increasingly growing in the segment. There is also a substantial influence of women in the car purchase decision of the family.
Lily (2010) conducted a study on “Consumer perception and preferences towards branded products (with special reference to Television set)”. The study concluded that the demographic variable such as age, gender, educational qualification, occupational status, and monthly income have an impact on the customers’ perception of branded products. In a family the role of spouse was considered to be the most important in seeking information about the television brands and while selecting the branded television set, technical features in the television set were considered to be the most important influencing factor.
4. OBJECTIVES OF THE STUDY The Objectives of the present study are as under:
To know the impact of advertisements on the sales of auto vehicles in Moradabad Region;
To know the impact of advertisements on the consumer buying behaviour regarding the purchase of auto vehicles in Moradabad Region; and
To know the decision criteria of the consumers regarding the purchase of auto vehicles in Moradabad Region.
5. HYPOTHESIS OF THE STUDY The hypotheses of the present study are as under:
H0: Advertising is not an effective tool to influence the buying decision process of the consumer.
H1: Advertising is an effective tool to influence the buying decision process of the consumer.
H0: Celebrity appeals in four wheeler advertisements do not influence the decision of consumers.
H1: Celebrity appeals in four wheeler advertisements positively influence the decision of consumers.
H0: Print media does not give any influence on buying decision specially in case of four wheelers for any consumer.

Critical Evaluation of Advertising Effect on the Consumer Behaviour towards Passengers Cars
Preeti Saxena, Neha Garg
-400-
UGC (Ministry of HRD, Govt. of India) Approved Journal in Social Science Category; Journal No. 48636
H1: Print media gives influence on buying decision specially in case of four wheelers for any consumer.
6. RESEARCH METHODOLGY Universe of Study: The research is proposed to be conducted in the Moradabad Region of state of Uttar Pradesh comprising of 5 districts namely- Moradabad, Rampur, Bijnor, JP Nagar (Amroha) and Sambhal. Sampling Design: All items in any field of inquiry constitute a ‘universe’ or ‘population’. In the present study the size of universe is very large, diverse and scattered. The researcher has developed a Cross sectional descriptive research design with field study and partly causal in nature. In the present study the researcher has used the multi-stage random stratified sampling technique. The investigator has taken an utmost care so that the sample should be the truly representative sample and it should be free from small sampling error. An ‘element’ is the unit about which information is being collected. For this study household (family) is treated as element and the information was collected from the real customer of the car, i.e., the head of the family. Scope of Study: Automobiles are the goods which are used by middle class to upper class. In fact India is a country where automobile is as economical as Rs. 1.5 lakh and as costly as Rs. 5 Crore and both have the market in the India. All the premium automobile companies of the world which includes – GM, Ford, Honda, Toyota, Hyundai, Suzuki etc. have specifically developed economical cars for the Indian market, they are also selling their premium brands in India. In India on one hand TATA is selling the cheapest car of the world that is NANO and on the other hand it also selling the premium brands like Land Rover and Jaguar. The decision criteria, buying process, usage pattern is quite diverse in different segment. The decision criteria, buying process, and usage pattern of a small car owner say Wagon R will be quite different from that of a Honda City Owner or that of a Ford Endeavour owner or that of a BMW owner. The person who himself will drive the automobile will have different decision criteria than that of a person who will keep the chauffer or sit at the back seat. It will be injustice to generalize all the segments. In the exploratory study researcher has found that middle class segment and middle upper class segment is more prone to advertisement on the other hand upper class is more brand specific and choices in upper class is also limited. In exploratory study researcher has also found that the top advertiser in Print and Television in automobile sector are Suzuki, Hyundai and TATA and they advertise only their sub 10 Lac car. Thus, researcher has confined the research up to A, B and C Category automobiles that is approximate up to Rs. 10,00,000 worth automobile. Thus, only those segments are studied who have purchased or are potential buyer of the automobile worth upto Rupees Ten Lakh. This segment has the largest market share of the total car sales in India in terms of Volume and as well as value. Sample Size: Sample size of 400 Customers (100 from each district) Sampling Technique: Sample for the study was chosen by using multi-stage random stratified sampling technique. Data Collection: A structured questionnaire with the close ended and open ended questions were
used for data collection. Data was collected through the close ended questions, though another

Critical Evaluation of Advertising Effect on the Consumer Behaviour towards Passengers Cars
Preeti Saxena, Neha Garg
-401-
UGC (Ministry of HRD, Govt. of India) Approved Journal in Social Science Category; Journal No. 48636
list of approx. 10 open ended questions was prepared for the further clarification of the opinion of
the respondents. Information was also collected from the automobile dealers through in depth
interviews. Information regarding the advertisement expenses has been collected from the
Newspaper offices.
Administration of the Questionnaire: Questionnaire was personally administered by the
researcher. It was made it filled by 400 respondents in the duration of one year. Questionnaires
were filled at the houses/offices/workplaces of the respondents. Each respondent was met with
the prior appointment. Appointment were taken with the help of addresses and phone number
given in the Rotary Magazine, Lions Magazine and other social organizations.
Method of Data Collection: Researcher has collected the data through the structured
questionnaire. Questionnaire was administered personally by the researcher. Survey was done
through the questionnaire method.
Analysis and Interpretation of Data: The study is entitled “Critical evaluation of the effect of
advertising on consumer buying behaviour towards Passengers Cars”. It is a well known fact
that advertising is the best way to communicate to the customers. Advertising is done in order to
first, create need and then capturing that need in form of product purchase. While conducting this
study the researcher had certain objectives in mind like studying the relation between advertising
and need creation, influence of advertisements in context of cars, effect of advertisements on
consumer buying behaviour, important and influential factors in making purchase decision.
Keeping these objectives in mind a questionnaire was prepared for conducting the survey so as to
collect the data. For the collection of data total 400 respondents were approached. As the sample
consisted of Moradabad Region, the researcher has to cover total 5 districts. These districts were
Moradabad, Rampur, Bijnore, JP Nagar (Amroha) and Sambhal. The researcher divided the
whole sample size into 4 equal parts. That is to say, total 100 respondents were covered from each
district. Respondents comprised of both male and female. They were the owners of car.
Table No. 2: Socio-Economic Data of the Respondents in Moradabad Region
Factor No. of respondents Percentage
Age
Below 25 45 11.25 25 – 35 111 27.75 35 – 45 127 31.75 45 – 55 84 21.00
Above 55 33 8.25
Total 400 100.00
Occupation
Govt./Semi Govt. Service 107 26.75 Private Service 115 28.75 Self employed/ Professional 73 18.25 Businessman 105 26.25
Total 400 100.00

Critical Evaluation of Advertising Effect on the Consumer Behaviour towards Passengers Cars
Preeti Saxena, Neha Garg
-402-
UGC (Ministry of HRD, Govt. of India) Approved Journal in Social Science Category; Journal No. 48636
Education
Professional Education 213 53.25 Traditional Education 167 41.75 Illiterate 20 5.00
Total 400 100.00
Income Group
Up to Rs. 500000 48 12.00 500000 – 1000000 55 13.75 1000000 – 2500000 129 32.25 2500000 & Above 168 42.00
Total 400 100.00
No. of Members
Two 36 9.00 Three 58 14.50 Four 159 39.75 Five 104 26.00 Above five 43 10.75
Total 400 100.00
Source: Survey report. It is clear from the Table No. 2 that respondents 45 were below 25 years of age. They comprised of 11.25% of the total respondents. The second category comprised of respondents between ages of 25-35 years. Such respondents were 111 in no., i.e., 27.75% of the total respondents. The category next under the head was of age group 35-45 years. There lied 127 respondents which were 31.75% of the total. Next was the category of age group between 45-45 years. Such category consisted of 84 respondents. These were 21% of the total. The last category was of age group above 55 years. There lied only 33 respondents which were just 8.25% of the total. The age group between which majority of the respondents lie is age where maximum no. of people purchase the car as it is the peak portion in the life of an individual. Initially, when the person is in the age bracket below 25 years or above 40 years, they own car as an asset belonging to their parents or otherwise. There were 107 respondents who were in govt./semi govt. job, they make up 26.75% of total. That is, they were 115 respondents who were employed in the private sector. They make up 28.75% of the total. 73 out of 400 were self employed professionals. They make up 18.25% of the total respondents. Lastly 105 out of 400 were businessman. They make up 26.25% of the total. Here the above paragraph detailed the occupations of the respondents, are more or less of same percentage. In today’s social setup, there is almost equal liking towards occupations of every type. Thus, the car owners are from all sort of occupation group. On the basis of education respondents are classified into three categories. Education of any person has a direct relation with his/her occupation. The more educated a person the better job he/she is in. Researcher has categorized all sorts of education under two heads, professional education and traditional education. In this research 213 were professionally qualified respondents. They were about 53.25% of the total. While 167 (41.75%) were traditionally qualified. As answer to this question related to education of respondents, more no. was of professionally

Critical Evaluation of Advertising Effect on the Consumer Behaviour towards Passengers Cars
Preeti Saxena, Neha Garg
-403-
UGC (Ministry of HRD, Govt. of India) Approved Journal in Social Science Category; Journal No. 48636
qualified respondents while less was traditionally qualified. Rest 20 respondents were illiterate. Hence, it can be interpreted that the professionally qualified people comparatively possess more car as compared to traditionally qualified people. It is considered to be normal phenomena. The first category included respondents with income up to Rs. 5 lac. In this category only 48 respondents were there. They made only 12.00% of the total respondents. The next category was income level between Rs. 5 lac to Rs. 10 lac, 55 out of total 400 respondents lied in this category. They made up 13.75% of the total respondents. In the third category i.e. Rs. 10 lac to Rs. 25 lac, 129 respondents were there. They made up 32.25% of the total. In the fourth category Rs. 25 lac and above rest 168 respondents lied which made 42.00% of the total respondents. Next it was asked to the respondents that how many members are there in their family. 36 respondents said that they had only two members in their family. It was equivalent to 9.00% of the total respondents. 58 said that there were three members in their family, that is, 14.50% of the total respondents. Maximum 159 said that there are four members in their family (i.e. 39.75% of the total respondents). Another 104 (26.00%) said that there are five members in their family. About 43 said that there are above five family members. They summed up 10.75% of the total respondents. Maximum respondents said either they had 4 members or 5 members in their family. This is the ideal size of a nuclear family.
Table No. 3: Advertisement of the car motivates to buy the car
No. of respondents Percentage
Yes 248 62.00 No 152 38.00
Total 400 100.00
Table No. 3 explains whether respondents were motivated to buy a car by advertisement of the automobile? Yes or no were the two options. The purpose of this table was to clear the influence of advertisements on the motivational pattern of the respondents in a very basic way. Out of 400 respondents, 248 said that yes the advertisement of the automobile motivates them to purchase a car. They also said that when they saw the advertisement of an automobile they developed a sharp feeling that they should possess that particular brand/model of the car. Such respondents were 62% of the total. 152 respondents, i.e. 38% of the total didn’t find advertisements motivating so as to purchase them. Although they are interested in the automobile but they are not driven by the advertisement. Most of them further said that purchase of an automobile is a major decision to make and can’t be made only by following simply an advertisement. These 62% of the total respondents were those proud owners of cars who would have started their decision making process after seeing the advertisement. Most of the respondents get easily satisfied with the description of car given in the advertisement.
Table No. 4: Likings about the form of advertisement
No. of Respondents Percentage
Still form (Magazines/News Paper) 91 22.75 Moving Form (TV/Internet etc.) 309 77.25
Total 400 100.00

Critical Evaluation of Advertising Effect on the Consumer Behaviour towards Passengers Cars
Preeti Saxena, Neha Garg
-404-
UGC (Ministry of HRD, Govt. of India) Approved Journal in Social Science Category; Journal No. 48636
This Table No. 4 is related to the likings of respondents related to the form of advertisements. Respondents were asked about the form of advertisement they like more. They were given two categories as options. Firstly, still images which were through magazines and newspapers and secondly moving images which were through television and internet. Advertisements which are there in magazines and newspapers are short, precise but to the point, while the advertisements which are presented on television are detailed. They cover more information as compared to magazines and newspapers. Same is the case with internet. It is that medium of information which shares maximum information. Any person can collect so much of data related to any particular brand/model. He can even compare these data with one another. Out of 400 respondents 91 (i.e. 22.75%) told that they like still images (magazines and newspaper) form of advertising more. While 309 (i.e. 77.25%) out of 400 opined that they liked moving image form of advertisement more. This was due to elaborated description of the product which was seen on T.V. and internet.
Table No. 5: Which medium of advertisement of cars can be presented properly
No. of respondents Percentage
Expert advice 134 33.50 Celebrity/model in the advertisement 69 17.25 Presentation/Photography 35 8.75 Appealing Message 66 16.50 Other features (Price, technology etc. 96 24.00
Total 400 100.00
Respondents were asked about their opinion related to medium through which advertiesment of car can be presented properly is shown in Table No. 5. They were given Expert advice, Celebrity/model in the advertisement, Presentation/Photography, Appealing Message and Other features (Price, technology etc.) as their option. Maximum 134 out of 400 respondents told that Expert advice is the best medium to present ads related to cars. This comprised of 33.50% of the total respondents. 69 respondents out of 400 said that Celebrity/model in the advertisement is a proper medium to present ads of cars. They make up 17.25% of the total respondents. The next category of medium was Presentation/Photography. Only 35 respondents think that Presentation/Photography is a proper medium to present the ads of cars. They make 8.75 of the total respondents. Next option as another medium for proper presentation of cars was Appealing Message. 66 respondents said that they find Appealing Message as a suitable medium. They make up 16.50% of the total respondent. Lastly, it was Price and Technology. 96 respondents thought that Price and Technology is a proper medium for proper presentation of ads of cars. Such respondents are 24.00% of the total respondents. Table No. 6: Does advertisement of the car in newspaper/magazine has influenced the opinion
to purchase it.
No. of Respondents Percentage
Yes 173 43.25 No 148 37.00 Can’t Say 79 19.75
Total 400 100.00

Critical Evaluation of Advertising Effect on the Consumer Behaviour towards Passengers Cars
Preeti Saxena, Neha Garg
-405-
UGC (Ministry of HRD, Govt. of India) Approved Journal in Social Science Category; Journal No. 48636
Researcher asked respondents whether advertisement of their purchased car in newspaper/magazine has positively influenced on their opinion to buy it (Table No. 6). Here also they were given three option- yes, no, can’t say. 173 respondents said yes, that advertisement of their car in newspaper/ magazine has positively influenced their opinion to purchase it. They make up 43.25% of the total respondents. 148 respondents, i.e., 37% of the total said no that they were not at all influenced by the ad of their car in newspaper/magazine to buy it. While 79, i.e., 19.75% of the total respondents said that they can’t say whether they were influenced or not. News papers may also be considered as good medium for local advertising. Car dealers announce different schemes/offers through the print media. So, many people are influenced from these advertisements.
Table No. 7: Factors Affecting Consumer Buying Behaviour
Q. No.
Factors affecting SD D N A SA Score Rank
1 Brand and size of the car builds/influences the image of the person (owner) in the society.
51 43 30 127 149 1480 4
2 While selecting brand of the car I consider what other people would think about me.
80 64 16 112 128 1344 6
3 Entertaining advertisements influence the opinion about the product.
16 28 36 156 164 1624 1
4 Advertisement helps in increasing sales of any product.
13 46 56 132 153 1566 2
5 Presence of celebrity in the advertisement affects opinion about the product.
96 84 72 80 68 1140 7
6 Intensity (repetition) of an advertisement affects opinion about the product.
59 49 46 129 117 1396 5
7 Information provided in advertisement affects opinion about the product.
26 37 46 134 157 1559 3
In Table No. 7, factors which most commonly affect the consumer buying behaviour are explained. Advertisement often influences the opinion of consumer regarding any product. From the survey it was found that 320 (80%) respondents agree that advertisement often influences the opinion of consumer. This factor ranked first. Factor No. 4, Advertisement helps in increasing sales of any product, ranked second as 285 (71.25%) respondents said that advertising directly affects the sales of any product. In its support they put some example of different products. Another set of 56 (14%) respondents were indifferent in their opinion. Rest 59 (14.75%) respondents do not agree with the relation of advertising and sales of that product. Factor No. 7 ranked 3rd, “Information provided in advertisement affects opinion about the product,” as 291 (72.75%) respondents agree that the information given in the advertisement influences the opinion about the product. Brand and size of the car builds/influences the image of the person (owner) in the society, Factor No 1 ranked 4th as 276 (69%) were agree and strongly agree that there is a positive correlation with the owners image with car brand and size. On the other hand

Critical Evaluation of Advertising Effect on the Consumer Behaviour towards Passengers Cars
Preeti Saxena, Neha Garg
-406-
UGC (Ministry of HRD, Govt. of India) Approved Journal in Social Science Category; Journal No. 48636
30 (i.e.7.50%) respondents were indifferent in their opinion. 94 (i.e. 23.5%) respondents do not see any link between the owner’s image in society and the car he/she owns. According to the compiled data majority of the respondents think that brand and size of the car build and enhance their image in the society. Intensity (repetition) of an advertisement affects opinion about the product, Factor No. 6 ranked 5th as 246 (61.50%) respondents were agree, that frequency of advertisement affects opinion of buyer. Factor No. 2, Other people advice ranked 6th because 240 (60%) respondents out of 400 consider the other persons thinking in mind while selecting the car. While 16(4%) of the total respondents remained indifferent. Rest 144 (36%) respondents do not care about the thinking of others regarding the selection of his car. And at last Factor No. 5 ranked 7th that most of the people disagree upon any influence of celebrity.
Table No. 8: Factors affecting Consumers while purchasing the Car
Factor No
Influence Less
Influence Moderate Influence
More Influence
Key Decision Factor
Driving Comfort 4 32 84 128 152 Availability of Spare Parts
31 45 190 130 4
Price 0 0 12 56 332 Attractive Exterior 64 116 160 44 16 Ground Clearance 95 137 108 38 22 Brand Image 0 8 94 121 177 Boot Space 0 20 60 176 144 Seating Capacity 0 16 56 176 152 Interiors 20 56 156 140 28 After Sales Service 12 76 124 147 41 Maintenance Cost 42 90 151 108 9 Status Symbol 68 140 96 76 20 Latest Technology 36 56 120 124 64 Resale Value 8 92 168 120 12
Table No. 8 shows that key decision factors are price, driving comfort, and brand image. The more influencing factors in car buying are boot space, seating capacity, after sales service and technology. The moderately influencing factors in car buying decision are availability of spare parts, exterior, interior, and maintenance cost and resale value. Rest other factors play less impact on final decision for buying a car. Results: H0
: Advertising is not an effective tool to influence the buying decision process of the
consumer. H1
: Advertising is an effective tool to influence the buying decision process of the consumer.
For testing the null hypothesis, the Table No. 3 and 4 has been taken for consideration. In these tables it was cleared that consumers got motivation for buying a four wheeler after watching the advertisement. For testing the null hypothesis, chi-square test has been used. As per the data collected there were 252 respondents who were influenced by watching ad while 148 were not influenced. Out of 252 respondents, 178 were those who have watched the ad while 74 were those

Critical Evaluation of Advertising Effect on the Consumer Behaviour towards Passengers Cars
Preeti Saxena, Neha Garg
-407-
UGC (Ministry of HRD, Govt. of India) Approved Journal in Social Science Category; Journal No. 48636
who have not watched the ad, but they were still willing to buy the car. When these respondents were asked about how they were still influenced, they said that they were in close contact either with some family member, friend or people in their neighbourhood.
Table No. 9: Cross Tabulation
Cross Tabulation Influence of Advertisement Total
Consumer Influenced
Consumer Not Influenced
Co
nsu
mer
an
d
ad
ver
tise
men
t Watching Advertisement
Count 178.0 74.0 252.0 Expected Count 194.7 57.3 252.0
Not Watching Advertisement
Count 131.0 17.0 148.0 Expected Count 114.3 33.7 148.0
Total Count 309.0 91.0 400.0 Expected Count 309.0 91.0 400.0
Table No. 10: Chi-Square Tests
Value df Asymptotic Significance
(2-sided)
Exact Sig. (2-sided)
Exact Sig. (1-sided)
Pearson Chi-Square 16.959a 1 .000 Continuity Correctionb 15.957 1 .000 Likelihood Ratio 18.331 1 .000 Fisher's Exact Test .000 .000 Linear-by-Linear Association
16.916 1 .000
N of Valid Cases 400
a. 0 cells (0.0%) have expected count less than 5. The minimum expected count is 33.7. b. Computed only for a 2x2 table c. table value of x2
0.05 =3.84 From the above calculation it is found that the calculated value of x2 at 1 degree of freedom and 5% level of significance is very high (16.959) as compared to the standard table value (3.84). Hence, the null hypothesis has been rejected. This means, the alternative hypothesis is accepted. So our conclusion will be that the advertising is definitely an effective tool to influence the buying decision process of consumer. H0: Celebrity appeals in four wheeler advertisements does not influence the decision of consumers. H1: Celebrity appeals in four wheeler advertisements positively influence the decision of consumers.
Table no. 5 has been taken for testing the second null hypothesis. In this table it was tried to know from the respondents, what thing impressed them in advertisement of car for final buying decision. Here, the researcher gave five options i.e. expert advice in advertisement, presence of celebrity/model in advertisement, beautiful presentation, appealing message/punch line of advertisement and some other characteristics.
Critical Evaluation of Advertising Effect on the Consumer Behaviour towards Passengers Cars
Preeti Saxena, Neha Garg
-408-
UGC (Ministry of HRD, Govt. of India) Approved Journal in Social Science Category; Journal No. 48636
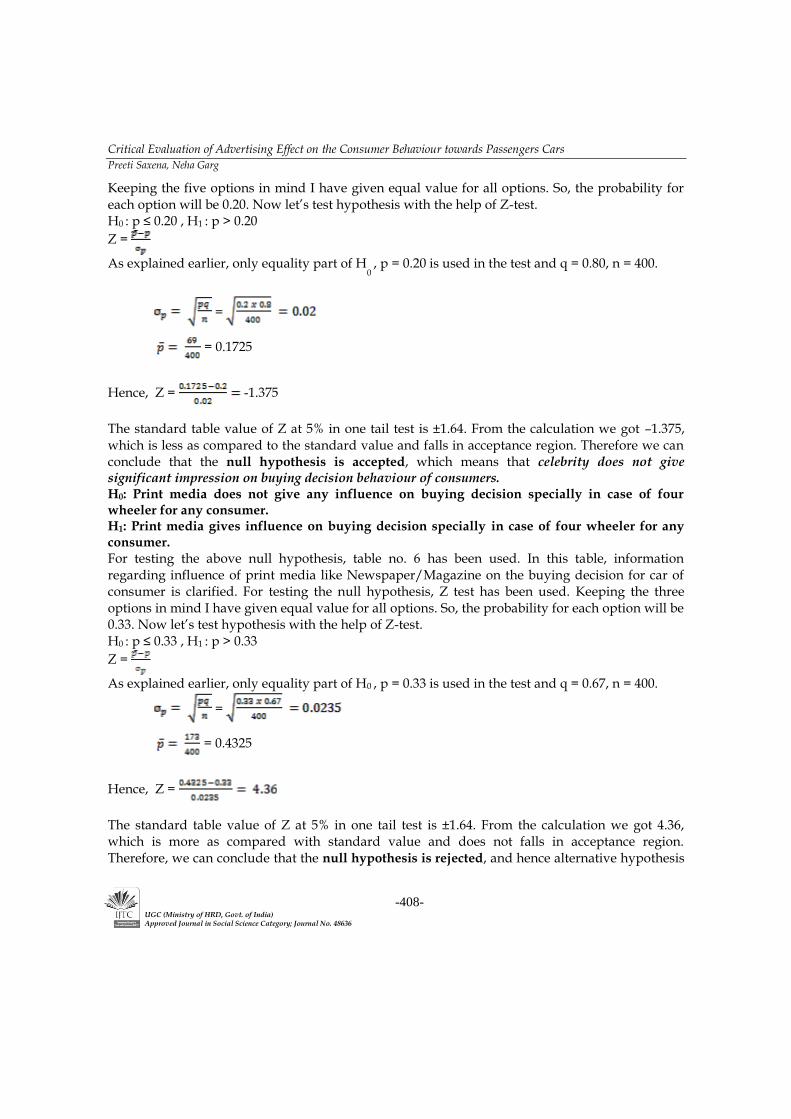
Keeping the five options in mind I have given equal value for all options. So, the probability for each option will be 0.20. Now let’s test hypothesis with the help of Z-test. H0
: p ≤ 0.20 , H1
: p > 0.20
Z =
As explained earlier, only equality part of H0 , p = 0.20 is used in the test and q = 0.80, n = 400.
=
= 0.1725
Hence, Z = -1.375
The standard table value of Z at 5% in one tail test is ±1.64. From the calculation we got –1.375, which is less as compared to the standard value and falls in acceptance region. Therefore we can conclude that the null hypothesis is accepted, which means that celebrity does not give significant impression on buying decision behaviour of consumers. H0: Print media does not give any influence on buying decision specially in case of four wheeler for any consumer. H1: Print media gives influence on buying decision specially in case of four wheeler for any consumer. For testing the above null hypothesis, table no. 6 has been used. In this table, information regarding influence of print media like Newspaper/Magazine on the buying decision for car of consumer is clarified. For testing the null hypothesis, Z test has been used. Keeping the three options in mind I have given equal value for all options. So, the probability for each option will be 0.33. Now let’s test hypothesis with the help of Z-test. H0
: p ≤ 0.33 , H1
: p > 0.33
Z =
As explained earlier, only equality part of H0 , p = 0.33 is used in the test and q = 0.67, n = 400.
=
= 0.4325
Hence, Z =
The standard table value of Z at 5% in one tail test is ±1.64. From the calculation we got 4.36, which is more as compared with standard value and does not falls in acceptance region. Therefore, we can conclude that the null hypothesis is rejected, and hence alternative hypothesis

Critical Evaluation of Advertising Effect on the Consumer Behaviour towards Passengers Cars
Preeti Saxena, Neha Garg
-409-
UGC (Ministry of HRD, Govt. of India) Approved Journal in Social Science Category; Journal No. 48636
is accepted which means that print media positively influences the opinion of consumers especially in case of four wheelers.
CONCLUSION
The research study was conducted in order to test three hypotheses. These hypotheses were tested with the help of statistical methods (Chi square test and z - test) applied upon the primary data obtained from survey. The findings from the hypothesis test show the following:
Advertising is definitely an effective tool to influence the buying decision process of consumers.
Celebrity does not give significant impression on buying decision behaviour of consumers.
Print media positively influences the opinion of consumers especially in case of four wheelers.
REFERENCE
[1]. Boyd, Harper W., Westfall, Ralph, Stasch, Stanley F. (1998), “Marketing Research- Text and Cases”, 7th
edi., AITBS. [2]. Davy Lerouge & Luk Warlop, (2006), “Why it ISSO Hard to Predict our Partner's Product
Preferences - The Effect of Target Familiarity on Prediction Accuracy”, Journal of Consumer Research, Vol. 33, pp. 393 -402.
[3]. Gupta, Sangeeta (2013), ‘A Study of Buying Decision Influencers for Passenger Car Segment in New Delhi’, Volume 2 Issue 12, December.
[4]. Gupta, Vandana & others (2017), “A Study on The Purchase Behaviour of Customers of Hatchback Cars in Delhi/NCR Region”, Pacific Business Review International, Volume 9 Issue 10, April.
[5]. Jacob, Sara and Khan, Sobia., (2010), Designed for the women today, The economic time, edition 25th May.
[6]. Kothari, C.R., (2004), “Research Methodology- Methods and Techniques” 2nd
edi., New Age International Publishers.
[7]. Lilly, J., (2010) ‘Customer Perception and Preference towards Branded Products with special references to Television Sets’, Indian Journal of Marketing, Vol-5, No-10, p.84.
[8]. Menon, B. & Raj J., (2012), ‘Dominant Partial Least Square Factors of Consumer Purchase Behaviour of Passenger Cars’, Asian Journal of Management Research, ISSN 2229 – 3795, Volume 3 Issue 1.
[9]. Srivastava A. and Matta M., (2014), ‘Consumer Behaviour towards Passengers Cars - A Study in Delhi NCR’, Global Journal of Finance and Management. ISSN 0975-6477 Volume 6, Number 6, pp. 589-598
[10]. www.team-bhp.com/forum/indian-car-scene/190073-august-2017-indian-car-sales-figures-analysis.html