Crime Analysis & Prediction System
33
GROW WITH BIG DATA Third Eye Consulting Services & Solutions LLC.
-
Upload
bigdatacloud -
Category
Data & Analytics
-
view
250 -
download
2
Transcript of Crime Analysis & Prediction System

GROW WITH BIG DATAThird Eye Consulting Services & Solutions LLC.

Crime Analysis & Predictions System
(CAPS)

Public Safety & National Security team
at
lead by
Sanjay Jacob, Parul Bhandari & Mahesh Punyamurthula
ORIGINALLY DEVELOPED FOR

CAPS – Problem Definition
Public Governments around the world need to:
1. Do more while spending the least.
2.Better manage existing resources.
3.Be proactive in battling crime.
4.Be at the right place at the right time
– to beat crime with the lowest impact.
5.Know what to do when and why.

CAPS – Problem Definition
Other Challenges for Public Governments:
1. Lack of technical knowledge and resources.
2.Lack of management resources to manage, monitor
and operate such systems.
3.Need to analyze disparate data sets spread across
various systems and trapped in different formats.
4. Reliance on outdated infrastructure & systems –
both stationary & mobile.

• Leverages Open Data initiatives by government bodies
worldwide.
• Based on Microsoft’s Big Data technologies stack.
• Capable of handling Big Data’s Velocity, Volume and Veracity.
• Easy to integrate, assemble and develop customized end-to-
end solutions.
• Analyze various types of data feeds - real time streaming &
static data.
• Provides comprehensive analytical capabilities.
• Predict crime patterns for efficient deployment of public
safety resources.
CAPS - Solution

• CAPS is a system to analyze & detect crime hotspots & predict crime.
• Collects data from various data sources - crime data from OpenData sites, US census data, social media, traffic & weather data etc.
• Leverages Azure’s Cloud and on premise technologies for back-end processing & desktop based visualization tools.
CAPS - Solution

The police can use the system in two ways:
1. The system can alert that a crime is imminent (in the
next 4 hours) based on any new traffic or weather
event/s.
2. The police can run the system once a day and based
on the predictions, decide how to deploy resources
(policemen) in each community/district.
BENEFITS FOR THE LOCAL POLICE

TECHNICAL SECTION

• Azure HDInsight
• MapReduce
• Hive
• Stream Analytics
• Azure Queue
• Azure Storage
• SQL Azure
• SQL Server
• Power BI• PowerQ&A
• PowerView
• PowerMap
TECHNOLOGIES USED

DATA COLLECTION LAYER
DATA COLLECTION
OPEN DATA - Static
CENSUS DATA - Static
WEATHER DATA – Real Time
CRIME DATA - StaticTRAFFIC DATA – Real Time
SOCIAL MEDIA DATA – Real Time
ENTERPRISE DATA – Real Time & Static
MACHINE DATA – Real Time & Static
INTERNET OF THINGS– Real Time & Static
ANY OTHER DATA- Static
ANY OTHER DATA – Real Time
ANY OTHER DATA– Real Time & Static
DATA PROCESSING LAYERCloud or On Premise
PRESENTATION LAYER

The system can be further enhanced to include additional
data sources as available.
For ex:
• Video Data
• Images Data
• Police Systems Data
ADDITIONAL DATA SOURCES

DATA COLLECTION – Windows
Data Sources - For Chicago
Real time Tweet streams ingested
from Twitter using Search APIs
Facebook data ingested using Graph
Search APIs.
Traffic data ingested from Mapquest.
Weather data ingested from Forcast.io
Data feed ingestion is automated and
captured using C# custom code base.
Pre-Processor
Tweets are feed into Stream
Computing Layer for sentiment logic
processing.
Facebook, Traffic & Weather data
parsed from JSON to csv on run time.
All data is persisted on Azure Storage.
Analyzed & summarized data is
persisted in SQL Azure.
Storage
Analyzed Twitter data is pushed to
Window Azure SQL
Parsed Twitter/Facebook/Traffic/Weather
data is persisted in Azure Storage in
different containers.

DATA PROCESSING LAYER - Windows
• Windows Azure• Windows HDInsight• Stream Analytics• Azure Queue• Azure Storage• SQL Azure • SQL Server PRESENTATION LAYER
DATA COLLECTION LAYER
DATA PROCESSING LAYER

DATA STORAGE & PROCESSING
STORAGE
Processed & Aggregated data ingested into
SQL Azure.
HDInsight blob storage provides reliable
and a scalable solution.
All data is partitioned on dates.
Sqoop Sqoop
STORAGE Calls script on pre-set
schedule to ingest
data into Hive tables.
Checks periodically to
ensure normal system
operations
Inserts data
incrementally
Contains all data as
per the table
schemas.
Enables HiveQL
execution when
requests come in
from PowerBI
components.
SCHEDULER HIVE
SQL AZURE
HIVE Scheduled Jobs
Daily scripts to create table and insert data, scheduled
with cron jobs.
HIVE Tables
Have all data in full details from all data sources.

PRESENTATION LAYER – Windows
DATA PROCESSING LAYER• Power BI
• PowerQ&A• PowerView• PowerMap
• Power Query• PowerPivot
• Windows 8 Apps• Mobile Apps
DATA COLLECTION LAYER
PRESENTATION LAYER

DATA PRESENTATION LAYER

DATA PRESENTATION LAYER Excel 2013 is used as the platform and workbench for analyzing and mining
data, using functionalities which are familiar to most power users.
PowerPivot is the semantic layer that defines the relationship between data
and calculated measures.
Data is stored in-memory as a columnar database for faster retrievals.
Model data is saved along with Excel as a part of it, which makes sharing of
these reports very easy.
PowerMap provides instant and overall picture of the trends happening across
geographies over..
PowerView is a Silverlight Add-in that provides powerful interactive and
intuitive dashboards and reports which are built on top of PowerPivot’s data
model. It enables slicing/dicing, drilling-up/down of any level of data. It’s very
useful to identify trends and root causes.

Real time
Data Sources
Data Collection Layer (C# custom code)
Data Processing Layer (Stream Computing Platform - Storm)
HDFS & Blob Storage (Azure)
Presentation Layer (Power BI)
Analytics (HDInsight Hive)
Analytics
(Stream Analytics & MapReduce)
SQL Azure
CLOUD MODEL– Windows
• Cloud based data
processing &
transformations.
• Cloud based real
time & batch
analytics.
• Office 365’s PowerBI
components for
adhoc analytics.
• Enabled for Windows
8 based Mobile &
Desktop Apps.
Static
Data Sources
CLOUD BASED
INFRASTRUCTURE
Message Queue Layer (Azure Event Hubs)
Machine Learning Algorithms
(AzureML)

Real time
Data Sources
Data Collection Layer (C# custom code)
Data Processing Layer (Azure Stream Analytics)
HDFS & Blob Storage (Azure)
Presentation Layer (Power BI)
Analytics (HDInsight Hive)
Analytics
(Stream Analytics & MapReduce)
SQL Server
HYBRID MODEL– Windows
Static
Data Sources
Message Queue Layer (Azure Event Hubs)
Machine Learning Algorithms
(AzureML)
• PowerBI components
for adhoc analytics.• SQL Server based.
• Cloud based data
processing &
transformations.
• Cloud based real
time & batch
analytics.
• Enabled for Windows
8 based Mobile &
Desktop Apps.
CLOUD BASED
INFRASTRUCTURE
ON-PREMISE INFRA

DATA SOURCES – For ChicagoDATA DESCRIPTION SOURCE
Crime Data Historic crime case data over years from
2000 - present
• https://data.cityofchicago.org/Public-
Safety/Crimes-2001-to-present/ijzp-q8t2
Chicago districts Chicago Police districts address
information
• https://portal.chicagopolice.org/portal/page/p
ortal/ClearPath/Communities/Districts
Chicago
communities
Chicago community area mapping • http://en.wikipedia.org/wiki/Community_areas_
in_Chicago
Socio economic
factors
Selected socio economic indicators like
people below poverty, unemployment,
per capita income for each community
• https://data.cityofchicago.org/Health-Human-
Services/Census-Data-Selected-
socioeconomic-indicators-in-C/kn9c-c2s2
Twitter Tweets about Chicago. Twitter Streaming API
Facebook Posts about Chicago. Facebook Graph Search API
Weather Chicago weather data Forecast.io
Traffic Chicago traffic details MapQuest

ANALYTICS

CRIME ANALYTICS
Analyze Crime Levels
• Filters (depending on data)
• Number of crime
• Crime Types
• Location
• Date & Time
• Temperature
• Residents
• Graph Type• Line
• Bar
• Pie Chart
• Table
• Bubble

CRIME ANALYTICS
Analyze Crime Levels
• Filters (depending on data)
• Number of crime
• Crime Types
• Location
• Date & Time
• Temperature
• Residents
• Graph Type• Line
• Bar
• Pie Chart
• Table
• Bubble

CRIME ANALYTICS
Analyze Crime Levels
• Filters (depending on data)
• Number of crime
• Crime Types
• Location
• Date & Time
• Temperature
• Residents
• Graph Type• Line
• Bar
• Pie Chart
• Table
• Bubble

PREDICTIONS
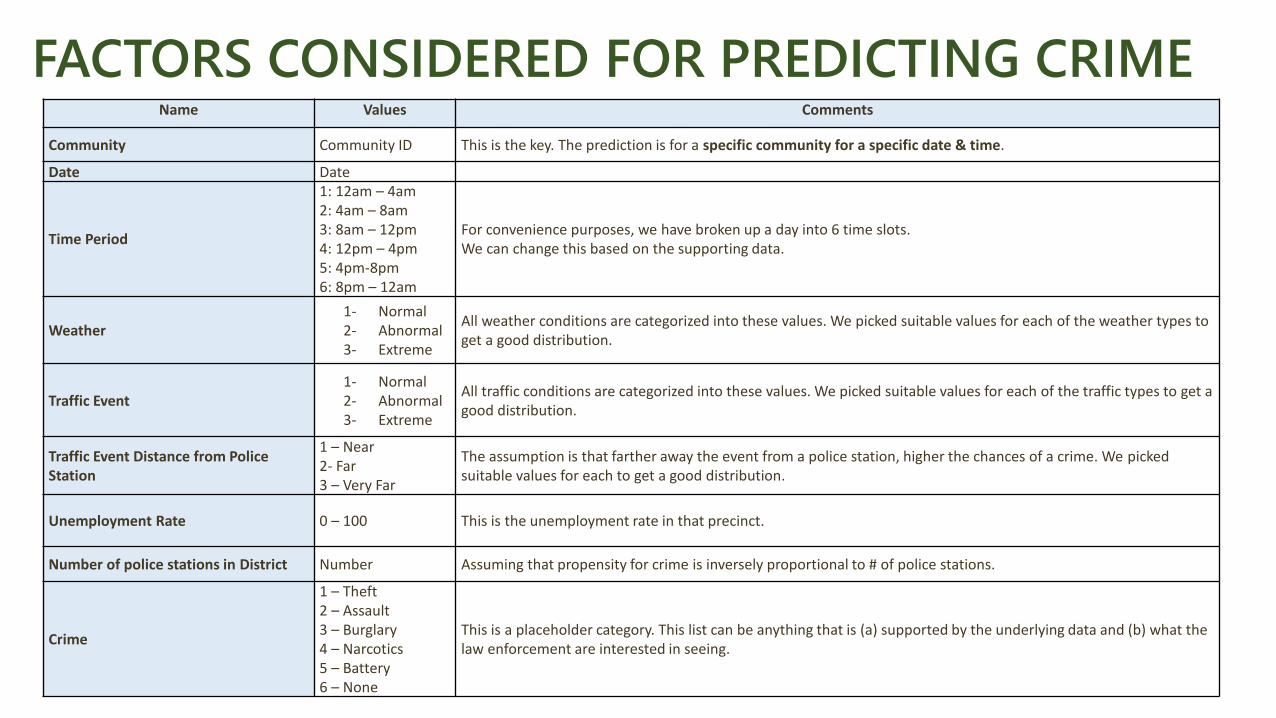
Name Values Comments
Community Community ID This is the key. The prediction is for a specific community for a specific date & time.
Date Date
Time Period
1: 12am – 4am2: 4am – 8am3: 8am – 12pm4: 12pm – 4pm5: 4pm-8pm6: 8pm – 12am
For convenience purposes, we have broken up a day into 6 time slots. We can change this based on the supporting data.
Weather1- Normal2- Abnormal3- Extreme
All weather conditions are categorized into these values. We picked suitable values for each of the weather types to get a good distribution.
Traffic Event1- Normal2- Abnormal3- Extreme
All traffic conditions are categorized into these values. We picked suitable values for each of the traffic types to get a good distribution.
Traffic Event Distance from Police Station
1 – Near2- Far3 – Very Far
The assumption is that farther away the event from a police station, higher the chances of a crime. We pickedsuitable values for each to get a good distribution.
Unemployment Rate 0 – 100 This is the unemployment rate in that precinct.
Number of police stations in District Number Assuming that propensity for crime is inversely proportional to # of police stations.
Crime
1 – Theft2 – Assault3 – Burglary4 – Narcotics5 – Battery6 – None
This is a placeholder category. This list can be anything that is (a) supported by the underlying data and (b) what the law enforcement are interested in seeing.
FACTORS CONSIDERED FOR PREDICTING CRIME
• With the initial dataset, an initial prediction model is constructed.
• If any of the fields change value, then the model is retrained. Some
of the fields will change infrequently and others will change on a
daily basis (ex. social media, weather & traffic events). The model is
continuously updated/upgraded with new data.
• The system periodically pulls in the latest fields (automatically) from
appropriate sources.
• Then the model runs against the new data to predict what kind of
crime is likely to be committed in each of the communities.
PREDICTION MODEL

CRIME PREDICTIONS
Predict Crime
• Filters (depending on data)
• Number of crime
• Crime Types
• Location
• Date & Time
• Temperature
• Residents
• Graph Type• Line
• Bar
• Pie Chart
• Table
• Bubble

CRIME PREDICTIONS
Predict Crime
• Filters (depending on data)
• Crime Types
• Location
• Date
• Time
• Temperature
• Traffic
• Distance to Police Station
• Weather

The system is fully extensible and future proof.
• Lessons learned
• Patterns detected
• Observations made
for one city can be used and extended for other cities
worldwide.
The backend infrastructure will also adjust accordingly.
EXTENSIBLITY

The Crime Analysis and Prediction System (CAPS) can/is:
• Detect, Analyze & Predict Crime.
• Help public governments battle crime better with lowered
costs.
• Based on Microsoft’s Big Data technologies – both cloud
and on premise.
• Built on the robust Azure platform that can scale vertically
& horizontally.
• Customizable & Extensible to meet the needs of specific
business use cases.
SUMMARY
THANK YOU!