CRI LARTC 2013
20
Cellulosic Hydrocarbon Fuels from IH 2 Technology – Fuel Quality Celeste McLeod, CRI Catalyst Company, 910 Louisiana, Houston, TX 77002 LARTC Presentation 10 April 2013
-
Upload
cricatalyst -
Category
Technology
-
view
445 -
download
0
Transcript of CRI LARTC 2013

Cellulosic Hydrocarbon Fuels from IH2 Technology – Fuel Quality Celeste McLeod, CRI Catalyst Company, 910 Louisiana, Houston, TX 77002
LARTC Presentation10 April 2013

04/15/2023 2
DisclaimerThis presentation contains forward-looking statements concerning the financial condition, results of operations and businesses of Royal Dutch Shell. All statements other than statements of historical fact are, or may be deemed to be, forward-looking statements. Forward-looking statements are statements of future expectations that are based on management’s current expectations and assumptions and involve known and unknown risks and uncertainties that could cause actual results, performance or events to differ materially from those expressed or implied in these statements. Forward-looking statements include, among other things, statements concerning the potential exposure of Royal Dutch Shell to market risks and statements expressing management’s expectations, beliefs, estimates, forecasts, projections and assumptions. These forward-looking statements are identified by their use of terms and phrases such as ‘‘anticipate’’, ‘‘believe’’, ‘‘could’’, ‘‘estimate’’, ‘‘expect’’, ‘‘goals’’, ‘‘intend’’, ‘‘may’’, ‘‘objectives’’, ‘‘outlook’’, ‘‘plan’’, ‘‘probably’’, ‘‘project’’, ‘‘risks’’, ‘‘seek’’, ‘‘should’’, ‘‘target’’, ‘‘will’’ and similar terms and phrases. There are a number of factors that could affect the future operations of Royal Dutch Shell and could cause those results to differ materially from those expressed in the forward-looking statements included in this presentation, including (without limitation): (a) price fluctuations in crude oil and natural gas; (b) changes in demand for Shell’s products; (c) currency fluctuations; (d) drilling and production results; (e) reserves estimates; (f) loss of market share and industry competition; (g) environmental and physical risks; (h) risks associated with the identification of suitable potential acquisition properties and targets, and successful negotiation and completion of such transactions; (i) the risk of doing business in developing countries and countries subject to international sanctions; (j) legislative, fiscal and regulatory developments including regulatory measures addressing climate change; (k) economic and financial market conditions in various countries and regions; (l) political risks, including the risks of expropriation and renegotiation of the terms of contracts with governmental entities, delays or advancements in the approval of projects and delays in the reimbursement for shared costs; and (m) changes in trading conditions. All forward-looking statements contained in this presentation are expressly qualified in their entirety by the cautionary statements contained or referred to in this section. Readers should not place undue reliance on forward-looking statements. Additional factors that may affect future results are contained in Royal Dutch Shell’s 20-F for the year ended December 31, 2011 (available at www.shell.com/investor and www.sec.gov ). These factors also should be considered by the reader. Each forward-looking statement speaks only as of the date of this presentation, 10 April 2013
Neither Royal Dutch Shell nor any of its subsidiaries undertake any obligation to publicly update or revise any forward-looking statement as a result of new information, future events or other information. In light of these risks, results could differ materially from those stated, implied or inferred from the forward-looking statements contained in this presentation.

04/15/2023 3
Discussion Topics
• Introduce Gas Technology Institute (GTI) and CRI Catalyst (CRI)
• IH2 Technology overview
• IH2 Technology product quality
• IH2 process economics
• IH2 Technology integration sugar/ethanol
• IH2 commercial deployment

04/15/2023 4
Gas Technology Institute
• Not-for-profit gas research & services organization with a 70+ year history• Capabilities that span the natural gas value chain• Current focus in diversified energy solutions• Facilities
– 18 acre Chicago campus – 28 specialized labs totaling 200,000 ft2
• Staff of 250 • >1,200 patents• 750 licenses granted & 500 products taken to market
Pilot Scale Gasification Campus Energy & Environmental Technology Center
Offices& Labs
CRI is the partner for IH2

04/15/2023 5
CRI Catalyst Company
• Catalyst Business with 50+ year history
• Houston based global business – Houston– London– Singapore
• Research Facilities – Amsterdam– Bangalore – Houston
• Manufacturing Facilities – US (3)– Germany – Belgium

04/15/2023 6
What is the IH2 Process?
• IH2 process– Catalysts, Hydrogen & Heat – Cost-effectively converts wide
variety of biomass– Directly produces hydrocarbon
“drop in” fuels (R100) and/or high quality blend stock (>R50)
• IH2 Technology offers integration opportunities – Refinery, paper mill, ethanol plant,
agricultural, or recycling operations – Creates higher value from biomass
than afforded by heat and electrical power sales (NA basis)

04/15/2023 7
2) Fluidized Bed
Proprietary Catalyst
Renewable H2
340-470C<500psig
1) Feed ConditioningSizing , Drying & Feeding
1st Stage 2nd Stage
3) Fixed Bed
Proprietary Catalyst
Renewable H2
370-400C<500psig
HDO’d Vapors
4) SMR C1-C3 GasRenewable H2
Process
IH2 Process (Simplified, Stand Alone)
Distilled Hydrocarbon
Hi Pressure Steam
Clean Water
Fertilizer
BioChar
Biogenic CO2
Crop Residue
City Waste
Wood/Forest Residue
Energy Crops
Algae
Gasoline, Jet and Diesel Range HCs
Feed
Products

04/15/2023 8
IH2 Transformative Differentiators
• Fungible, high purity hydrocarbon fuel and/or blend stock products
• Nearly carbon neutral*
• Feedstock flexible w/ high product yields – 67-157 US gallons/US ton
• Attractive economics – ~ $2/gal; 500 dry MT/day wood; USGC– Low capex (4 major process steps, low pressure, non corrosive)– Low opex (feedstock predominates)
• Exothermic process with 72% - 86% bioenergy recovery (wood)
• Market Ready! Combination of Available Technologies
*>94% GHG reduction per Professor David Shonnard at MTU: http://services.lib.mtu.edu/etd/THESIS/2012/ChemicalEng/maleche/thesis.pdf

04/15/2023 9
Evolution of IH2 Technology
Hydrocarbon
Water
Total Liquid Product 2nd Gen Catalyst Lab Scale
Total Liquid Product 1st Gen Catalyst Lab Scale
Hydrocarbon
Water
Gas/Jet/Diesel Product 3rd Gen Catalyst Lab Scale
4Q09 “R5” Quality 3Q10 “R25” Quality 2Q12 “R60+” Quality
“GOAL“ Drop InStand Alone “R100”
Gasoline Product 3rd Gen Catalyst Pilot Plant Scale
Jet/Diesel Product 3rd Gen Catalyst Pilot Plant Scale
Advanced catalysts improve product, Wood Example
Water Product 3rd Gen Catalyst Pilot Plant Scale
Process & Catalyst R&D Continues

04/15/2023 10
Comparison of Liquid Quality from Woody Biomass
Pilot plant Laboratory unit
% Carbon 88.20 88.40
% Hydrogen 11.60 11.00
% Sulfur 0.02 0.02
% Nitrogen <0.10 <0.10
% Oxygen BDL BDL
Total acid number, mg KOH/g <0.05 <0.05

1104/15/2023
IH2 Liquid Product Quality(Wood)
• 3rd generation gasoline– Gasoline Meets ASTM D-4814-10b
unleaded gasoline specifications– R100 RBOB Quality Economy &
Intermediate U.S.– Evaluating EU split v EN-228
• 3rd generation diesel– Passed all D-975-11 as No 2, general
purpose middle distillate fuel as R100– Except Cetane Index & Viscosity
– Diesel aromatic, currently ~R50 Target R100
– Diesel (whole algae) likely R100 (in testing)
– Evaluating EU split v EN-590
LA options for IH2 hydrocarbons: internal consumption or export

** Prorated Expense (10%), H O & Construction (20%), Field Expense (10%), Working Capital (10%) , Project Contingency (30%)
• Stand Alone/Green Field (US Gulf Coast basis)• 2000mt/d wood (50% moisture fed, dried to 10% moisture at 1st stage)• 60% financed at 8% interest, overall 10% IRR• Feed Stock ~55% of Operating Cost• No subsidies, tax, RIN or carbon credits included!• Minimum Fuel Selling Price – $0.433/L (2007) $0.476/L (2012)
• Refinery Synergy w/Refinery H2 Supply
• Reduces TIC ~55.0MM$ • Estimated MFSP $0.359/L (2007) $0.394/L (2012)
• KBR FEL-3 underway• Opex validated by prospective clients
IH2 Process Economics (USGC) NREL 09/12 Basis
04/15/2023 12
127.5
6.3
13.2
116.5
Installed Equipment Costs
Land/Develop
Permits & S/U
Standard Project Add-In's**
Total Capital Investment $263mln
91.31
7.8
2.14
17.3
5.929.6
Wood $71.97/dry ton
Other Op Costs: Catalyst, Disposal, etc.
Fixed Cost
Depreciation
Avg Income Tax
Avg ROI
Operating Costs Total $1.64/gal*
*Includes $0.1884/gal coproduct credit
4.7
17.7 4.0
55.02.8
2.8
40.5
Feed
1st Stage/2nd Stage
Fractionation
HMU
Ammonium Sulfate
Absorption/Stripping
Utilities & Contingency @ 35%
Installed Equipment Costs $127.5mln
04/15/2023 13
Sugar/Ethanol Important Latin American Region
CountryArea Production Productivity % of World
Production(million ha) (million tons) (Tons/ha)
Brazil 5.343 386.2 72.3 29%
India 4.608 289.6 62.8 22%
China 1.328 92.3 65.5 7%
Thailand 0.97 64.4 66.4 5%
Pakistan 1.086 52 47.9 4%
Mexico 0.639 45.1 70.6 3%
Colombia 0.435 36.6 84.1 3%
Australia 0.423 36 85.1 3%
USA 0.404 31.3 77.5 2%
Philippines 0.385 25.8 67.1 2%
Indonesia 0.35 25.6 73.1 2%
Cuba 0.654 22.9 35 2%
South Africa 0.325 20.6 63.4 2%
Argentina 0.295 19.2 65.2 1%
Myanmar 0.165 7.5 45.4 1%
Bangladesh 0.166 6.8 41.2 1%
WORLD 20.42 1333.2 65.2 100%
• ~38% World Sugar Cane (SC)• Brazil, Colombia, Argentina known SC Ethanol Producers; Guatemala, Jamaica,
Costa Rica, El Salvador export SC Ethanol • Residual materials – Bagasse, Cane Trash, Filter Cake, Spent Wash, Molasses• Next Generation Biofuels – Brazil • IH2 w/Sugar/Ethanol Cellulosic Hydrocarbon
Sugar Cane Production Data & Sugar Cane Growth Region Map http://www.sugarcanecrops.com/

04/15/2023 14
CogenerationSteam Electricity34.5 – 65 GW/yr**
IH2 Integration w/ Sugar/Ethanol
*Material Energy Balance provided by J.P.Mukherji Associates Pvt. Ltd. – India ~150 days Operation, Bagasse @50% Moisture, Indian Sugar Mill Typical
Sugar/Ethanol plant 160 t/hr SugarcaneExcess Bagasse: 41.8 t/hr; 147854t/yr*
IH2
Hydrocarbon & Steam*** Electricity
32.1 MML Hydrocarbon/yr ** Location, Cogeneration Equipment Efficiency,
Steam T, P, Distribution Losses, etc. impact final GW available for sale to Grid *** 72% - 86% bioenergy recovery

04/15/2023 15
IH2 Integration w/ Sugar/Ethanol High Level Evaluation
CogenerationSteam Electricity34.5 – 65 GW/yr**
IH2
Hydrocarbon & Steam*** Electricity
32.1 MML Hydrocarbon/yr
** Location, Cogeneration Equipment Efficiency, Steam T, P, Distribution Losses, etc. impact final GW available for sale to Grid
*** 72% - 86% bioenergy recovery
• IH2 Liquid hydrocarbons benefit v Cogeneration
• IH2 Location specific– Commodity Price– Conversion – Efficiency– IH2 Capital MFSP
• IH2 Hydrocarbon Only• IH2 Feed Flexible
– Other Sugar/Ethanol residues
– Local Alternative Feeds
World bank – gasoline base prices by country Business week – Electricity prices by country 08/12* Brazil has since reduced electricity price per KWH Car
ibbe
an sm
all s
tate
s
Latin
Am
erica
& C
arib
bean
North
Am
erica
Wor
ld
Argen
tina
Brazil
*
Chile
Colom
bia
Costa
Rica
Domin
ican
Repub
lic
Ecuad
or
El Sal
vado
r
Guate
mal
a
Guyan
a
Hondu
ras
Jam
aica
Mex
ico
Parag
uay
Peru
Unite
d Sta
tes
Urugu
ay
Venez
uela
, RB
$-
$5.00
$10.00
$15.00
$20.00
$25.00
$30.00
$35.00
$40.00
$45.00
Bagasse Conversion Cogeneration v IH2 Hydrocarbon
IH2 Hydrocarbon @ Resale 75% of Retail IH2 Hydrocarbon @ Resale 50% of Retail Low - Electricity to Grid
High - Electricity to Grid Average - Electricity to Grid
Est
imat
ed M
M$/
yr

• Bench Scale– 02/2009 @ 0.5kg/hr
• Pilot Scale– 02/2012 @ 50kg/d– Confirmed bench scale results– Fuels for EPA Registration– Fuels for ASTM Evaluation
– Gasoline (wood) is R100
• Pre Commercial Scale– BDEP for 5mt/d cellulose done – 1st demonstration license awarded 12/2012, more expected
• Commercial Scale– KBR is CRI’s exclusive basic engineering partner– FEED 500 & 1000mt/d wood (FEL-2 complete, FEL-3 underway)– Full Scale Deployment Target Q1 2014
IH2 Technology Deployment
1604/15/2023
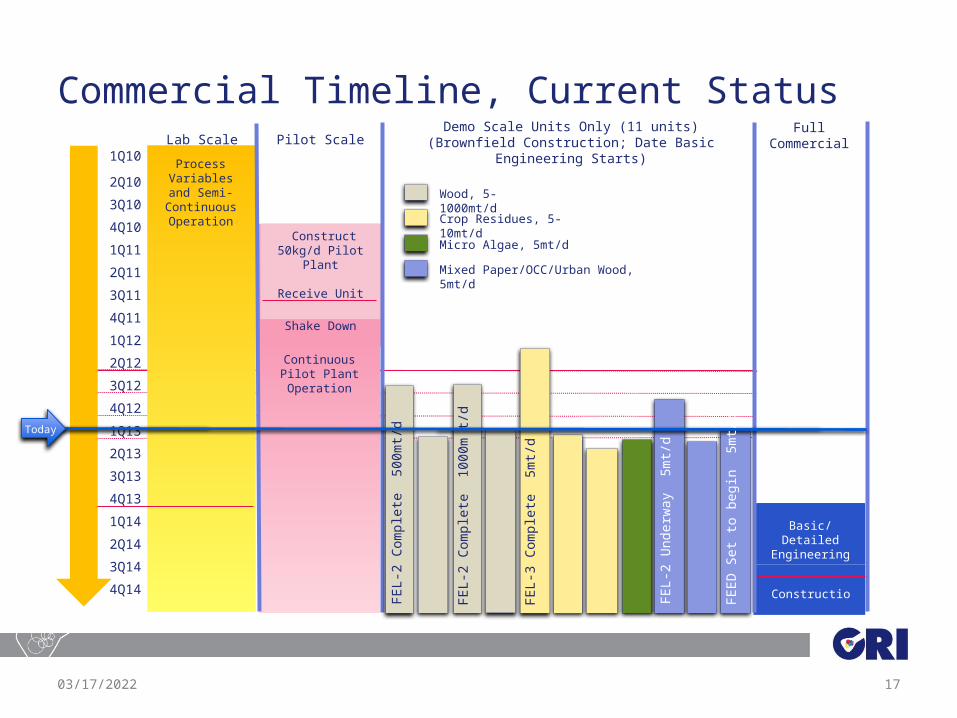
Commercial Timeline, Current Status
04/15/2023 17
1Q10
2Q10
3Q10
4Q10
1Q11
2Q11
3Q11
4Q11
1Q12
2Q12
3Q12
4Q12
1Q13
2Q13
3Q13
4Q13
1Q14
2Q14
3Q14
4Q14
Process Variables and
Semi-Continuous Operation
Lab ScaleDemo Scale Units Only (11 units)
(Brownfield Construction; Date Basic Engineering Starts)Full
Commercial
Construction
Basic/Detailed Engineering
Construct 50kg/d Pilot Plant
Receive Unit
Pilot Scale
Continuous Pilot Plant Operation
Shake Down
Wood, 5-1000mt/d
Crop Residues, 5-10mt/d
Micro Algae, 5mt/d
Mixed Paper/OCC/Urban Wood, 5mt/d
FE
L-3
Com
plet
e 5
mt/d
FE
L-2
Com
plet
e 5
00m
t/d
FE
L-2
Com
plet
e 1
000m
t/d
Today
FE
L-2
Und
erw
ay 5
mt/d
FE
ED
Set
to b
egin
5m
t/d

– Cost-effective process developed by GTI using CRI proprietary catalysts
– Converts biomass directly to hydrocarbon fuels and/or high quality blend stocks
– Self-sufficient & self-sustaining w/ little lasting environmental impact, needs only transport in/out
– Feedstock flexible– Nearly carbon-neutral – Integrated for potentially improved economics– Currently in FEED (FEL-2/-3) for multiple feed demonstrations– Available exclusively from CRI Catalyst Company
1804/15/2023
Technology is:

04/15/2023 19
Assumptions, Credits, References
1. Slide 3 Image credit: <a href='http://www.123rf.com/photo_10846628_a-group-of-illustrated-3d-people-are-arranged-in-a-circle-around-the-words-let.html'>iqoncept / 123RF Stock Photo</a>
2. Slide 6 Image credit: <a href='http://www.123rf.com/photo_14316634_the-big-question-silberblau.html'>styleuneed / 123RF Stock Photo</a>
3. Slide 8 Transformative Differentiators *>94% GHG reduction per Professor David Shonnard at MTU: http://services.lib.mtu.edu/etd/THESIS/2012/ChemicalEng/maleche/thesis.pdf
4. Slide 8 Image credit: <a href='http://www.123rf.com/photo_12407917_butterflies-from-the-chrysalis.html'>kamonrat / 123RF Stock Photo</a>
5. Slide 11 – Hart Energy’s international Fuels Quality Center – Sulfur Limit World Graphs for Diesel and Gasoline
6. Slide 12 IH2 Process Economics (USGC) NREL 06/11 Basis http://www.osti.gov/bridge/servlets/purl/1059031/1059031.pdf
7. Slide 13 - According to the Renewable Fuels Association, Jamaica, Costa Rica and El Salvador are respectively the second-, third- and fourth largest exporters of fuel ethanol to the US. The region began exporting ethanol to the US under the Caribbean Basin Initiative, which allowed tariff-free exports of ethanol up to 7 percent of US ethanol production.
8. Slide 13 Data & Sugarcane Map via http://www.sugarcanecrops.com/
9. Slide 13 Sugar Cane Photograph By Rufino Uribe (caña de azúcar) [CC-BY-SA-2.0 (http://creativecommons.org/licenses/by-sa/2.0)], via Wikimedia Commons
10. Slide 14 Maximize Returns w/ IH2 Integration Sugar/Ethanol Material Energy Balance provided by J.P.Mukherji Associates Pvt. Ltd
11. Data Assumptions used for Slide 15 Maximize Returns w/ IH2 Integration Sugar/Ethanol – http://www.businessweek.com/articles/2013-02-07/brazils-cheaper-electricity-comes-at-a-cost - Electricity Prices– http://data.worldbank.org/indicator/EP.PMP.SGAS.CD/countries?display=default – World Bank Gasoline Prices by Country (2010)– http://www.eia.gov/petroleum/marketing/monthly/pdf/pmmgraphic.pdf -- Discount Resale Gasoline Price U.S. Used to Adjust World Bank Values to
Resale taken at 75% of Retail based on U.S. reduction retail to resale taken from eia data. – Conservative estimate for IH2 hydrocarbon value was taken at reduced rate of 50% of retail for each country – http://www.bls.gov/data/inflation_calculator.htm CPI Inflation Calculation taken at 106% conversion 2010 to 2013$ – Economic benefits included are for illustration only. Further economic evaluation should be conducted on a site specific basis.– Electricity conversion was estimated based on Mass Balance provided by J.P. Mukherji Associates Pvt. Range of electricity conversion was assumed
based on internal values for conversion . Low end total GW produced assumed an 80% efficiency and high end assumed no losses. Estimated electricity price applied to calculation for the Low scenario assumed 80% of the retail electricity price was the selling rate per KWH back to the grid. High scenario assumed the selling rate per KWH was the same as retail price.
12. Slide 14 &15 electricity pylon Image credit: <a href='http://www.123rf.com/photo_9268750_electricity-pylon--tower-with-fluffy-white-clouds-and-blue-sky-background.html'>peteg / 123RF Stock Photo</a>

Thank You, Gracias & Obrigada
04/15/2023 20
Learn more at www.cricatalyst.com


![CRIMINOLOGIA [ CRI ] - lumsa.it · CRIMINOLOGIA [ CRI ] Offerta didattica a.a. 2013/2014 Docenti:ANGELO MANGIONE Periodo: Secondo Ciclo Semestrale Obiettivi formativi Acquisizione](https://static.fdocuments.us/doc/165x107/5c18156309d3f205588c6598/criminologia-cri-lumsait-criminologia-cri-offerta-didattica-aa.jpg)