
Credit Suisse Equity Research Americas/United States Power ...
71
DISCLOSURE APPENDIX AT THE BACK OF THIS REPORT CONTAINS IMPORTANT DISCLOSURES, ANALYST CERTIFICATIONS, LEGAL ENTITY DISCLOSURE AND THE STATUS OF NON-US ANALYSTS. US Disclosure: Credit Suisse does and seeks to do business with companies covered in its research reports. As a result, investors should be aware that the Firm may have a conflict of interest that could affect the objectivity of this report. Investors should consider this report as only a single factor in making their investment decision. Credit Suisse Equity Research Americas/United States Power & Utilities Primer 9 April 2018 RESEARCH TEAM Michael Weinstein, ERP Research Analyst (212) 325-0897 [email protected] Khanh Nguyen, CFA (212) 538-3524 [email protected] Maheep Mandloi (212) 325-2345 [email protected] Aric Li (212) 325-2679 [email protected]
Transcript of Credit Suisse Equity Research Americas/United States Power ...

DISCLOSURE APPENDIX AT THE BACK OF THIS REPORT CONTAINS IMPORTANT DISCLOSURES, ANALYST CERTIFICATIONS, LEGAL ENTITY
DISCLOSURE AND THE STATUS OF NON-US ANALYSTS. US Disclosure: Credit Suisse does and seeks to do business with companies covered in its
research reports. As a result, investors should be aware that the Firm may have a conflict of interest that could affect the objectivity of this report. Investors should
consider this report as only a single factor in making their investment decision.
Credit Suisse Equity Research
Americas/United States
Power & Utilities Primer
9 April 2018
RESEARCH TEAM
Michael Weinstein, ERP
Research Analyst
(212) 325-0897 [email protected]
Khanh Nguyen, CFA
(212) 538-3524 [email protected]
Maheep Mandloi
(212) 325-2345 [email protected]
Aric Li
(212) 325-2679 [email protected]
1
5 Year 10 Year 15 Year 20 Year
0.0%
5.0%
10.0%
15.0%
20.0%
Reg. w/o Div. Reinvestment Reg. w/ Div. Reinvestment
S&P 500 w/o Div. Reinvestment S&P 500 w/ Div. Reinvestment
5 Year 10 Year 15 Year 20 Year
0.0%
5.0%
10.0%
15.0%
20.0%
25.0%
Reg. w/o Div. Reinvestment Reg. w/ Div. Reinvestment
S&P 500 w/o Div. Reinvestment S&P 500 w/ Div. Reinvestment
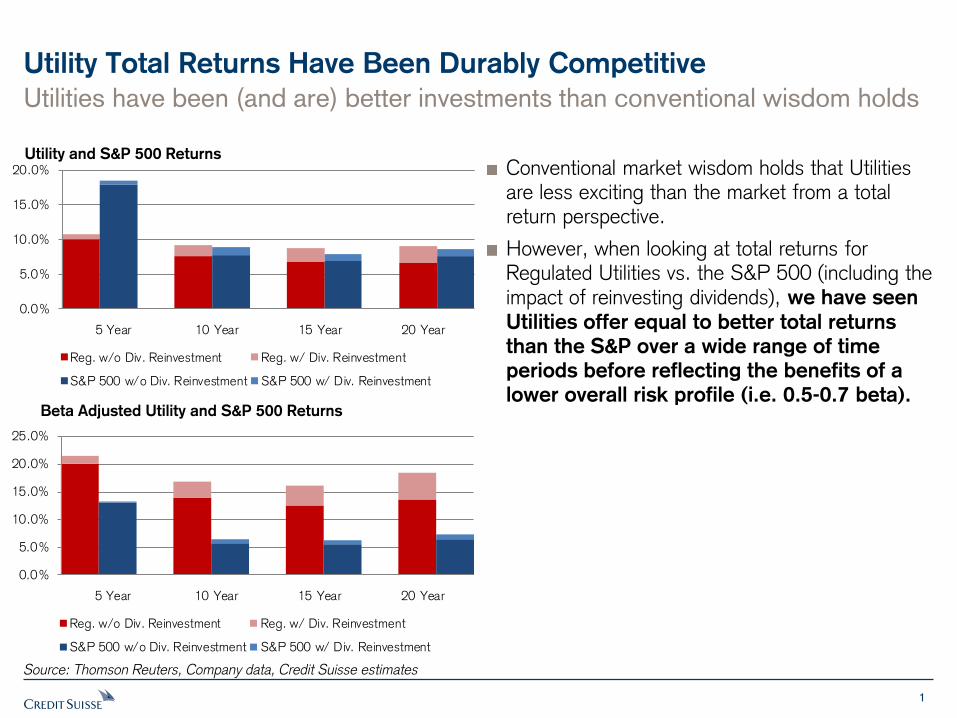
Utility Total Returns Have Been Durably Competitive
Utilities have been (and are) better investments than conventional wisdom holds
Utility and S&P 500 Returns Conventional market wisdom holds that Utilities are less exciting than the market from a total return perspective.
However, when looking at total returns for Regulated Utilities vs. the S&P 500 (including the impact of reinvesting dividends), we have seen
Utilities offer equal to better total returns
than the S&P over a wide range of time
periods before reflecting the benefits of a
lower overall risk profile (i.e. 0.5-0.7 beta).
Source: Thomson Reuters, Company data, Credit Suisse estimates
Beta Adjusted Utility and S&P 500 Returns
2
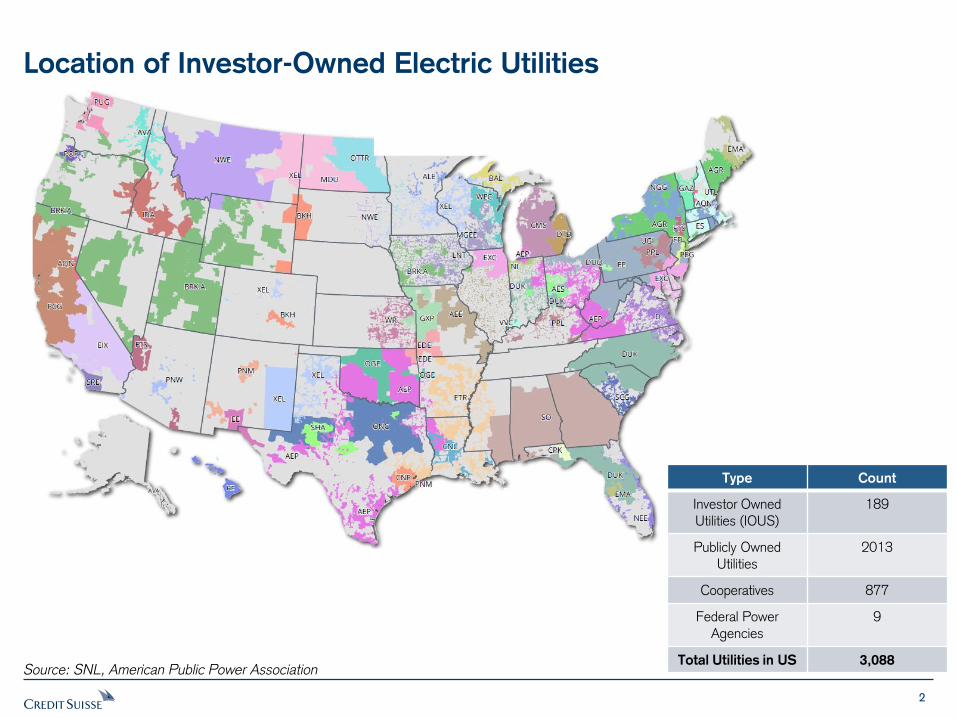
Location of Investor-Owned Electric Utilities
Source: SNL, American Public Power Association
Type Count
Investor Owned Utilities (IOUS)
189
Publicly Owned Utilities
2013
Cooperatives 877
Federal Power Agencies
9
Total Utilities in US 3,088
3
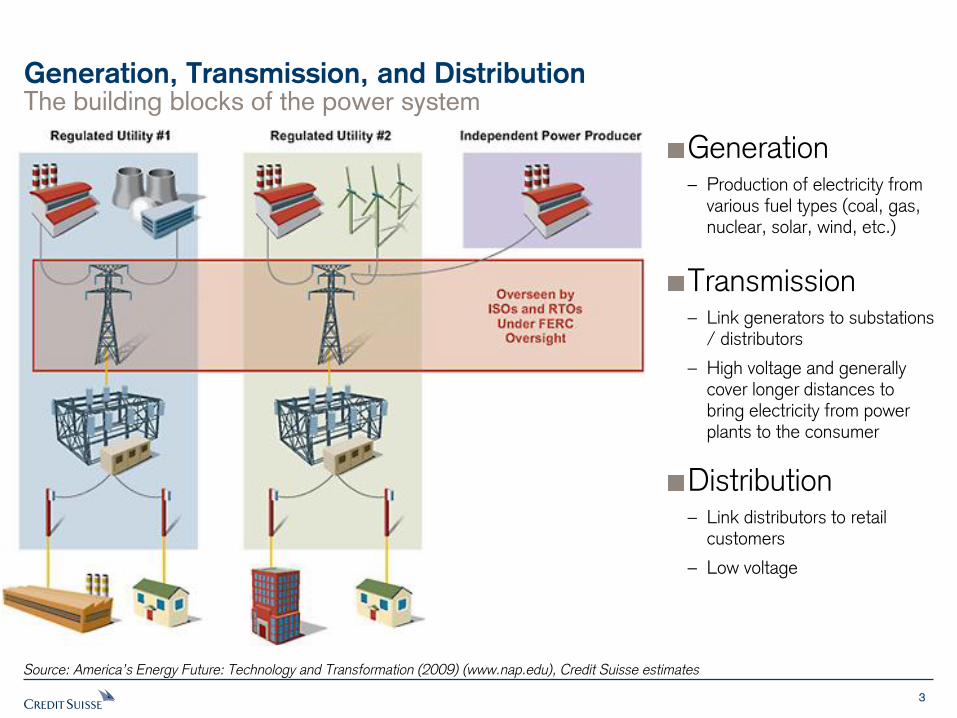
The building blocks of the power system
Generation, Transmission, and Distribution
Source: America’s Energy Future: Technology and Transformation (2009) (www.nap.edu), Credit Suisse estimates
Transmission – Link generators to substations
/ distributors
– High voltage and generally cover longer distances to bring electricity from power plants to the consumer
Distribution – Link distributors to retail
customers
– Low voltage
Generation – Production of electricity from
various fuel types (coal, gas, nuclear, solar, wind, etc.)

4
True power market competition is concentrated in the Northeast and Texas
Power Markets: Regulated, Deregulated, and Some In-between
Regulated vs. Deregulated Electricity Markets
Source: SNL
Starting in the mid-1990s a number of states started the process of deregulating power markets on the premise that competition would lower costs. In almost all cases of deregulation, the states left transmission and distribution (T&D) assets as regulated utilities while power generation transitioned to competition. After the Enron / California Energy crisis, interest in deregulation slowed materially.
While explicitly broken out as three buckets, we would think of states as either being deregulated (the green ones) and regulated (red/yellow) since the partially deregulated states do not have a particularly functional competitive backdrop.

5
Regulated Utilities Integrateds IPPs
Company Ticker
Mkt. Cap
($ BN) Company Ticker
Mkt. Cap
($ BN) Company Ticker
Mkt. Cap
($ BN)
1 Duke Energy DUK $52.8 1 NextEra Energy* NEE $73.6 1 NRG Energy* NRG $8.9
2 Dominion Resources D $48.4 2 Dominion Resources D $48.4 2 AES Corp* AES $7.2
3 Southern Co. SO $44.6 3 Exelon Corp EXC $35.6 3 Calpine* CPN $5.5
4 American Electric Power* AEP $32.1 4 Sempra Energy* SRE $27.3 4 Dynegy* DYN $2.2
5 Consolidated Edison ED $23.1 5 Public Svc. Enterprise Grp* PEG $24.1
6 Xcel Energy* XEL $21.9 6 FirstEnergy Corp* FE $15.4
7 PG&E Corp* PCG $21.0 7 Entergy Corp* ETR $13.8
8 Edison International* EIX $19.4
9 PPL Corp* PPL $19.2
10 Wisconsin Energy* WEC $18.8
11 DTE Energy DTE $18.7
12 Eversource Energy ES $18.1
13 American Water Works Corp.* AWK $14.1
14 Ameren Corp* AEE $13.1
15 CMS Energy Corp CMS $12.0
16 Alliant Energy Corp.* LNT $8.8
17 Pinnacle West* PNW $8.6
18 Westar Energy* WR $6.9
19 Great Plains Energy * GXP $6.3
20 OGE Energy Corp.* OGE $6.2
21 Scana* SCG $5.7
22 Portland General * POR $3.5
23 Allete Inc.* ALE $3.5
24 Spire SR $3.3
25 Avista * AVA $3.2
26 Black Hills Corp BKH $3.0
27 PNM Resources* PNM $2.9
28 NorthWestern Energy NWE $2.5
29 El Paso Electric* EE $2.0
* Not covered by Credit Suisse
Overview of Regulated Utilities, Integrateds and IPPs
Source: Thomson Reuters, Credit Suisse estimates

6
US Power & Utilities
Sector Looks Fairly Valued Now - Favor Integrated Utilities on Market Reforms
Overall, US regulated utilities look fairly valued at current parity to the S&P 500 P/E. They should be at a 3% discount based on correlation to a 2.9% 10-year bond yield , adjusted for tax reform impacts. 15% underperformance since November has been driven by broad sector rotation on higher rates and the expectation that tax reforms will benefit the sector, but not as much as other unregulated sectors that do not have to share benefits with customers. More recent outperformance is likely the result of defensive positioning during broader market volatility.
Integrated utilities with exposure to unregulated wholesale electric markets benefit from energy market reforms in 2018 (green line). Includes Outperform rated EXC and to a lesser extent, D and NEE. After years of underperforming pure regulated utilities, these Integrateds are poised to continue outperformance that began in 2017, especially as rates rise, pressuring regulated yield-play utilities more. Federal regulators are expected to order grid operators to implement reforms to energy markets in 2H 2018 that benefit core baseload nuclear and coal resources. These companies have unregulated assets that will keep the extra revenues, although could see some offsetting effect in lower PJM capacity pricing but still expect breakouts for ComEd and EMAAC. EXC is by far the most exposed and should benefit ~$0.25 EPS with a 19-GW nuclear fleet in 2019 and beyond.
Stepping off the gas. Gas utilities have been outperforming electrics for years on higher revenue growth and less volatile regulation schemes (and M&A consolidation), but we see more in-line performance for 2018.
10-Yr Bond Yield vs 2-Yr Forward Relative P/E Utes vs SPX Utilities look about 6% expensive vs historic correlation to bond yields
Utilities Subsector Relative Performance, 2015-2017 Integrateds mounting a comeback while gas utilities take a pause
Source: Bloomberg, Credit Suisse custom indices

7
US Power & Utilities
Longer-term Look at Relative P/E Shows Lower Discounts in the 1980s and 1990s, but Bond Yields Were Much Higher
10-Yr Bond Yield vs 2-Yr Forward Relative P/E Utes vs SPX – Compared to Moody’s Utilities BAA Bond Yields, US 10-Year Bond Yields, and Regulated Utilities Dividend Yield
Source: Thomson Reuters, Company data, the BLOOMBERG PROFESSIONAL ™ service

8
US Power & Utilities
Dividend Yield Support Is Taking Hold
Utility dividend yields remain ~88 bps above Treasury bond yields – and that’s not normal. The current situation where ultra-low Treasury bond yields are lower than utility dividend yields is abnormal vs history. Recall that before 2008, bond yields used to be higher by as much as 200 bps and investors believed that dividend yields should be lower as equities have capital appreciation based on 10-15% “safe” ROEs.
We have begun to take notice of the contracting spread between rising 10-year Bond yields and utility dividend yields during recent market volatility, a possible sign that the group is responding more positively to its underlying yield support in the face of rising rates. We continue to expect this more recent trend to revert back to “normal” as bond yields begin to rise again, especially as they move out of an “ultra-low” condition and back toward 3.5%-4.5% levels (10-year). Hence, we see the current “inverse” relationship (red spread in the chart) as a sort of cushion for equity prices against the impact of rising interest rates and bond yields.
Utilities are trading at relative fair value now. Also, the historic correlation to the 10-Year Treasury Yield suggests that utility P/Es should be 97% of the S&P 500 P/E (adjusted down 6% for tax reforms).
Looking for Green Again - Utility Dividend Yields vs. 10-Yr Bond Yield Spread since 1993
Correlation of Relative P/E to 10-Year Treasury Yields
Source: Bloomberg, Credit Suisse custom indices

9
0
2
4
6
8
10
12
14
16
18
1/80 1/90 1/00 1/10
Yie
ld (
%)
10YR Treasury Reg Utilities Div Yld
R-squared:
'80 - '89: 0.86 '90 - '99: 0.82 '00 - '09: 0.31
'10 - '13: 0.4
'14 - Today: 0.35
Utilities deserved the bond proxy title in the ‘80s and ‘90s; Less so today
Utilities Are Less of a Bond Trade Today than in the Past
10-Yr vs. Dividend Yield (1980-Present)
Source: Thomson Reuters, Company data, the BLOOMBERG PROFESSIONAL ™ service
The correlation between dividends and bond yields have declined over time, with R-squareds falling from 0.7-0.9 during the 1980s and 1990s to something in the 0.4-0.5 range lately.
We think the deterioration in yields vs rates makes sense given the change in growth for utilities:
– During the ‘80s / ‘90s utilities showed EPS growth of 1-1.5% on average while dividend yields were 6-12% leaving them much like a bond proxy
– Over the last 10 years growth has been ~4.5% and yields are 4% leaving more of the value proposition coming from growth rather than yield.

10
Intra-sector Correlations Have Dropped Sharply in the Past Year
Correlations and Volatility. The next two charts illustrate the increasing correlation between utility stock movements since 1990 (an average of each stock’s correlation vs. the group average daily movement), even while annualized volatility has remained fairly steady aside from recessionary spikes in 2001-2003 and 2007-2010.
Higher correlations since 1990 are likely a symptom of increased hedge-fund participation in the sector, programmatic trading, and the popularity of Exchange Traded Funds (ETFs), with higher correlations making it tougher on market/beta-neutral strategies typically run by sector-focused hedge funds.
Correlations are lower recently. However, the more recent reduction in average sector correlations since July 2017 is notably pronounced and harder to write off as a temporary blip. Reduced correlation may be an indicator of less defensive “whole-basket trading” and more fundamentals-based value and growth trading.
Average Rolling 1-Year Correlation of Daily Price Changes for Electric Utilities vs. the Group Average, 1990-2018
Average Rolling Annualized Volatility for Electric Utilities, 1990-2018
40%
50%
60%
70%
80%
90%
100%
1/1/19
90
1/1/19
91
1/1/19
92
1/1/19
93
1/1/19
94
1/1/19
95
1/1/19
96
1/1/19
97
1/1/19
98
1/1/19
99
1/1/20
00
1/1/20
01
1/1/20
02
1/1/20
03
1/1/20
04
1/1/20
05
1/1/20
06
1/1/20
07
1/1/20
08
1/1/20
09
1/1/20
10
1/1/20
11
1/1/20
12
1/1/20
13
1/1/20
14
1/1/20
15
1/1/20
16
1/1/20
17
1/1/20
18
Average Rolling 1-Year Correlation of Daily Price Changes for Electric Utilities vs
the Group Average, 1990-2017
0.00%
5.00%
10.00%
15.00%
20.00%
25.00%
30.00%
35.00%
40.00%
45.00%
50.00%
1/1/19
90
1/1/19
91
1/1/19
92
1/1/19
93
1/1/19
94
1/1/19
95
1/1/19
96
1/1/19
97
1/1/19
98
1/1/19
99
1/1/20
00
1/1/20
01
1/1/20
02
1/1/20
03
1/1/20
04
1/1/20
05
1/1/20
06
1/1/20
07
1/1/20
08
1/1/20
09
1/1/20
10
1/1/20
11
1/1/20
12
1/1/20
13
1/1/20
14
1/1/20
15
1/1/20
16
1/1/20
17
1/1/20
18
Average Rolling Annualized Volatility for Electric Utilities, 1990-2017
Source: Bloomberg, Credit Suisse custom indices

11
Lowering tax rate to 21% allows potential 11% increase in ratebase
Lowering O&M Creates Headroom to Support Incremental Capex
Source: Credit Suisse estimates
Savings and Incremental Capex Equivalent
Reducing operating expenses leaves “headroom” in customer revenues to support higher capital cost for stronger investment, opening up the opportunity for utilities to invest additional capex at 7-8x the savings.
Lower income tax rates help just the same. For example, $1 of savings supports $7.3 of ratebase under 35% tax rate or $8.1 of ratebase under 21% tax rate (11% more).
Increasing a regulated annual capital budget by 11% further translates into 150 bps of additional growth CAGR if fully invested plus another 20 bps from reduced deferred taxes (typically a subtraction from ratebase). See next slide.
Savings and Incr. Capex Savings and Incr. Capex Savings and Incr. Capex
Rate Base 7.25$ Rate Base 8.05$
Equity 50% Equity 50%
ROE 10.0% ROE 10.0%
Interest Rate 5.5% Interest Rate 5.5%
Depr Life 30 Depr Life 30
Tax Rate 35% Tax Rate 21%
Net Income 0.36$ Net Income 0.40$
Taxes 0.20$ Taxes 0.11$
Pre-tax Income 0.56$ Pre-tax Income 0.51$
Int Exp 0.20$ Int Exp 0.22$
Depr 0.24$ Depr 0.27$
Revenues 1.00$ Revenues 1.00$

12
Steel for Fuel - A Cleaner Way to Boost Growth
With fuel costs as a pass-through expense (no return earned) for regulated utilities, utilities have a built-in incentive to build more renewables.
Replacing fossil fuel generation with wind resources reduces the fuel portion of a customer’s bill and substitutes it with recovery of and on capital investment in wind turbines (and solar panels).
This strategy, which was pioneered by XEL under its “steel for fuel” program, is under consideration by CMS and others.
Win-win situation for regulators, consumers, and environmental groups, striking a balance between supporting state RPS goals and stabilizing customer rates.
Source: NextEra Energy, Tennessee Valley Authority, http://www.yokogawa.com, Credit Suisse estimates
Lowering fuel costs also provides room in customer bills for clean investment Steel for Fuel
13
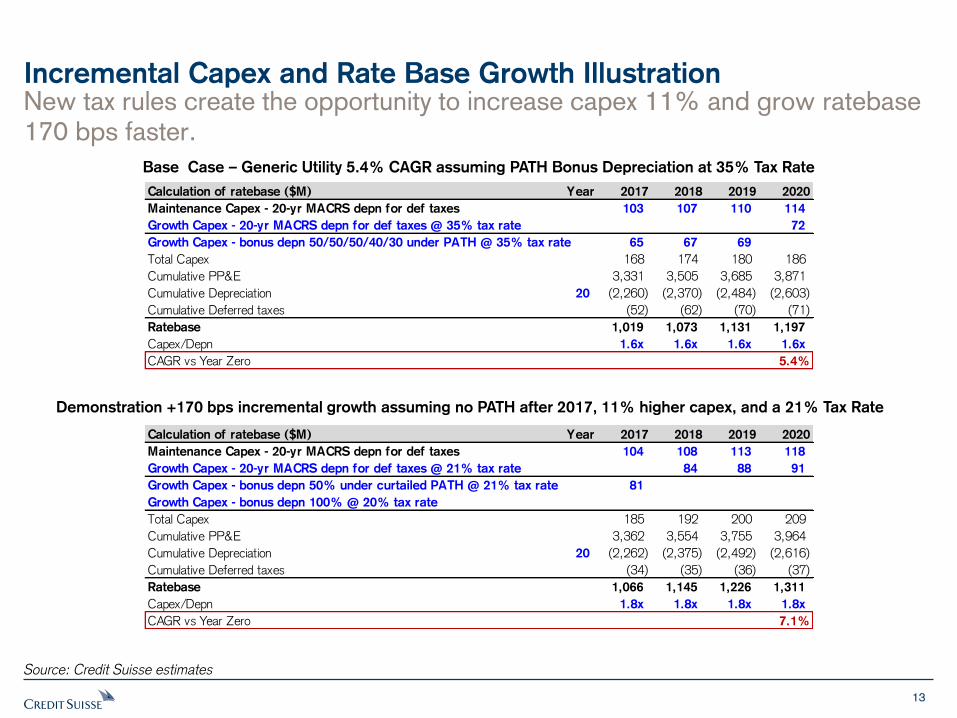
New tax rules create the opportunity to increase capex 11% and grow ratebase 170 bps faster.
Incremental Capex and Rate Base Growth Illustration
Base Case – Generic Utility 5.4% CAGR assuming PATH Bonus Depreciation at 35% Tax Rate
Demonstration +170 bps incremental growth assuming no PATH after 2017, 11% higher capex, and a 21% Tax Rate
Source: Credit Suisse estimates
Calculation of ratebase ($M) Year 2017 2018 2019 2020
Maintenance Capex - 20-yr MACRS depn for def taxes 103 107 110 114
Growth Capex - 20-yr MACRS depn for def taxes @ 35% tax rate 72
Growth Capex - bonus depn 50/50/50/40/30 under PATH @ 35% tax rate 65 67 69
Total Capex 168 174 180 186
Cumulative PP&E 3,331 3,505 3,685 3,871
Cumulative Depreciation 20 (2,260) (2,370) (2,484) (2,603)
Cumulative Deferred taxes (52) (62) (70) (71)
Ratebase 1,019 1,073 1,131 1,197
Capex/Depn 1.6x 1.6x 1.6x 1.6x
CAGR vs Year Zero 5.4%
Calculation of ratebase ($M) Year 2017 2018 2019 2020
Maintenance Capex - 20-yr MACRS depn for def taxes 104 108 113 118
Growth Capex - 20-yr MACRS depn for def taxes @ 21% tax rate 84 88 91
Growth Capex - bonus depn 50% under curtailed PATH @ 21% tax rate 81
Growth Capex - bonus depn 100% @ 20% tax rate
Total Capex 185 192 200 209
Cumulative PP&E 3,362 3,554 3,755 3,964
Cumulative Depreciation 20 (2,262) (2,375) (2,492) (2,616)
Cumulative Deferred taxes (34) (35) (36) (37)
Ratebase 1,066 1,145 1,226 1,311
Capex/Depn 1.8x 1.8x 1.8x 1.8x
CAGR vs Year Zero 7.1%

14
Utilities Offer Competitive Total Returns to S&P and Lower Risk
Generally, Utilities offer 5%-8% average EPS growth and a ~3.6% dividend yield, generating total returns (unadjusted) of ~10%-11% at a low 0.6-0.7x beta.
At a 21% tax rate and adjusting for risk (beta), utilities provide a ~14.3% risk adjusted total return which implies a -2.9% P/E premium vs the S&P. We estimate that this is -6% less than the 3.0% premium justified at a 35% tax rate.
The S&P 500 offers 2.0% yield and long-term growth of 10.5%-13%, providing slightly higher total return yet at a higher beta.
Source: Thomson Reuters, Credit Suisse estimates
Risk-Adjusted Total Return, Utilities vs S&P 500
Utes @ 35% tax S&P @ 35% tax
Implied Utes
Premium (Discount)
Div 3.6% 2.0%
EPS Growth * 6.0% 10.5%
Beta 0.65 1.00
Risk-adjusted Total Return 12.9% 12.5% 3.0%
Utes @ 21% tax S&P @ 21% tax
Div 3.6% 2.0%
EPS Growth 7.0% 12.8%
Beta 0.65 1.00
Risk-adjusted Total Return 14.3% 14.8% -2.9%
* CS estimate for S&P 500 growth is 10%-11% in 2018.
Assumed impacts from tax reforms on EPS growth
Utilities Impacts S&P Impacts
0.20% 2.3%
1.50% -0.30%
0.30%
1.70% 2.3%
0.95%
Combined impacts
Average low, high-end
Impact of lower deferred
tax on ratebase growth
Incremental utility growth
if reinvest tax revenues
Impact of lower tax rate
Impact of loss of int. deduction above
30% EBITDA
Impact of expensing provision on growth
through reinvested cash
Shift to a
21% tax rate
increases
the discount
by -6%
15
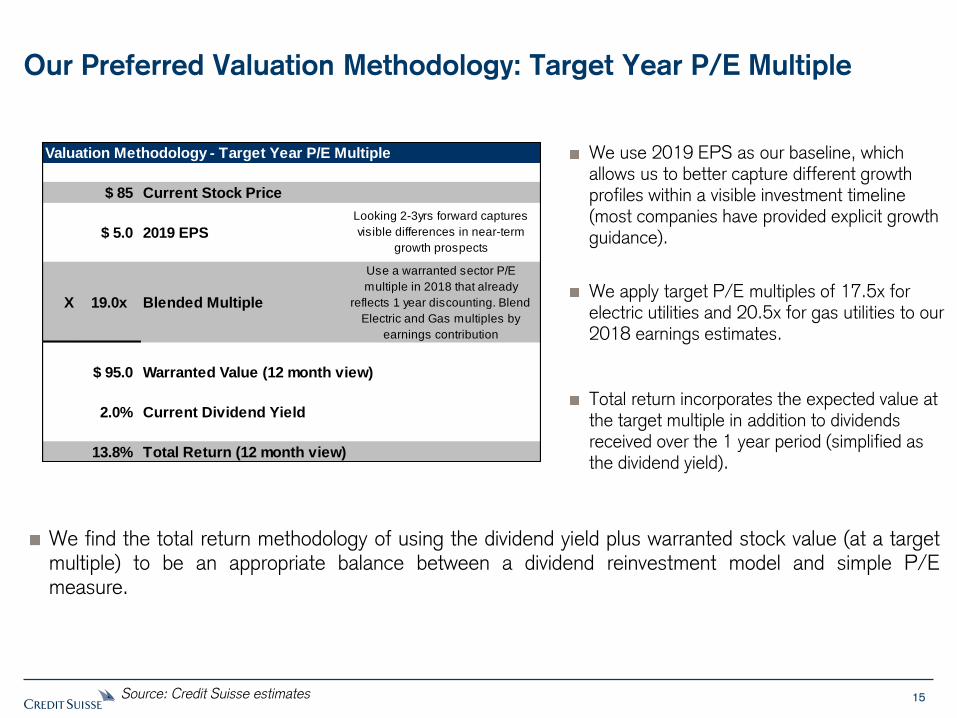
We find the total return methodology of using the dividend yield plus warranted stock value (at a target multiple) to be an appropriate balance between a dividend reinvestment model and simple P/E measure.
Source: Credit Suisse estimates
We use 2019 EPS as our baseline, which allows us to better capture different growth profiles within a visible investment timeline (most companies have provided explicit growth guidance).
We apply target P/E multiples of 17.5x for electric utilities and 20.5x for gas utilities to our 2018 earnings estimates.
Total return incorporates the expected value at the target multiple in addition to dividends received over the 1 year period (simplified as the dividend yield).
Our Preferred Valuation Methodology: Target Year P/E Multiple
Valuation Methodology - Target Year P/E Multiple
$ 85 Current Stock Price
$ 5.0 2019 EPS
X 19.0x Blended Multiple
$ 95.0 Warranted Value (12 month view)
2.0% Current Dividend Yield
13.8% Total Return (12 month view)
Use a warranted sector P/E
multiple in 2018 that already
reflects 1 year discounting. Blend
Electric and Gas multiples by
earnings contribution
Looking 2-3yrs forward captures
visible differences in near-term
growth prospects

Regulated Utilities
17
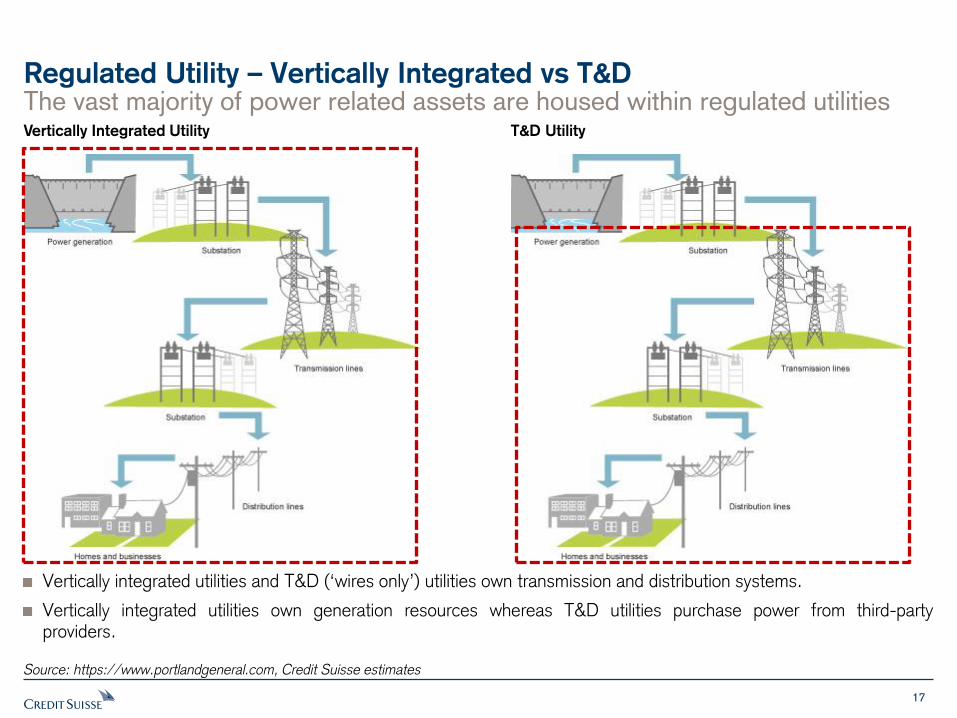
The vast majority of power related assets are housed within regulated utilities
Regulated Utility – Vertically Integrated vs T&D
Source: https://www.portlandgeneral.com, Credit Suisse estimates
Vertically integrated utilities and T&D (‘wires only’) utilities own transmission and distribution systems.
Vertically integrated utilities own generation resources whereas T&D utilities purchase power from third-party providers.
Vertically Integrated Utility T&D Utility
18
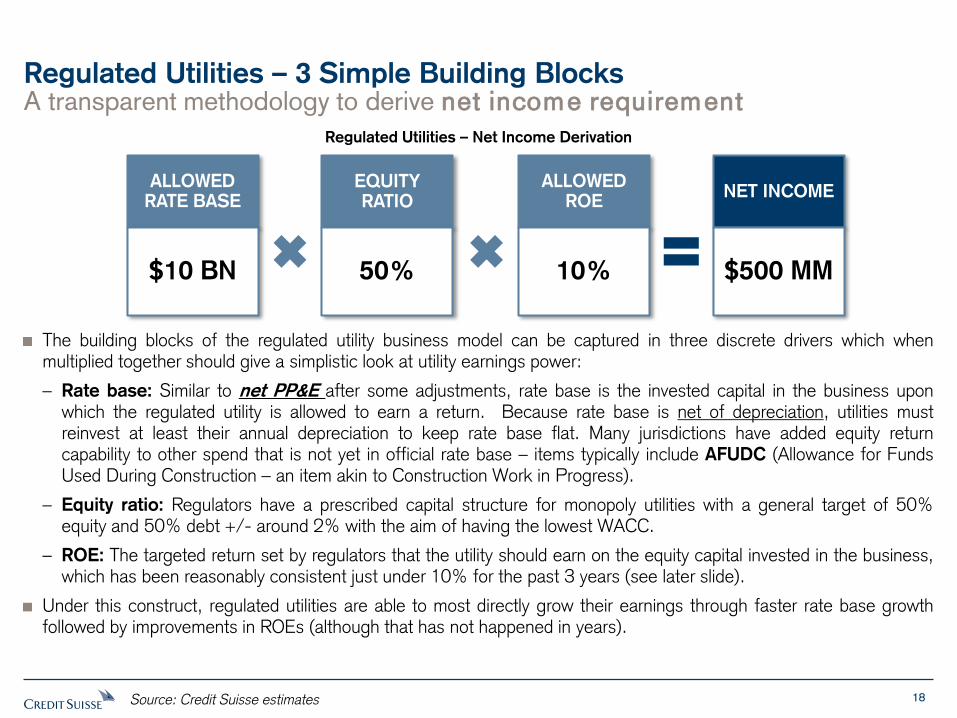
A transparent methodology to derive net income requirement
Regulated Utilities – 3 Simple Building Blocks
Regulated Utilities – Net Income Derivation
Source: Credit Suisse estimates
The building blocks of the regulated utility business model can be captured in three discrete drivers which when multiplied together should give a simplistic look at utility earnings power:
– Rate base: Similar to net PP&E after some adjustments, rate base is the invested capital in the business upon which the regulated utility is allowed to earn a return. Because rate base is net of depreciation, utilities must reinvest at least their annual depreciation to keep rate base flat. Many jurisdictions have added equity return capability to other spend that is not yet in official rate base – items typically include AFUDC (Allowance for Funds Used During Construction – an item akin to Construction Work in Progress).
– Equity ratio: Regulators have a prescribed capital structure for monopoly utilities with a general target of 50% equity and 50% debt +/- around 2% with the aim of having the lowest WACC.
– ROE: The targeted return set by regulators that the utility should earn on the equity capital invested in the business, which has been reasonably consistent just under 10% for the past 3 years (see later slide).
Under this construct, regulated utilities are able to most directly grow their earnings through faster rate base growth followed by improvements in ROEs (although that has not happened in years).
EQUITY RATIO
ALLOWED RATE BASE
ALLOWED ROE
NET INCOME
50% $10 BN 10% $500 MM
19
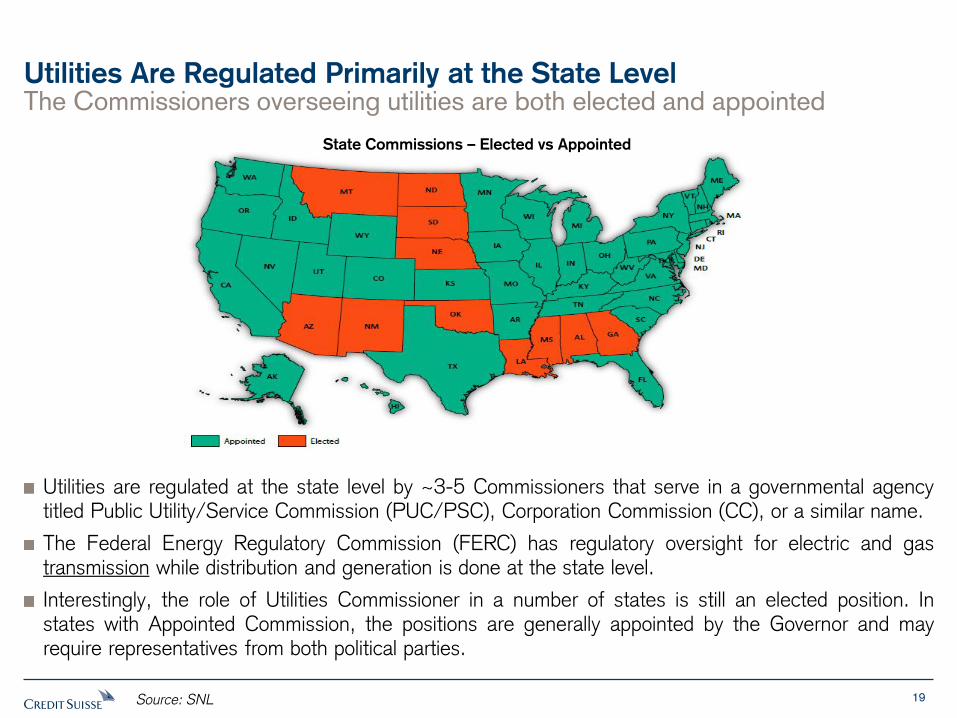
The Commissioners overseeing utilities are both elected and appointed
Utilities Are Regulated Primarily at the State Level
State Commissions – Elected vs Appointed
Source: SNL
Utilities are regulated at the state level by ~3-5 Commissioners that serve in a governmental agency titled Public Utility/Service Commission (PUC/PSC), Corporation Commission (CC), or a similar name.
The Federal Energy Regulatory Commission (FERC) has regulatory oversight for electric and gas transmission while distribution and generation is done at the state level.
Interestingly, the role of Utilities Commissioner in a number of states is still an elected position. In states with Appointed Commission, the positions are generally appointed by the Governor and may require representatives from both political parties.

20
0
20
40
60
80
100
120
1401980
1981
1982
1983
1984
1985
1986
1987
1988
1989
1990
1991
1992
1993
1994
1995
1996
1997
1998
1999
2000
2001
2002
2003
2004
2005
2006
2007
2008
2009
2010
2011
2012
2013
2014
2015
2016
2017
2018N
um
be
r o
f Rate
Case
ss C
om
ple
ted
Utilities Seek Revenue Increases Primarily Through Rate Cases
Utility rate increases are determined in a thorough regulatory proceeding
# of Rate Cases Completed per Year
Source: SNL Financial, Company Reports
Regulated utilities seek rate increases from the state regulators to receive recovery of costs and return on capital for the money they invest (growth in rate base). The process will vary by state, but generally involve extensive filings to explain in detail the need for, and financials behind, a requested increase that can run into the 1000s of pages. Rate cases generally take 9-18 months to complete with the industry norm generally around 12 months.
The industry is filing more rate cases (blue bars above) than in the 1990s and early 2000s as a result of the cyclical nature of infrastructure investment and an emphasis on environmental remediation and transmission expansion since 2005.

21
Avg. ROE Max ROE Min ROE
Year Approved Prior Change Approved Prior Change Approved Prior Change
2018 9.72 9.94 (0.21) 9.98 10.44 (0.46) 9.30 9.50 (0.20)
2017 9.62 9.88 (0.26) 10.25 10.75 (0.50) 9.00 9.00 0.00
2016 9.60 9.91 (0.32) 10.55 12.75 (2.20) 8.64 9.14 (0.50)
2015 9.64 10.12 (0.48) 11.00 14.10 (3.10) 9.00 7.44 1.56
2014 9.68 9.97 (0.29) 10.25 11.75 (1.50) 9.17 8.72 0.45
2013 9.79 10.23 (0.43) 10.95 12.75 (1.80) 8.72 8.75 (0.03)
2012 10.01 10.37 (0.36) 10.50 12.00 (1.50) 9.25 9.20 0.05
2011 10.15 10.56 (0.41) 11.35 12.81 (1.46) 9.20 9.40 (0.20)
2010 10.25 10.73 (0.48) 11.15 15.70 (4.55) 9.40 9.40 0.00
2009 10.54 10.87 (0.34) 11.50 15.00 (3.50) 8.75 9.10 (0.35)
2008 10.33 10.57 (0.24) 11.00 11.40 (0.40) 9.10 9.10 0.00
2007 10.33 10.94 (0.61) 11.35 12.75 (1.40) 9.10 9.75 (0.65)
2006 10.41 10.95 (0.54) 11.60 12.87 (1.27) 9.55 10.00 (0.45)
2005 10.52 11.34 (0.82) 11.75 12.76 (1.01) 9.75 9.50 0.25
2004 10.86 11.13 (0.27) 12.00 12.50 (0.50) 10.25 9.96 0.29
Regulators Are Finally Increasing Allowed ROEs Rate cases include setting the allowed ROE for the business, now rising in high 9%’s
Regulators set customer rates by working
backwards; starting with the return on equity
(ROE) to be granted to investors and then
adding other costs, including recovery of capital
expenditures, appropriateness of costs,
operating expenses, taxes, and fuel.
ROEs have held firm in the mid-high 9%’s
despite declining bond yields, and are now rising
for the first time since 2009.
Source: SNL
Up
Utility State
Date
Approved
Approved
ROE Utility State
Date
Approved
Approved
ROE
Empire District Electric Co. KS Jan 2017 NA Louisville Gas and Electric Company KY Jun 2017 9.70
Metropolitan Edison Co. PA Jan 2017 NA Virginia Electric and Pow er
Company
VA Jun 2017 10.40
Pennsylvania Electric Co. PA Jan 2017 NA Virginia Electric and Pow er
Company
VA Jun 2017 9.40
Pennsylvania Pow er Co. PA Jan 2017 NA Appalachian Pow er Company VA Jul 2017 NA
West Penn Pow er Co. PA Jan 2017 NA Potomac Electric Pow er Company DC Jul 2017 9.50
Consolidated Edison Co. of NY NY Jan 2017 9.00 Maui Electric Company, Limited HI Aug 2017 NA
Northern IN Public Svc Co. IN Jan 2017 NA Wisconsin Electric Pow er Company WI Aug 2017 NA
Southw estern Public Service Co TX Jan 2017 NA Wisconsin Public Service
Corporation
WI Aug 2017 NA
DTE Electric Co. MI Jan 2017 10.10 Arizona Public Service Company AZ Aug 2017 10.00
Delmarva Pow er & Light Co. MD Feb 2017 9.60 Virginia Electric and Pow er
Company
VA Sept 2017 9.40
Rockland Electric Company NJ Feb 2017 9.60 Atlantic City Electric Company NJ Sept 2017 9.60
Tucson Electric Pow er Co. AZ Feb 2017 9.75 Sharyland Utilities, L.P. TX Sept 2017 NA
Virginia Electric & Pow er Co. VA Feb 2017 11.40 Oncor Electric Delivery Company
LLC
TX Sept 2017 9.80
Virginia Electric & Pow er Co. VA Feb 2017 9.40 Duke Energy Indiana, LLC IN Oct 2017 NA
Virginia Electric & Pow er Co. VA Feb 2017 10.40 Potomac Electric Pow er Company MD Oct 2017 9.50
Virginia Electric & Pow er Co. VA Feb 2017 10.40 Duke Energy Florida, LLC FL Oct 2017 NA
Virginia Electric & Pow er Co. VA Feb 2017 10.40 Southern California Edison Company CA Oct 2017 10.30
Consumers Energy Co. MI Feb 2017 10.10 San Diego Gas & Electric Co. CA Oct 2017 10.20
Otter Tail Pow er Co. MN Mar 2017 9.41 Pacif ic Gas and Electric Company CA Oct 2017 10.25
Union Electric Co. MO Mar 2017 NA Northern Indiana Public Service
Company
IN Oct 2017 NA
Oklahoma Gas and Electric
Company
OK Mar 2017 9.50 Tampa Electric Company FL Nov 2017 10.25
Duke Energy Indiana, LLC IN Mar 2017 NA Alaska Electric Light and Pow er
Company
AK Nov 2017 11.95
Gulf Pow er Company FL Apr 2017 10.25 NSTAR Electric Company MA Nov 2017 10.00
Liberty Utilities (Granite State
Electric) Corp.
NH Apr 2017 9.40 Western Massachusetts Electric
Company
MA Nov 2017 10.00
Southw estern Public Service
Company
NM Apr 2017 NA Puget Sound Energy, Inc. WA Dec 2017 9.50
Unitil Energy Systems, Inc. NH Apr 2017 9.50 Commonw ealth Edison Company IL Dec 2017 8.40
Kansas City Pow er & Light
Company
MO May 2017 9.50 Ameren Illinois Company IL Dec 2017 8.40
Pacif ic Gas and Electric Company CA May 2017 NA Northern States Pow er Company -
WI
WI Dec 2017 9.80
Northern States Pow er Company -
MN
MN May 2017 9.20 Entergy Arkansas, Inc. AR Dec 2017 NA
Appalachian Pow er Company VA May 2017 NA Southw estern Electric Pow er
Company
TX Dec 2017 9.60
Oklahoma Gas and Electric
Company
AR May 2017 9.50 El Paso Electric Company TX Dec 2017 9.65
Delmarva Pow er & Light Company DE May 2017 9.70 Portland General Electric Company OR Dec 2017 9.50
Idaho Pow er Co. ID May 2017 9.50 Southern Indiana Gas and Electric
Company
IN Dec 2017 NA
Virginia Electric and Pow er
Company
VA Jun 2017 9.40 Public Service Company of New
Mexico
NM Dec 2017 9.58
Kansas City Pow er & Light
Company
KS Jun 2017 NA Green Mountain Pow er Corporation VT Dec 2017 9.10
Westar Energy, Inc. KS Jun 2017 NA Avista Corporation ID Dec 2017 9.50
MDU Resources Group, Inc. ND Jun 2017 9.65 Nevada Pow er Company NV Dec 2017 9.40
Kentucky Utilities Company KY Jun 2017 9.70
Average 9.75 Average 9.75
Min 8.40 Min 8.40
Max 11.95 Max 11.95

22
Allowed ROEs Are Still Robust Relative to Interest Rates
Utility ROEs vs Utility Bond Yields
Source: Credit Suisse estimates, SNL Financial, Thomson Reuters, company data
ROE durability may reflect the outcome of a variety of concerns beyond alignment with interest rates through the CAPM formula. These include a competition for capital between states, the desire to attract jobs in a tough economy, low commodity/fuel prices that help keep bills low, and the need to maintain a robust market for utility equity to support heavy capital investment in long-term hard assets year after year.
While lower, the spread on ROEs to interest rates remains historically wide
Utility ROEs vs S&P 500 ROEs
-3%
-2%
-1%
0%
1%
2%
3%
4%
5%
6%
7%
0%
2%
4%
6%
8%
10%
12%
14%
16%
18%
20%
1980
1982
1984
1986
1988
1990
1992
1994
1996
1998
2000
2002
2004
2006
2008
2010
2012
2014
2016
2018
Spre
ad (R
OE
-C
orp
Yie
ld)
RO
E &
Intere
st R
ate %
Spread Between ROE & Corps Allowed ROE Utility Bond Yield 10 YR
-10%
-8%
-6%
-4%
-2%
0%
2%
4%
6%
8%
10%
12%
0%
5%
10%
15%
20%
25%
1990
1992
1994
1996
1998
2000
2002
2004
2006
2008
2010
2012
2014
2016
2018
Spr
ead
(Allo
wed
RO
E -
S&
P 5
00 R
OE)
RO
E &
Inte
rest
Rat
e %
Spread Allowed Between Allowed ROE & S&P ROE Allowed ROE S&P 500 ROE 10 YR Beta-Adjusted ROE
23
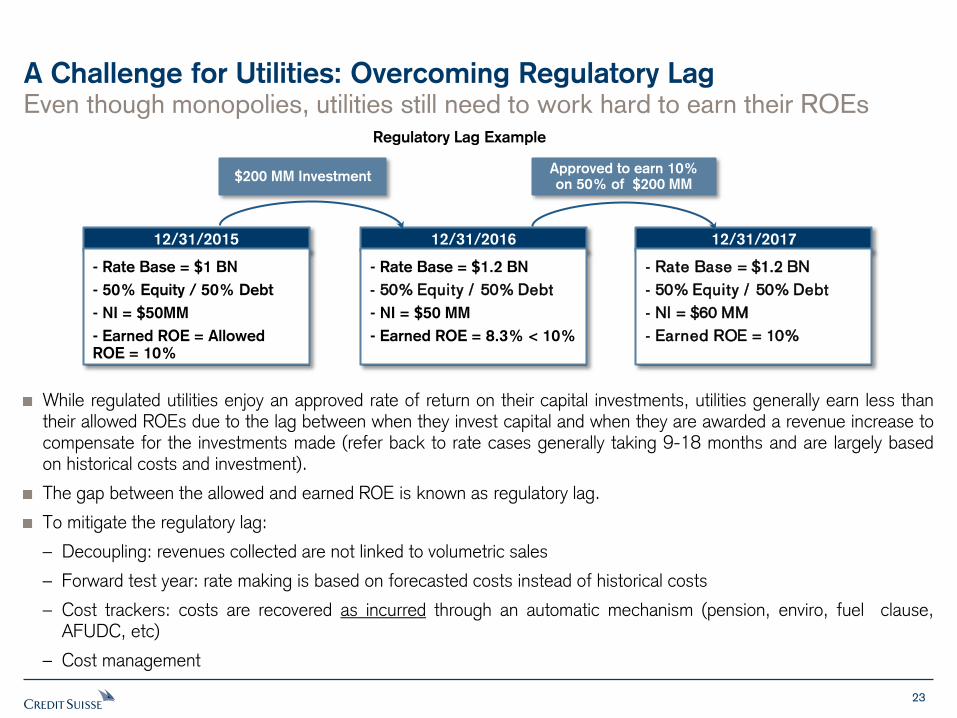
Even though monopolies, utilities still need to work hard to earn their ROEs
A Challenge for Utilities: Overcoming Regulatory Lag
While regulated utilities enjoy an approved rate of return on their capital investments, utilities generally earn less than their allowed ROEs due to the lag between when they invest capital and when they are awarded a revenue increase to compensate for the investments made (refer back to rate cases generally taking 9-18 months and are largely based on historical costs and investment).
The gap between the allowed and earned ROE is known as regulatory lag.
To mitigate the regulatory lag:
– Decoupling: revenues collected are not linked to volumetric sales
– Forward test year: rate making is based on forecasted costs instead of historical costs
– Cost trackers: costs are recovered as incurred through an automatic mechanism (pension, enviro, fuel clause, AFUDC, etc)
– Cost management
Regulatory Lag Example
12/31/2016 12/31/2015 12/31/2017
$200 MM Investment
- Rate Base = $1.2 BN
- 50% Equity / 50% Debt
- NI = $50 MM
- Earned ROE = 8.3% < 10%
- Rate Base = $1 BN
- 50% Equity / 50% Debt
- NI = $50MM
- Earned ROE = Allowed ROE = 10%
- Rate Base = $1.2 BN
- 50% Equity / 50% Debt
- NI = $60 MM
- Earned ROE = 10%
Approved to earn 10% on 50% of $200 MM

24
$90 $90
$43 $41
$48
$60
$74
$83$78
$74$79
$96
$104
$0
$20
$40
$60
$80
$100
$120
$140
2003
2004
2005
2006
2007
2008
2009
2010
2011
2012
2013
2014
2015
2016
2017
2018
2019
Bill
ions
Actuals Mid 2014 Est. Mid 2015 Est. Mid 2016 Est. Mid 2017 Est.
Future capex always looks lower initially, but revised forecasts are always higher Industry Capital Expenditures Growing Significantly Since 2003
Company’s Guidance vs Consensus
Source: Edison Electric Institute.
Utility industry re-investment has increased significantly since 2003 / 2004, representing to us a change to the ‘modern era’ of utilities with greater emphasis on (1) improving reliability on an aging system and (2) meeting a range of environmental compliance obligations at power plants, and going forward the increasing integration of renewables (that have higher capital intensity, higher system integration costs).
A regular worry we hear from investors is doubts about the durability of Utility growth often pointing to the EEI projected capex data where spending is expected to fade (green bars). We see real reason for sustained higher spending (T&D reliability in particular) but should also note that EEI forecasts consistently reset higher with time (each year’s estimate shifts higher as we get closer to the actual year) reflecting the industry’s conservative capex forecasting.
$113 $123
$114
$109

25
0.0
5.0
10.0
15.0
20.0
25.0
19
84
19
85
19
86
19
87
19
88
19
89
19
90
19
91
19
92
19
93
19
94
19
95
19
96
19
97
19
98
19
99
20
00
20
01
20
02
20
03
20
04
20
05
20
06
20
07
20
08
20
09
20
10
20
11
20
12
20
13
20
14
20
15
20
16
20
17
Ca
pe
x (
$ B
N)
Consistent with growing share in total assets
Transmission Capex Has Been on an Upswing
Transmission Capital Expenditures Over Time (in 2013$)
Source: Edison Electric Institute
Transmission capex has taken over the past decade or so, first attracted by the robust FERC regulated returns, near real-time cost recovery, and identified opportunities to build new transmission lines largely to bring new generation to market, especially renewable resources that are located far from load pockets.
We see the next major opportunity for transmission growth in the mid-2020s, once renewable technology becomes cheap enough to thrive without tax credits and begins to spread to new areas further away from load centers.
26
0%
10%
20%
30%
40%
50%
60%
70%
80%
90%
100%
19
88
19
89
19
90
19
91
19
92
19
93
19
94
19
95
19
96
19
97
19
98
19
99
20
00
20
01
20
02
20
03
20
04
20
05
20
06
20
07
20
08
20
09
20
10
20
11
20
12
20
13
20
14
20
15
20
16
Ne
t P
P&
E
Net Generation Plant Net Distribution Plant Net Transmission Plant Others
$0
$50
$100
$150
$200
$250
$300
$350
$400
$450
$500
19
88
19
89
19
90
19
91
19
92
19
93
19
94
19
95
19
96
19
97
19
98
19
99
20
00
20
01
20
02
20
03
20
04
20
05
20
06
20
07
20
08
20
09
20
10
20
11
20
12
20
13
20
14
20
15
20
16
Ne
t P
P&
E (
$ B
N)
Net Generation Plant Net Distribution Plant Net Transmission Plant Others
Growth Rate ('03 - '16) = 6.7%
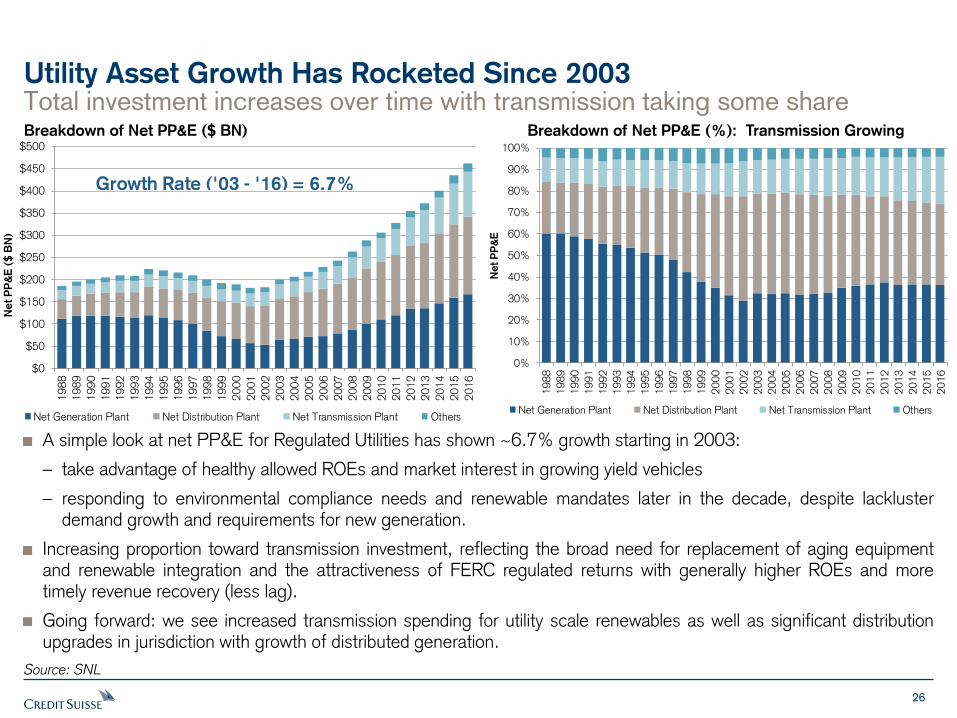
Total investment increases over time with transmission taking some share Utility Asset Growth Has Rocketed Since 2003
Source: SNL
A simple look at net PP&E for Regulated Utilities has shown ~6.7% growth starting in 2003:
– take advantage of healthy allowed ROEs and market interest in growing yield vehicles
– responding to environmental compliance needs and renewable mandates later in the decade, despite lackluster demand growth and requirements for new generation.
Increasing proportion toward transmission investment, reflecting the broad need for replacement of aging equipment and renewable integration and the attractiveness of FERC regulated returns with generally higher ROEs and more timely revenue recovery (less lag).
Going forward: we see increased transmission spending for utility scale renewables as well as significant distribution upgrades in jurisdiction with growth of distributed generation.
Breakdown of Net PP&E ($ BN) Breakdown of Net PP&E (%): Transmission Growing
27
9.3
%
8.5
%
8.1
%
7.9
%
7.8
%
7.8
%
7.5
%
7.4
%
7.1
%
7.0
%
6.5
%
5.7
%
5.2
%
4.9
%
3.4
%
0%
2%
4%
6%
8%
10%N
I
SR
*
EX
C
CN
P
DU
K
NE
E
WE
C
PN
W
BK
H
DTE
ES
CM
S
ED
SO
NW
E
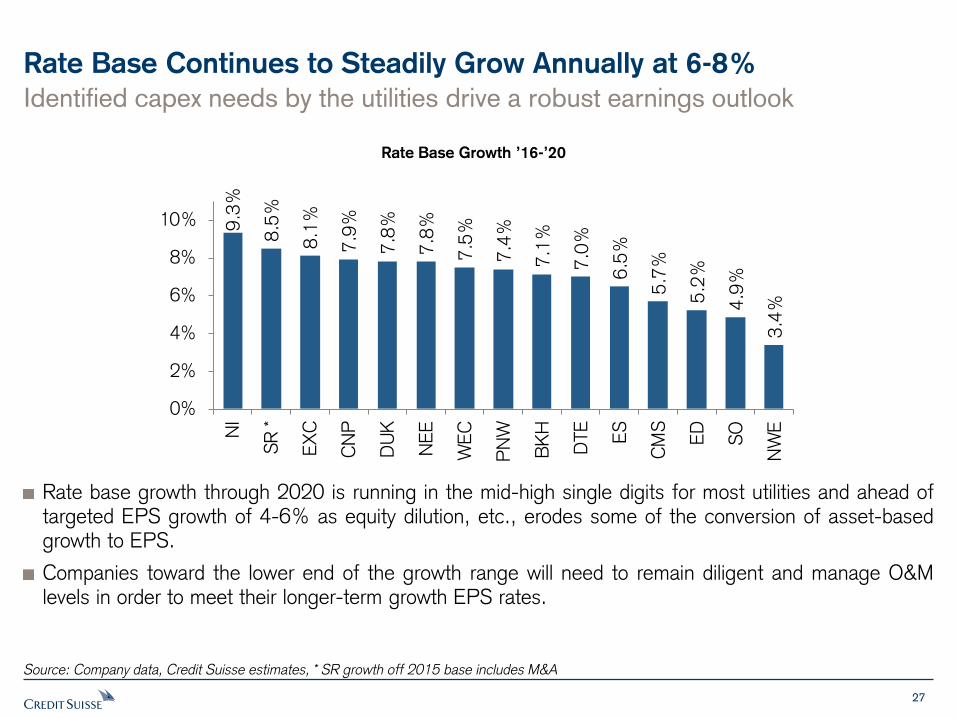
Rate Base Continues to Steadily Grow Annually at 6-8%
Rate Base Growth ’16-’20
Source: Company data, Credit Suisse estimates, * SR growth off 2015 base includes M&A
Rate base growth through 2020 is running in the mid-high single digits for most utilities and ahead of targeted EPS growth of 4-6% as equity dilution, etc., erodes some of the conversion of asset-based growth to EPS.
Companies toward the lower end of the growth range will need to remain diligent and manage O&M levels in order to meet their longer-term growth EPS rates.
Identified capex needs by the utilities drive a robust earnings outlook

28
Rate Base Growth Translates into EPS Growth
Company’s Guidance vs Consensus
Most utilities have EPS growth targets to 2017 of 4-7% annually, underpinned by the rate base growth from the preceding slide. Further, rate base growth expectations are typically (although not always) derived from highly visible capital project plans – with room for upside as time progresses as new investment needs are identified.
Comparing company guidance against Street estimates we see consensus in-line with what the companies expect.
This suggests that the stocks are fairly valued, with estimates in the middle of company guidance, and with any upward or downward momentum in estimates driving the stocks.
Source: Credit Suisse estimates I/B/E/S Estimate for all consensus numbers, Thomson, SNL, Company Filings
0%
2%
4%
6%
8%
10%
CM
S
NE
E
DTE
ES
CN
P
WE
C NI
DU
K
SO
SR
NW
E
BK
H
ED
EP
S G
row
th R
ate
(%
)
Guidance Range Street's '18-'20 Implied Growth Rate Credit Suisse Implied Growth Rate ('18-'20)

29
100.0
150.0
200.0
250.0
300.0
350.0
Oct-7
3
Feb-7
6
Jun-7
8
Oct-8
0
Feb-8
3
Jun-8
5
Oct-8
7
Feb-9
0
Jun-9
2
Oct-9
4
Feb-9
7
Jun-9
9
Oct-0
1
Feb-0
4
Jun-0
6
Oct-0
8
Feb-1
1
Jun-1
3
Oct-1
5
Tra
ilin
g 1
2-m
onth
A
vg D
em
and
(TW
h)
280.0
285.0
290.0
295.0
300.0
305.0
310.0
315.0
320.0
Jan-0
3Ju
l-03
Jan-0
4Ju
l-04
Jan-0
5Ju
l-05
Jan-0
6Ju
l-06
Jan-0
7Ju
l-07
Jan-0
8Ju
l-08
Jan-0
9Ju
l-09
Jan-1
0Ju
l-10
Jan-1
1Ju
l-11
Jan-1
2Ju
l-12
Jan-1
3Ju
l-13
Jan-1
4Ju
l-14
Jan-1
5Ju
l-15
Jan-1
6Ju
l-16
Jan-1
7Ju
l-17
Ele
ctr
icity E
nd U
se (
Million T
Wh)
Rolling 12-Mo. Average Current All-time Peak
Structural Challenges: Demand Has Languished
Total US power demand is still below the highs set in 2008
Total Retail Sales 1973-Current (TWh) Total Retail Sales 2003- Current(TWh)
Source: EIA.gov, Credit Suisse estimates
US Power demand is now net down 3.05% versus the 2008 peak before the Great Recession using trailing 12-month demand numbers.
Even more striking has been the retrenchment in consumption even from 2011 levels, highlighting the continued drag of energy efficiency and a level of weather normalization after a couple hot summers.
30
0.9%
0.2%
1.2%
1.9%2.1%
2.9%
1.2%
-2.0%-2.0%
0.1%-0.5%
-2.0%-1.7%
-1.5%
0.5%
1.9%2.1%
-1.7%-2.0%
-3%
-2%
-1%
0%
1%
2%
3%
4%
2Q
13
3Q
13
4Q
13
1Q
14
2Q
14
3Q
14
4Q
14
1Q
15
2Q
15
3Q
15
4Q
15
1Q
16
2Q
16
3Q
16
4Q
16
1Q
17
2Q
17
3Q
17
4Q
17
12 M
onth
Rolli
ng C
hange in
Reta
il
Sale
s
0.3%
0.5%
1.0%
1.6%
1.8%1.7%
1.1%
0.1%
0.0%
0.7%
0.5%
0.1%
-0.3%-0.3%
0.1%
0.4%
0.8%
-0.5%
-0.8%-1%
-1%
0%
1%
1%
2%
2%
2Q
13
3Q
13
4Q
13
1Q
14
2Q
14
3Q
14
4Q
14
1Q
15
2Q
15
3Q
15
4Q
15
1Q
16
2Q
16
3Q
16
4Q
16
1Q
17
2Q
17
3Q
17
4Q
17
12 M
onth
Rollin
g C
hange in
Reta
il S
ale
s
-2.5%-2.7%-2.6%
-1.4%
0.4%
2.7%
4.5%
3.2%
1.1%
-1.4%
-3.9%-3.6%-3.5%
-3.1%
-2.3%-2.0%
-0.7%
0.1%
1.1%
-5%
-4%
-3%
-2%
-1%
0%
1%
2%
3%
4%
5%
2Q
13
3Q
13
4Q
13
1Q
14
2Q
14
3Q
14
4Q
14
1Q
15
2Q
15
3Q
15
4Q
15
1Q
16
2Q
16
3Q
16
4Q
16
1Q
17
2Q
17
3Q
17
4Q
171
2 M
onth
Ro
lling
Chang
e in
R
eta
il S
ale
s
-0.2%-0.5%
0.1%
0.9%
1.6%
2.4%
2.0%
0.1%
-0.5%
-0.1%
-1.1%
-1.7%-1.7%-1.5%
-0.4%
0.3%
0.9%
-0.8%-0.8%
-2%
-2%
-1%
-1%
0%
1%
1%
2%
2%
3%
3%
2Q
13
3Q
13
4Q
13
1Q
14
2Q
14
3Q
14
4Q
14
1Q
15
2Q
15
3Q
15
4Q
15
1Q
16
2Q
16
3Q
16
4Q
16
1Q
17
2Q
17
3Q
17
4Q
17
12 M
onth
Rollin
g C
hange in
Reta
il S
ale
s
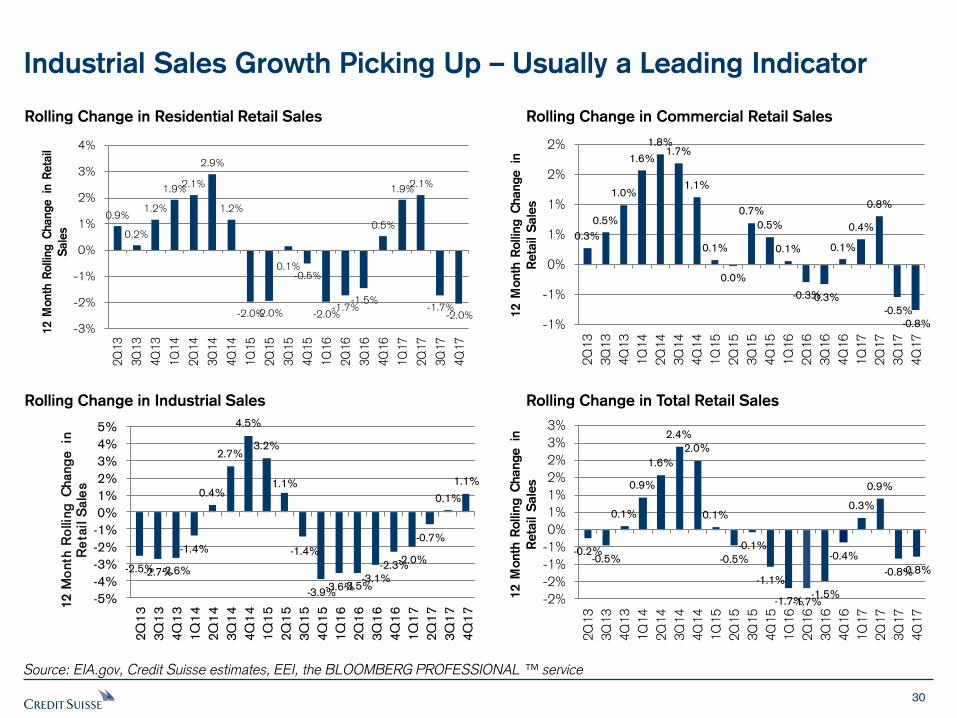
Industrial Sales Growth Picking Up – Usually a Leading Indicator
Rolling Change in Residential Retail Sales Rolling Change in Commercial Retail Sales
Rolling Change in Industrial Sales Rolling Change in Total Retail Sales
Source: EIA.gov, Credit Suisse estimates, EEI, the BLOOMBERG PROFESSIONAL ™ service
31
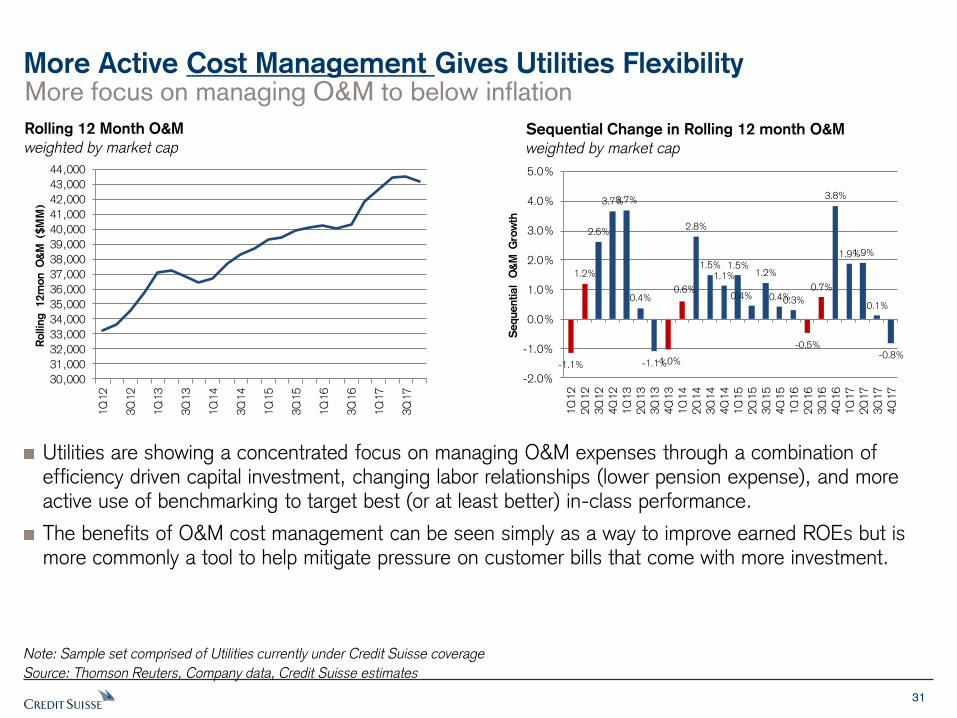
More Active Cost Management Gives Utilities Flexibility More focus on managing O&M to below inflation
Rolling 12 Month O&M
weighted by market cap Sequential Change in Rolling 12 month O&M
weighted by market cap
Note: Sample set comprised of Utilities currently under Credit Suisse coverage
Source: Thomson Reuters, Company data, Credit Suisse estimates
Utilities are showing a concentrated focus on managing O&M expenses through a combination of efficiency driven capital investment, changing labor relationships (lower pension expense), and more active use of benchmarking to target best (or at least better) in-class performance.
The benefits of O&M cost management can be seen simply as a way to improve earned ROEs but is more commonly a tool to help mitigate pressure on customer bills that come with more investment.
30,000
31,000
32,000
33,000
34,000
35,000
36,000
37,000
38,000
39,000
40,000
41,000
42,000
43,000
44,000
1Q
12
3Q
12
1Q
13
3Q
13
1Q
14
3Q
14
1Q
15
3Q
15
1Q
16
3Q
16
1Q
17
3Q
17
Rollin
g 12m
on O
&M
($M
M)
-1.1%
1.2%
2.6%
3.7%3.7%
0.4%
-1.1%-1.0%
0.6%
2.8%
1.5%1.1%
1.5%
0.4%
1.2%
0.4%0.3%
-0.5%
0.7%
3.8%
1.9%1.9%
0.1%
-0.8%
-2.0%
-1.0%
0.0%
1.0%
2.0%
3.0%
4.0%
5.0%
1Q
12
2Q
12
3Q
12
4Q
12
1Q
13
2Q
13
3Q
13
4Q
13
1Q
14
2Q
14
3Q
14
4Q
14
1Q
15
2Q
15
3Q
15
4Q
15
1Q
16
2Q
16
3Q
16
4Q
16
1Q
17
2Q
17
3Q
17
4Q
17
Sequential
O&
M G
row
th

32
The Absolute Cost of Power Has Been Stable
The drop in natural gas prices has led to deflationary trends in power costs
Fuel Expense and Purchased Power Costs per MWh of Electricity Delivered
Source: SNL Financial, company reports
Declines in commodity prices (notably natural gas) have stabilized the energy cost component of electricity bills in recent years.
We think the industry will need to be diligent going forward in managing the cost of power as natural gas prices trend higher (and with greater volatility) and as the pending retirement of coal plants due to EPA rules push more output to higher cost units.
20.1 21.8
21.6
26.6
34.0
25.1 27.4
28.2
34.1
38.0
38.3
43.8
37.2
37.0
37.2
34.2 36.0 3
9.1
33.9
32.7
0
5
10
15
20
25
30
35
40
45
50
19
97
19
98
19
99
20
00
20
01
20
02
20
03
20
04
20
05
20
06
20
07
20
08
20
09
20
10
20
11
20
12
20
13
20
14
20
15
20
16
$/M
Wh

33
1.7%
1.5%
2.0%
2.5%
3.0%
3.5%1985
1987
1989
1991
1993
1995
1997
1999
2001
2003
2005
2007
2009
2011
2013
2015%
of
Dis
posable
P
ers
onal
Incom
e
Electricity & Gas Electricity & Gas LT Avg
Electricity & Gas LT Avg 2.3%
Utility Bills are Still Historically Cheap
Spending as % of disposable income near historic lows Utility Spending (% of Disposable Income)
Source: Bureau of Labor Statistics, Credit Suisse estimates
Spending on Utilities as a percentage of personal disposable income (PDI) has been falling for more than a generation, approaching all time lows of 1.5% but have bounced with the cold winter in 2015.
Resetting to the LT average of 2.3% would suggest headroom of over $99bn; with the ‘80’s peak reaching +$269bn.

34
1.8%0.0%
2.5%
5.0%
7.5%
10.0%
12.5%
15.0%
17.5%
20.0%
22.5%
25.0%
19
70
19
72
19
74
19
76
19
78
19
80
19
82
19
84
19
86
19
88
19
90
19
92
19
94
19
96
19
98
20
00
20
02
20
04
20
06
20
08
20
10
20
12
20
14
20
16
% o
f P
ers
onal
Consum
pti
on
Electricity and Gas Total Energy Goods & Services Housing
Clothing and Shoes Medical Care Recreation
Food
Utility bills are a small piece of overall wallet share
Utilities Are Integral to Life, Yet a Small Monthly Expenditure
Personal Consumption Breakdown of Spending as a % of Disposable Income
Source: Bureau of Labor Statistics, Credit Suisse estimates
While integral to daily life, spending on electricity remains a very small piece of the overall consumer wallet share (red line) and has stayed below 2% since the financial crisis (at 1.8% in 2016).

Competitive Power
36
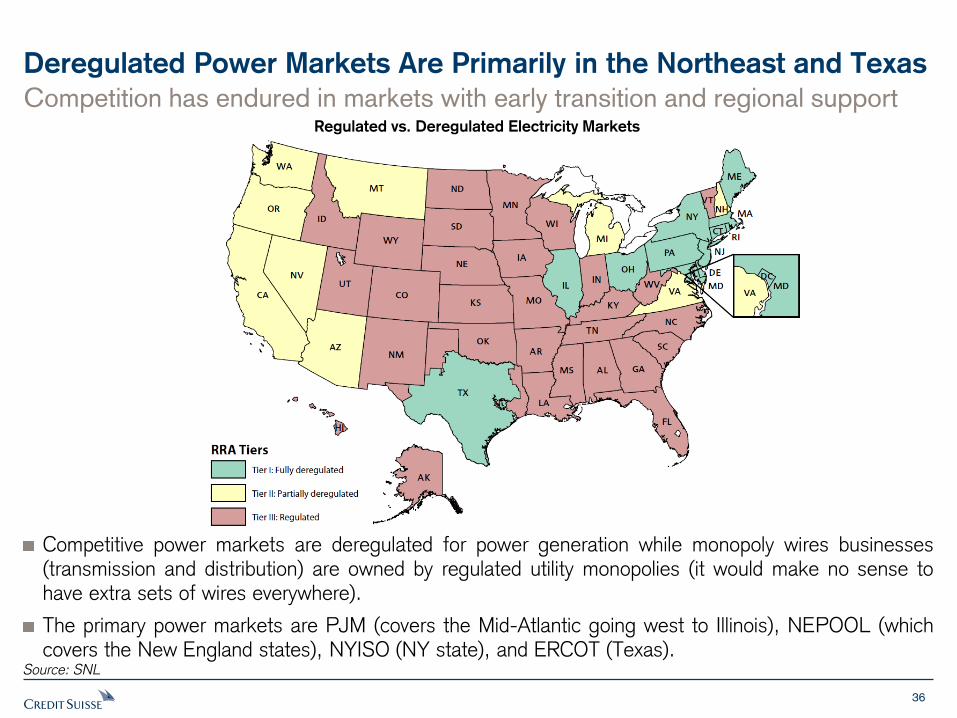
Deregulated Power Markets Are Primarily in the Northeast and Texas
Source: SNL
Regulated vs. Deregulated Electricity Markets
Competitive power markets are deregulated for power generation while monopoly wires businesses (transmission and distribution) are owned by regulated utility monopolies (it would make no sense to have extra sets of wires everywhere).
The primary power markets are PJM (covers the Mid-Atlantic going west to Illinois), NEPOOL (which covers the New England states), NYISO (NY state), and ERCOT (Texas).
Competition has endured in markets with early transition and regional support

37
Definition of Common Terms
Source: Credit Suisse estimates
Term Explanation
Heat Rate
(Power Plant)
- The amount of thermal energy (gas, coal) used by a power plant to produce 1
MWh and is a proxy for a power plant’s efficiency in converting fuel into electricity.
Heat Rate
(Power Price)
- Calculated by dividing the power price by the natural gas price. This application
of heat rate is primarily as a quick way to compare the market price of power
against the cost to produce power from a gas plant; when the market heat rate is
higher, a gas plant is economic and vice versa.
Spark Spread
(SS)
- Measures a natural gas plant’s gross margin
- Is the difference between power price received and the cost of gas used
- SS ($/MWh) = Power Price ($/MWh) – Gas Price ($/MMBtu)* Plant Heat
Rate (MMBtu/MWh)
Dark Spread (DS) - Measures a coal plant’s profitability
- Is the difference between power price received by the coal generator and the
cost of coal burned
- DS ($/MWh) = Power Price ($/MWh) – Coal Price ($/ton)*Heat Rate
(MMBtu/MWh)/ Heat Content (MMBtu/ ton)
Quark Spread
(QS)
- Measures a nuclear plant’s profitability
- Is the difference between power price received by the nuclear generator for the
power generated and the cost fuel used
- QS ($/MWh) = Power Price ($/MWh) – Nuclear Fuel Cost ($/MWh)

38
Definition of Common Terms
Source: Credit Suisse estimates
Term Explanation
Distinction
between MW and
MWh
- MW: is a unit of productivity that measures the maximum amount of electricity that a power plant can potentially produce.
- MWh: is unit of output that measures the actual amount of energy produced by a generating resource in one hour and is the unit upon which power is priced.
Reserve Margin - Electricity is an on demand resource so there always need to be more available
capacity than there is demand with a targeted ‘cushion’ to account for reliability or
delivery challenges; generally speaking markets target a reserve margin around
15% or higher (meaning 15% more capacity than the peak moment of demand)
- The reserve margin is calculated by dividing total capacity by the peak moment
of demand in a given year and subtracting by 1.
RPM (Reliability
Pricing Model)
- Is PJM’ s capacity market which aims to procure capacity three years in advance
in competitive auctions to meet forecasted power demand
- For example: in the summer of 2015, PJM will hold an auction to procure
capacity needed to meet the projected power demand in 2018.
FCM (Forward
Capacity Market)
- Is ISO-NE’s forward capacity market through which ISO-NE will hold auctions to
procure capacity needed three years out (very similar to PJM’s RPM) to meet
forecasted power demand.
39
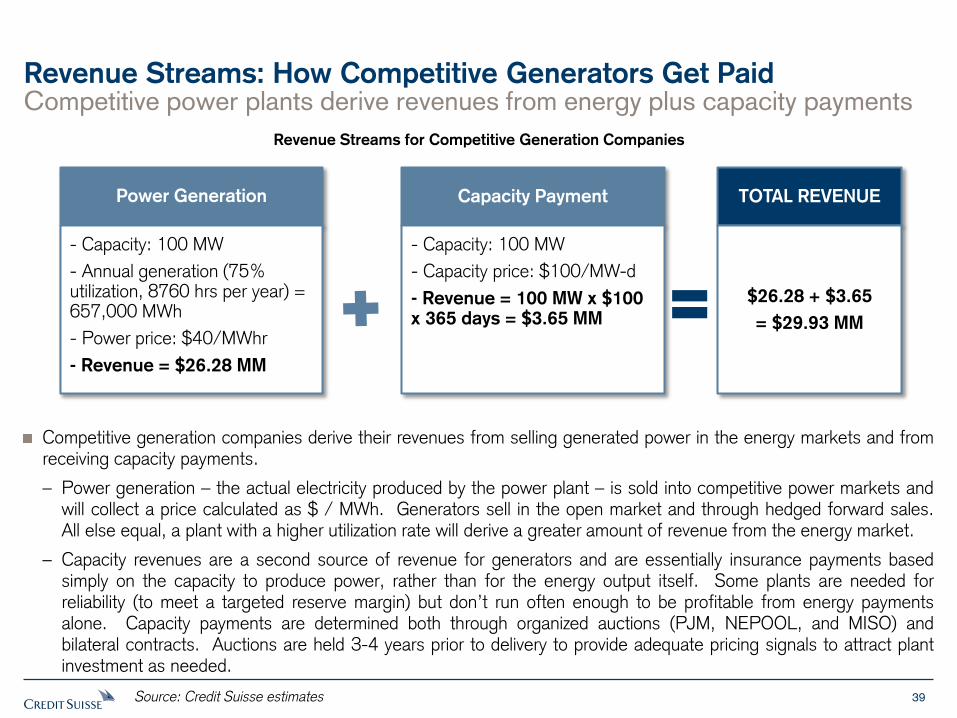
Competitive power plants derive revenues from energy plus capacity payments
Revenue Streams: How Competitive Generators Get Paid
Revenue Streams for Competitive Generation Companies
Source: Credit Suisse estimates
Competitive generation companies derive their revenues from selling generated power in the energy markets and from receiving capacity payments.
– Power generation – the actual electricity produced by the power plant – is sold into competitive power markets and will collect a price calculated as $ / MWh. Generators sell in the open market and through hedged forward sales. All else equal, a plant with a higher utilization rate will derive a greater amount of revenue from the energy market.
– Capacity revenues are a second source of revenue for generators and are essentially insurance payments based simply on the capacity to produce power, rather than for the energy output itself. Some plants are needed for reliability (to meet a targeted reserve margin) but don’t run often enough to be profitable from energy payments alone. Capacity payments are determined both through organized auctions (PJM, NEPOOL, and MISO) and bilateral contracts. Auctions are held 3-4 years prior to delivery to provide adequate pricing signals to attract plant investment as needed.
Capacity Payment Power Generation TOTAL REVENUE
- Capacity: 100 MW
- Annual generation (75% utilization, 8760 hrs per year) = 657,000 MWh
- Power price: $40/MWhr
- Revenue = $26.28 MM
$26.28 + $3.65
= $29.93 MM
- Capacity: 100 MW
- Capacity price: $100/MW-d
- Revenue = 100 MW x $100 x 365 days = $3.65 MM
40
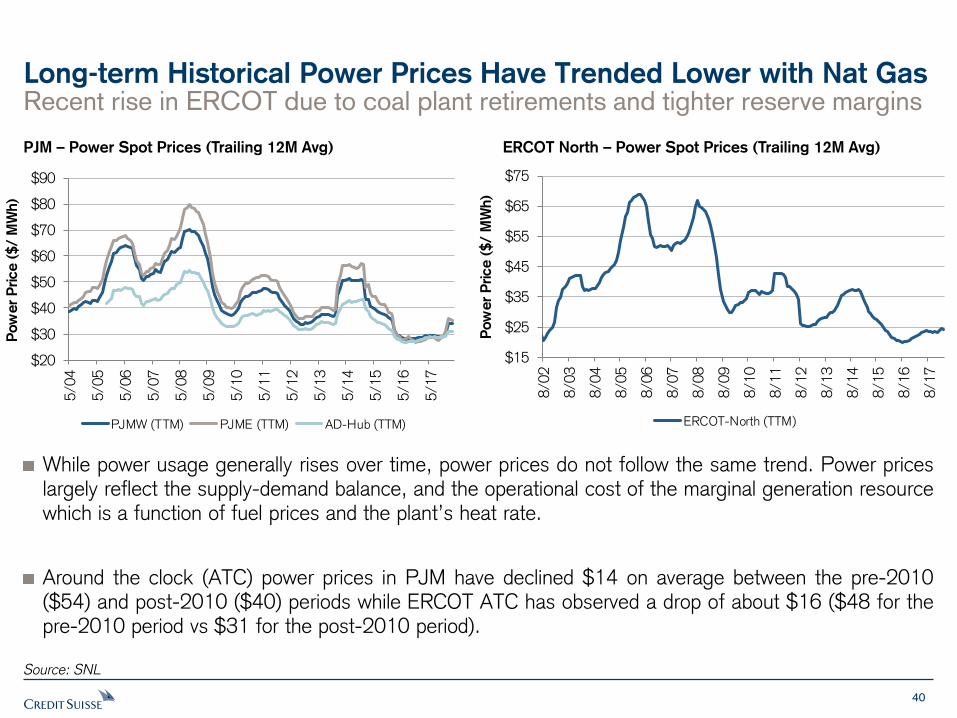
Recent rise in ERCOT due to coal plant retirements and tighter reserve margins
Long-term Historical Power Prices Have Trended Lower with Nat Gas
Source: SNL
While power usage generally rises over time, power prices do not follow the same trend. Power prices largely reflect the supply-demand balance, and the operational cost of the marginal generation resource which is a function of fuel prices and the plant’s heat rate.
Around the clock (ATC) power prices in PJM have declined $14 on average between the pre-2010 ($54) and post-2010 ($40) periods while ERCOT ATC has observed a drop of about $16 ($48 for the pre-2010 period vs $31 for the post-2010 period).
PJM – Power Spot Prices (Trailing 12M Avg) ERCOT North – Power Spot Prices (Trailing 12M Avg)
$15
$25
$35
$45
$55
$65
$75
8/0
2
8/0
3
8/0
4
8/0
5
8/0
6
8/0
7
8/0
8
8/0
9
8/1
0
8/1
1
8/1
2
8/1
3
8/1
4
8/1
5
8/1
6
8/1
7
Pow
er
Price (
$/ M
Wh)
ERCOT-North (TTM)
$20
$30
$40
$50
$60
$70
$80
$90
5/0
4
5/0
5
5/0
6
5/0
7
5/0
8
5/0
9
5/1
0
5/1
1
5/1
2
5/1
3
5/1
4
5/1
5
5/1
6
5/1
7
Pow
er
Price (
$/ M
Wh)
PJMW (TTM) PJME (TTM) AD-Hub (TTM)

41
Gas is typically the marginal fuel setting power prices in most markets, although low gas prices are now on par with eastern coal pricing, resulting in lower coal plant capacity factors (running hours) and early coal retirements.
Forward gas and power have typically been backwardated despite developers’ optimism on future pricing. A lack of trading liquidity for future vintages is usually cited, although the collapse of prompt pricing in the wake of the recession temporarily resulted in a contango through January 2014. The Polar Vortex appears to have returned the cycle to backwardation, although mild winters in 2015/16 temporarily pushed the gas curve into contango.
Underlying supply-demand fundamentals: (1) Continued coal plant retirements; (2) Continued growth in US shale gas production; (3) Increased renewables with no fuel costs that eliminate hourly marginal profitability for fossil and nuclear generation; (4) Weather; (5) Weak demand growth as a result of energy efficiency and the pace of economic recovery.
Lower prices with cheaper gas, increased renewables, coal plant closures
Power Prices Push Lower and Return to Backwardation
Source: the BLOOMBERG PROFESSIONAL ™ service
PJM-W – Forward vs Prompt Power Prices Henry Hub – Forward vs Prompt Gas Prices

42
Coal retirements have reduced ERCOT reserve margins and caused forward power prices to rise. However, the forward curve remains in steepening backwardation as prices two years out remain well below next year’s pricing.
Summer heat rates have blown out the most, but these are backwardated too.
While backwardation would suggest that reserve margins will eventually widen, the lack of trading liquidity in out-years also depresses forward prices.
The lack of a capacity market in Texas increases the volatility of both prompt and forward energy pricing.
But backwardation persists, suggesting tighter reserve margins won’t last
Recent ERCOT Price Improvements Are More Near-Term
Source: the BLOOMBERG PROFESSIONAL ™ service
ERCOT – Forward vs Prompt Power Prices ERCOT – Forward Marginal Heat Rates for Summers 2018-2021

43
The decline in backwardation suggests that forward prices on the curve are converging, perhaps a sign of s/d stability.
The rise and convergence of forward spark spreads also suggests s/d stability, which could lead to further gas plant development.
These trends are supported by a flattening supply curve as suggested by the last few years of capacity auction results.
Backwardation has declined, suggesting stability
Recent PJM Price Improvements Are Driving Spark Spreads Up
Source: the BLOOMBERG PROFESSIONAL ™ service
PJMW– Forward vs Prompt Power Prices PJMW– 1-3 year Forward Spark Spreads

44
Seasonal weather affects gas storage levels which may impact the price of gas for months or even years to come. As the marginal fuel for power production, it has similar effect on the forward power price curve.
How Weather Affects the Forward Power Pricing Curve
Source: the BLOOMBERG PROFESSIONAL ™ service
DOE Weekly Change in Gas in Storage (Bcf)
45
0.0
10.0
20.0
30.0
40.0
50.0
60.0
70.0
80.0
0 25,000 50,000 75,000 100,000 125,000 150,000
Mar
gin
al P
ow
er P
rice
($/
MW
h)
Capaity (MWs)
Nuclear Gas Coal Oil
Renewables & Others New Gas Net Import New Wind
New Solar ATC On Peak Off Peak
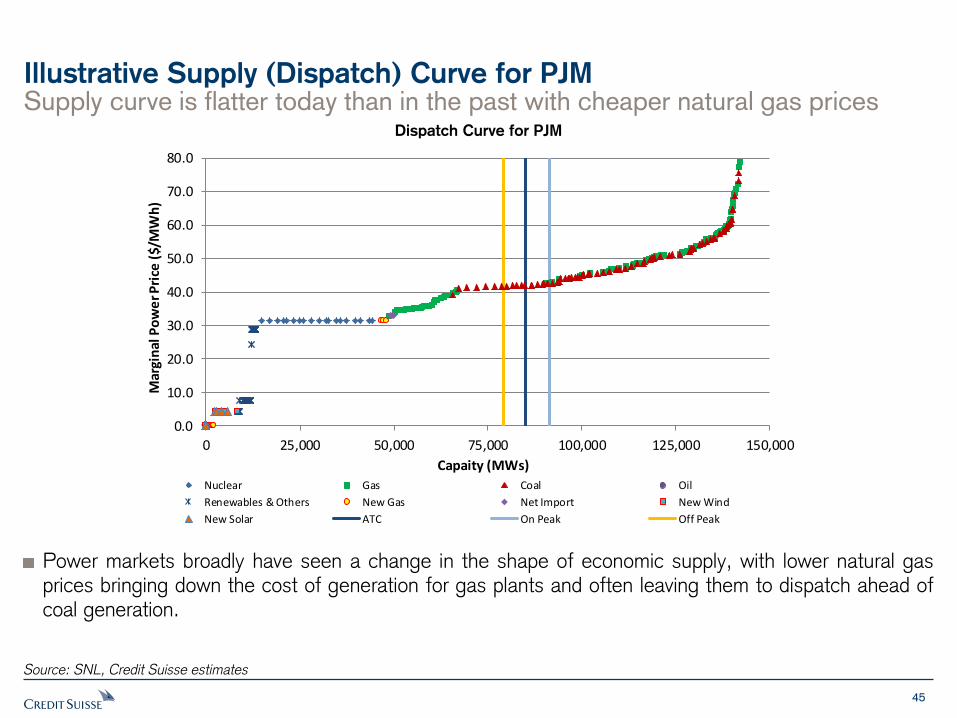
Dispatch Curve for PJM
Supply curve is flatter today than in the past with cheaper natural gas prices Illustrative Supply (Dispatch) Curve for PJM
Power markets broadly have seen a change in the shape of economic supply, with lower natural gas prices bringing down the cost of generation for gas plants and often leaving them to dispatch ahead of coal generation.
Source: SNL, Credit Suisse estimates

46
Do Power Prices Have a Floor?
New Build Marginal Cash Cost with Static Power Price and Utilization
Rates
Source: Credit Suisse Estimates, SNL, Company data
Weak prompt gas pricing and new efficient CCGTs keep marginal pricing low.
Access to low cost of capital and low-cost fuel drives new-build economics, especially over shale plays.
Intermittent wind and solar dispatch with essentially no marginal cost, absorbing revenue from nuclear and fossil plants needed to operate the grid reliably. Capacity payments and state subsidies can help.
Eventually, batteries could solve the problems of renewable intermittency and even help provide other ancillary services, but this is likely at least 5-10 years away from economic viability.
New gas-fired power plants drive the pricing boat, but renewables take a bite
Capex costs reflect the ongoing maintenance capex required to sustain the plants but not captured in earnings
Environmental costs include the consumables to run equipment, representing
a real burden for coal plants with PRB most impacted from TRONA costs
O&M costs represent the historically observed costs of operating power plants specific to fuel / plant type
All-in-Fuel costs represent the plant specific costs; For CCGTs we use current
forwards at local natural gas basis with
AD-Hub using Dominion South gas, PJM-W using a blend of Dominion South and TETCO-M3, and PJM-E using TETCO-M3
All-In Fuel
O&M
Environ Costs
Capex
0
5
10
15
20
25
30
35
40
45
CCGT(ADHub)
CCGT(PJMW)
CCGT(PJME)
CCGT(NIHub)
CCGT(ERCOT)
Nuclear PRB8400
(ERCOT)
NAPP(Barge)
PRB8800
NAPP(Rail)
Cash C
ost
($/M
Wh)
All-In Fuel O&M Environ Costs Capex PJME
PJMW ADHub NiHub ERCOT

47
Dependence on plants outside of PJM, newbuilds, and demand response (DR) PJM Reserve Margins Have Been Bolstered by Non-Plant Resources
The Evolution of the PJM Reserve Margin
Source: Credit Suisse estimates, PJM
While the headline reserve margins remain robust at ~20%, the dependence on non-
physical installed generation should lead to increased power market volatility and capacity
price upside if DR is excluded in the future under stricter Capacity Performance standards.
Imports
17.5% 17.8%
16.5%
18.1%
20.9%20.2%
19.6%20.2%
21.1%
19.7% 19.8%
22.4%23.3%
0.0%
2.5%
5.0%
7.5%
10.0%
12.5%
15.0%
17.5%
20.0%
22.5%
25.0%
27.5%
08/09 09/10 10/11 11/12 12/13 13/14 14/15 15/16 16/17 17/18 18/19 19/20 20/21
Re
se
rve
Marg
in
Total Reserve Margin
Tradi t ional Generat ion
Energy Efficiency
Summer Limi ted DR
Ex tended Summer DR
Unlimi ted DR
PJM Generat ion ~5-7% of Reserve Margin
Total DR
New Generat ion

48
$50
$100
$150
$200
$250
$300
$350
$400
07
/08
08
/09
09
/10
10
/11
11
/12
12
/13
13
/14
14
/15
15
/16
16
/17
17
/18
18
/19
19
/20
20
/21
21
/22
Capacity P
rice (
$.M
W-d
)
SEMA-RI NEPOOL
A fixed source of revenues for power plants but capacity prices are spastic
Historical Capacity Prices Have Been Consistently Inconsistent
Source: Credit Suisse estimates
Capacity auctions by design are intended to provide forward pricing signals about supply-demand fundamentals, with prices rising as markets tighten in a way to attract either new builds or upgrades at existing plants to support reliability. Unfortunately auction prices have been much more volatile, lowering market confidence in the repeatability of these revenue streams.
In PJM, the capacity performance (CP) product has a positive and upward impact on capacity price by putting greater emphasis (and penalties) on plants to support reliability at a higher level of accountability than in the past. However, this is offset by lower forecasted demand growth and new-build driven by low cost of capital and low-priced natural gas. Demand response participation under 100% CP beginning in 2020/21 is a factor too.
PJM – RPM’s Historical Results ISO-NE – FCM’s Historical Results
$0
$50
$100
$150
$200
$250
$300
07
/08
08
/09
09
/10
10
/11
11
/12
12
/13
13
/14
14
/15
15
/16
16
/17
17
/18
18
/19
19
/20
20
/21
RTO MAAC PS
$M
W-D
ay

49
1.5%
2.0%
2.5%
3.0%
3.5%
4.0%
4.5%
5.0%
10.0x 12.0x 14.0x 16.0x 18.0x 20.0x
Div
idend Y
ield
(%
)
2019 P/E Ratio
Regulated Integrated S&P 500
9.9x
3.0x
4.0x
5.0x
6.0x
7.0x
8.0x
9.0x
10.0x
11.0x
12.0x
SR
WE
CE
SL
NT
DU
KA
LE
CM
SN
WE
SO
DT
EG
XP
XE
LO
GE
BK
HE
DP
PL
PN
WA
EE
SC
GP
OR
EIX
PC
G
NE
EE
EP
NM
AE
ES
RE
PE
GF
EE
TR
EV
/ E
BIT
DA
2019 EV/EBITDA Average
15.1x
8.0x
10.0x
12.0x
14.0x
16.0x
18.0x
20.0x
22.0x
24.0x
AV
AA
LE
LN
TS
RW
EC
CM
SE
DA
EE
XE
LE
SP
NW
DT
EP
OR
AE
PG
XP
BK
HD
UK
OG
EN
WE
SO
EIX
SC
GP
PL
PC
G
NE
EE
EP
NM
AE
ES
RE
PE
GF
EE
TR
P/E
2019 P/E S&P 500
Integrateds Trade at Lower Mults with Generally Higher Yields
Source: Thomson Reuters, Credit Suisse estimates
Due to outperformance in 2017, Integrated utilities with competitive power operations currently trade at comparable multiples with ~25bps lower dividend yield.
Hedging programs provide 1-3 years of stability but a non-regulated retail sales operation can provide higher margins over longer periods for specifically matched power fleets.
Most integrateds are reducing their exposure to power markets through asset sales and the redirection of investment toward regulated operations.
Power assets generate relatively high cash flow but low earnings vs regulateds 2019 P/E 2019 EV/ EBITDA
P/E vs Dividend Yield

Policy & Disruption: Carbon, Renewables, Energy Efficiency, Distributed Energy Resources & Storage
51
29 states have rules or targets in place to draw more renewable build
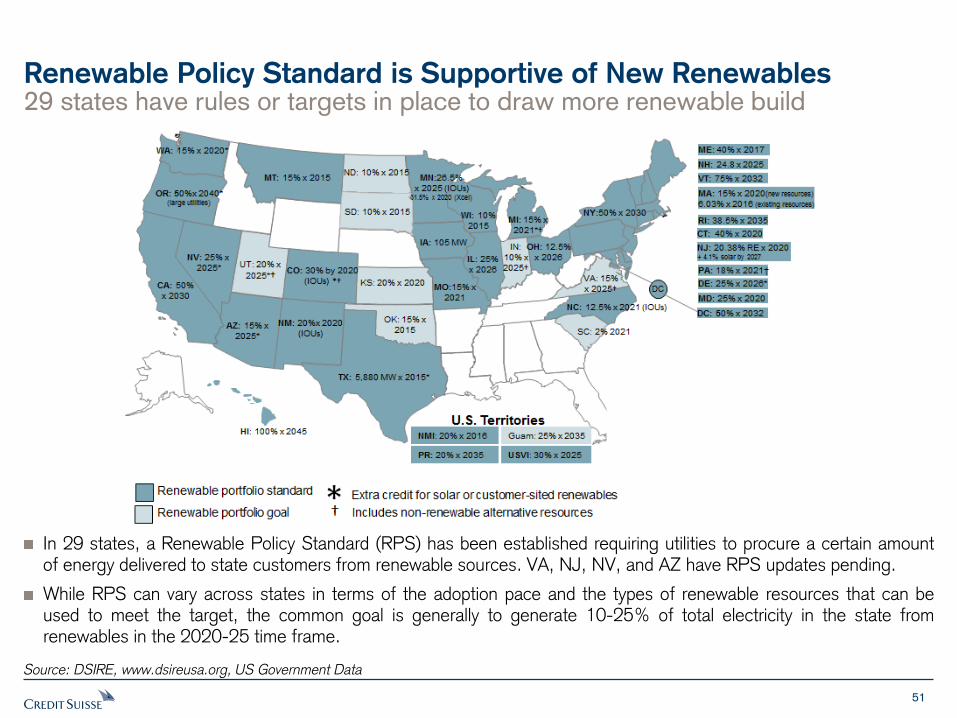
Renewable Policy Standard is Supportive of New Renewables
Source: DSIRE, www.dsireusa.org, US Government Data
In 29 states, a Renewable Policy Standard (RPS) has been established requiring utilities to procure a certain amount of energy delivered to state customers from renewable sources. VA, NJ, NV, and AZ have RPS updates pending.
While RPS can vary across states in terms of the adoption pace and the types of renewable resources that can be used to meet the target, the common goal is generally to generate 10-25% of total electricity in the state from renewables in the 2020-25 time frame.

52
Incremental Renewable Capacity in US to Meet Current RPS by 2030
Solar Wind
Investment
Required
0% / 100% 0.0 GWs 84.9 GWs $155 billion
10% / 90% 17.4 GWs 76.4 GWs $163 billion
20% / 80% 34.7 GWs 67.9 GWs $171 billion
30% / 70% 52.1 GWs 59.4 GWs $179 billion
Mix of 40% / 60% 69.4 GWs 50.9 GWs $186 billion
incremental renewable 50% / 50% 86.8 GWs 42.4 GWs $194 billion
capacity additions 60% / 40% 104.2 GWs 34.0 GWs $202 billion
Solar/Wind 70% / 30% 121.5 GWs 25.5 GWs $209 billion
80% / 20% 138.9 GWs 17.0 GWs $217 billion
90% / 10% 156.3 GWs 8.5 GWs $225 billion
100% / 0% 173.6 GWs 0.0 GWs $233 billion
Note: Assumes solar capacity factor of 22.0% and costs of $1.34/w,
wind capacity factor of 45.0% and costs of $1.83/w
We estimate compliance for the states with rules costing ~$200 BN
Meeting the Existing RPS Targets Will Require Significant Investment
Source: Credit Suisse estimates
Renewable energy targets will require considerable investments. We estimate ~$200 billion of investment directly in wind and solar capacity with some variability depending on mix between the two resources. Further, we see continued need for transmission investment to connect many of these projects since population centers are often further away from where it is always windy or flat and sunny.
In the table above, we show a summary sensitivity table detailing the relationship between wind/solar installation breakdown and investment needs.

53
$ 6.30
$ 2.88
$ 3.90
$ 0.98
$0.0
$1.0
$2.0
$3.0
$4.0
$5.0
$6.0
$7.0
1Q11
2Q11
3Q11
4Q11
1Q12
2Q12
3Q12
4Q12
1Q13
2Q13
3Q13
4Q13
1Q14
2Q14
3Q14
4Q14
1Q15
2Q15
3Q15
4Q15
1Q16
2Q16
3Q16
4Q16
1Q17
2Q17
3Q17
US
so
lar
Inst
alle
d C
ost
($/W
)
Residential Utility
Solar Costs are declining quickly US Solar PPAs now offered at ~$40-$60/MWh Util ity-scale Solar Costs Have Fallen 75% since 1Q11
Source: GTM, Lawrence Berkley Laboratory
Subsidy Regime Extended in December 2015: Visibility Through 2023
US Solar & Wind Subsidies & Cost Declines
$0
$50
$100
$150
$200
$250
$300
Oct-06 Feb-08 Jul-09 Nov-10 Apr-12 Aug-13 Dec-14 May-16 Sep-17
Lev
eliz
ed P
PA
-$/
MW
h
Operating Planned
2016 2017 2018 2019 2020 2021 2022 2023
Solar Investment Tax Credit (ITC), %
% of investment 30% 30% 30% 30% 26% 22% 10% 10%
Wind Production Tax Credit (PTC), $/MWh
If construction begins in…
2016 (100% PTC) $ 23.0 $ 23.0 $ 23.0 $ 23.0 $ 23.0
2017 (80% PTC) $ 19.2 $ 19.2 $ 19.2 $ 19.2 $ 19.2
2018 (60% PTC) $ 14.4 $ 14.4 $ 14.4 $ 14.4 $ 14.4
2019 (40% PTC) $ 9.6 $ 9.6 $ 9.6 $ 9.6 $ 9.6
2020 $ - $ - $ - $ -
2021 $ - $ - $ -
*PTC is subject to annual inflation adjustment
Tax credit by COD yearCurrent law - no change under
Tax reform

54
26 states today have programs in place
Energy Efficiency Goals Aim to Change the Rate of Demand Growth
Energy Efficiency Goal Map
Source: DSIRE, www.dsireusa.org
Often thought of as a low cost way to lower emissions, states have more actively embraced targets to lower the rate of power demand growth.

Power Plants and Generation

56
0
500,000
1,000,000
1,500,000
2,000,000
2,500,000
3,000,000
3,500,000
4,000,000
4,500,000
19
49
19
51
19
53
19
55
19
57
19
59
19
61
19
63
19
65
19
67
19
69
19
71
19
73
19
75
19
77
19
79
19
81
19
83
19
85
19
87
19
89
19
91
19
93
19
95
19
97
19
99
20
01
20
03
20
05
20
07
20
09
20
11
20
13
20
15
20
17
Net
Genera
tion
(Million k
Wh)
Coal Gas Nuclear Hydro Oil Renewables (Solar, Wind, Geothermal, Biomass) Other Nonrenewable
0%
10%
20%
30%
40%
50%
60%
70%
80%
90%
100%
19
49
19
51
19
53
19
55
19
57
19
59
19
61
19
63
19
65
19
67
19
69
19
71
19
73
19
75
19
77
19
79
19
81
19
83
19
85
19
87
19
89
19
91
19
93
19
95
19
97
19
99
20
01
20
03
20
05
20
07
20
09
20
11
20
13
20
15
20
17
% o
f Tota
l N
et
Genera
tion
Coal Gas Nuclear Hydro Oil Renewables (Solar, Wind, Geothermal, Biomass) Other Nonrenewable
The US Power Supply Is Evolving (1949-2017)
Natural gas and renewables are taking share while oil and coal have lost
Total US Generation (1949 – 2016) % of Total US Generation (1949 – 2016)
Source: EIA
The growth in US power demand over 60 years has been significant, notwithstanding the weakness since 2008.
Coal generation was a significant driver in power generation from 1950-1995 but has subsequently faded and lost market share on a relative basis.
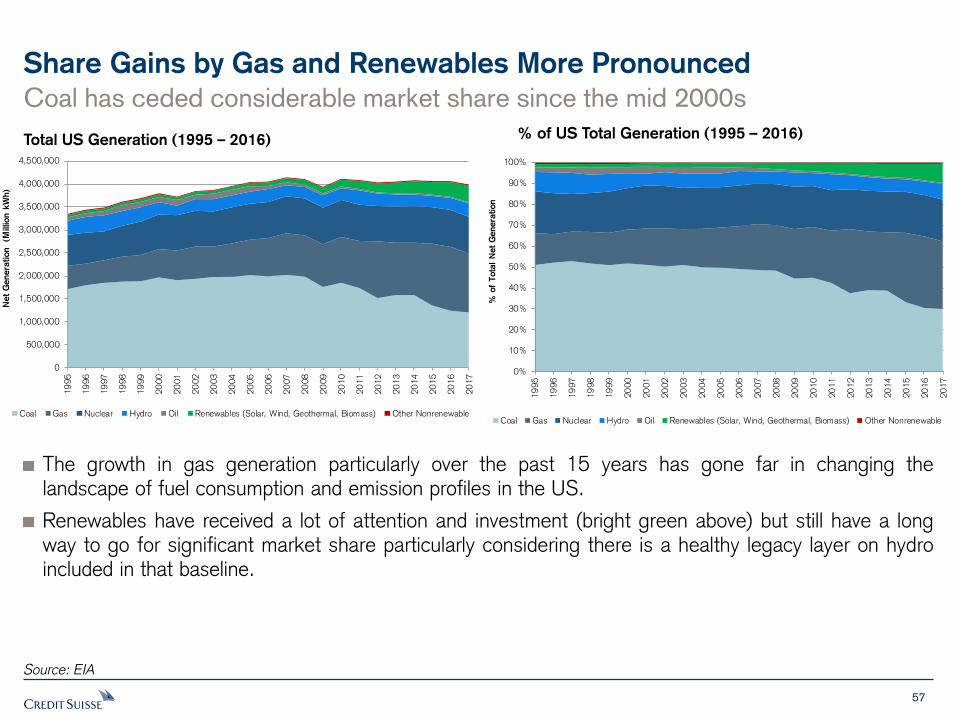
57
0
500,000
1,000,000
1,500,000
2,000,000
2,500,000
3,000,000
3,500,000
4,000,000
4,500,000
19
95
19
96
19
97
19
98
19
99
20
00
20
01
20
02
20
03
20
04
20
05
20
06
20
07
20
08
20
09
20
10
20
11
20
12
20
13
20
14
20
15
20
16
20
17
Net
Genera
tion
(Million k
Wh)
Coal Gas Nuclear Hydro Oil Renewables (Solar, Wind, Geothermal, Biomass) Other Nonrenewable
Share Gains by Gas and Renewables More Pronounced
Coal has ceded considerable market share since the mid 2000s
Total US Generation (1995 – 2016) % of US Total Generation (1995 – 2016)
Source: EIA
The growth in gas generation particularly over the past 15 years has gone far in changing the landscape of fuel consumption and emission profiles in the US.
Renewables have received a lot of attention and investment (bright green above) but still have a long way to go for significant market share particularly considering there is a healthy legacy layer on hydro included in that baseline.
0%
10%
20%
30%
40%
50%
60%
70%
80%
90%
100%
19
95
19
96
19
97
19
98
19
99
20
00
20
01
20
02
20
03
20
04
20
05
20
06
20
07
20
08
20
09
20
10
20
11
20
12
20
13
20
14
20
15
20
16
20
17
% o
f Tota
l N
et
Genera
tion
Coal Gas Nuclear Hydro Oil Renewables (Solar, Wind, Geothermal, Biomass) Other Nonrenewable

58
New capacity additions since 2000 have been significantly driven by new gas generation capacity originally led by (a) the advancement of the combined cycle gas turbine (CCGT) power plant that was over 30% more efficient than simple gas plants (b) EPA’s implementation of rules limiting coal plant emissions of NOX/SOX and eventually mercury made the CCGTs even more attractive relative to the initial coal plant remediation costs and (c) the introduction of competitive power markets defaulted to developers building the new CCGT technology where they saw lower capital costs and a perceived cost advantage relative to coal plants.
The 5-year extension of federal tax credits for wind and solar in Dec 2015 have driven investment in these two resources in 2015 /16. Renewables made up approximately half of new additions in 2017 as cost curves continue to decline, we expect renewables growth to continue in 2018 followed by a new leg in the 2020s particularly in combination with battery storage as materials costs continue to decline for both , resolving intermittency issues.
-
10,000
20,000
30,000
40,000
50,000
60,000
70,000
19
95
19
96
19
97
19
98
19
99
20
00
20
01
20
02
20
03
20
04
20
05
20
06
20
07
20
08
20
09
20
10
20
11
20
12
20
13
20
14
20
15
20
16
20
17
New
Capacity (
MW
)
Coal Gas Nuclear GeothermalBiomass Wind Solar OilOther Nonrenewable Water
Capacity Additions Strongly Favor Gas and Increasingly Renewables
Technological advances dramatically boosted share gains for gas generation
New Generation Additions
'95-'99 '00-'04 '05-09 '10-14 '15-17 TOTAL
Biomass 827 556 1,145 2,003 599 5,130
Coal 3,483 1,292 5,582 13,778 2 24,136
Gas 24,146 198,247 53,019 45,148 24,401 344,962
Geothermal 101 86 304 287 137 915
Nuclear 1,179 - - - 1,270 2,449
Oil 1,130 1,946 756 987 115 4,935
Other Non-renewable 961 178 339 887 341 2,705
Solar 2 13 353 10,185 16,422 26,974
Water 1,527 613 151 1,293 711 4,296
Wind 918 3,900 27,022 29,579 23,822 85,241
Source: SNL

59
Levelized cost of entry (LCOE) is the overall measure of the competitiveness of the generating technology, reflecting the complete cost of electricity from new resources (which are higher than where we see forward power prices clearing today in competitive markets).
We should note that the LCOEs are changing fairly rapidly, particularly with efficiency improvements in both wind and PV solar causing those cost curves to decline and for natural gas generation (the CC plants) given the abundance of low cost natural gas in the US.
Gas generation remains the low cost option for newbuild
Newbuild Generation Has a Wide Range of Delivered Power Costs
Levelized Cost of New Entry (LCOE) for New-Build in the US
Source: EIA, NREL, Credit Suisse Estimates, Company Data

60
0
20
40
60
80
100
120
20
13
20
15
20
17
20
19
20
21
20
23
20
25
20
27
20
29
20
31
20
33
20
35
20
37
20
39
20
41
20
43
20
45
20
47
20
49
20
51
20
53
20
55
20
57
20
59
20
61
20
63
20
65
20
67
20
69
20
71
20
73
20
75
GW
s o
f A
vailable
Capacity
80yr Life 80yr Life (ex small units) 60yr Life
60yr Life (ex small units) 50yr Life 50yr Life (ex small units)
The zero carbon, low(er) cost baseload resource but they’re getting old
Nuclear Power Plant
Source: Tennessee Valley Authority, http://www.green-planet-solar-energy.com, EEI, SNL, Credit Suisse estimates
Nuclear Power Plant
Nuclear Power Plant – How It Works
Operating Costs & Other Stats
Cost Derivataion
Nuclear Fuel Cost ($/MWh) $6.5 - 8.0
O&M ($/MWh) $18.0 - 20.0
Maintenance Capex ($/MWh) $5.0 - 7.0
Total Cost ($/MWh) $29.5 - 35.0
Other Stats
Utilization 88%
CO2 Emission 0
Nuclear Retirements

61
Best days are in the past; EPA rules and cheap gas will sustain shrinkage
Coal Power Plant
Source: Tennessee Valley Authority, Credit Suisse estimates
Coal Power Plant
Coal Power Plant – How It Works
Operating Costs & Other Stats
Cost Derivataion CAPP Coal
Fuel Cost
Coal Costs $55
Delivery Costs $20
All-in Costs ($/ton) $75
Heat Content (MMBtu/lb) 12.5
Coal Cost ($/MMBtu) $3.00
Coal Plant Heat Rate 9.5
Total Fuel Cost ($/MWh) $28.50
O&M ($/MWh) $8.00
Environmental ($/MWh) $3.44
Total Cost ($/MWh) $39.94
Other Stats
Utilization 57%
CO2 Emission (lbs/MMBtu) 205
CO2 Emission (lbs/MWh) 1,948

62
The default newbuild conventional power plant option
Natural Gas Power Plant
Source: Tennessee Valley Authority, Credit Suisse estimates
Natural Gas Power Plant
Natural Gas Power Plant – How It Works
Operating Costs & Other Stats
0
10
20
30
40
50
60
70
19
95
19
96
19
97
19
98
19
99
20
00
20
01
20
02
20
03
20
04
20
05
20
06
20
07
20
08
20
09
20
10
20
11
20
12
20
13
20
14
New
Capacity (
GW
)
Gas Capacity Additions
Cost Derivataion NYMEX Gas
Fuel Cost
Gas ($/ MMBtu) $2.75
Delivery Costs ($/ MMBtu) $0.50
Gas Costs ($/MMBtu) $3.25
Gas Plant Heat Rate 7.5
Total Fuel Cost ($/MWh) $24.38
O&M ($/MWh) $4.50
Total Cost ($/MWh) $28.88
Other Stats
Utilization (Peakers) 2 - 20%
Utilization (CCGTs) 55 - 85%
CO2 Emission (lbs/MMBtu) 117
CO2 Emission (lbs/MWh) 878

63
The original renewable but hard to imagine newbuild in the US
Hydro Power Plant
Source: Tennessee Valley Authority, https://www.nwcouncil.org, EIA, Credit Suisse estimates
Hydro Power Plant
Hydro Power Plant – How It Works
Operating Costs & Other Stats
Cost Derivataion
Fuel Cost ($/MWh) $6.0
O&M ($/MWh) $4.0
Total Cost ($/MWh) $10.00
Other Stats
Utilization 42%
CO2 Emission 0
Share of Hydropower in State’s Total Capacity

64
The growth story for renewables over past 15 years; total costs are competitive
Wind Power Plant
Source: NextEra Energy, http://www.yokogawa.com, SNL, AWEA, Credit Suisse estimates
Wind Power Plant
Wind Power Plant – How It Works
Operating Costs & Other Stats
Cost Derivataion
Fuel Cost ($/MWh) $0.0
O&M ($/MWh) $13.0
Total Cost ($/MWh) $13.00
Other Stats
Utilization 30 -60%
CO2 Emission 0
Annual Wind Capacity Additions
-
2,000
4,000
6,000
8,000
10,000
12,000
14,000
19
96
19
97
19
98
19
99
20
00
20
01
20
02
20
03
20
04
20
05
20
06
20
07
20
08
20
09
20
10
20
11
20
12
20
13
20
14
20
15
New
Capacity (
MW
)

65
Solar is the next wave of renewable growth with falling costs and load alignment
Solar Power Plant
Source: http://esarenewables.com/, http://www.solarsol.com/typography, Credit Suisse estimates
Solar Power Plant
Photovoltaic (PV) Solar – How It Works
Operating Costs & Other Stats
Cost Derivataion
Fuel Cost ($/MWh) $0.0
O&M ($/MWh) $11.0
Total Cost ($/MWh) $11.00
Other Stats
Utilization 15 - 25%
CO2 Emission 0
Levelized Cost of New Entry for Solar
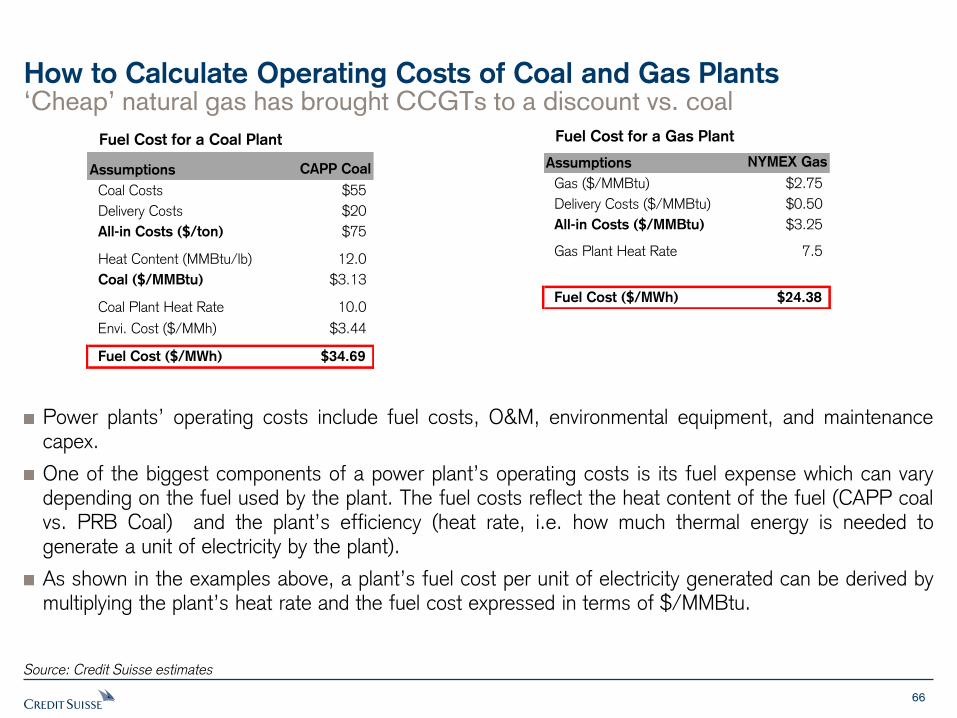
66
‘Cheap’ natural gas has brought CCGTs to a discount vs. coal
How to Calculate Operating Costs of Coal and Gas Plants
Source: Credit Suisse estimates
Power plants’ operating costs include fuel costs, O&M, environmental equipment, and maintenance capex.
One of the biggest components of a power plant’s operating costs is its fuel expense which can vary depending on the fuel used by the plant. The fuel costs reflect the heat content of the fuel (CAPP coal vs. PRB Coal) and the plant’s efficiency (heat rate, i.e. how much thermal energy is needed to generate a unit of electricity by the plant).
As shown in the examples above, a plant’s fuel cost per unit of electricity generated can be derived by multiplying the plant’s heat rate and the fuel cost expressed in terms of $/MMBtu.
Fuel Cost for a Coal Plant Fuel Cost for a Gas Plant
Assumptions CAPP Coal
Coal Costs $55
Delivery Costs $20
All-in Costs ($/ton) $75
Heat Content (MMBtu/lb) 12.0
Coal ($/MMBtu) $3.13
Coal Plant Heat Rate 10.0
Envi. Cost ($/MMh) $3.44
Fuel Cost ($/MWh) $34.69
Assumptions NYMEX Gas
Gas ($/MMBtu) $2.75
Delivery Costs ($/MMBtu) $0.50
All-in Costs ($/MMBtu) $3.25
Gas Plant Heat Rate 7.5
Fuel Cost ($/MWh) $24.38

67
Coal to Gas Switching Floor
Source: SNL
Northern App Central App Ill. Basin Rockies PRB
Avg. Btu/lb 13,000 12,500 11,800 11,500 8,800
Sulfur (%) 2.00% 1.00% 3.00% 0.60% 0.33%
SO2 (Lb/MMBtu) 3.1 1.6 5.1 1.0 0.8
Coal market price ($/ton) 46.04 60.79 32.86 41.24 12.26
Estimated shipping costs ($/ton) 18.00 25.00 10.00 22.50 22.50
Cost of coal delivered ($/ton) 64.04 85.79 42.86 63.74 34.76
Sulfur Dioxide (SO2)
Avg. SO2 (LB per ton) 80.00 40.00 120.00 24.00 13.20
Allowance price per ton of SO2 1.73 1.73 1.73 1.73 1.73
Cost of SO2 per ton of coal 0.07 0.03 0.10 0.02 0.01
Cost of SO2 per MMBTU 0.003 0.001 0.004 0.001 0.001
MMBtu per ton of coal 26.00 25.00 23.60 23.00 17.60
MWh @ selected heat rate 2.48 2.38 2.25 2.19 1.68
Total coal cost per MMBtu before NOx 2.47 3.43 1.82 2.77 1.98
Nitrogen Oxide (NOx)
NOx Rate of marginal coal generation (Lb/MMBTU) 0.15 0.15 0.15 0.15 0.15
NOx allowance price ($/ton) 2.08 2.08 2.08 2.08 2.08
Cost of NOx per Ton of Coal ($/ton) 0.00 0.00 0.00 0.00 0.00
Cost of NOx per MMBTU 0.000 0.000 0.000 0.000 0.000
Total/all-in cost of coal ($/ton) 64.11 85.83 42.97 63.76 34.77
Estimated additional plant O&M ($/MWh) 1.50 1.50 1.50 1.50 1.50
Total marginal cost per MWh from coal ($/MWh) 27.39 37.55 20.62 30.61 22.25
Total coal cost per MMBtu ($/MMBtu) 2.47 3.43 1.82 2.77 1.98
Efficiency adjustment vs. CCGT power plant (%) 40% 40% 40% 40% 40%
Floor on natural gas ($/MMBtu) - efficiency adjusted 3.60 4.95 2.69 4.02 2.91
Sample Comparison to Nat Gas 5.93 5.93 2.94 2.52 2.68
Tetco M-3 Tetco M-3 Chicago Kern River SoCal Border
This data is based on spot pricing for which gas-power is now significantly cheaper than coal-power in most basins, a factor driving down near-term marginal value for coal plants.
The ‘floor’ on natural gas price above is the equivalent all-in cost of coal per MMBtu to produce a MWh, below which a coal plant is uneconomic to run on a marginal basis, i.e., daily dispatch.

Disclosures

Companies Mentioned (Price as of 09-Apr-2018)
ALLETE (ALE.N, $71.86) Ameren (AEE.N, $56.96) American Electric Power (AEP.N, $68.71) American Water Works (AWK.N, $82.14) Black Hills Corp (BKH.N, $53.64) CMS Energy Corp (CMS.N, $45.1) Consolidated Edison (ED.N, $78.46) DTE Energy (DTE.N, $104.34) Dominion Energy (D.N, $66.37) Duke Energy (DUK.N, $78.47) Dynegy Corporation (DYN.N, $12.81) Edison International (EIX.N, $63.46) El Paso Electric (EE.N, $50.05) Entergy Corp (ETR.N, $78.96) Eversource Energy (ES.N, $59.71) Exelon Corporation (EXC.N, $38.59) FirstEnergy Corp (FE.N, $34.14) Gt Plains Energy (GXP.N, $30.97) NextEra Energy Inc. (NEE.N, $162.13) NorthWestern Energy (NWE.N, $53.82) OGE Energy (OGE.N, $32.07) PG&E Corp. (PCG.N, $44.43) PNM Resources (PNM.N, $37.85) Portland Gen Ele (POR.N, $40.18) Public Service Enterprise Group (PEG.N, $50.31) SCANA (SCG.N, $37.1) Sempra USA (SRE.N, $111.78) Southern Company (SO.N, $44.77) Spire Inc. (SR.N, $72.85) WEC Energy (WEC.N, $62.64) Westar Energy (WR.N, $51.49) Xcel Energy (XEL.N, $51.49)
Disclosure Appendix
Analyst Certification
Michael Weinstein, ERP, and Maheep Mandloi each certify, with respect to the companies or securities that the individual analyzes, that (1) the views expressed in this report accurately reflect his or her personal views about all of the subject companies and securities and (2) no part of his or her compensation was, is or will be directly or indirectly related to the specific recommendations or views expressed in this report.
The analyst(s) responsible for preparing this research report received Compensation that is based upon various factors including Credit Suisse's total revenues, a portion of which are generated by Credit Suisse's investment banking activities
As of December 10, 2012 Analysts’ stock rating are defined as follows:
Outperform (O) : The stock’s total return is expected to outperform the relevant benchmark* over the next 12 months.
Neutral (N) : The stock’s total return is expected to be in line with the relevant benchmark* over the next 12 months.
Underperform (U) : The stock’s total return is expected to underperform the relevant benchmark* over the next 12 months.
*Relevant benchmark by region: As of 10th December 2012, Japanese ratings are based on a stock’s total re turn relative to the analyst's coverage universe which consists of all companies covered by the analyst within the relevant sector, with Outperforms representing the most attractiv e, Neutrals the less attractive, and Underperforms the least attractive investment opportunities. As of 2nd October 2012, U.S. and Canadian as well as European ratings are based on a stock’s total retu rn relative to the analyst's coverage universe which consists of all companies covered by the analyst within the relevant sector , with Outperforms representing the most attractive, Neutrals the less attractive, and Underperforms the least attractive investment opportunities. For Latin American and Asia stocks (excluding Japan and Australia), ratings are based on a stock’s total return relative to the average total return of the relevant country or regional benchmark (India - S&P BSE Sensex Index); prior to 2nd October 2012 U.S. and Canadian ratings were based on (1) a stock’s absolute total return potential to its curren t share price and (2) the relative attractiveness of a stock’s total return potential within an analyst’s coverage universe. For Australian and New Zealand stoc ks, the expected total return (ETR) calculation includes 12-month rolling dividend yield. An Outperform rating is assigned where an ETR is greater than or equal to 7.5%; Underperform where an ETR less than or equal to 5%. A Neutral may be assigned where the ETR is between -5% and 15%. The overlapping rating range allows analysts to assign a rating that puts ETR in the context of associated risks. Prior to 18 May 2015, ETR ranges for Outperform and Underperform ratings did not overlap wit h Neutral thresholds between 15% and 7.5%, which was in operation from 7 July 2011.
Restricted (R) : In certain circumstances, Credit Suisse policy and/or applicable law and regulations preclude certain types of communications, including an investment recommendation, during the course of Credit Suisse's engagement in an investment banking transaction and in certain other circumstances.
Not Rated (NR) : Credit Suisse Equity Research does not have an investment rating or view on the stock or any other securities related to the company at this time.
Not Covered (NC) : Credit Suisse Equity Research does not provide ongoing coverage of the company or offer an investment rating or investment view on the equity security of the company or related products.
Volatility Indicator [V] : A stock is defined as volatile if the stock price has moved up or down by 20% or more in a month in at least 8 of the past 24 months or the analyst expects significant volatility going forward.
Analysts’ sector weightings are distinct from analysts’ stock ratings and are based on the analyst’s expectations for the fundamentals and/or valuation of the sector* relative to the group’s historic fundamentals and/or valuation:
Overweight : The analyst’s expectation for the sector’s fundamentals and/or valuation is favorable over the next 12 months.
Market Weight : The analyst’s expectation for the sector’s fundamentals and/or valuation is neutral over the next 12 months.
Underweight : The analyst’s expectation for the sector’s fundamentals and/or valuation is cautious over the next 12 months.
*An analyst’s coverage sector consists of all companies covered by the analyst within the relevant sector. An analyst may cover multiple sectors.
Credit Suisse's distribution of stock ratings (and banking clients) is:
Global Ratings Distribution
Rating Versus universe (%) Of which banking clients (%)
Outperform/Buy* 48% (61% banking clients)
Neutral/Hold* 37% (56% banking clients)
Underperform/Sell* 13% (54% banking clients)
Restricted 2%
*For purposes of the NYSE and FINRA ratings distribution disclosure requirements, our stock ratings of Outperform, Neutral, a nd Underperform most closely correspond to Buy, Hold, and Sell, respectively; however, the meanings are not the same, as our stock ratings are determined on a relative basis. (Please refer to definitions above.) An investor's decision to buy or sell a security should be based on investment objectives, current holdings, and other individual factors.
Important Global Disclosures
Credit Suisse’s research reports are made available to clients through our proprietary research portal on CS PLUS. Credit Suisse research products may also be made available through third-party vendors or alternate electronic means as a convenience. Certain research products are only made available through CS PLUS. The services provided by Credit Suisse’s analysts to clients may depend on a specific client’s preferences regarding the frequency and manner of receiving communications, the client’s risk profile and investment, the size and scope of the overall client relationship with the Firm, as well as legal and regulatory constraints. To access all of Credit Suisse’s research that you are entitled to receive in the most timely manner, please contact your sales representative or go to https://plus.credit-suisse.com .
Credit Suisse’s policy is to update research reports as it deems appropriate, based on developments with the subject company, the sector or the market that may have a material impact on the research views or opinions stated herein.
Credit Suisse's policy is only to publish investment research that is impartial, independent, clear, fair and not misleading. For more detail please refer to Credit Suisse's Policies for Managing Conflicts of Interest in connection with Investment Research: https://www.credit-suisse.com/sites/disclaimers-ib/en/managing-conflicts.html .
Credit Suisse does not provide any tax advice. Any statement herein regarding any US federal tax is not intended or written to be used, and cannot be used, by any taxpayer for the purposes of avoiding any penalties.
Credit Suisse has decided not to enter into business relationships with companies that Credit Suisse has determined to be involved in the development, manufacture, or acquisition of anti-personnel mines and cluster munitions. For Credit Suisse's position on the issue, please see https://www.credit-suisse.com/media/assets/corporate/docs/about-us/responsibility/banking/policy-summaries-en.pdf .
For date and time of production, dissemination and history of recommendation for the subject company(ies) featured in this report, disseminated within the past 12 months, please refer to the link: https://rave.credit-suisse.com/disclosures/view/report?i=356497&v=-1vhx8rrn0wisuffnnww8cvxjp .
Important Regional Disclosures
Singapore recipients should contact Credit Suisse AG, Singapore Branch for any matters arising from this research report.
The analyst(s) involved in the preparation of this report may participate in events hosted by the subject company, including site visits. Credit Suisse does not accept or permit analysts to accept payment or reimbursement for travel expenses associated with these events.
Restrictions on certain Canadian securities are indicated by the following abbreviations: NVS--Non-Voting shares; RVS--Restricted Voting Shares; SVS--Subordinate Voting Shares.
Individuals receiving this report from a Canadian investment dealer that is not affiliated with Credit Suisse should be advised that this report may not contain regulatory disclosures the non-affiliated Canadian investment dealer would be required to make if this were its own report.
For Credit Suisse Securities (Canada), Inc.'s policies and procedures regarding the dissemination of equity research, please visit https://www.credit-suisse.com/sites/disclaimers-ib/en/canada-research-policy.html.
Principal is not guaranteed in the case of equities because equity prices are variable.
Commission is the commission rate or the amount agreed with a customer when setting up an account or at any time after that.
This research report is authored by:
Credit Suisse Securities (USA) LLC ..................................................... Michael Weinstein, ERP ; Khanh Nguyen, CFA ; Maheep Mandloi ; Aric Li
Important disclosures regarding companies that are the subject of this report are available by calling +1 (877) 291-2683. The same important disclosures, with the exception of valuation methodology and risk discussions, are also available on Credit Suisse’s disclosure website at https://rave.credit-suisse.com/disclosures . For valuation methodology and risks associated with any recommendation, price target, or rating referenced in this report, please refer to the disclosures section of the most recent report regarding the subject company.

This report is produced by subsidiaries and affiliates of Credit Suisse operating under its Global Markets Division. For more information on our structure, please use the following link: https://www.credit-suisse.com/who-we-are This report may contain material that is not directed to, or intended for distribution to or use by, any person or entity who is a citizen or resident of or located in any locality, state, country or other jurisdiction where such distribution, publication, availability or use would be contrary to law or regulation or which would subject Credit Suisse or its affiliates ("CS") to any registration or licensing requirement within such jurisdiction. All material presented in this report, unless specifically indicated otherwise, is under copyright to CS. None of the material, nor its content, nor any copy of it, may be altered in any way, transmitted to, copied or distributed to any other party, without the prior express written permission of CS. All trademarks, service marks and logos used in this report are trademarks or service marks or registered trademarks or service marks of CS or its affiliates.The information, tools and material presented in this report are provided to you for information purposes only and are not to be used or considered as an offer or the solicitation of an offer to sell or to buy or subscribe for securities or other financial instruments. CS may not have taken any steps to ensure that the securities referred to in this report are suitable for any particular investor. CS will not treat recipients of this report as its customers by virtue of their receiving this report. The investments and services contained or referred to in this report may not be suitable for you and it is recommended that you consult an independent investment advisor if you are in doubt about such investments or investment services. Nothing in this report constitutes investment, legal, accounting or tax advice, or a representation that any investment or strategy is suitable or appropriate to your individual circumstances, or otherwise constitutes a personal recommendation to you. CS does not advise on the tax consequences of investments and you are advised to contact an independent tax adviser. Please note in particular that the bases and levels of taxation may change. Information and opinions presented in this report have been obtained or derived from sources believed by CS to be reliable, but CS makes no representation as to their accuracy or completeness. CS accepts no liability for loss arising from the use of the material presented in this report, except that this exclusion of liability does not apply to the extent that such liability arises under specific statutes or regulations applicable to CS. This report is not to be relied upon in substitution for the exercise of independent judgment. CS may have issued, and may in the future issue, other communications that are inconsistent with, and reach different conclusions from, the information presented in this report. Those communications reflect the different assumptions, views and analytical methods of the analysts who prepared them and CS is under no obligation to ensure that such other communications are brought to the attention of any recipient of this report. Some investments referred to in this report will be offered solely by a single entity and in the case of some investments solely by CS, or an associate of CS or CS may be the only market maker in such investments. Past performance should not be taken as an indication or guarantee of future performance, and no representation or warranty, express or implied, is made regarding future performance. Information, opinions and estimates contained in this report reflect a judgment at its original date of publication by CS and are subject to change without notice. The price, value of and income from any of the securities or financial instruments mentioned in this report can fall as well as rise. The value of securities and financial instruments is subject to exchange rate fluctuation that may have a positive or adverse effect on the price or income of such securities or financial instruments. Investors in securities such as ADR's, the values of which are influenced by currency volatility, effectively assume this risk. Structured securities are complex instruments, typically involve a high degree of risk and are intended for sale only to sophisticated investors who are capable of understanding and assuming the risks involved. The market value of any structured security may be affected by changes in economic, financial and political factors (including, but not limited to, spot and forward interest and exchange rates), time to maturity, market conditions and volatility, and the credit quality of any issuer or reference issuer. Any investor interested in purchasing a structured product should conduct their own investigation and analysis of the product and consult with their own professional advisers as to the risks involved in making such a purchase. Some investments discussed in this report may have a high level of volatility. High volatility investments may experience sudden and large falls in their value causing losses when that investment is realised. Those losses may equal your original investment. Indeed, in the case of some investments the potential losses may exceed the amount of initial investment and, in such circumstances, you may be required to pay more money to support those losses. Income yields from investments may fluctuate and, in consequence, initial capital paid to make the investment may be used as part of that income yield. Some investments may not be readily realisable and it may be difficult to sell or realise those investments, similarly it may prove difficult for you to obtain reliable information about the value, or risks, to which such an investment is exposed. This report may provide the addresses of, or contain hyperlinks to, websites. Except to the extent to which the report refers to website material of CS, CS has not reviewed any such site and takes no responsibility for the content contained therein. Such address or hyperlink (including addresses or hyperlinks to CS's own website material) is provided solely for your convenience and information and the content of any such website does not in any way form part of this document. Accessing such website or following such link through this report or CS's website shall be at your own risk.
This report is issued and distributed in European Union (except Switzerland): by Credit Suisse Securities (Europe) Limited, One Cabot Square, London E14 4QJ, England, which is authorised by the Prudential Regulation Authority and regulated by the Financial Conduct Authority and the Prudential Regulation Authority. Germany: Credit Suisse (Deutschland) Aktiengesellschaft regulated by the Bundesanstalt fuer Finanzdienstleistungsaufsicht ("BaFin"). United States and Canada: Credit Suisse Securities (USA) LLC; Switzerland: Credit Suisse AG; Brazil: Banco de Investimentos Credit Suisse (Brasil) S.A or its affiliates; Mexico: Banco Credit Suisse (México), S.A. (transactions related to the securities mentioned in this report will only be effected in compliance with applicable regulation); Japan: by Credit Suisse Securities (Japan) Limited, Financial Instruments Firm, Director-General of Kanto Local Finance Bureau ( Kinsho) No. 66, a member of Japan Securities Dealers Association, The Financial Futures Association of Japan, Japan Investment Advisers Association, Type II Financial Instruments Firms Association; Hong Kong: Credit Suisse (Hong Kong) Limited; Australia: Credit Suisse Equities (Australia) Limited; Thailand: Credit Suisse Securities (Thailand) Limited, regulated by the Office of the Securities and Exchange Commission, Thailand, having registered address at 990 Abdulrahim Place, 27th Floor, Unit 2701, Rama IV Road, Silom, Bangrak, Bangkok10500, Thailand, Tel. +66 2614 6000; Malaysia: Credit Suisse Securities (Malaysia) Sdn Bhd; Singapore: Credit Suisse AG, Singapore Branch; India: Credit Suisse Securities (India) Private Limited (CIN no.U67120MH1996PTC104392) regulated by the Securities and Exchange Board of India as Research Analyst (registration no. INH 000001030) and as Stock Broker (registration no. INB230970637; INF230970637; INB010970631; INF010970631), having registered address at 9th Floor, Ceejay House, Dr.A.B. Road, Worli, Mumbai - 18, India, T- +91-22 6777 3777; South Korea: Credit Suisse Securities (Europe) Limited, Seoul Branch; Taiwan: Credit Suisse AG Taipei Securities Branch; Indonesia: PT Credit Suisse Sekuritas Indonesia; Philippines:Credit Suisse Securities (Philippines ) Inc., and elsewhere in the world by the relevant authorised affiliate of the above. Additional Regional Disclaimers Hong Kong: Credit Suisse (Hong Kong) Limited ("CSHK") is licensed and regulated by the Securities and Futures Commission of Hong Kong under the laws of Hong Kong, which differ from Australian laws. CSHKL does not hold an Australian financial services licence (AFSL) and is exempt from the requirement to hold an AFSL under the Corporations Act 2001 (the Act) under Class Order 03/1103 published by the ASIC in respect of financial services provided to Australian wholesale clients (within the meaning of section 761G of the Act). Research on Taiwanese securities produced by Credit Suisse AG, Taipei Securities Branch has been prepared by a registered Senior Business Person. Australia (to the extent services are offered in Australia): Credit Suisse Securities (Europe) Limited (“CSSEL”) and Credit Suisse International (“CSI”) are authorised by the Prudential Regulation Authority and regulated by the Financial Conduct Authority (“FCA”) and the Prudential Regulation Authority under UK laws, which differ from Australian Laws. CSSEL and CSI do not hold an Australian Financial Services Licence (“AFSL”) and are exempt from the requirement to hold an AFSL under the Corporations Act (Cth) 2001 (“Corporations Act”) under Class Order 03/1099 published by the Australian Securities and Investments Commission (“ASIC”), in respect of the financial services provided to Australian wholesale clients (within the meaning of section 761G of the Corporations Act). This material is not for distribution to retail clients and is directed exclusively at Credit Suisse's professional clients and eligible counterparties as defined by the FCA, and wholesale clients as defined under section 761G of the Corporations Act. Credit Suisse (Hong Kong) Limited (“CSHK”) is licensed and regulated by the Securities and Futures Commission of Hong Kong under the laws of Hong Kong, which differ from Australian laws. CSHKL does not hold an AFSL and is exempt from the requirement to hold an AFSL under the Corporations Act under Class Order 03/1103 published by the ASIC in respect of financial services provided to Australian wholesale clients (within the meaning of section 761G of the Corporations Act). Credit Suisse Securities (USA) LLC (CSSU) and Credit Suisse Asset Management LLC (CSAM LLC) are licensed and regulated by the Securities Exchange Commission of the United States under the laws of the United States, which differ from Australian laws. CSSU and CSAM LLC do not hold an AFSL and is exempt from the requirement to hold an AFSL under the Corporations Act under Class Order 03/1100 published by the ASIC in respect of financial services provided to Australian wholesale clients (within the meaning of section 761G of the Corporations Act). Malaysia: Research provided to residents of Malaysia is authorised by the Head of Research for Credit Suisse Securities (Malaysia) Sdn Bhd, to whom they should direct any queries on +603 2723 2020. Singapore: This report has been prepared and issued for distribution in Singapore to institutional investors, accredited investors and expert investors (each as defined under the Financial Advisers Regulations) only, and is also distributed by Credit Suisse AG, Singapore Branch to overseas investors (as defined under the Financial Advisers Regulations). Credit Suisse AG, Singapore Branch may distribute reports produced by its foreign entities or affiliates pursuant to an arrangement under Regulation 32C of the Financial Advisers Regulations. Singapore recipients should contact Credit Suisse AG, Singapore Branch at +65-6212-2000 for matters arising from, or in connection with, this report. By virtue of your status as an institutional investor, accredited investor, expert investor or overseas investor, Credit Suisse AG, Singapore Branch is exempted from complying with certain compliance requirements under the Financial Advisers Act, Chapter 110 of Singapore (the “FAA”), the Financial Advisers Regulations and the relevant Notices and Guidelines issued thereunder, in respect of any financial advisory service which Credit Suisse AG, Singapore Branch may provide to you. UAE: This information is being distributed by Credit Suisse AG (DIFC Branch), duly licensed and regulated by the Dubai Financial Services Authority (“DFSA”). Related financial services or products are only made available to Professional Clients or Market Counterparties, as defined by the DFSA, and are not intended for any other persons. Credit Suisse AG (DIFC Branch) is located on Level 9 East, The Gate Building, DIFC, Dubai, United Arab Emirates. EU: This report has been produced by subsidiaries and affiliates of Credit Suisse operating under its Global Markets Division In jurisdictions where CS is not already registered or licensed to trade in securities, transactions will only be effected in accordance with applicable securities legislation, which will vary from jurisdiction to jurisdiction and may require that the trade be made in accordance with applicable exemptions from registration or licensing requirements. This material is issued and distributed in the U.S. by CSSU, a member of NYSE, FINRA, SIPC and the NFA, and CSSU accepts responsibility for its contents. Clients should contact analysts and execute transactions through a Credit Suisse subsidiary or affiliate in their home jurisdiction unless governing law permits otherwise. Please note that this research was originally prepared and issued by CS for distribution to their market professional and institutional investor customers. Recipients who are not market professional or institutional investor customers of CS should seek the advice of their independent financial advisor prior to taking any investment decision based on this report or for any necessary explanation of its contents. This research may relate to investments or services of a person outside of the UK or to other matters which are not authorised by the Prudential Regulation Authority and regulated by the Financial Conduct Authority and the Prudential Regulation Authority or in respect of which the protections of the Prudential Regulation Authority and Financial Conduct Authority for private customers and/or the UK compensation scheme may not be available, and further details as to where this may be the case are available upon request in respect of this report. CS may provide various services to US municipal entities or obligated persons ("municipalities"), including suggesting individual transactions or trades and entering into such transactions. Any services CS provides to municipalities are not viewed as "advice" within the meaning of Section 975 of the Dodd-Frank Wall Street Reform and Consumer Protection Act. CS is providing any such services and related information solely on an arm's length basis and not as an advisor or fiduciary to the municipality. In connection with the provision of the any such services, there is no agreement, direct or indirect, between any municipality (including the officials,management, employees or agents thereof) and CS for CS to provide advice to the municipality. Municipalities should consult with their financial, accounting and legal advisors regarding any such services provided by CS. In addition, CS is not acting for direct or indirect compensation to solicit the municipality on behalf of an unaffiliated broker, dealer, municipal securities dealer, municipal advisor, or investment adviser for the purpose of obtaining or retaining an engagement by the municipality for or in connection with Municipal Financial Products, the issuance of municipal securities, or of an investment adviser to provide investment advisory services to or on behalf of the municipality. If this report is being distributed by a financial institution other than Credit Suisse AG, or its affiliates, that financial institution is solely responsible for distribution. Clients of that institution should contact that institution to effect a transaction in the securities mentioned in this report or require further information. This report does not constitute investment advice by Credit Suisse to the clients of the distributing financial institution, and neither Credit Suisse AG, its affiliates, and their respective officers, directors and employees accept any liability whatsoever for any direct or consequential loss arising from their use of this report or its content. Principal is not guaranteed. Commission is the commission rate or the amount agreed with a customer when setting up an account or at any time after that. No information or communication provided herein or otherwise is intended to be, or should be construed as, a recommendation within the meaning of the US Department of Labor’s final regulation defining "investment advice" for purposes of the Employee Retirement Income Security Act of 1974, as amended and Section 4975 of the Internal Revenue Code of 1986, as amended, and the information provided herein is intended to be general information, and should not be construed as, providing investment advice (impartial or otherwise).
Copyright © 2018 CREDIT SUISSE AG and/or its affiliates. All rights reserved.
Investment principal on bonds can be eroded depending on sale price or market price. In addition, there are bonds on which investment principal can be eroded due to changes in redemption amounts. Care is required when investing in such instruments


